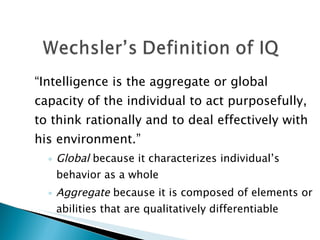
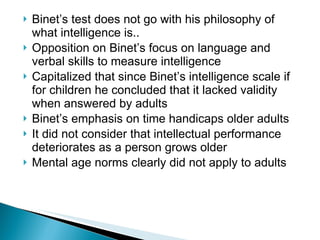
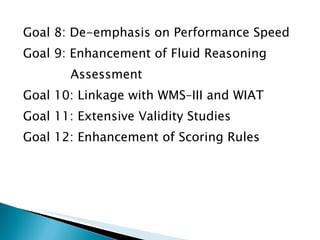
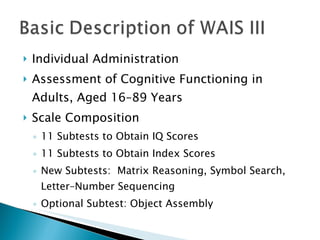
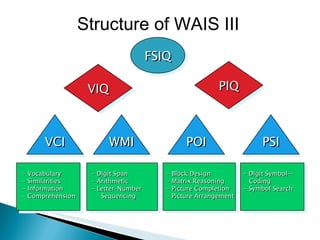
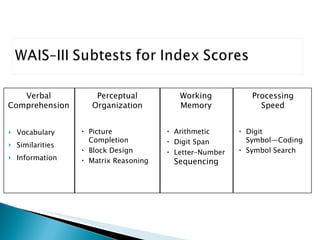
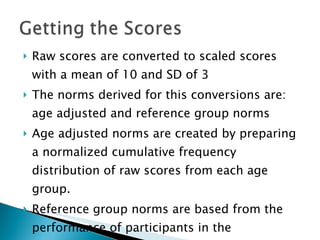
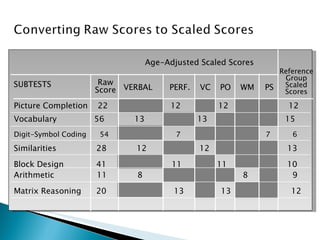
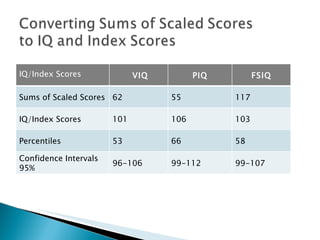
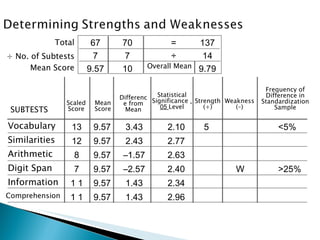
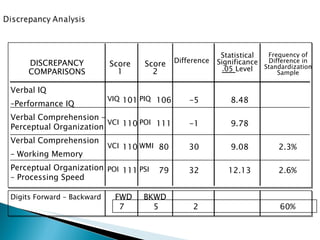
Wechsler Intelligence Scale Third Edition  “  The global capacity to act purposefully, to think rationally, and to deal effectively with one's environment”
“ Intelligence is the aggregate or global capacity of the individual to act purposefully, to think rationally and to deal effectively with his environment.”  Global  because it characterizes individual’s  behavior as a whole Aggregate  because it is composed of elements or abilities that are qualitatively differentiable
Why did Wechsler create his own test if Binet already made one?
Binet’s test does not go with his philosophy of what intelligence is.. Opposition on Binet’s focus on language and verbal skills to measure intelligence Capitalized that since Binet’s intelligence scale if for children he concluded that it lacked validity when answered by adults Binet’s emphasis on time handicaps older adults It did not consider that intellectual performance deteriorates as a person grows older Mental age norms clearly did not apply to adults
Goal 1: Continuity and Familiarity Goal 2: Updating of Norms Goal 3: Extension of Age Range Goal 4: Age-Corrected Norms Goal 5: Improved Item Content Goal 6: Improved Stimulus Materials Goal 7: Improved Diagnostic and Descriptive  Utility
Goal 8: De-emphasis on Performance Speed Goal 9: Enhancement of Fluid Reasoning  Assessment Goal 10: Linkage with WMS–III and WIAT Goal 11: Extensive Validity Studies Goal 12: Enhancement of Scoring Rules
Individual Administration Assessment of Cognitive Functioning in Adults, Aged 16–89 Years Scale Composition 11 Subtests to Obtain IQ Scores 11 Subtests to Obtain Index Scores New Subtests:  Matrix Reasoning, Symbol Search, Letter–Number Sequencing Optional Subtest: Object Assembly
Age Sex Race/Ethnicity  Education Level Geographic Region 6
16–17 18–19 20–24 25–29 30–34 35–44 45-54 55–64 65–69 70–74 75–79 80–84 85– 89 WAIS –III 200 200 200 200 200 200 200 200 200 200 200 150 100  WMS –III 100 100 100 100 100 100 100 100 100 100 100 75 75 45–54
 
Credits or points are assigned to each item An individual receives a specific amount of credit for each item passed unlike Binet This scale makes it easier to group items of particular content together The test yielded not just an overall score but also a score for each individual ability in a variety of content area
A measure for nonverbal intelligence Individual’s comparison of verbal and non-verbal intelligence Used to overcome biases in language, culture and educational background. Provides clinician an opportunity to observe behavior in standard setting because performance test requires longer interval of sustained effort, concentration and attention than verbal tasks
 
Structure of WAIS III FSIQ - Digit Span - Arithmetic - Letter–Number Sequencing - Vocabulary - Similarities - Information - Comprehension - Digit Symbol—  Coding - Symbol Search - Block Design - Matrix Reasoning - Picture Completion - Picture Arrangement VIQ PIQ VCI WMI POI PSI
Verbal Scales - consists of subsets that requires verbal  response Performance Scales - consists of subsets that require the  individual to respond by performing  such as pointing to a missing detail
Vocabulary Similarities Arithmetic Digit span Information Comprehension Letter-number sequencing
Is the ability to define words The most stable measure of intelligence Individuals that show deterioration because of emotional or brain damage shows that the vocabulary subtests to be the last one affected. Mild concentration difficulties that lower optimal performance do not affect vocabulary until they become severe. Used to evaluate premorbid intelligence in some cases Measures the degree to which one has learned, been able to comprehend and verbally express vocabulary 
Consists of 15 paired items of increasing difficulty Easier items just need responses from previously learned associations i.e. ( How is bread and water alike?) while difficult items require abstract thinking as they are already dissimilar objects i.e. (how is an ant and rose alike?) Character of person’s thought processes is seen  in many cases i.e. (schizophrenic giving idiosyncratic concepts) Measures abstract verbal reasoning
Contains 15 relatively simple problems Retaining figures in memory while manipulating it is the challenge Sample of ninth most difficult question: “ A person with $28 spends $.50, how much does he have left?” The main aspect measured is concentration, memory and reasoning
Requires the subject to repeat digits, given at the rate of one per second, forward and backward. Measures short-term auditory memory Some non intellective factors that might influence the results are anxiety Measures attention, concentration and mental control 
Measure subject range of knowledge Factors that tends to influence the test scores are subjects curiosity and acquisition of knowledge, alertness to environment and alertness to cultural opportunities.
Asks three type of questions: - What should be done in a given situation - Provision of a logical explanation for a rule  or phenomenon - Definition of proverbs Measures judgment and common sense Emotional  difficulties may affect the score of a subject
One of the newest of WAIS III subtest Not required to obtain verbal IQ score Made up of seven items in which subject is asked to reorder lists of numbers and letters. It measures working memory and attention
Picture completion Digit symbol-coding Block design Matrix reasoning Picture arrangement Object assembly Symbol search
Subject is shown a picture wherein some important detail is missing while timed Visual discrimination is measured Some factors that may affect the score are visual-perceptual difficulties or environmental awareness
Subjects are given 120  seconds to copy numbers from 1-9 each paired with a symbol as much as they can Measures visual-motor dexterity, degree of persistence, speed of performance and ability to learn an unfamiliar task Age, inadequate visual acuity and motor capabilities may affect the results
Materials used are nine variously colored blocks and a booklet with specific geometric design or configuration Subject must arrange the block in increasingly difficult designs Measures nonverbal concept formation, abstract thinking and neurocognitive impairment
Enhances WAIS III assessment of fluid intelligence Subject is presented with a nonverbal, figural stimuli and is tasked on finding a pattern or relationship between the stimuli Measures abstract reasoning, information processing and fluid intelligence
Requires subjects to notice relevant details, cause and effect relationships. The test consists of 11 items, which consists of related pictures similar to comic strips, the subject must arrange the pictures in the right order to tell a story Measures nonverbal reasoning ability and interpretation of social situations
Consists of puzzles that the subject have to put together as quickly as possible Measures visual assembly and its coordination with simple assembly skills
Subject is shown two geometric figures. The task is then to search from among a set of 5 additional search figures and determine whether the target appears in the search group. There are 60 items for which they are given 120 sec. It measures cognitive processing abilities
FSIQ, VIQ, PIQ and Index Scores
Obtained by summing the age-corrected scaled scores of the verbal subtests with the performance subtests and comparing the subject to the standardization sample
Raw scores from the 5 performance scores are converted to scaled scores PIQ is obtained by summing the age-corrected scaled scores on the performance subtests and comparing it with the standardization sample
VIQ is obtained by summing the age-corrected scaled scores on the verbal subtests and comparing it with the standardization sample
Vocabulary Similarities  Information Arithmetic Digit Span Letter–Number  Sequencing Picture Completion  Block Design Matrix Reasoning Digit Symbol—Coding Symbol Search Verbal Comprehension Perceptual Organization Working Memory Processing Speed
Measures acquired knowledge and verbal reasoning (crystallize intelligence) “ Purer” measure for verbal IQ because of  exclusion of arithmetic and digit span test
Measures Fluid Intelligence Factors that influence performance are attentiveness to details and visual motor integration
Measures  the ability to actively hold information in the mind needed to do complex tasks such as reasoning, comprehension and learning
Measures How fast your mind works
Standardization, Validity and Reliability
Consisted of 2450 adults divided into 13 age groups from 16-17 through 85-59 then the sample is stratified according to gender, race, education and geographic region.
Split Half method used on all subtests except speeded test Average coefficients are .98 FSIQ, .97 VIQ and .94 PIQ Test retest coefficients are .95 FSIQ, .94 VIQ and .88 PIQ Standard error of measurements are 2.29 FSIQ, 2.50 VIQ and 3.75 PIQ 95% confidence interval i.e. ( 95% with a 110 IQ score has a true score between 105.42 and 114.58 and only 5% do not.
It rests on its correlation with the earlier WAIS-R and WISC-III (where the ages overlap) WAIS III correlate with the third edition of WISC with .94 VIQ, .86 PIQ and .93 FSIQ.
Verbal and Performance Comparisons Pattern Analysis
Provides a measure of nonverbal intelligence in conjunction with verbal intelligence i.e. Subject has VIQ of 55 but has PIQ of 100 even though the FSIQ falls into 70 it doesn't mean the individual is retarded rather the difference might be attributed to environmental variables (language, cultural and educational factors)
Evaluation of relatively large differences between subtest scaled scores As stated earlier different factors might affect the performance of the subject in a subtest thus using pattern analysis this factors can be isolated.
Raw scores are converted to scaled scores with a mean of 10 and SD of 3 The norms derived for this conversions are: age adjusted and reference group norms Age adjusted norms are created by preparing a normalized cumulative frequency distribution of raw scores from each age group. Reference group norms are based from the performance of participants in the  standardization sample
SUBTESTS Raw Score VERBAL PERF. VC PO WM PS Reference Group Scaled Scores Age-Adjusted Scaled Scores Picture Completion  22  12  12  12  Vocabulary  56  13  13  15 Digit-Symbol Coding  54  7  7  6 Similarities  28  12  12  13  Block Design  41  11  11  10 Arithmetic  11   8  8   9 Matrix Reasoning  20 13   13  12
IQ/Index Scores VIQ PIQ FSIQ Sums of Scaled Scores 62 55 117 IQ/Index Scores 101 106 103 Percentiles 53 66 58 Confidence Intervals 95% 96-106 99-112 99-107
13 9.57 3.43 2.10 5 <5% 12 9.57 2.43 2.77 8 9.57 –1.57 2.63 7 9.57 –2.57 2.40 W >25% 1 1 9.57 1.43 2.34 1 1 9.57 1.43 2.96 SUBTESTS Scaled Score Vocabulary Similarities Arithmetic Digit Span Information Mean Score Difference from Mean Statistical Significance  .05   Level Strength (+) Weakness (–) Frequency of Difference in Standardization Sample Total ÷ No. of Subtests Mean Score 67 70 = 137 7 7 ÷ 14 9.57 10 9.79 Overall Mean Comprehension
101 106 -5 8.48 110 111 -1 9.78 110 80 30 9.08 2.3% 111 79 32 12.13 2.6% DISCREPANCY COMPARISONS Verbal IQ  – Performance IQ Verbal Comprehension – Perceptual Organization Verbal Comprehension  –  Working Memory Perceptual Organization – Processing Speed Score 1 Score 2 Difference Statistical Significance  .05  Level Frequency of Difference in Standardization Sample VIQ PIQ VCI POI VCI WMI POI PSI Digits Forward – Backward 7 5 2 60% FWD BKWD

W A I S I I I

  • 1.
    Wechsler Intelligence ScaleThird Edition “ The global capacity to act purposefully, to think rationally, and to deal effectively with one's environment”
  • 2.
    “ Intelligence isthe aggregate or global capacity of the individual to act purposefully, to think rationally and to deal effectively with his environment.” Global because it characterizes individual’s behavior as a whole Aggregate because it is composed of elements or abilities that are qualitatively differentiable
  • 3.
    Why did Wechslercreate his own test if Binet already made one?
  • 4.
    Binet’s test doesnot go with his philosophy of what intelligence is.. Opposition on Binet’s focus on language and verbal skills to measure intelligence Capitalized that since Binet’s intelligence scale if for children he concluded that it lacked validity when answered by adults Binet’s emphasis on time handicaps older adults It did not consider that intellectual performance deteriorates as a person grows older Mental age norms clearly did not apply to adults
  • 5.
    Goal 1: Continuityand Familiarity Goal 2: Updating of Norms Goal 3: Extension of Age Range Goal 4: Age-Corrected Norms Goal 5: Improved Item Content Goal 6: Improved Stimulus Materials Goal 7: Improved Diagnostic and Descriptive Utility
  • 6.
    Goal 8: De-emphasison Performance Speed Goal 9: Enhancement of Fluid Reasoning Assessment Goal 10: Linkage with WMS–III and WIAT Goal 11: Extensive Validity Studies Goal 12: Enhancement of Scoring Rules
  • 7.
    Individual Administration Assessmentof Cognitive Functioning in Adults, Aged 16–89 Years Scale Composition 11 Subtests to Obtain IQ Scores 11 Subtests to Obtain Index Scores New Subtests: Matrix Reasoning, Symbol Search, Letter–Number Sequencing Optional Subtest: Object Assembly
  • 8.
    Age Sex Race/Ethnicity Education Level Geographic Region 6
  • 9.
    16–17 18–19 20–2425–29 30–34 35–44 45-54 55–64 65–69 70–74 75–79 80–84 85– 89 WAIS –III 200 200 200 200 200 200 200 200 200 200 200 150 100 WMS –III 100 100 100 100 100 100 100 100 100 100 100 75 75 45–54
  • 10.
  • 11.
    Credits or pointsare assigned to each item An individual receives a specific amount of credit for each item passed unlike Binet This scale makes it easier to group items of particular content together The test yielded not just an overall score but also a score for each individual ability in a variety of content area
  • 12.
    A measure fornonverbal intelligence Individual’s comparison of verbal and non-verbal intelligence Used to overcome biases in language, culture and educational background. Provides clinician an opportunity to observe behavior in standard setting because performance test requires longer interval of sustained effort, concentration and attention than verbal tasks
  • 13.
  • 14.
    Structure of WAISIII FSIQ - Digit Span - Arithmetic - Letter–Number Sequencing - Vocabulary - Similarities - Information - Comprehension - Digit Symbol— Coding - Symbol Search - Block Design - Matrix Reasoning - Picture Completion - Picture Arrangement VIQ PIQ VCI WMI POI PSI
  • 15.
    Verbal Scales -consists of subsets that requires verbal response Performance Scales - consists of subsets that require the individual to respond by performing such as pointing to a missing detail
  • 16.
    Vocabulary Similarities ArithmeticDigit span Information Comprehension Letter-number sequencing
  • 17.
    Is the abilityto define words The most stable measure of intelligence Individuals that show deterioration because of emotional or brain damage shows that the vocabulary subtests to be the last one affected. Mild concentration difficulties that lower optimal performance do not affect vocabulary until they become severe. Used to evaluate premorbid intelligence in some cases Measures the degree to which one has learned, been able to comprehend and verbally express vocabulary 
  • 18.
    Consists of 15paired items of increasing difficulty Easier items just need responses from previously learned associations i.e. ( How is bread and water alike?) while difficult items require abstract thinking as they are already dissimilar objects i.e. (how is an ant and rose alike?) Character of person’s thought processes is seen in many cases i.e. (schizophrenic giving idiosyncratic concepts) Measures abstract verbal reasoning
  • 19.
    Contains 15 relativelysimple problems Retaining figures in memory while manipulating it is the challenge Sample of ninth most difficult question: “ A person with $28 spends $.50, how much does he have left?” The main aspect measured is concentration, memory and reasoning
  • 20.
    Requires the subjectto repeat digits, given at the rate of one per second, forward and backward. Measures short-term auditory memory Some non intellective factors that might influence the results are anxiety Measures attention, concentration and mental control 
  • 21.
    Measure subject rangeof knowledge Factors that tends to influence the test scores are subjects curiosity and acquisition of knowledge, alertness to environment and alertness to cultural opportunities.
  • 22.
    Asks three typeof questions: - What should be done in a given situation - Provision of a logical explanation for a rule or phenomenon - Definition of proverbs Measures judgment and common sense Emotional difficulties may affect the score of a subject
  • 23.
    One of thenewest of WAIS III subtest Not required to obtain verbal IQ score Made up of seven items in which subject is asked to reorder lists of numbers and letters. It measures working memory and attention
  • 24.
    Picture completion Digitsymbol-coding Block design Matrix reasoning Picture arrangement Object assembly Symbol search
  • 25.
    Subject is showna picture wherein some important detail is missing while timed Visual discrimination is measured Some factors that may affect the score are visual-perceptual difficulties or environmental awareness
  • 26.
    Subjects are given120 seconds to copy numbers from 1-9 each paired with a symbol as much as they can Measures visual-motor dexterity, degree of persistence, speed of performance and ability to learn an unfamiliar task Age, inadequate visual acuity and motor capabilities may affect the results
  • 27.
    Materials used arenine variously colored blocks and a booklet with specific geometric design or configuration Subject must arrange the block in increasingly difficult designs Measures nonverbal concept formation, abstract thinking and neurocognitive impairment
  • 28.
    Enhances WAIS IIIassessment of fluid intelligence Subject is presented with a nonverbal, figural stimuli and is tasked on finding a pattern or relationship between the stimuli Measures abstract reasoning, information processing and fluid intelligence
  • 29.
    Requires subjects tonotice relevant details, cause and effect relationships. The test consists of 11 items, which consists of related pictures similar to comic strips, the subject must arrange the pictures in the right order to tell a story Measures nonverbal reasoning ability and interpretation of social situations
  • 30.
    Consists of puzzlesthat the subject have to put together as quickly as possible Measures visual assembly and its coordination with simple assembly skills
  • 31.
    Subject is showntwo geometric figures. The task is then to search from among a set of 5 additional search figures and determine whether the target appears in the search group. There are 60 items for which they are given 120 sec. It measures cognitive processing abilities
  • 32.
    FSIQ, VIQ, PIQand Index Scores
  • 33.
    Obtained by summingthe age-corrected scaled scores of the verbal subtests with the performance subtests and comparing the subject to the standardization sample
  • 34.
    Raw scores fromthe 5 performance scores are converted to scaled scores PIQ is obtained by summing the age-corrected scaled scores on the performance subtests and comparing it with the standardization sample
  • 35.
    VIQ is obtainedby summing the age-corrected scaled scores on the verbal subtests and comparing it with the standardization sample
  • 36.
    Vocabulary Similarities Information Arithmetic Digit Span Letter–Number Sequencing Picture Completion Block Design Matrix Reasoning Digit Symbol—Coding Symbol Search Verbal Comprehension Perceptual Organization Working Memory Processing Speed
  • 37.
    Measures acquired knowledgeand verbal reasoning (crystallize intelligence) “ Purer” measure for verbal IQ because of exclusion of arithmetic and digit span test
  • 38.
    Measures Fluid IntelligenceFactors that influence performance are attentiveness to details and visual motor integration
  • 39.
    Measures  the abilityto actively hold information in the mind needed to do complex tasks such as reasoning, comprehension and learning
  • 40.
    Measures How fastyour mind works
  • 41.
  • 42.
    Consisted of 2450adults divided into 13 age groups from 16-17 through 85-59 then the sample is stratified according to gender, race, education and geographic region.
  • 43.
    Split Half methodused on all subtests except speeded test Average coefficients are .98 FSIQ, .97 VIQ and .94 PIQ Test retest coefficients are .95 FSIQ, .94 VIQ and .88 PIQ Standard error of measurements are 2.29 FSIQ, 2.50 VIQ and 3.75 PIQ 95% confidence interval i.e. ( 95% with a 110 IQ score has a true score between 105.42 and 114.58 and only 5% do not.
  • 44.
    It rests onits correlation with the earlier WAIS-R and WISC-III (where the ages overlap) WAIS III correlate with the third edition of WISC with .94 VIQ, .86 PIQ and .93 FSIQ.
  • 45.
    Verbal and PerformanceComparisons Pattern Analysis
  • 46.
    Provides a measureof nonverbal intelligence in conjunction with verbal intelligence i.e. Subject has VIQ of 55 but has PIQ of 100 even though the FSIQ falls into 70 it doesn't mean the individual is retarded rather the difference might be attributed to environmental variables (language, cultural and educational factors)
  • 47.
    Evaluation of relativelylarge differences between subtest scaled scores As stated earlier different factors might affect the performance of the subject in a subtest thus using pattern analysis this factors can be isolated.
  • 48.
    Raw scores areconverted to scaled scores with a mean of 10 and SD of 3 The norms derived for this conversions are: age adjusted and reference group norms Age adjusted norms are created by preparing a normalized cumulative frequency distribution of raw scores from each age group. Reference group norms are based from the performance of participants in the standardization sample
  • 49.
    SUBTESTS Raw ScoreVERBAL PERF. VC PO WM PS Reference Group Scaled Scores Age-Adjusted Scaled Scores Picture Completion 22 12 12 12 Vocabulary 56 13 13 15 Digit-Symbol Coding 54 7 7 6 Similarities 28 12 12 13 Block Design 41 11 11 10 Arithmetic 11 8 8 9 Matrix Reasoning 20 13 13 12
  • 50.
    IQ/Index Scores VIQPIQ FSIQ Sums of Scaled Scores 62 55 117 IQ/Index Scores 101 106 103 Percentiles 53 66 58 Confidence Intervals 95% 96-106 99-112 99-107
  • 51.
    13 9.57 3.432.10 5 <5% 12 9.57 2.43 2.77 8 9.57 –1.57 2.63 7 9.57 –2.57 2.40 W >25% 1 1 9.57 1.43 2.34 1 1 9.57 1.43 2.96 SUBTESTS Scaled Score Vocabulary Similarities Arithmetic Digit Span Information Mean Score Difference from Mean Statistical Significance .05 Level Strength (+) Weakness (–) Frequency of Difference in Standardization Sample Total ÷ No. of Subtests Mean Score 67 70 = 137 7 7 ÷ 14 9.57 10 9.79 Overall Mean Comprehension
  • 52.
    101 106 -58.48 110 111 -1 9.78 110 80 30 9.08 2.3% 111 79 32 12.13 2.6% DISCREPANCY COMPARISONS Verbal IQ – Performance IQ Verbal Comprehension – Perceptual Organization Verbal Comprehension – Working Memory Perceptual Organization – Processing Speed Score 1 Score 2 Difference Statistical Significance .05 Level Frequency of Difference in Standardization Sample VIQ PIQ VCI POI VCI WMI POI PSI Digits Forward – Backward 7 5 2 60% FWD BKWD