1. The document discusses Wilhelm Weber's 19th century explanation that a potential difference between two points in an electric circuit is due to a difference in surface charge densities on the conductors. Surface charges accumulate where conductivity changes, like at the interface of a resistor and conductor.
2. It recommends teaching students about surface charges and their relationship to potential difference before introducing the quantitative definition of voltage as energy per unit charge. Examples and demonstrations are needed to illustrate surface charge distributions.
3. Instructions are provided for teaching key concepts like charge, Coulomb's law, how batteries produce surface charges, and how surface charges behave in closed circuits and curved conductors to produce electric fields. Analogies to water pressure differences are suggested
Key terms related to Current Electricity . Class XII (12) Physics for IIT-JEE, NEET, Engineering , Medical , 11th, 12th and I. Sc. . Student Easy to understand and use for own development.
Electric Charge and Electric Field LectureFroyd Wess
More: http://www.pinoybix.org
Lesson Objectives:
Static Electricity; Electric Charge and Its Conservation
Electric Charge in the Atom
Insulators and Conductors
Induced Charge; the Electroscope
Coulomb’s Law
Solving Problems Involving Coulomb’s Law and Vectors
The Electric Field
Field Lines
Electric Fields and Conductors
Gauss’s Law
Electric Forces in Molecular Biology: DNA Structure and Replication
Photocopy Machines and Computer Printers Use Electrostatics
Key terms relates to Electrostatic . Class XII (12) Phyiscs for IIT-JEE, NEET, Engineering , Medical , 11th, 12th and I. Sc. Student Easy to understand and use for own development.
Learning Objectives
Define electric charge, and describe how the two types of charge interact.
Desribe three common situations that generate static electricity. State the law of conservation of charge.
Describe three methods for charging an object.
State Coulomb’s law
Describe an electric field diagram of a positive point charge; of a negative point charge with twice the magnitude of positive charge
Draw the electric field lines between two points of the same charge; between two points of opposite charge.
Thank you So much
Cancer cell metabolism: special Reference to Lactate PathwayAADYARAJPANDEY1
Normal Cell Metabolism:
Cellular respiration describes the series of steps that cells use to break down sugar and other chemicals to get the energy we need to function.
Energy is stored in the bonds of glucose and when glucose is broken down, much of that energy is released.
Cell utilize energy in the form of ATP.
The first step of respiration is called glycolysis. In a series of steps, glycolysis breaks glucose into two smaller molecules - a chemical called pyruvate. A small amount of ATP is formed during this process.
Most healthy cells continue the breakdown in a second process, called the Kreb's cycle. The Kreb's cycle allows cells to “burn” the pyruvates made in glycolysis to get more ATP.
The last step in the breakdown of glucose is called oxidative phosphorylation (Ox-Phos).
It takes place in specialized cell structures called mitochondria. This process produces a large amount of ATP. Importantly, cells need oxygen to complete oxidative phosphorylation.
If a cell completes only glycolysis, only 2 molecules of ATP are made per glucose. However, if the cell completes the entire respiration process (glycolysis - Kreb's - oxidative phosphorylation), about 36 molecules of ATP are created, giving it much more energy to use.
IN CANCER CELL:
Unlike healthy cells that "burn" the entire molecule of sugar to capture a large amount of energy as ATP, cancer cells are wasteful.
Cancer cells only partially break down sugar molecules. They overuse the first step of respiration, glycolysis. They frequently do not complete the second step, oxidative phosphorylation.
This results in only 2 molecules of ATP per each glucose molecule instead of the 36 or so ATPs healthy cells gain. As a result, cancer cells need to use a lot more sugar molecules to get enough energy to survive.
introduction to WARBERG PHENOMENA:
WARBURG EFFECT Usually, cancer cells are highly glycolytic (glucose addiction) and take up more glucose than do normal cells from outside.
Otto Heinrich Warburg (; 8 October 1883 – 1 August 1970) In 1931 was awarded the Nobel Prize in Physiology for his "discovery of the nature and mode of action of the respiratory enzyme.
WARNBURG EFFECT : cancer cells under aerobic (well-oxygenated) conditions to metabolize glucose to lactate (aerobic glycolysis) is known as the Warburg effect. Warburg made the observation that tumor slices consume glucose and secrete lactate at a higher rate than normal tissues.
Deep Behavioral Phenotyping in Systems Neuroscience for Functional Atlasing a...Ana Luísa Pinho
Functional Magnetic Resonance Imaging (fMRI) provides means to characterize brain activations in response to behavior. However, cognitive neuroscience has been limited to group-level effects referring to the performance of specific tasks. To obtain the functional profile of elementary cognitive mechanisms, the combination of brain responses to many tasks is required. Yet, to date, both structural atlases and parcellation-based activations do not fully account for cognitive function and still present several limitations. Further, they do not adapt overall to individual characteristics. In this talk, I will give an account of deep-behavioral phenotyping strategies, namely data-driven methods in large task-fMRI datasets, to optimize functional brain-data collection and improve inference of effects-of-interest related to mental processes. Key to this approach is the employment of fast multi-functional paradigms rich on features that can be well parametrized and, consequently, facilitate the creation of psycho-physiological constructs to be modelled with imaging data. Particular emphasis will be given to music stimuli when studying high-order cognitive mechanisms, due to their ecological nature and quality to enable complex behavior compounded by discrete entities. I will also discuss how deep-behavioral phenotyping and individualized models applied to neuroimaging data can better account for the subject-specific organization of domain-general cognitive systems in the human brain. Finally, the accumulation of functional brain signatures brings the possibility to clarify relationships among tasks and create a univocal link between brain systems and mental functions through: (1) the development of ontologies proposing an organization of cognitive processes; and (2) brain-network taxonomies describing functional specialization. To this end, tools to improve commensurability in cognitive science are necessary, such as public repositories, ontology-based platforms and automated meta-analysis tools. I will thus discuss some brain-atlasing resources currently under development, and their applicability in cognitive as well as clinical neuroscience.
Richard's entangled aventures in wonderlandRichard Gill
Since the loophole-free Bell experiments of 2020 and the Nobel prizes in physics of 2022, critics of Bell's work have retreated to the fortress of super-determinism. Now, super-determinism is a derogatory word - it just means "determinism". Palmer, Hance and Hossenfelder argue that quantum mechanics and determinism are not incompatible, using a sophisticated mathematical construction based on a subtle thinning of allowed states and measurements in quantum mechanics, such that what is left appears to make Bell's argument fail, without altering the empirical predictions of quantum mechanics. I think however that it is a smoke screen, and the slogan "lost in math" comes to my mind. I will discuss some other recent disproofs of Bell's theorem using the language of causality based on causal graphs. Causal thinking is also central to law and justice. I will mention surprising connections to my work on serial killer nurse cases, in particular the Dutch case of Lucia de Berk and the current UK case of Lucy Letby.
Earliest Galaxies in the JADES Origins Field: Luminosity Function and Cosmic ...Sérgio Sacani
We characterize the earliest galaxy population in the JADES Origins Field (JOF), the deepest
imaging field observed with JWST. We make use of the ancillary Hubble optical images (5 filters
spanning 0.4−0.9µm) and novel JWST images with 14 filters spanning 0.8−5µm, including 7 mediumband filters, and reaching total exposure times of up to 46 hours per filter. We combine all our data
at > 2.3µm to construct an ultradeep image, reaching as deep as ≈ 31.4 AB mag in the stack and
30.3-31.0 AB mag (5σ, r = 0.1” circular aperture) in individual filters. We measure photometric
redshifts and use robust selection criteria to identify a sample of eight galaxy candidates at redshifts
z = 11.5 − 15. These objects show compact half-light radii of R1/2 ∼ 50 − 200pc, stellar masses of
M⋆ ∼ 107−108M⊙, and star-formation rates of SFR ∼ 0.1−1 M⊙ yr−1
. Our search finds no candidates
at 15 < z < 20, placing upper limits at these redshifts. We develop a forward modeling approach to
infer the properties of the evolving luminosity function without binning in redshift or luminosity that
marginalizes over the photometric redshift uncertainty of our candidate galaxies and incorporates the
impact of non-detections. We find a z = 12 luminosity function in good agreement with prior results,
and that the luminosity function normalization and UV luminosity density decline by a factor of ∼ 2.5
from z = 12 to z = 14. We discuss the possible implications of our results in the context of theoretical
models for evolution of the dark matter halo mass function.
Professional air quality monitoring systems provide immediate, on-site data for analysis, compliance, and decision-making.
Monitor common gases, weather parameters, particulates.
Slide 1: Title Slide
Extrachromosomal Inheritance
Slide 2: Introduction to Extrachromosomal Inheritance
Definition: Extrachromosomal inheritance refers to the transmission of genetic material that is not found within the nucleus.
Key Components: Involves genes located in mitochondria, chloroplasts, and plasmids.
Slide 3: Mitochondrial Inheritance
Mitochondria: Organelles responsible for energy production.
Mitochondrial DNA (mtDNA): Circular DNA molecule found in mitochondria.
Inheritance Pattern: Maternally inherited, meaning it is passed from mothers to all their offspring.
Diseases: Examples include Leber’s hereditary optic neuropathy (LHON) and mitochondrial myopathy.
Slide 4: Chloroplast Inheritance
Chloroplasts: Organelles responsible for photosynthesis in plants.
Chloroplast DNA (cpDNA): Circular DNA molecule found in chloroplasts.
Inheritance Pattern: Often maternally inherited in most plants, but can vary in some species.
Examples: Variegation in plants, where leaf color patterns are determined by chloroplast DNA.
Slide 5: Plasmid Inheritance
Plasmids: Small, circular DNA molecules found in bacteria and some eukaryotes.
Features: Can carry antibiotic resistance genes and can be transferred between cells through processes like conjugation.
Significance: Important in biotechnology for gene cloning and genetic engineering.
Slide 6: Mechanisms of Extrachromosomal Inheritance
Non-Mendelian Patterns: Do not follow Mendel’s laws of inheritance.
Cytoplasmic Segregation: During cell division, organelles like mitochondria and chloroplasts are randomly distributed to daughter cells.
Heteroplasmy: Presence of more than one type of organellar genome within a cell, leading to variation in expression.
Slide 7: Examples of Extrachromosomal Inheritance
Four O’clock Plant (Mirabilis jalapa): Shows variegated leaves due to different cpDNA in leaf cells.
Petite Mutants in Yeast: Result from mutations in mitochondrial DNA affecting respiration.
Slide 8: Importance of Extrachromosomal Inheritance
Evolution: Provides insight into the evolution of eukaryotic cells.
Medicine: Understanding mitochondrial inheritance helps in diagnosing and treating mitochondrial diseases.
Agriculture: Chloroplast inheritance can be used in plant breeding and genetic modification.
Slide 9: Recent Research and Advances
Gene Editing: Techniques like CRISPR-Cas9 are being used to edit mitochondrial and chloroplast DNA.
Therapies: Development of mitochondrial replacement therapy (MRT) for preventing mitochondrial diseases.
Slide 10: Conclusion
Summary: Extrachromosomal inheritance involves the transmission of genetic material outside the nucleus and plays a crucial role in genetics, medicine, and biotechnology.
Future Directions: Continued research and technological advancements hold promise for new treatments and applications.
Slide 11: Questions and Discussion
Invite Audience: Open the floor for any questions or further discussion on the topic.
(May 29th, 2024) Advancements in Intravital Microscopy- Insights for Preclini...Scintica Instrumentation
Intravital microscopy (IVM) is a powerful tool utilized to study cellular behavior over time and space in vivo. Much of our understanding of cell biology has been accomplished using various in vitro and ex vivo methods; however, these studies do not necessarily reflect the natural dynamics of biological processes. Unlike traditional cell culture or fixed tissue imaging, IVM allows for the ultra-fast high-resolution imaging of cellular processes over time and space and were studied in its natural environment. Real-time visualization of biological processes in the context of an intact organism helps maintain physiological relevance and provide insights into the progression of disease, response to treatments or developmental processes.
In this webinar we give an overview of advanced applications of the IVM system in preclinical research. IVIM technology is a provider of all-in-one intravital microscopy systems and solutions optimized for in vivo imaging of live animal models at sub-micron resolution. The system’s unique features and user-friendly software enables researchers to probe fast dynamic biological processes such as immune cell tracking, cell-cell interaction as well as vascularization and tumor metastasis with exceptional detail. This webinar will also give an overview of IVM being utilized in drug development, offering a view into the intricate interaction between drugs/nanoparticles and tissues in vivo and allows for the evaluation of therapeutic intervention in a variety of tissues and organs. This interdisciplinary collaboration continues to drive the advancements of novel therapeutic strategies.
In silico drugs analogue design: novobiocin analogues.pptx
Voltage pd n
1. 1
Voltage and Surface Charges
What Wilhelm Weber already knew 150 years ago
This article was originally published in the German Journal
„Praxis der Naturwissenschaften-Physik“ (PdN-PhiS_2012_5_S_25-31)
Translation: Hermann Härtel
(Figures improved by PdN - PhiS)
Abstract
The abstract definition of electric power as "the ability of a voltage source to do work“ or quan-
titatively as "energy per unit charge" is preceded by a qualitative description in terms of the ex-
istence of surface charges. These surface charges and the associated electric fields can be
demonstrated experimentally and allow a causal explanation of the processes and laws to be un-
derstood and learned.
1. Potential difference - one of the more difficult terms
Electric current is usually described qualitatively as being due to drifting electrons. However, a
corresponding qualitative description for the terms "voltage" or "potential difference" is rarely
found in textbooks. Voltage is described as the capacity of an electrical energy source to do
work and quantitatively defined as energy per charge.
From a physical perspective there is nothing wrong with this mathematically elegant descrip-
tion, but it fails to provide a causal explanation for the processes inside electrical circuits.
As an illustration of the difficulty we can ask some simple questions.
In figure 1, what kind of difference in physical state (on a microscopic level) between points A
and B of a voltage source is responsible for the existence of a potential difference?
Fig. 1. What difference exists between the conductors at A and B?
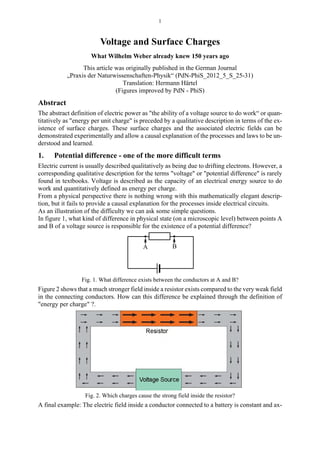
Figure 2 shows that a much stronger field inside a resistor exists compared to the very weak field
in the connecting conductors. How can this difference be explained through the definition of
"energy per charge" ?.
Fig. 2. Which charges cause the strong field inside the resistor?
A final example: The electric field inside a conductor connected to a battery is constant and ax-
A B
2. 2
ially oriented, independent of the conductor's length and curvature. Why is this? What makes
the electric field follow the curvature of the wire? Where are the charges responsible for creating
this electric field? Are all of them located at the battery?” According to Coulomb´s law (the
most basic relation between charge and field) the separated charges at the outlet of the battery
can only cause a distance-dependent field.
Fig. 3. Why is the field inside the conductor constant and independent of distance?
Test results show [1] that these and similar questions cannot be answered by the vast majority
of our pupils or even by many physics teachers.
Interviews reveal that students find the concept of voltage difficult or incomprehensible. It is
not known how many students lose interest in physics because they fail to understand basic con-
cepts, but this number may be quite high. It is therefore astonishing that this unsatisfactory sit-
uation is accepted by most physics teachers and authors of textbooks, since an alternative
explanation has been known for well over one hundred years.
2. Voltage and surface charges
The solution was described over 150 years ago. In 1852, Wilhelm Weber pointed out that al-
though a current-carrying conductor is neutral overall, on its surface it carries charges of differ-
ent density [2].
Recognizing that a potential difference between two points within an electric circuit is related
to a difference in surface charges one can answer the questions above.
Figure 1: The conductor at points A and B carries positive and negative surface charges respec-
tively.
Figure 2: The cross sections outside and inside the resistor are regions where the conductivity
varies by many orders of magnitude. Electrons and positive charges respectively will accumu-
late in these regions and it is the field arising from these charges which will drive the current
through the resistor (Figure 4).
Fig. 4. Charged separating layers between resistor and conductor.
The validity of this statement can be derived directly from the Gaussian law. According to
Electric field within an arbitrarily
curved current-carrying conductor
Electric field
of a charged sphere
3. 3
Gauss, the flux through a closed surface is proportional to the enclosed charges.
Fig. 5. Application of Gauss law at the interface between a conductor and a resistor.
Placing a cylindrical surface within a conductor and resistor such that the boundary surface is
enclosed (shown as a dashed line in Figure 5), results in a different flow through the two end
faces A and B. Therefore, a corresponding electric charge must exist at this interface between
regions of high and low conductivity.
Figure 3: Surface charges on a straight, infinitely long conductor will produce an axially orient-
ed constant electric field, if the gradient of the surface density is linear (Figure 6) to generate a
constant electric field inside a rectilinear conductor.
Fig. 6. Linear gradient of the surface charge density.
The gradient of surface charge density will depart from linearity if the conductor is curved.
More electrons will accumulate on the "outside" of a curved conductor than on the inside, there-
by creating a curved and precisely axially oriented path of the drifting conduction electrons. A
similar argument applies for positively charged conductor sections.
Fig. 7. Distribution of surface charges on curved conductors (qualitative).
The literature contains numerous references to the relationship between voltage and surface
charges [3-8], but this relationship has generated little attention within the scientific community.
It is reasonable to assume that this failure to link surface charge and voltage will have made it
harder for many students to understand basic concepts, and thus may have led to a loss of inter-
est in the subject. A proper investigation into this hypothesis would be valuable.
A description of the historical development of knowledge of surface charges in any current-car-
rying conductor, details of experiments for their detection and a detailed theoretical derivation
has been given by Assis and Hernandes [9].
3. Instructions for teaching
If the concept of voltage or potential difference is related first to surface charges and the quan-
titative description in terms of energy per charge introduced only later, then certain facts must
be taught at the start. In addition, particular learning steps are required, accompanied of course
4. 4
by appropriate demonstrations and classroom activities.
3.1. Charge, Coulomb force, charging of metal (Faraday cage)
An initial knowledge of the phenomenon of charge is required, together with some basic facts
about the nature of the interaction between charge carriers of different polarity (Coulomb's law).
It must also be known that free charges cannot exist inside a metallic conductor. A charged con-
ductor carries free, non-neutralized charge carriers only on its surface.
It is not easy to explain why the surface of a metal acts as a barrier for electrons; this must for
the present be accepted as fact. However, it should be noted that this surface barrier is not in-
surmountable. Before electronic tubes were replaced by transistors, free electrons outside me-
tallic conductors were produced by heating a current-carrying conductor.
3.2. Functioning of a power source
At its simplest, an electric power source consists of a conductive device connected to the outside
by two metallic contacts. The source has a further essential property: it can apply a force on the
internal electrons to move them from one external contact towards the other. The kind of force
varies with the type of power source. Within a battery chemical forces are active; within a gen-
erator electromagnetic forces can be applied.
Although the types of force differ, their action is always the same: at one external contact an
excess of electrons will build up. These electrons are missing at the other contact, giving rise to
a positive charge.
Fig. 8. A battery as voltage source with surface charges on its metallic outlets
The greater the density of the additional negative charges at the surface of the metallic contacts,
the greater the repulsion between them.
The same holds for the positive charge carriers at the opposite side which attract the displacing
electrons. A certain limit will be reached, which is characteristic for the specific power source,
where these repelling and attracting Coulomb forces respectively will prevent any further accu-
mulation of electrons. A state of equilibrium will then be established between the internal force
of the power source and the back-driving Coulomb forces.
3.3. Surface charges on conductors
Connecting the contacts of a power source with metallic conductors is in principle not different
5. 5
from increasing the surface of these contacts.
Fig. 9. Power source with connected conductors and surface charges
In an effort to minimize their mutual repulsion, these charge carriers will redistribute on this en-
larged surface and in this way reduce their density. This implies a short period of non-equilib-
rium between the internal force of the power source and the Coulomb forces, during which
additional electrons will be pushed on to these enlarged surfaces until the original density and
an equilibrium between the involved forces is re-established.
3.4. Surface charges within a closed circuit
If the conductors are connected by a resistor and if the power source is strong enough to replace
the electrons drifting through the resistor, a circular current will result, in which all electrons
inside the conductors will take part.
Fig. 10. A closed circuit and surface charges.
As long as the driving force of the power source remains constant the charges on the surfaces
of the conductors will remain; however the electrons will start drifting along the closed circuit,
together with the bulk of internal charges.
3.5. Potential difference and pressure difference in water circuits
A mechanical system like a water circuit can be regarded as a model for the electric circuit, treat-
ing the phenomena of current and pressure as analogous to electric current and voltage. To use
a water circuit as a model, the kinetic energy of the flowing water must be negligible, which
6. 6
requires that the drift velocity of the water must be small. To achieve significant energy transfer,
large pressure differences must be assumed. The distribution of pressure can be demonstrated
along series and parallel circuits with the help of pressure gauges or water columns; an analogy
can then be made with electric circuits.
This method was applied during the development of the IPN teaching unit on the electric circuit
and supported by the following figures and experiments:
Fig. 11. Figures and setups to demonstrate pressure differences along water circuits.
Experience during the development of the IPN-teaching unit has shown that the water model
supports communication between teachers and students while the latter try to develop their un-
derstanding of the electric circuit, a concept which is not directly accessible to our senses.
However, as shown in detail in an earlier article and confirmed by previous studies [11], we
should not expect to much from the analogy between pressure difference and potential differ-
ence in respect to learning and understanding. The difference in pressure in a liquid is caused
by its compressibility, the liquid at different locations is differently compressed. Students gen-
erally do not know this, and cannot fully appreciate the topic just by talking about compressi-
bility. A careful and sophisticated analysis is needed to determine the pressure gradient along
serial and parallel circuits and to explain the conditions for a steady state.
If such an analysis can be performed, it may be helpful consider a flow of water as movement
of a compression wave front. When such a wave front impacts on a resistor, a backflow is cre-
ated by short term congestion in front of the resistor. This backflow reduces the inflow rate until
a steady state is reached between in- and outflow. To maintain a constant flow through any re-
sistor, the inlet pressure must exceed the outlet pressure. This means that the compression of the
flowing water at the outlet is reduced, in other words the water expends itself while passing
through the resistor.
The same situation develops at every resistor which the wave front has to pass on its path around
the circuit. In the equilibrium state a pressure difference will exist across each resistor in pro-
portion to its resistance.
The same analysis can be applied to explain the origin and distribution of surface charges on a
current carrying conductor. Conduction electrons can be regarded as a kind of "electron gas"
which can be compressed or stretched a little bit by a voltage source. However, this causes only
a compaction or dilution of the "electron gas" on the surfaces of the conductors and not, as in
the case of a mechanical flow of water, over the entire cross-section. Water molecules can react
7. 7
on the basis of short-range forces only with immediately adjacent neighbours and water can
therefore be condensed over the complete cross section. Electrons interact via long-range Cou-
lomb forces, they repel each other at long distances and can only be neutralized inside a metallic
conductor by exactly the same amount of positive charge carriers. But on the surface of a con-
ductor and only on the surface, additional charge carriers can exist.
3.6. Opportunities for experiments
3.6.1. Demonstration of surface charges
By 1962 Jefimenko had demonstrated quite simply the existence of surface charges on current
carrying resistors [12]. Strips of red ink painted on glass plates served as resistors to which a
relatively high voltage (> 10kV) was applied. The visualization of an electric field inside and
outside the resistor was performed by scattered grass seeds which align with the electric field.
Grass seeds are characterized by extremely fine tips at each end, which, in the presence of an
electric field, favour the formation of a relatively large dipole moment. In addition, grass seeds
have a small area of support, which reduces friction when they move; light tapping on the sup-
porting glass plate encourages the seeds to align with the field.
Fig. 12. Electric fields inside and outside differently formed resistors,
as visualized by scattered grass seeds [12].
3.6.2. Interaction of surface charges with external charges
Direct detection of the interaction of surface charges with an external charged object can be
achieved if relatively large resistances and large potential differences are used.
Under those experimental conditions a movable charged metallic foil shows a clearly visible de-
flection along a chain of current carrying resistors (Figure 13). In this experiment, a voltage of
10 kV is applied to a series circuit, consisting of 4 resistors, and the deflection of a charged metal
8. 8
foil is studied when placed at different locations along the circuit [13].
Fig. 13. Interaction between a current carrying conductor and a
charged metallic foil to demonstrate the existence of surface charges.
The experiment clearly demonstrates a lack of interaction close to the centre of the circuit.
When brought in contact with both ends of the circuit, however, the foil is repelled due to elec-
trostatic induction.
By replacing the metallic foil with a charged insulator (a straw, suspended at its centre, with
graphite coated ends) the different polarity of the surface charges at the ends of the resistor chain
can be demonstrated [14].
Fig. 14. Interaction between a current carrying chain of resistors and
a charged straw to demonstrate the existence of surface charges.
3.7. A successful course as challenge
In the U.S., a course on "Electric and Magnetic Interaction" has appeared, making extensive use
9. 9
of the following pictures [15].
Fig. 15. Pictures from an American course to represent the distribution of surface charges[15].
These pictures are used to explain the origin of the driving force on electrons in an arbitrarily
shaped conductor, why reducing the cross section of a wire implies an increased resistance,
which charges are related to the strong field inside a resistor etc.
Such pictures can - even when incomplete - stimulate class discussion or can be used as an ex-
ercise to develop a more accurate and detailed insight into the electric circuit as a system which
is simultaneously both simple and complex.
4. Conclusion
The introduction of potential difference or voltage as the working ability of a battery and in
quantitative form as energy per charge is one-sided in its mathematical orientation. From a
teaching perspective, this approach can be criticized as both too abstract and unintuitive. It hides
the relation between voltage and surface charges and thus takes from students the chance to de-
velop their physical intuition.
If students do not ask without prompting what voltage actually is, they should be encouraged to
raise such questions and to find answers by studying the examples given above. However stu-
dents react, the arguments given here should find a place in a qualified lesson plan, so that teach-
ers can at any time deal appropriately with students' questions, or can stimulate discussion by
raising such questions.
Literature
[1] Härtel, H. et.al. : Test about Voltage - A Basic Term in Electricity Results. (2005)
http://www.astrophysik.uni-kiel.de/~hhaertel/Spannung/voltage_test_result.pdf
[2] Weber, W.: Elektrodynamische Maassbestimmungen insbesondere Widerstandsmessun-
gen. Abhandlungen der Königl. Sächs. Gesellschaft der Wissenschaften, mathematisch-
physische Klasse, 1, S.199–381, . Nachdruck in Wilhelm Weber’s Werke, Vol. 3, H. We-
ber (ed.), Springer, Berlin, 1993, S. 301-471 (1852).
10. 10
[3] Marcus, A. The electric field associated with a steady current in a long cylindrical con-
ductor, American Journal of Physics, 9, 225-226 (1941).
[4] Rosser, W.G.V.: What makes an electric current flow, American Journal of Physics, 31,
884-885, (1963)
[5] Sommerfeld, A.: Elektrodynamik, Leipzig 1964, S. 113-117, (1964).
[6] Härtel, H.: Zur Einführung des Spannungsbegriffs in der Sek. I.
In: Härtel, H. (Hrsg.): Zur Didaktik der Physik und Chemie, Hannover: Schroedel, S. 154-
156. (1979)
[7] Walz, A. E-Felder um stationäre Ströme; PU 2-1984, 5S. 61-68, (1979).
[8] Härtel, H.: The electric voltage: What do students understand? What can be done to help
for a better understanding? In: Duit, R. (ed.); Jung, W. (ed.): Rhöneck, C. von (ed.): As-
pects of Understanding Electricity. Proceedings of an International Workshop. IPN-Ar-
beitsberichte 59. Kiel: IPN, 353-362, (1985).
[9] Assis, A. / Hernandes, J.: The Electric Force of a Current; Apeiron Montreal; (2007).
(available under: http://www.ifi.unicamp.br/~assis/The-Electric-Force-of-a-Current.pdf)
[10] Härtel, H. : IPN-Teaching Unit „The Electric Circuit as a Sytem“ for grade 7 and 8
(1981). (Updated and shortened version (in German) available under
http://www.astrophysik.uni-kiel.de/~hhaertel/PUB/UE-7.pdf).
[11] Schwedes, H. / Dudeck, W.-G. / Seibel, C.: Elektrizitätslehre mit Wassermodellen, Praxis
der Naturwissenschaften - Physik, 44, S. 28-36, (1995)
[12] Jefimenko, O.: Amer. J.Phys .30, S.19/21, (1962).
[13] A video about this experiment is found under:
http://matterandinteractions.org/Content/Materials/Videos/SurfaceCharge.mov.
[14] A video about this experiment is found under:
http://www.astrophysik.uni-kiel.de/~hhaertel/PUB/straw.htm.
[15] Chabay, R. / Sherwood, B.: Matter and Interaction, Volume II: Electric & Magnetic In-
teraction, John Wiley, (2002).
![2
ially oriented, independent of the conductor's length and curvature. Why is this? What makes
the electric field follow the curvature of the wire? Where are the charges responsible for creating
this electric field? Are all of them located at the battery?” According to Coulomb´s law (the
most basic relation between charge and field) the separated charges at the outlet of the battery
can only cause a distance-dependent field.
Fig. 3. Why is the field inside the conductor constant and independent of distance?
Test results show [1] that these and similar questions cannot be answered by the vast majority
of our pupils or even by many physics teachers.
Interviews reveal that students find the concept of voltage difficult or incomprehensible. It is
not known how many students lose interest in physics because they fail to understand basic con-
cepts, but this number may be quite high. It is therefore astonishing that this unsatisfactory sit-
uation is accepted by most physics teachers and authors of textbooks, since an alternative
explanation has been known for well over one hundred years.
2. Voltage and surface charges
The solution was described over 150 years ago. In 1852, Wilhelm Weber pointed out that al-
though a current-carrying conductor is neutral overall, on its surface it carries charges of differ-
ent density [2].
Recognizing that a potential difference between two points within an electric circuit is related
to a difference in surface charges one can answer the questions above.
Figure 1: The conductor at points A and B carries positive and negative surface charges respec-
tively.
Figure 2: The cross sections outside and inside the resistor are regions where the conductivity
varies by many orders of magnitude. Electrons and positive charges respectively will accumu-
late in these regions and it is the field arising from these charges which will drive the current
through the resistor (Figure 4).
Fig. 4. Charged separating layers between resistor and conductor.
The validity of this statement can be derived directly from the Gaussian law. According to
Electric field within an arbitrarily
curved current-carrying conductor
Electric field
of a charged sphere](data:image/gif;base64,R0lGODlhAQABAIAAAAAAAP///yH5BAEAAAAALAAAAAABAAEAAAIBRAA7)