Downloaded 13 times
![IJRET: International Journal of Research in Engineering and Technology eISSN: 2319-1163 | pISSN: 2321-7308
__________________________________________________________________________________________
Volume: 02 Issue: 09 | Sep-2013, Available @ http://www.ijret.org 251
VOLTAGE COLLAPSE MITIGATION BY REACTIVE POWER
COMPENSATION AT THE LOAD SIDE
V Chayapathi1
, Sharath B2
, G S Anitha3
1, 2, 3
Associate Professor, Electrical and Electronics Department, RVCE, Karnataka, India
chayapathiv@rvce.edu.in, sharathb@rvce.edu.in, anithags@rvce.edu.in
Abstract
Power system stability may be defined as the property of a power system that enables it to remain in a state of operating equilibrium
under normal operating conditions and to regain an acceptable state of equilibrium after being subjected to a disturbance. A general
and formal definition is given below. The IEEE/CIGRE Joint Task Force has proposed the following definition-“Power system
stability is the ability of an electric power system, for a given initial operating condition, to regain a state of operating equilibrium
after being subjected to a physical disturbance, with most system variables bounded, so that practically the entire system remains
intact.” The challenge faced in the modern power system is the collapse of voltages at heavy loads at the load buses of a power
system. The voltage collapse will in turn will effect the stability of the power system. In this paper a novel way of mitigating the
voltage collapse by supplying the reactive power at load buses is discussed and encouraging simulation results are obtained. The
method employed is as fallows. Simulation is done without SVC and STATCOM at load buses. On comparison of the results at the
load buses it is seen that with SVC and STATCOM at the load buses voltage collapse is mitigated in spite of heavily loading the
system.
Keywords: Voltage Collapse, Reactive Power Management, Load Bus, Power System Stability.
-----------------------------------------------------------------------***-----------------------------------------------------------------------
1. INTRODUCTION
Stability in general, is a condition of equilibrium between
opposing forces. In case of power systems, electric power
generation and consumption are the opposing forces. Power
system stability is the ability of the system to remain in
operating equilibrium which is achieved between the electric
power generation and consumption. Instability results when a
system change or the disturbance leads to an imbalance
between the forces in opposition. Power system stability can
be classified as follows:
• Power system stability is classified into Rotor angle
stability, Frequency stability and Voltage stability.
• The size of the disturbance: It can be a small scale
disturbance (e.g. change in load) or a large
disturbance (e.g. failure of a generator)
• The time span to be considered for assessing
stability: Short term stability(of the order of several
seconds) and Long term stability (of the order of
several minutes)
Rotor angle stability refers to the ability of the synchronous
machines of an interconnected power system to remain in
synchronism after being subjected to a disturbance. It is
further divided into small signal (or small disturbance) rotor
angle stability and large signal rotor angle stability or transient
stability. Frequency stability refers to the ability of the power
system to maintain steady frequency following a severe
disturbance, causing considerable imbalance between
generation and load. Frequency stability can be a short term or
a long term phenomenon. Voltage Stability Voltage stability is
the ability of the power system to maintain steady acceptable
voltages at all buses in the system at normal operating
conditions and after being subjected to a disturbance. A power
system is “voltage stable” if voltages at respective buses after
a disturbance are close to voltages at normal operating
conditions [1].
2. VOLTAGE INSTABILITY AND VOLTAGE
COLLAPSE
Voltage instability results from a progressive fall or rise of
voltages of some buses. Voltage instability can be seen as
uncontrollability of voltage magnitude at a number of buses of
a power system.
Normally, power system operation is represented by power
generation, load demand and adequate supply of power to
loads at all times. Loads are usually the components which
drive the power system to instability. When a disturbance
occurs, the power consumed by loads is restored by the action
of voltage regulators, tap changing transformers, etc., (load
dynamics). These restored loads stress the high voltage
network by consuming more reactive power. This further
reduces voltages. The worst case situation arises when the
above mentioned load dynamics increases the reactive power](https://image.slidesharecdn.com/voltagecollapsemitigationbyreactivepower-140805021959-phpapp01/85/Voltage-collapse-mitigation-by-reactive-power-1-320.jpg)
![IJRET: International Journal of Research in Engineering and Technology eISSN: 2319-1163 | pISSN: 2321-7308
__________________________________________________________________________________________
Volume: 02 Issue: 09 | Sep-2013, Available @ http://www.ijret.org 251
VOLTAGE COLLAPSE MITIGATION BY REACTIVE POWER
COMPENSATION AT THE LOAD SIDE
V Chayapathi1
, Sharath B2
, G S Anitha3
1, 2, 3
Associate Professor, Electrical and Electronics Department, RVCE, Karnataka, India
chayapathiv@rvce.edu.in, sharathb@rvce.edu.in, anithags@rvce.edu.in
Abstract
Power system stability may be defined as the property of a power system that enables it to remain in a state of operating equilibrium
under normal operating conditions and to regain an acceptable state of equilibrium after being subjected to a disturbance. A general
and formal definition is given below. The IEEE/CIGRE Joint Task Force has proposed the following definition-“Power system
stability is the ability of an electric power system, for a given initial operating condition, to regain a state of operating equilibrium
after being subjected to a physical disturbance, with most system variables bounded, so that practically the entire system remains
intact.” The challenge faced in the modern power system is the collapse of voltages at heavy loads at the load buses of a power
system. The voltage collapse will in turn will effect the stability of the power system. In this paper a novel way of mitigating the
voltage collapse by supplying the reactive power at load buses is discussed and encouraging simulation results are obtained. The
method employed is as fallows. Simulation is done without SVC and STATCOM at load buses. On comparison of the results at the
load buses it is seen that with SVC and STATCOM at the load buses voltage collapse is mitigated in spite of heavily loading the
system.
Keywords: Voltage Collapse, Reactive Power Management, Load Bus, Power System Stability.
-----------------------------------------------------------------------***-----------------------------------------------------------------------
1. INTRODUCTION
Stability in general, is a condition of equilibrium between
opposing forces. In case of power systems, electric power
generation and consumption are the opposing forces. Power
system stability is the ability of the system to remain in
operating equilibrium which is achieved between the electric
power generation and consumption. Instability results when a
system change or the disturbance leads to an imbalance
between the forces in opposition. Power system stability can
be classified as follows:
• Power system stability is classified into Rotor angle
stability, Frequency stability and Voltage stability.
• The size of the disturbance: It can be a small scale
disturbance (e.g. change in load) or a large
disturbance (e.g. failure of a generator)
• The time span to be considered for assessing
stability: Short term stability(of the order of several
seconds) and Long term stability (of the order of
several minutes)
Rotor angle stability refers to the ability of the synchronous
machines of an interconnected power system to remain in
synchronism after being subjected to a disturbance. It is
further divided into small signal (or small disturbance) rotor
angle stability and large signal rotor angle stability or transient
stability. Frequency stability refers to the ability of the power
system to maintain steady frequency following a severe
disturbance, causing considerable imbalance between
generation and load. Frequency stability can be a short term or
a long term phenomenon. Voltage Stability Voltage stability is
the ability of the power system to maintain steady acceptable
voltages at all buses in the system at normal operating
conditions and after being subjected to a disturbance. A power
system is “voltage stable” if voltages at respective buses after
a disturbance are close to voltages at normal operating
conditions [1].
2. VOLTAGE INSTABILITY AND VOLTAGE
COLLAPSE
Voltage instability results from a progressive fall or rise of
voltages of some buses. Voltage instability can be seen as
uncontrollability of voltage magnitude at a number of buses of
a power system.
Normally, power system operation is represented by power
generation, load demand and adequate supply of power to
loads at all times. Loads are usually the components which
drive the power system to instability. When a disturbance
occurs, the power consumed by loads is restored by the action
of voltage regulators, tap changing transformers, etc., (load
dynamics). These restored loads stress the high voltage
network by consuming more reactive power. This further
reduces voltages. The worst case situation arises when the
above mentioned load dynamics increases the reactive power](https://image.slidesharecdn.com/voltagecollapsemitigationbyreactivepower-140805021959-phpapp01/75/Voltage-collapse-mitigation-by-reactive-power-1-2048.jpg)
![IJRET: International Journal of Research in Engineering and Technology eISSN: 2319-1163 | pISSN: 2321-7308
__________________________________________________________________________________________
Volume: 02 Issue: 09 | Sep-2013, Available @ http://www.ijret.org 252
demand to such an extent that it exceeds the reactive power
capability of the transmission and generation systems. Voltage
instability is hence a state in which the power system no
longer behaves in a predictable manner in response to
operating changes. The following are the causes for voltage
stability.
• Under load tap changing (ULTC) action during low
voltage conditions: Several previous studies have
shown that the conventional tap changer controller is
an important contributor to voltage collapse, since it
always aims to restore its controlled voltage, even
following severe disturbances in the transmission
system.
• Un favorable load characteristics[2]
• Poor co-ordination between various protective and
control systems like generator excitation protection,
armature over current protection, phase shifting
regulators, etc.
• A small gradual system change such as normal
increment in system load, leading to an initial voltage
dip which in turn leads to further voltage dips.
2.1 Voltage Collapse Mechanism
A typical voltage collapse scenario is outlined below
considering some types of system contingencies:
• Large generating units near the load centers are out of
service and the power system experiences abnormal
operating conditions. As a result, some EHV (Extra
high voltage) lines are heavily loaded and reactive
power resources are at a minimum.
• The loss of a heavily loaded line would cause
additional loading on the remaining neighboring
lines. Consequently, the reactive power losses in the
lines would increase thereby resulting in heavy
reactive power demand on the system.
• Immediately following the loss of the EHV line, a
significant lowering of voltage at adjacent load
centers would occur due to extra reactive power
loading. However, the generator AVRs would
quickly restore terminal voltages by increasing
excitation. Increased voltage drop would occur in
generators, transformers and lines due to additional
reactive power flow through the inductances
associated with these elements. At this stage, the
armature and field current heating levels of
generators would have reached their maximum limits.
• The decrease in EHV level voltage would be
mirrored into the distribution system where ULTC
substation transformers would take a few minutes ( 2
to 4 minutes) to restore distribution level voltages
and loads to pre fault levels. Each step of this tap
changing operation would result in incremental
loading of EHV lines causing increased line losses
which in turn would cause a greater drop in voltage
levels. If this loading of the line exceeds the surge
impedance loading, each further MVA increase in
line flow would cause higher line losses.
2.2 Prevention of Voltage Collapse
This section discusses the several methods available for
prevention of voltage collapse.
• Providing sufficient reactive power to a power
system is the first defense against voltage collapse.
Use of control systems such as fast-acting automatic
voltage regulators, automatic controls for switching
of capacitor banks. Use of Excitation control systems
have to be properly set and co-ordinated. This is to
ensure that the full reactive power capability of
generators is available for system voltage support
during decaying voltage conditions.
• Reducing Further the load is another means to
provide support for system voltage. During decaying
system voltage conditions, actions to increase
distribution voltage levels by using tap changers can
be blocked manually or automatically when
collapsing voltage conditions are recognized.
• Load shedding programs are applied on a more
common basis to prevent voltage collapse. Shedding
load to mitigate voltage collapse should be
implemented only after all other efforts to avoid a
total voltage collapse have been exhausted. Manual
load shedding programs can be effective in
stabilizing a gradually collapsing system voltage. In
such cases, pre-planned guidelines and procedures
are developed for system operators to initiate load
dropping when a voltage collapse is evolving. The
difficulty with a manual system is that the burden is
placed on human judgment to recognize the problem
that exists and to determine that the only recourse is
to shed load.
2.3 Static VAr Compensator (SVC)
Static VAr Compensator is a shunt connected static VAr
generator or absorber whose output is adjusted to control
current (capacitive or inductive) in order to maintain or control
bus voltage magnitude.
SVCs are installed for many purposes such as
• Voltage regulation
• Reduction of voltage flicker caused by varying loads
like arc furnace
• Increase power transfer capacity of transmission
systems
• Increase transient stability limits of a power system
• Increase damping of power oscillations
• Reduce temporary over voltages
• Damp sub synchronous oscillations
The main advantage of SVCs over simple mechanically-
switched compensation schemes is their near-instantaneous](https://image.slidesharecdn.com/voltagecollapsemitigationbyreactivepower-140805021959-phpapp01/85/Voltage-collapse-mitigation-by-reactive-power-2-320.jpg)
![IJRET: International Journal of Research in Engineering and Technology eISSN: 2319-1163 | pISSN: 2321-7308
__________________________________________________________________________________________
Volume: 02 Issue: 09 | Sep-2013, Available @ http://www.ijret.org 253
response to changes in the system voltage. For this reason they
are often operated at close to their zero-point in order to
maximize the reactive power correction they can rapidly
provide when required. They are l cheaper, faster, and more
reliable than dynamic compensation schemes such as
synchronous condensers.
2.4 Static Synchronous Compensator (STATCOM)
It is based on a power electronics voltage-source converter and
can act as either a source or a sink of reactive AC power to an
electricity network. It is a member of the FACTS family of
devices. Usually a STATCOM is installed to improve voltage
stability. If the amplitude of output voltage is increased above
the utility bus voltage, then a current flows from converter to
ac system and the converter generates reactive power for the
system. If the amplitude of the output voltage is decreased
below the utility bus voltage, then the current flows from the
ac system to the converter which absorbs the inductive
reactive power from the ac system. If the output voltage equals
the ac system voltage, reactive power exchange becomes zero
and the STATCOM is said to be in floating state [3].
A STATCOM can improve power system performance in the
following areas:
• Dynamic voltage control in transmission and
distribution systems
• Power oscillation damping in power transmission
systems
• Transient stability
• Voltage flicker control
• Control of active power in addition to reactive power
in the connected line requiring dc energy source
3. VOLTAGE STABILITY ANALYSIS
The various methods available to study the voltage stability of
a power system can be divided into static and dynamic
analysis methods.
The static analysis provides snapshots of the system
conditions at various instants of time and results in reducing
the entire system equations to purely algebraic equations. In
static analysis, the steady state stability of the system is
determined using load flow equations. In these studies, it is
assumed that all dynamics have died out and all controllers
have performed their operations correctly. Steady state voltage
stability studies pertain to long term voltage stability.
Dynamic analysis is based on the theory that voltage stability
is a dynamic phenomenon. Time domain dynamic simulations
enable representation of all possible incidents leading to
voltage instability in chronological order. The dynamics of the
power system is modeled as differential equations [4].
Dynamics of system’s control and protection devices are
considered so that practical and accurate definition of the
system’s stability limits is obtained more accurately.5]
3.1 Static Voltage Stability Analysis
The static approach captures snapshots of system conditions at
various time frames along the time-domain trajectory. At each
of these time instants, the time derivatives of the state
variables are assumed to be zero, and the state variables take
on values appropriate to the specific time frame.
Consequently, the system can be represented in terms of
purely algebraic equations allowing the use of static analysis
techniques [6]
In the past, conventional power-flow programs using methods
like Newton Raphson, Fast Decoupled Load Flow, etc., have
been used for static analysis of voltage stability. In static
voltage stability, slowly developing changes in the power
system occur that eventually lead to a shortage of reactive
power and declining voltage. This phenomenon can be
observed by a plot of real power transferred versus receiving
end voltage. This plot called PV curve was obtained at
selected load buses earlier through power flows. PV curves
can also be obtained as the output of continuation power flows
or CPF by plotting voltage against the continuation parameter.
The close relationship between reactive power and voltage
allows another graphical representation of static voltage
stability in the form of a plot between voltages at a bus versus
the corresponding reactive power loading of the same bus.
This graph can be plotted for different power factors and given
values of real power and is called QV curve.
In addition to PV and QV curves, voltage stability indices
have been formulated which serve as indicators of static
voltage stability. These indices enable identification of weak
parts of the system and also denote the closeness to voltage
collapse.
4. VOLTAGE STABILITY INDICES
The purpose of voltage stability indices is to locate the
weakest bus in the system and the most critical line connected
to it. These indices may be based on the lines (Line voltage
stability indices) or the bus (Nodal voltage stability indices)
• Line voltage stability Indices
1. Line stability index (Lmn): Lmn = 4XQi / ([sin(θ-
δ) ]2
*Vi
2
) ( 3.1)
where Qi: Reactive powers at sending end bus
X=Z sin θ, Z is the impedance of the
transmission line
θ : Power factor angle
δ : Voltage angle
Vi : Sending end voltage
The system is stable if Lmn remains less than 1.
2. Line stability factor (Lqp): This index was
proposed by A. Mohamed, et al. This index](https://image.slidesharecdn.com/voltagecollapsemitigationbyreactivepower-140805021959-phpapp01/85/Voltage-collapse-mitigation-by-reactive-power-3-320.jpg)
![IJRET: International Journal of Research in Engineering and Technology eISSN: 2319-1163 | pISSN: 2321-7308
__________________________________________________________________________________________
Volume: 02 Issue: 09 | Sep-2013, Available @ http://www.ijret.org 254
depends upon real power Pi and reactive power
Qi at the sending end bus.
Lqp = 4(X/ Vi
2
)( (X/ Vi
2
)Pi
2
+ Qi) (3.2)
The system is stable if Lqp remains less than 1.
3. Fast Voltage Stability Index (FVSI): This index
depends on the reactive power at the receiving
end bus. This index is proposed by L Musirin
Et.al. and is defined as
FVSI = 4Z2
Qj / Vi
2
X
The system is stable if FVSI remains less than 1.
4. Voltage Collapse Proximity Index (VCPI): This
index depends on the ratio of real power to maximum
value of real power at the sending end and ratio of
reactive power to maximum value of reactive power
at the sending end. This index is proposed by
M.Moghavemmi Et.al. and is defined as
VCPI (P) = Pj / P (max)
VCPI (Q) = Qj / Q (max)
Pj and Qj are obtained from load flow analysis
and P (max) and Q (max) are the maximum
values of active and reactive powers which can
be transferred through the line under
consideration.
The system is stable if VCPI remains less than 1.
5. On Line Voltage Stability Index (LVSI)
An online voltage stability index is proposed from
the view point of the relationships between line
active power and bus voltage with the line . If the
resistances of the transmission line are zero, then this
index fails. The system is stable if LVSI is less than
or equal to 1.
LVSI = 4 Pj R / [Vi cos(θ-δ)]2
• Nodal stability indices
1. L index: is a global indicator which provides
quantitative estimate of distance of actual
operating point of system to stability limit.
2. Diagonal element dependent index: An index
based on partial derivatives of active and reactive
powers with respect to voltage angle and voltage
which indicates voltage stability.
This work focuses on use of line voltage stability indices in
determining critical lines and hence the weakest bus in the
power system [7].
5. WSCC 9 BUS TEST SYSTEM
This is a Western Systems Coordinating Council test system
with three synchronous machines and nine buses. The
synchronous machines are provided with IEEE type-1
exciters. The synchronous machines may be provided with
automatic voltage regulators. The system consists of three
loads at buses 5, 6 and 8.
Fig 1 WSCC 9 BUS TEST SYSTEM
5.1 Analysis of 9 Bus System Using Indices
The 9 bus test system was analyzed on similar lines as the
IEEE 14 bus test system. The system without any reactive
power compensation by FACTS devices was considered and
the load buses (5, 6 and 8) were subjected to various loadings.
The loadings were of the form of increasing real power alone,
increasing reactive power alone and then increasing both real
and reactive powers simultaneously. The Newton Raphson
power flow program was run for the various loadings and then
the load flow results were entered into a MATLAB program
which gave the Line Stability Index and Line Stability Factor
as outputs. The critical lines were found to be lines 5 and 6 as
indicated by the values of indices (closer to 1). These critical
lines were found to be either directly connected to or in the
proximity of bus 5. Bus 5 was identified as the weakest bus
and following connection of STATCOM at bus 5, the indices
were recalculated.
5.2 Analysis of 9 Bus System Using QV Curves
QV curves were plotted for the critical bus 5. Bus 5 was made
a PV bus by addition of a PV generator. Then, scheduling of
voltage was done for bus 5 i.e. bus voltage was set at a
particular value. Then the Newton Raphson power flow was
run and the corresponding reactive power at bus 5 was
obtained. This process was repeated with the voltage at bus 5
being incremented at the start of each load flow. The voltage
and reactive power values were then used to obtain a plot of
QV in Excel as shown in Fig 2 Then QV curve was obtained
for the case of STATCOM being connected at bus 5 as shown
in Fig 3](https://image.slidesharecdn.com/voltagecollapsemitigationbyreactivepower-140805021959-phpapp01/85/Voltage-collapse-mitigation-by-reactive-power-4-320.jpg)
![IJRET: International Journal of Research in Engineering and Technology eISSN: 2319-1163 | pISSN: 2321-7308
__________________________________________________________________________________________
Volume: 02 Issue: 09 | Sep-2013, Available @ http://www.ijret.org 256
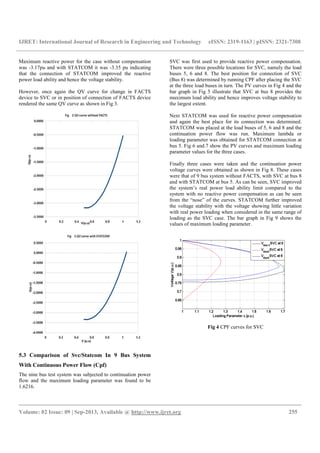
Fig. 5 Comparison of Lambda with different SVC positions
Fig. 6 CPF curves for STATCOM
Fig 7 Comparison of Lambda with different STATCOM
positions
Fig 8 CPF Curves
Fig .9 Comparison of lambda for different cases
CONCLUSIONS
The required objective is fulfilled .The results show that with
FACTS devices the power system is less prone to voltage
collapse at the load buses during heavily loaded conditions on
the load buses. The reactive power supplied at the load buses
has improved the power system stability.
REFERENCES
[1] Voltage Regulation with STATCOMs: Modeling,
Control and Results- Amit Jain, Karan Joshi, Aman
Behal, Ned Mohan, IEEE TRANSACTIONS ON
POWER DELIVERY, VOL. 21, NO. 2, APRIL 2006.
[2] Improvement of STATCOM Performance with
Optimum LQR and Pole placement Controller Based on
Genetic Algorithm-S.Eshtehardiha, Gh.Shahgholian.
First Joint Congress on Fuzzy and Intelligent Systems,
Ferdowsi University of Mashhad, Iran
[3] Single phase statcom –its control algorithm-Linju Jose
[4] Analysis and Operation of STATCOM in Unbalanced
Systems Carlos A.C. Cavaliere , Edson H. Watanabe ,
Maurício Aredes for StatCom Controls Operation with
Unbalanced Voltages, Clark Hochgraf & Robert H.](https://image.slidesharecdn.com/voltagecollapsemitigationbyreactivepower-140805021959-phpapp01/85/Voltage-collapse-mitigation-by-reactive-power-6-320.jpg)
![IJRET: International Journal of Research in Engineering and Technology eISSN: 2319-1163 | pISSN: 2321-7308
__________________________________________________________________________________________
Volume: 02 Issue: 09 | Sep-2013, Available @ http://www.ijret.org 257
Lasseter, Electrical and Computer Engineering
Department, University of Wisconsin–Madison,
Madison, WI 53706
[5] S. Mori, K. Matsuno, M. Takeda and M. Seto,
"Development of a Large Static VAR Generator Using
Self-Commutated Inverter For Improving Power
System Stability,” IEEE Trans. Power Systems, Vol. 8,
No. 1.
[6] N. G. Hingorani, L. Gyugyi, “Understanding FACTS –
Concepts and Technology of Flexible AC Transmission
Systems”, IEEE Press, New York, 1999.
[7] Yves Narcisse Nguegan Tchokonte, Real Time
Identification and Monitoring of Voltage Stability
Margin in Electrical Power Transmission Systems
Using Synchronised phasor measurements,Kassel
University Press GmbH
[8] Venkataramana Ajjarapu, Computational Techniques
for Voltage Stability Assessment and Control, Springer,
2006
[9] J.Lewis Blackburn and Thomas J. Domin, Protective
Relaying: Principles and Applications, CRC Press, 3rd
Edition, 2006
BIOGRAPHIES
Prof. V. Chayapathy is working as an
Associate Professor in the Dept of
Electrical and Electronics, R V College of
Engineering Bangalore. His areas of
interest are Voltage Collapse, Power
Electronic system design using IC’s,
Software systems.
Sharath B is working as an Assistant
Professor in the Dept of Electrical and
Electronics, R V College of Engineering
Bangalore. His areas of interest are
Renewable Energy Sources, Power
Electronics & Drivers, Image Processing
Dr G S Anitha is working as an
Associate Professor in the Dept of
Electrical and Electronics, R V College of
Engineering Bangalore. Her areas of
interest are Renewable Energy Sources,
High Voltage Engineering](https://image.slidesharecdn.com/voltagecollapsemitigationbyreactivepower-140805021959-phpapp01/85/Voltage-collapse-mitigation-by-reactive-power-7-320.jpg)

The document discusses the issue of voltage collapse in power systems, outlining its impact on stability and the importance of reactive power compensation at load buses. It introduces methods to mitigate voltage collapse, including the use of Static Var Compensators (SVC) and Static Synchronous Compensators (STATCOM), which help maintain voltage levels and improve system performance. The paper also presents a detailed analysis of voltage stability indices and their application in identifying critical lines and buses within a test system.


