Downloaded 34 times


![28
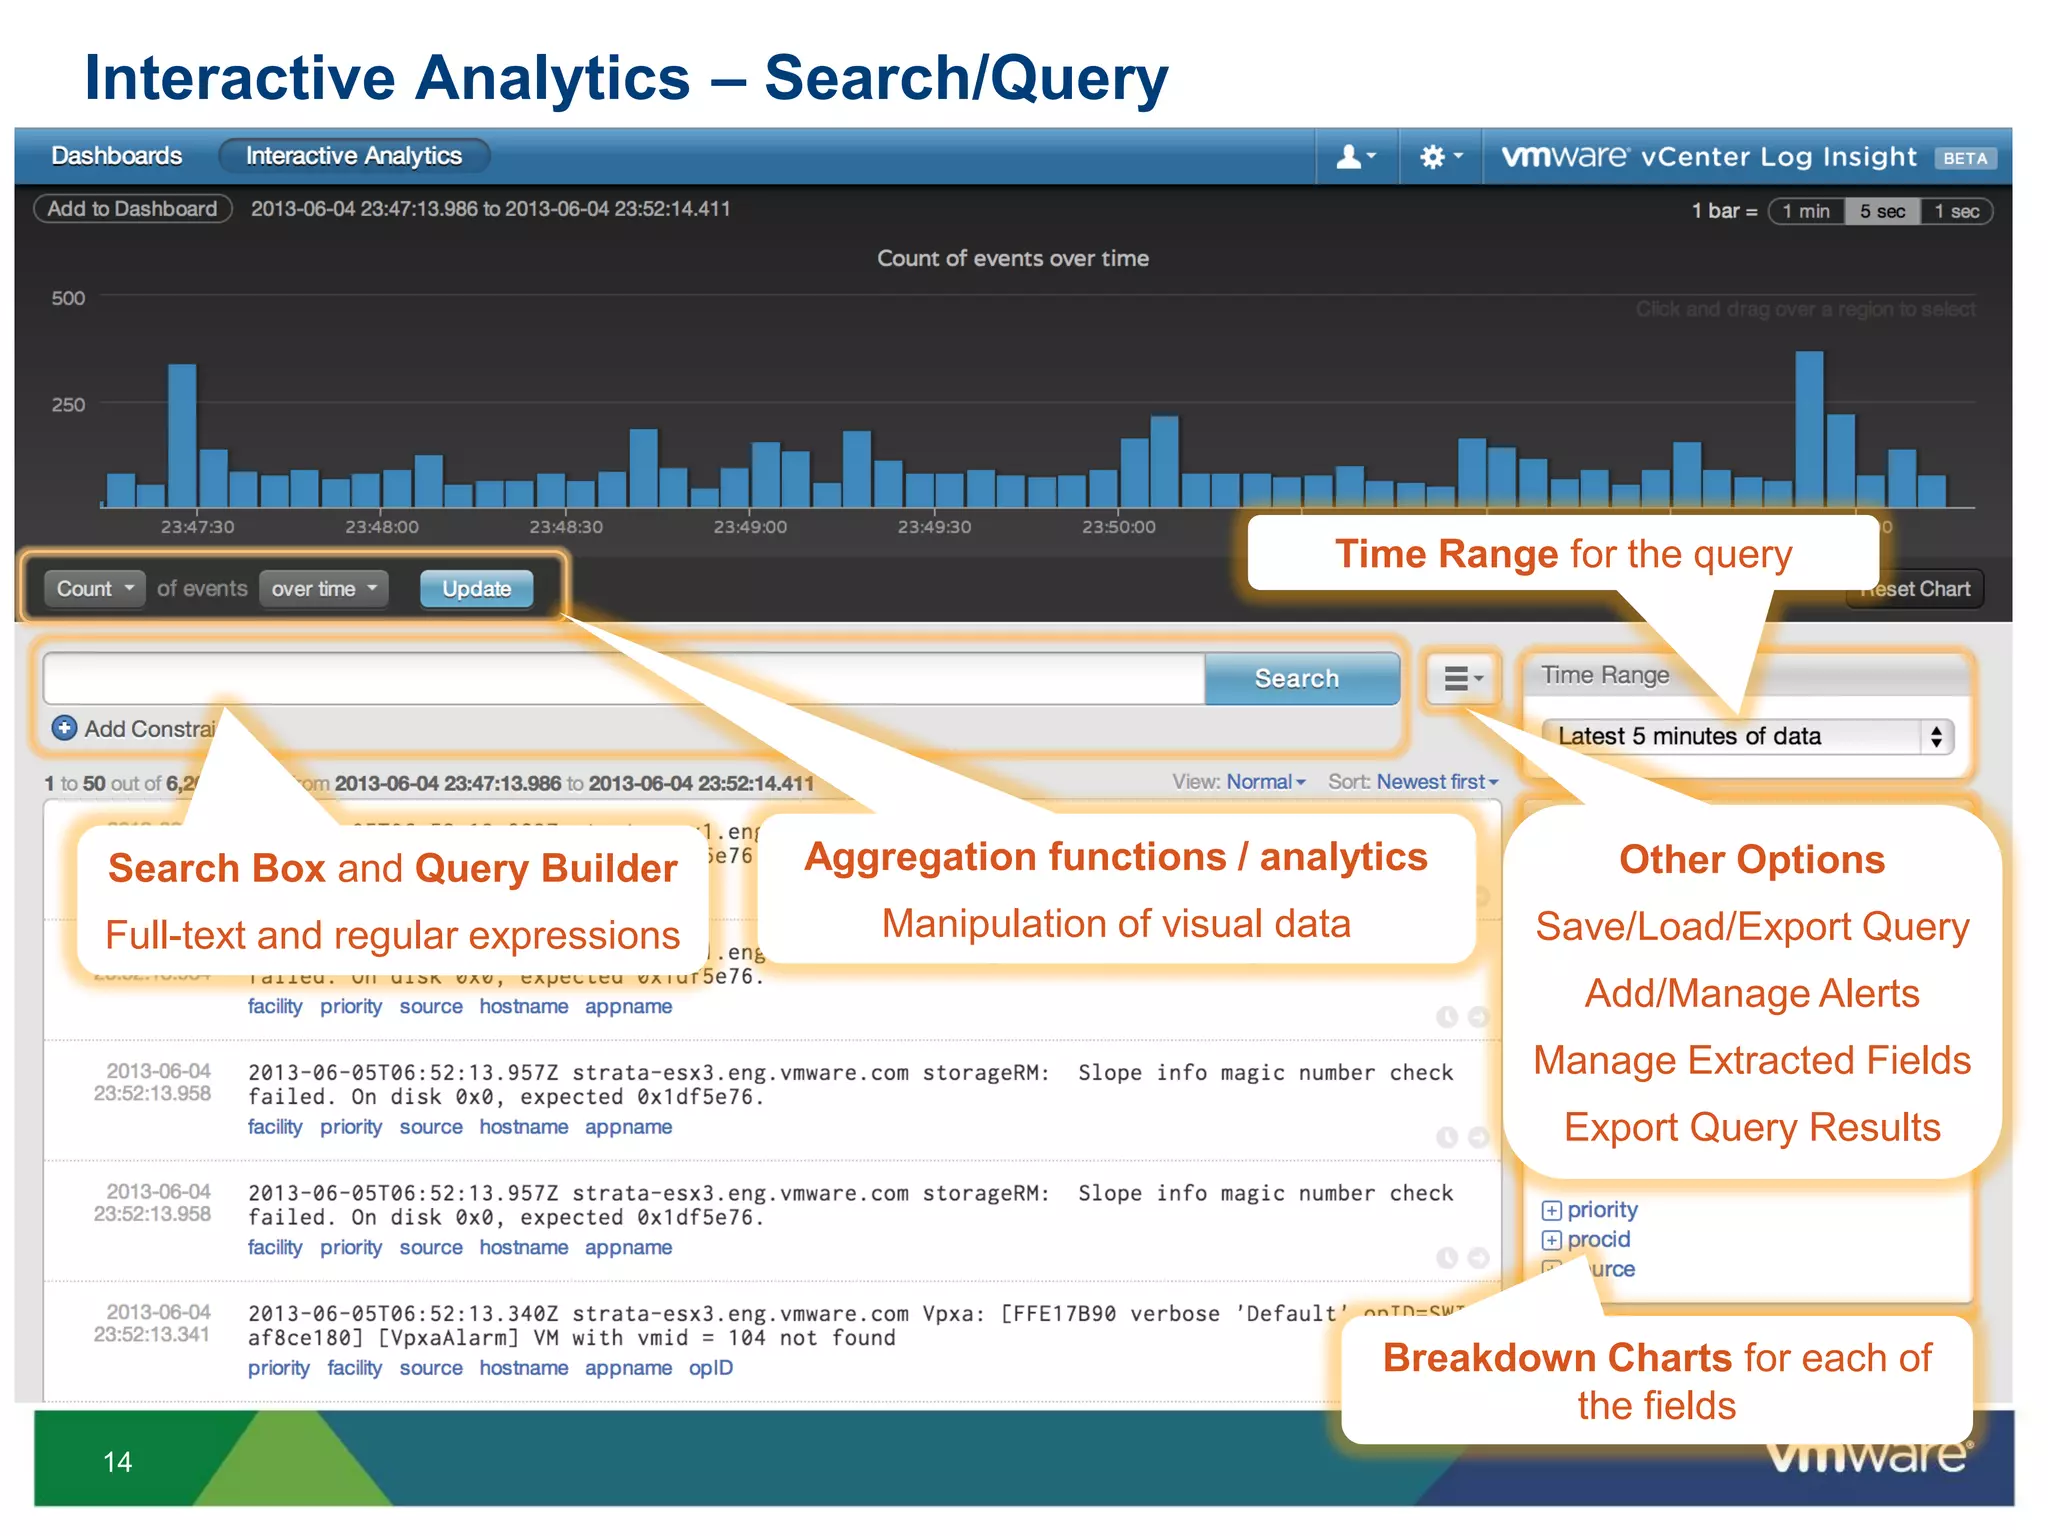
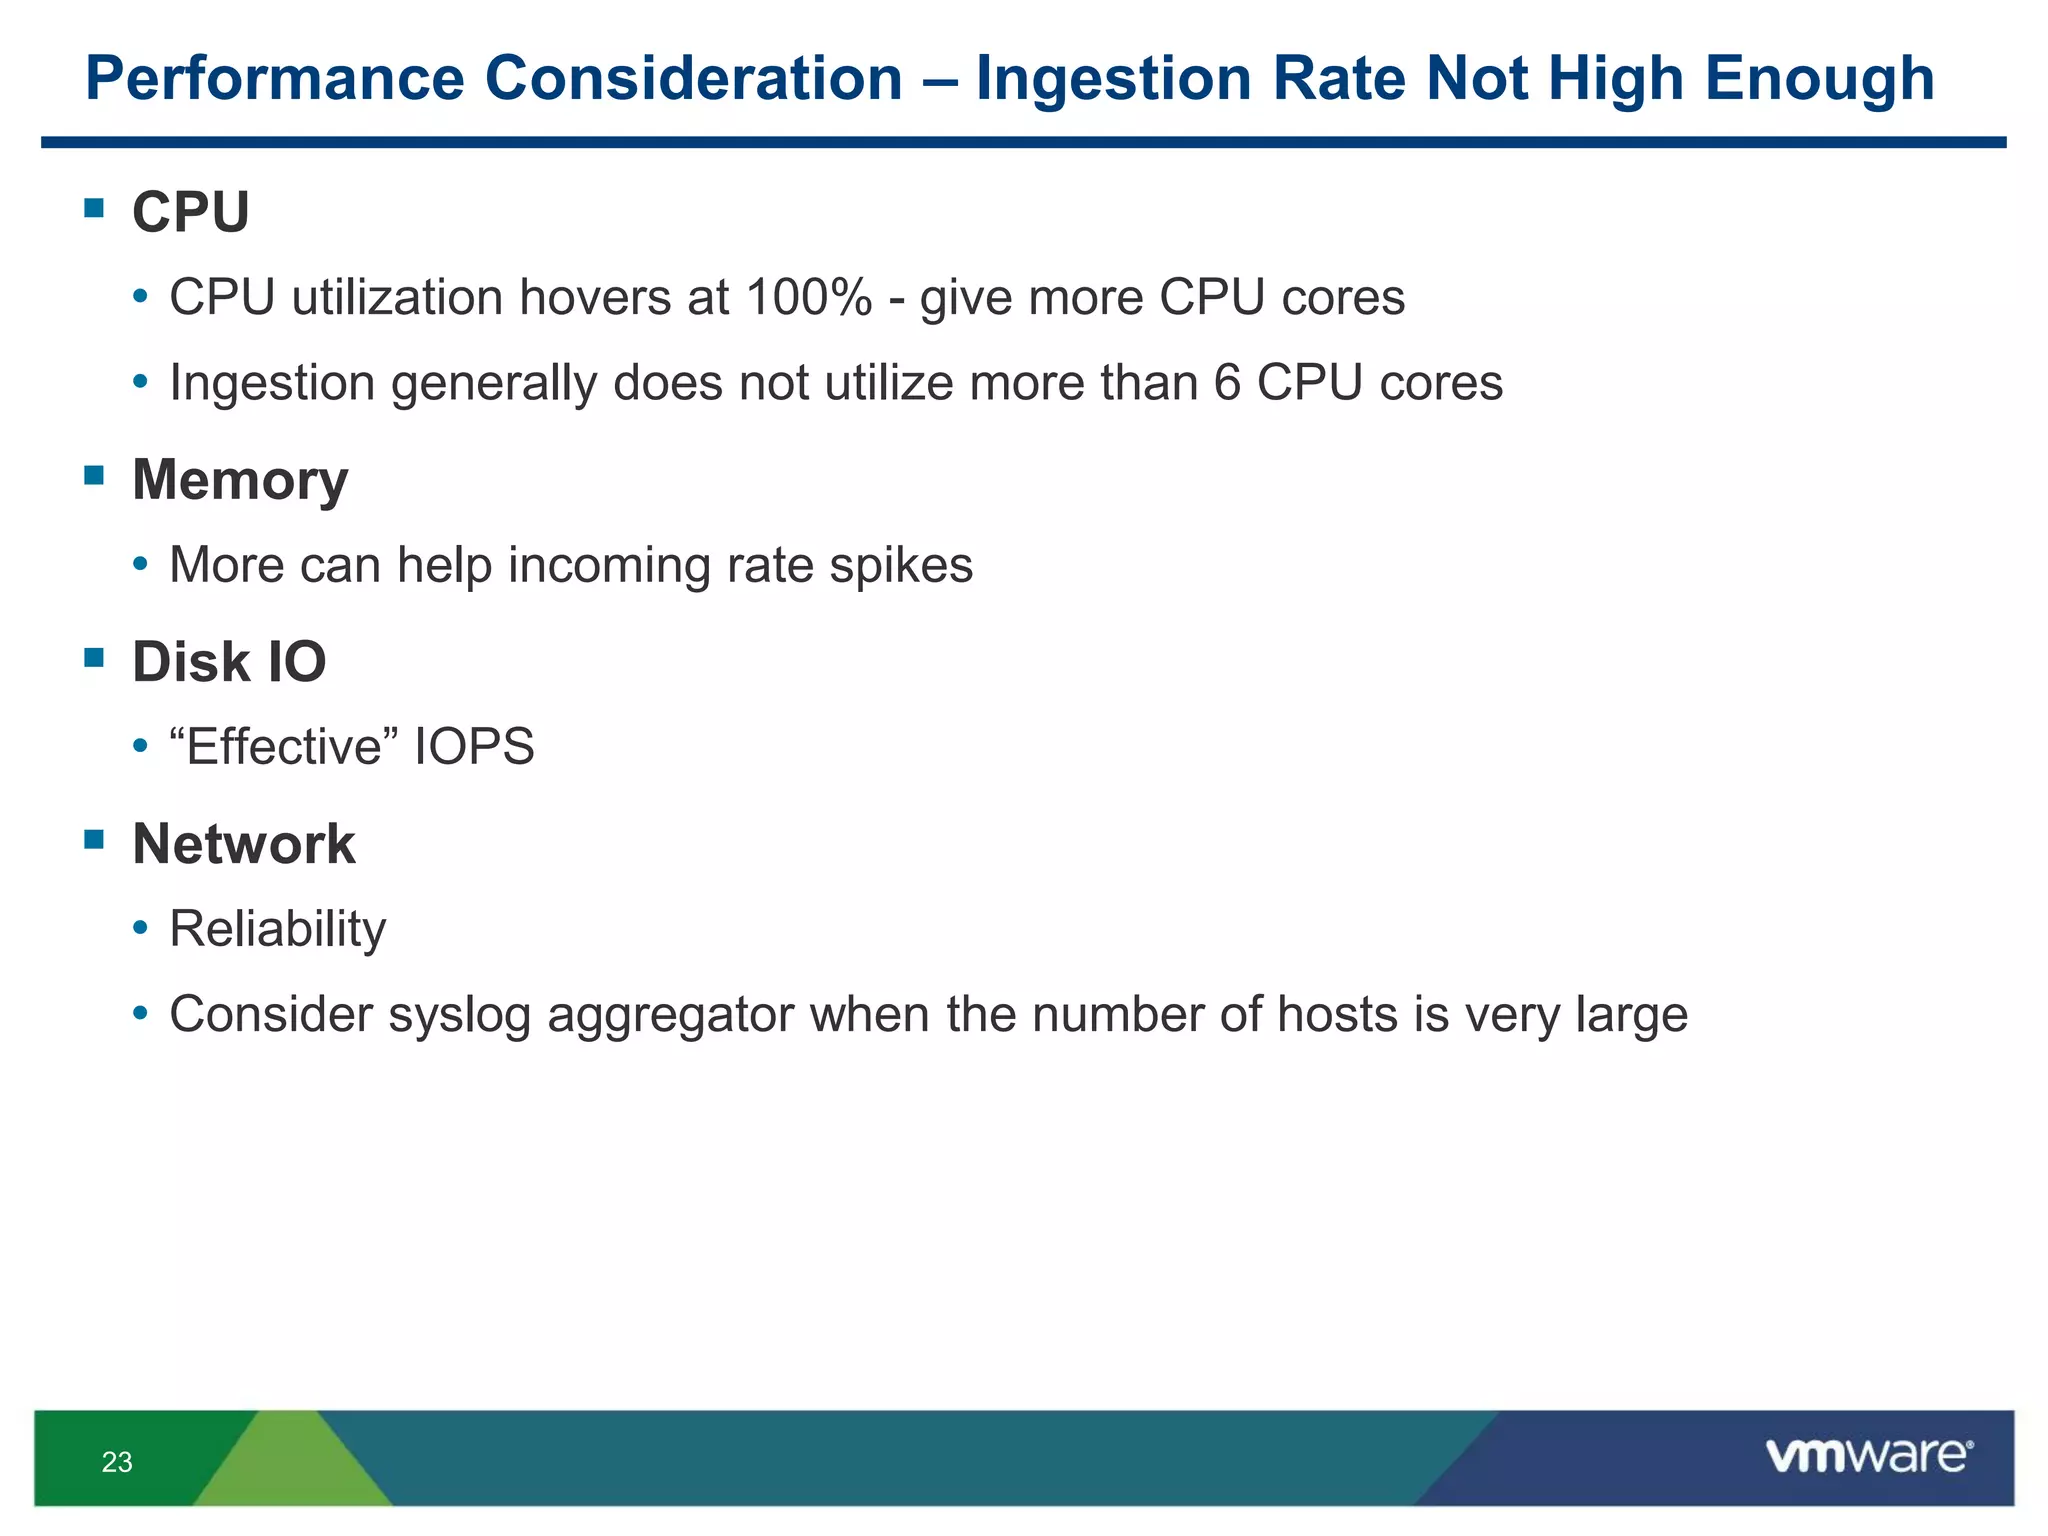
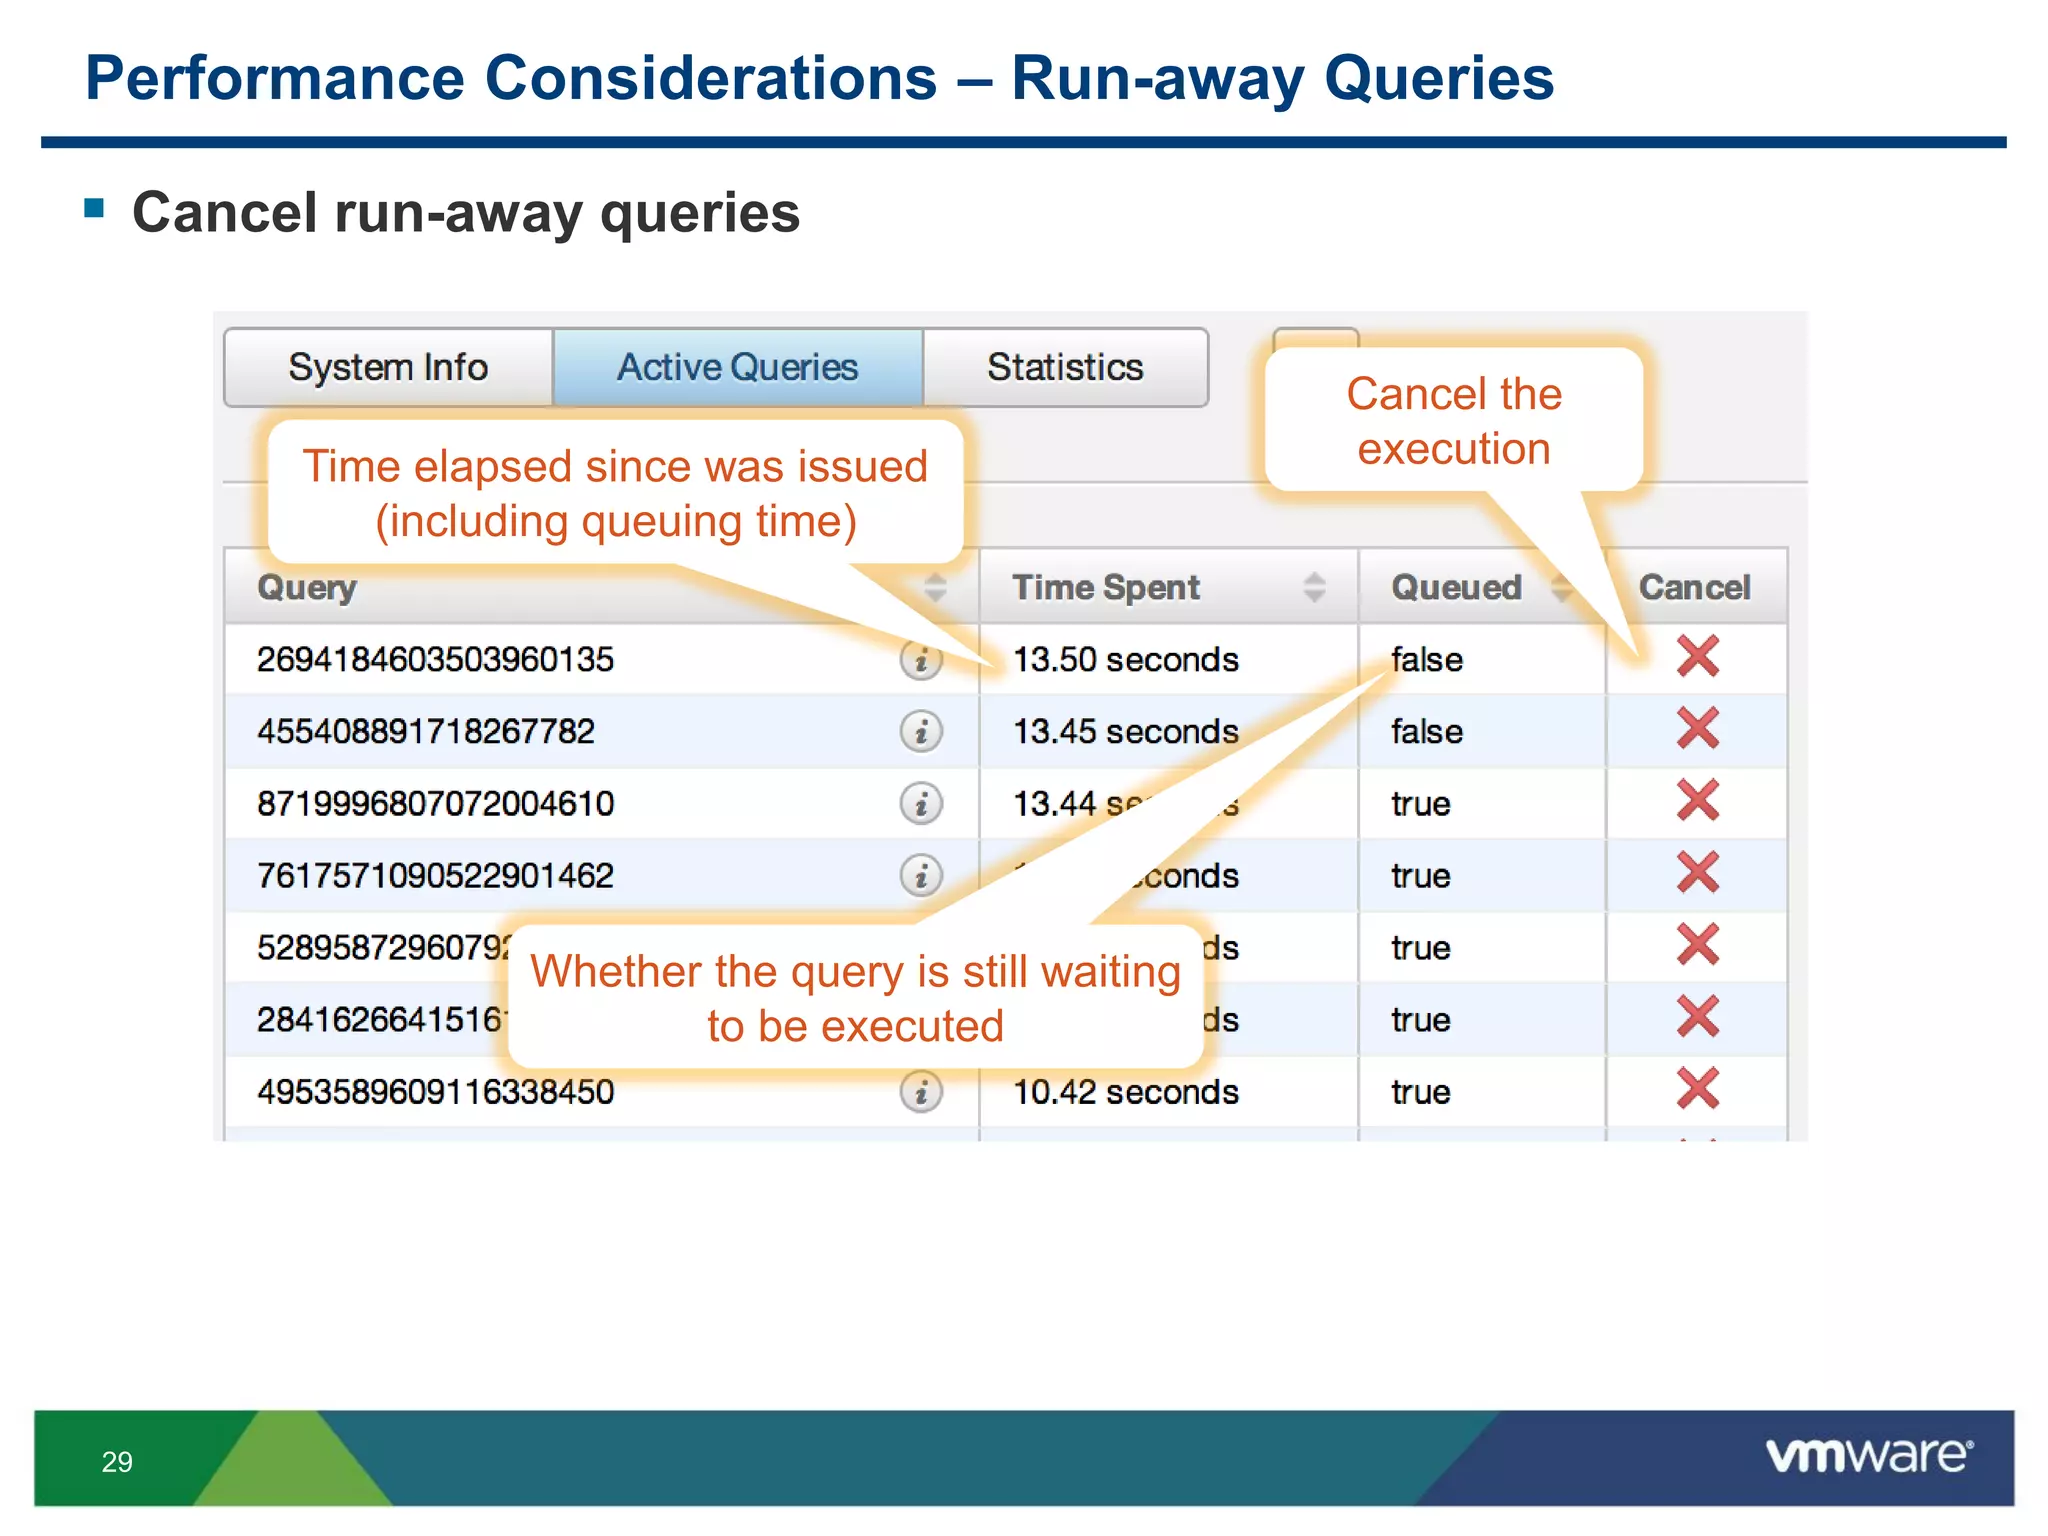
Performance Consideration – Run-away Queries
Monitor run-away queries
• Count all messages in the past 3 years that match ((((((0?[1-9])|([1-2][0-
9])|(3[0-1]))-
(([jJ][aA][nN])|([mM][aA][rR])|([mM][aA][yY])|([jJ][uU][lL])|([aA][uU][gG])|([oO][cC
][tT])|([dD][eE][cC])))|(((0?[1-9])|([1-2][0-9])|(30))-
(([aA][pP][rR])|([jJ][uU][nN])|([sS][eE][pP])|([nN][oO][vV])))|(((0?[1-9])|(1[0-
9])|(2[0-8]))-([fF][eE][bB])))-
(20(([13579][01345789])|([2468][1235679]))))|(((((0?[1-9])|([1-2][0-9])|(3[0-1]))-
(([jJ][aA][nN])|([mM][aA][rR])|([mM][aA][yY])|([jJ][uU][lL])|([aA][uU][gG])|([oO][cC
][tT])|([dD][eE][cC])))|(((0?[1-9])|([1-2][0-9])|(30))-
(([aA][pP][rR])|([jJ][uU][nN])|([sS][eE][pP])|([nN][oO][vV])))|(((0?[1-9])|(1[0-
9])|(2[0-9]))-([fF][eE][bB])))-(20(([13579][26])|([2468][048])))))](https://image.slidesharecdn.com/vcm4445formattedv3-140616172616-phpapp02/75/VMworld-2013-Deep-Dive-into-vSphere-Log-Management-with-vCenter-Log-Insight-28-2048.jpg)

![39
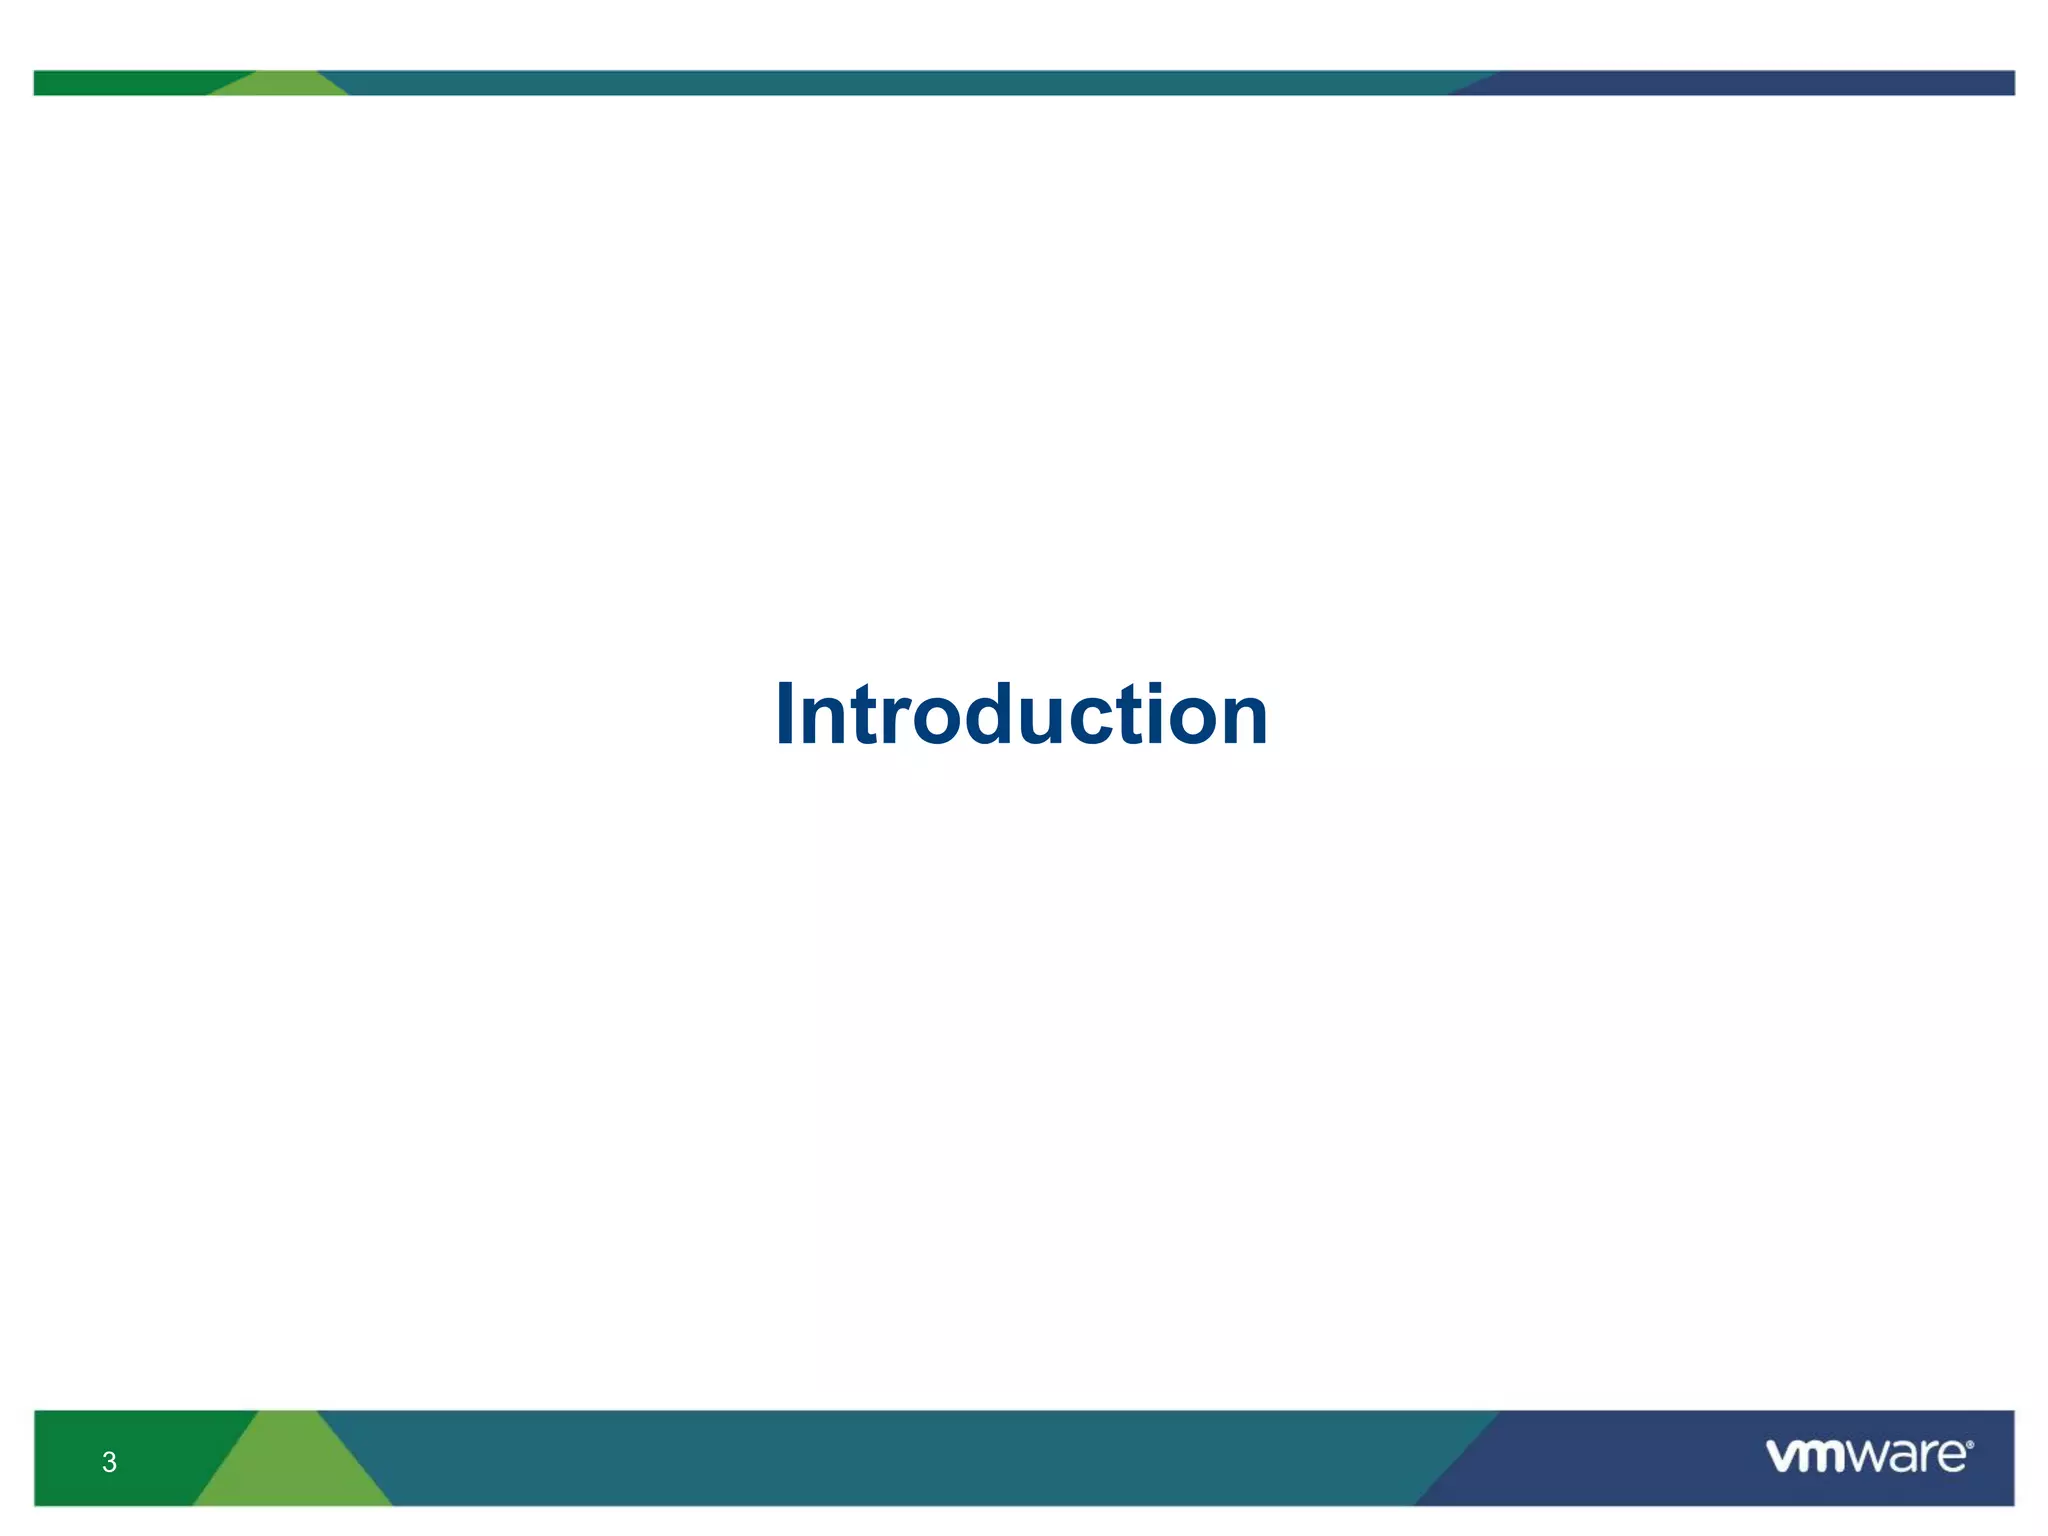
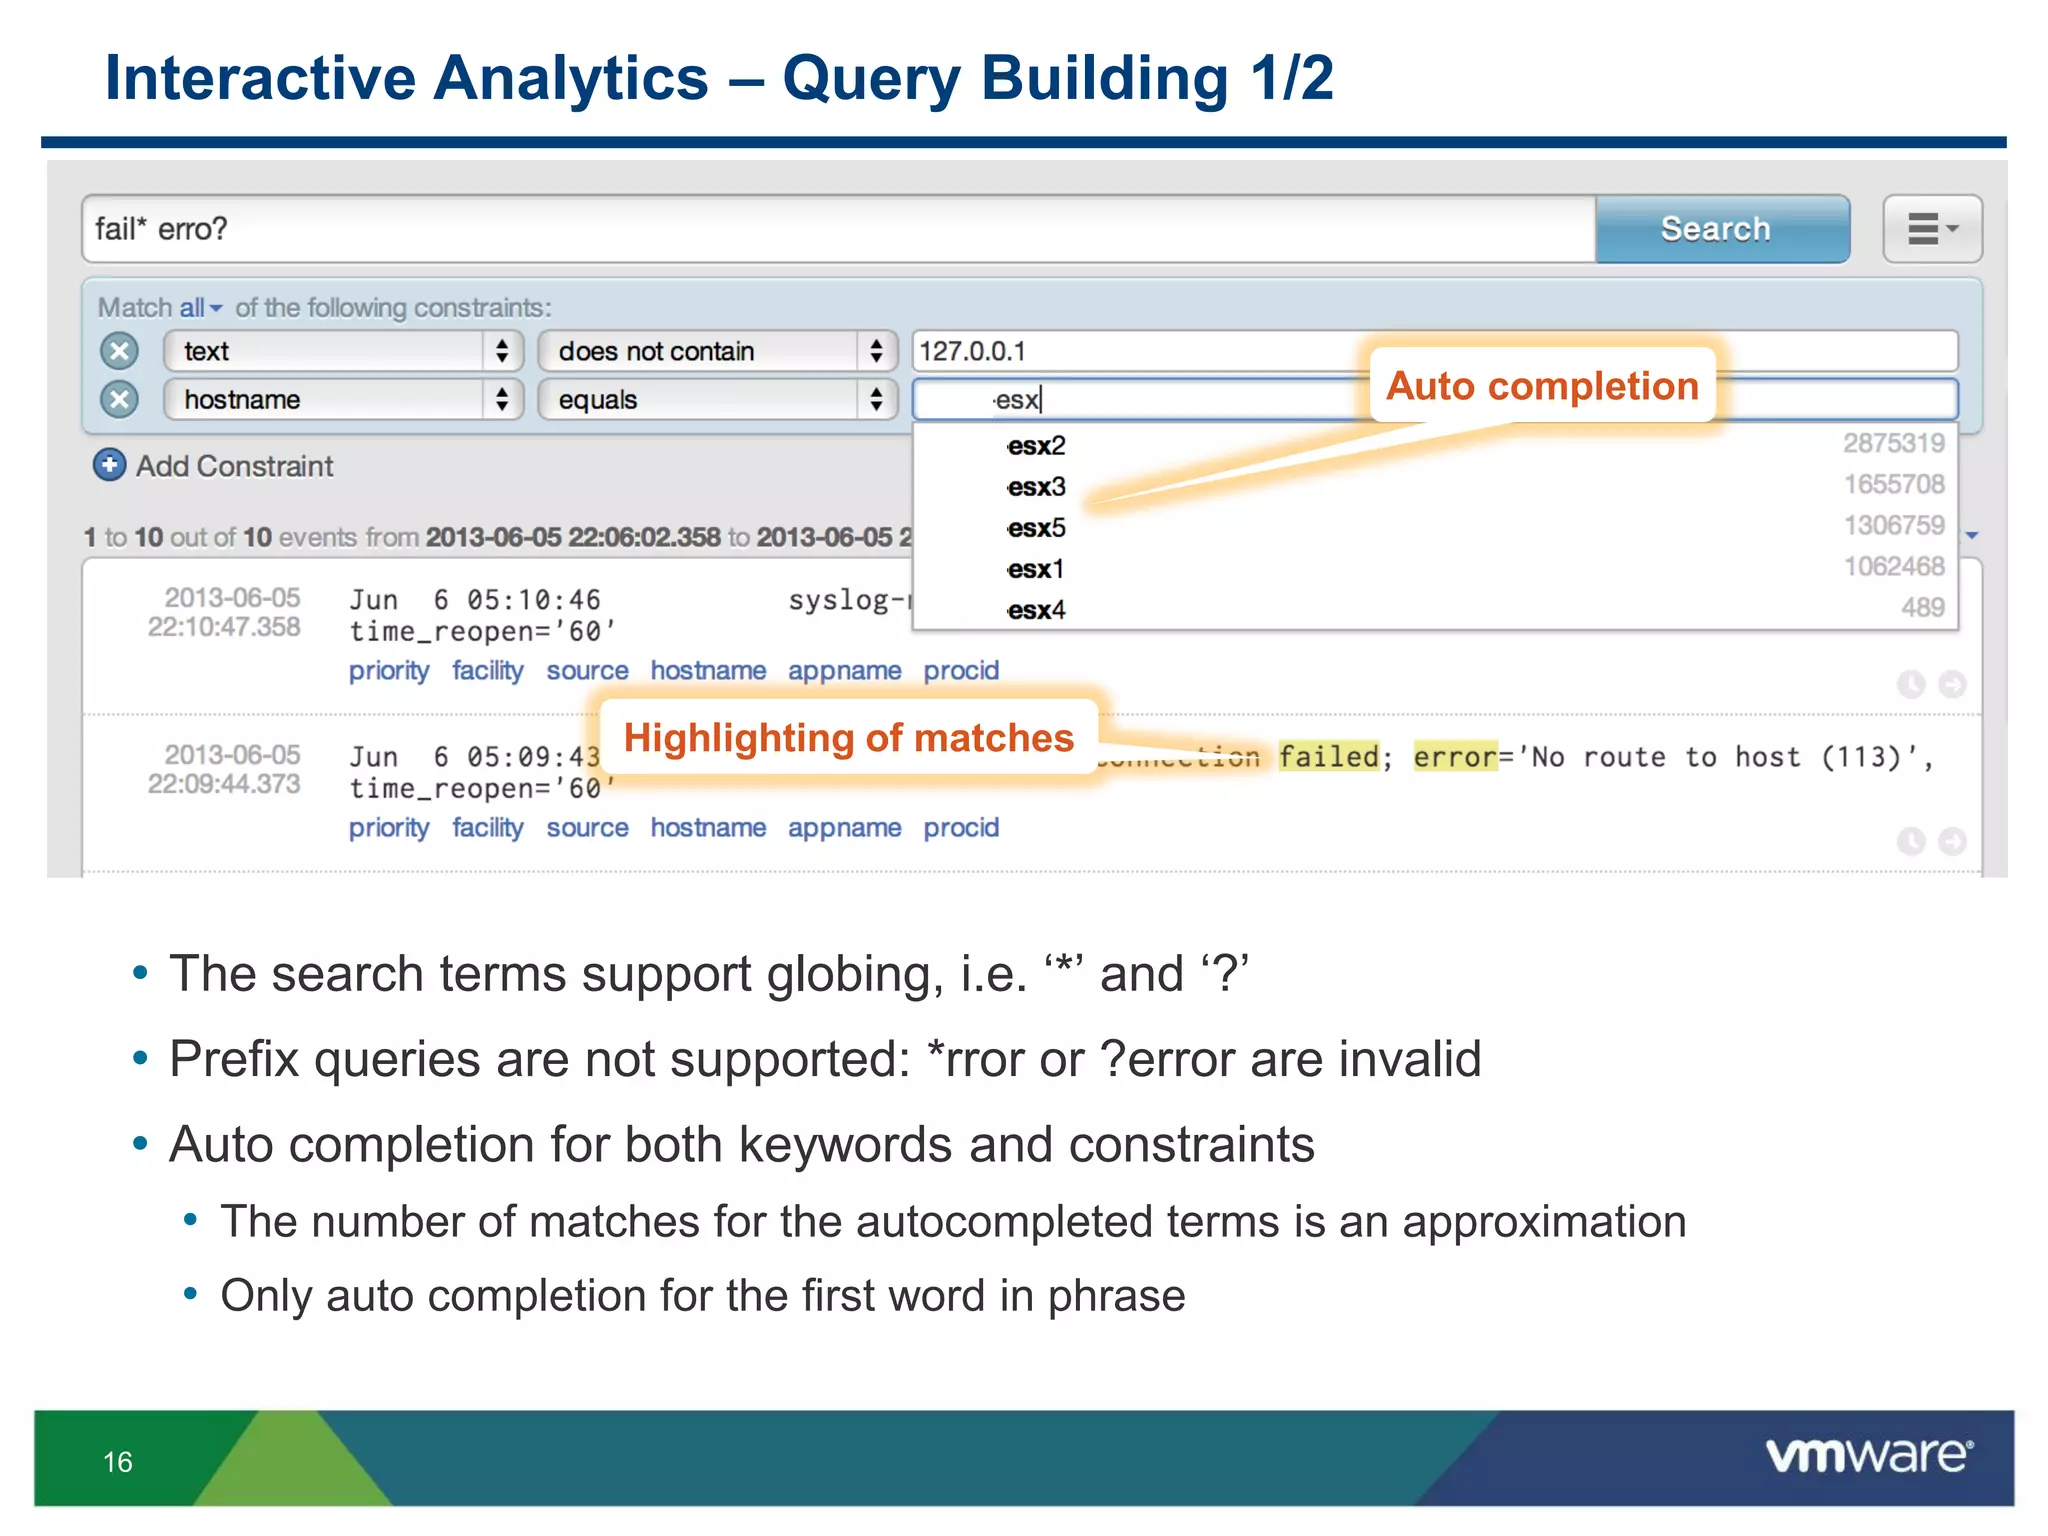
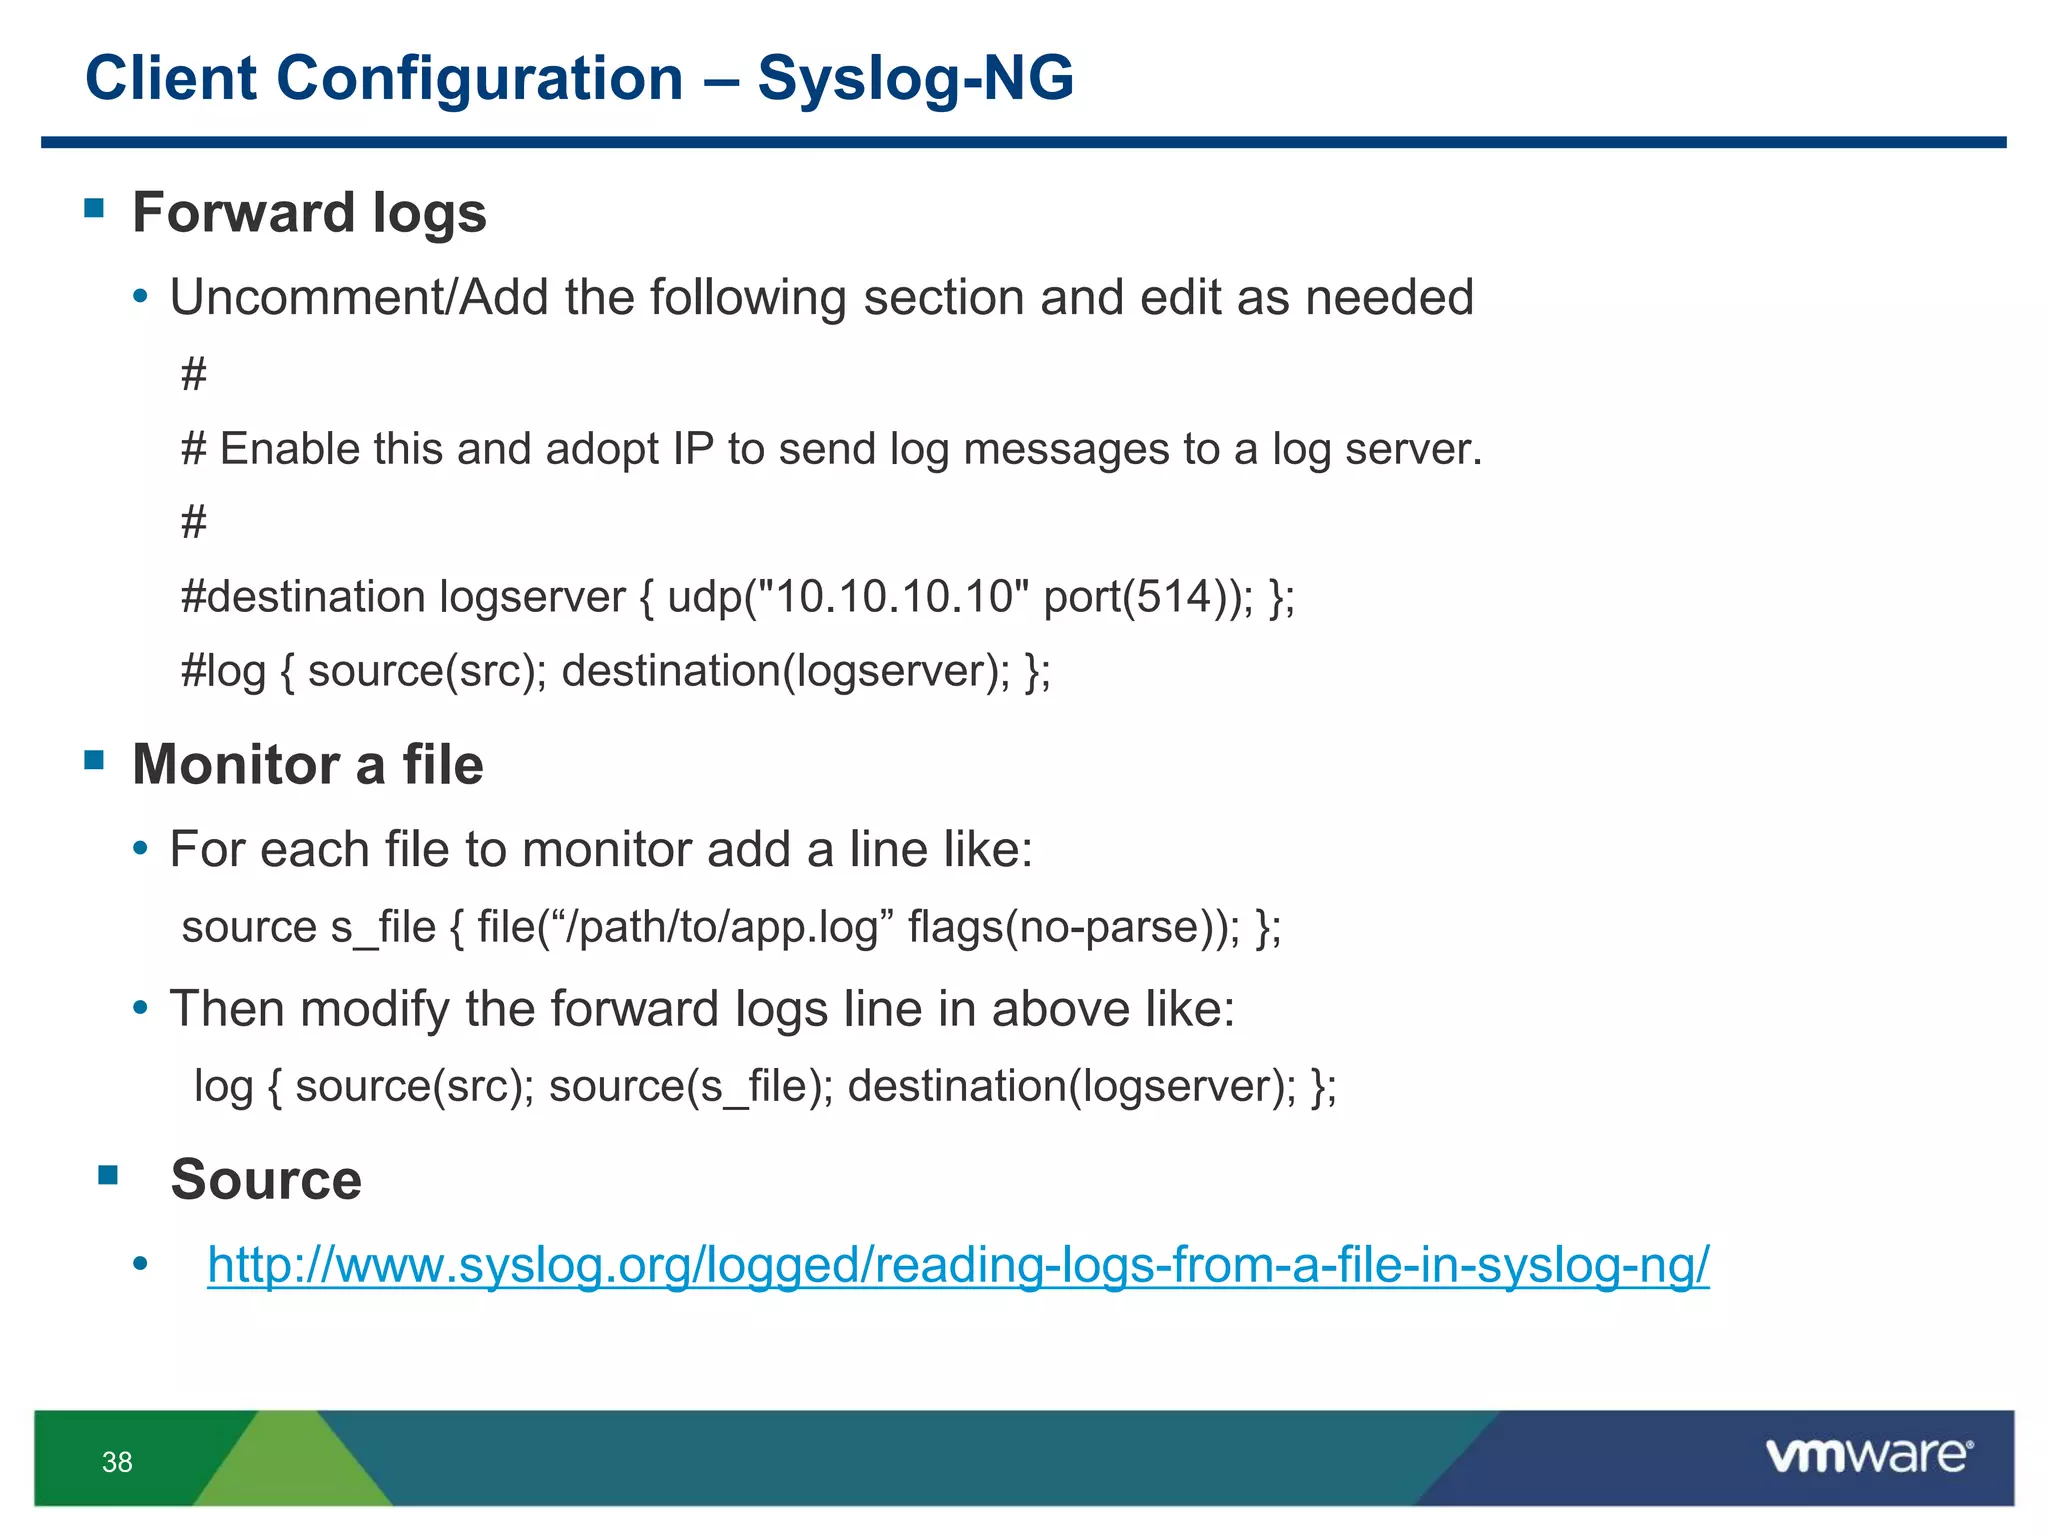
Client Configuration – Syslog-NG (Cont.)
Tag logs
• Using tags
source s_file { file(“/path/to/app.log” flags(no-parse) log_prefix(“APP: “); };
source s_file { file(“/path/to/app.log” flags(no-parse) program_override(“APP: “); };
• Using templates
destination my_file {
file("/path/to/app.log" template("$ISODATE $FULLHOST $TAG $MESSAGE"));
};
SNMP to syslog
• If running syslog-ng v3 or newer and have snmptrapd configured
filter f_snmptrapd { program(“snmptrapd”); };
rewrite r_snmptrapd { subst(“^([^ ]+) (.*)$ “, “${2}”); set(“${1}” value(“HOST”)); };
Source
• http://bazsi.blogs.balabit.com/2008/11/syslog-ng-3-0-and-snmp-traps/](https://image.slidesharecdn.com/vcm4445formattedv3-140616172616-phpapp02/75/VMworld-2013-Deep-Dive-into-vSphere-Log-Management-with-vCenter-Log-Insight-39-2048.jpg)
![48
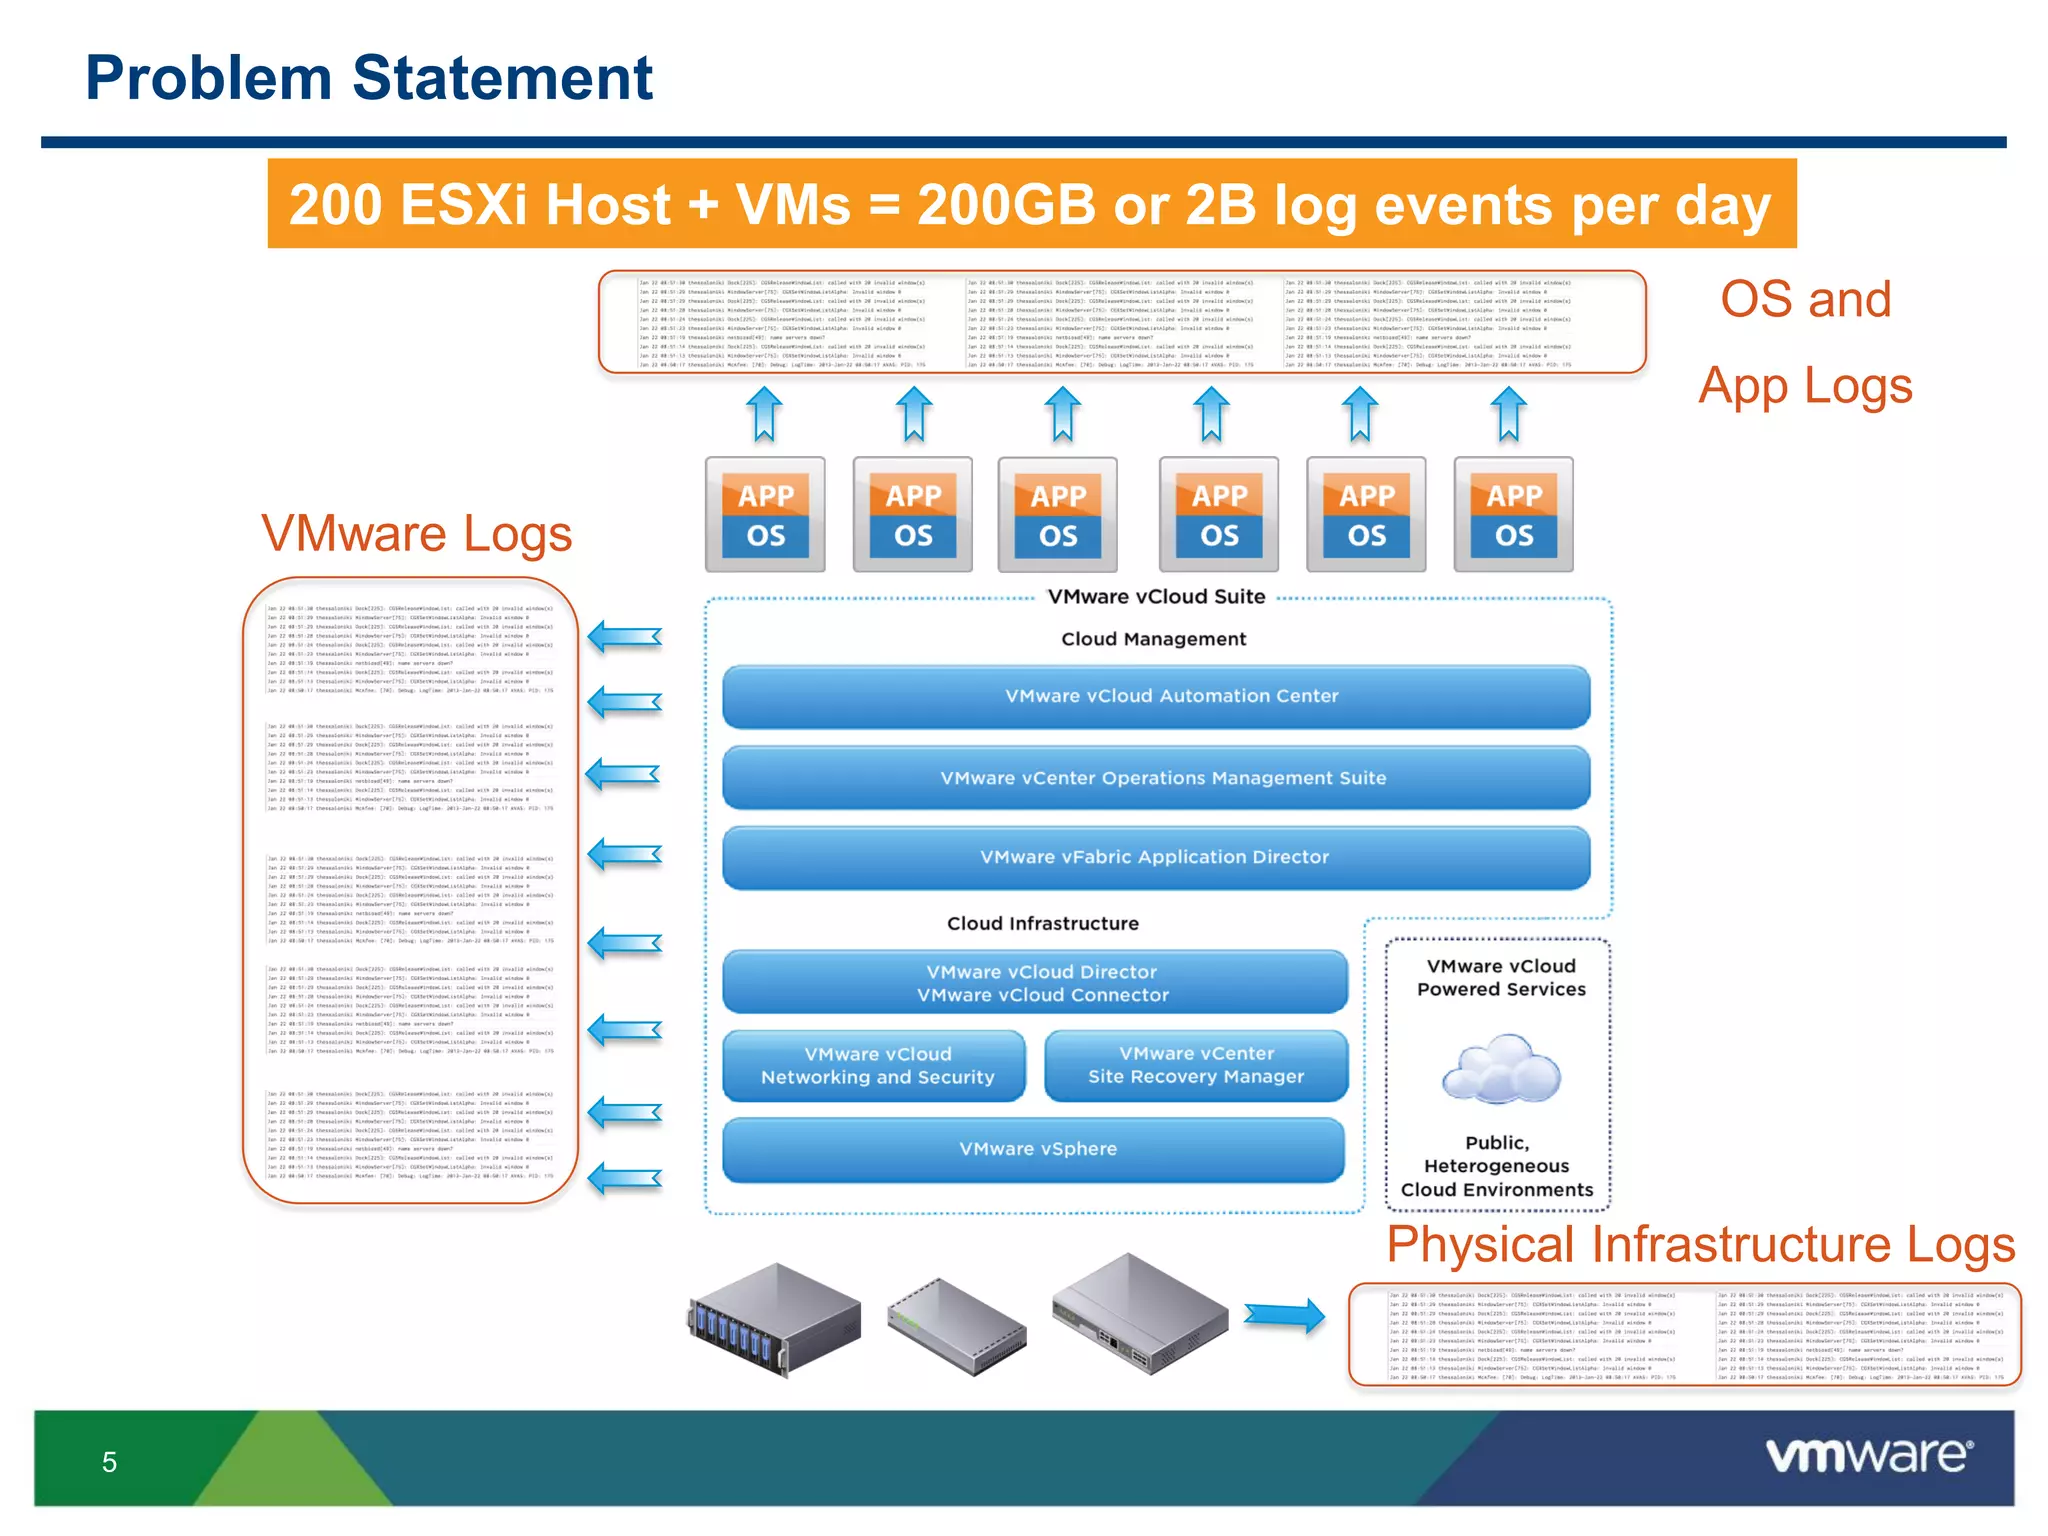
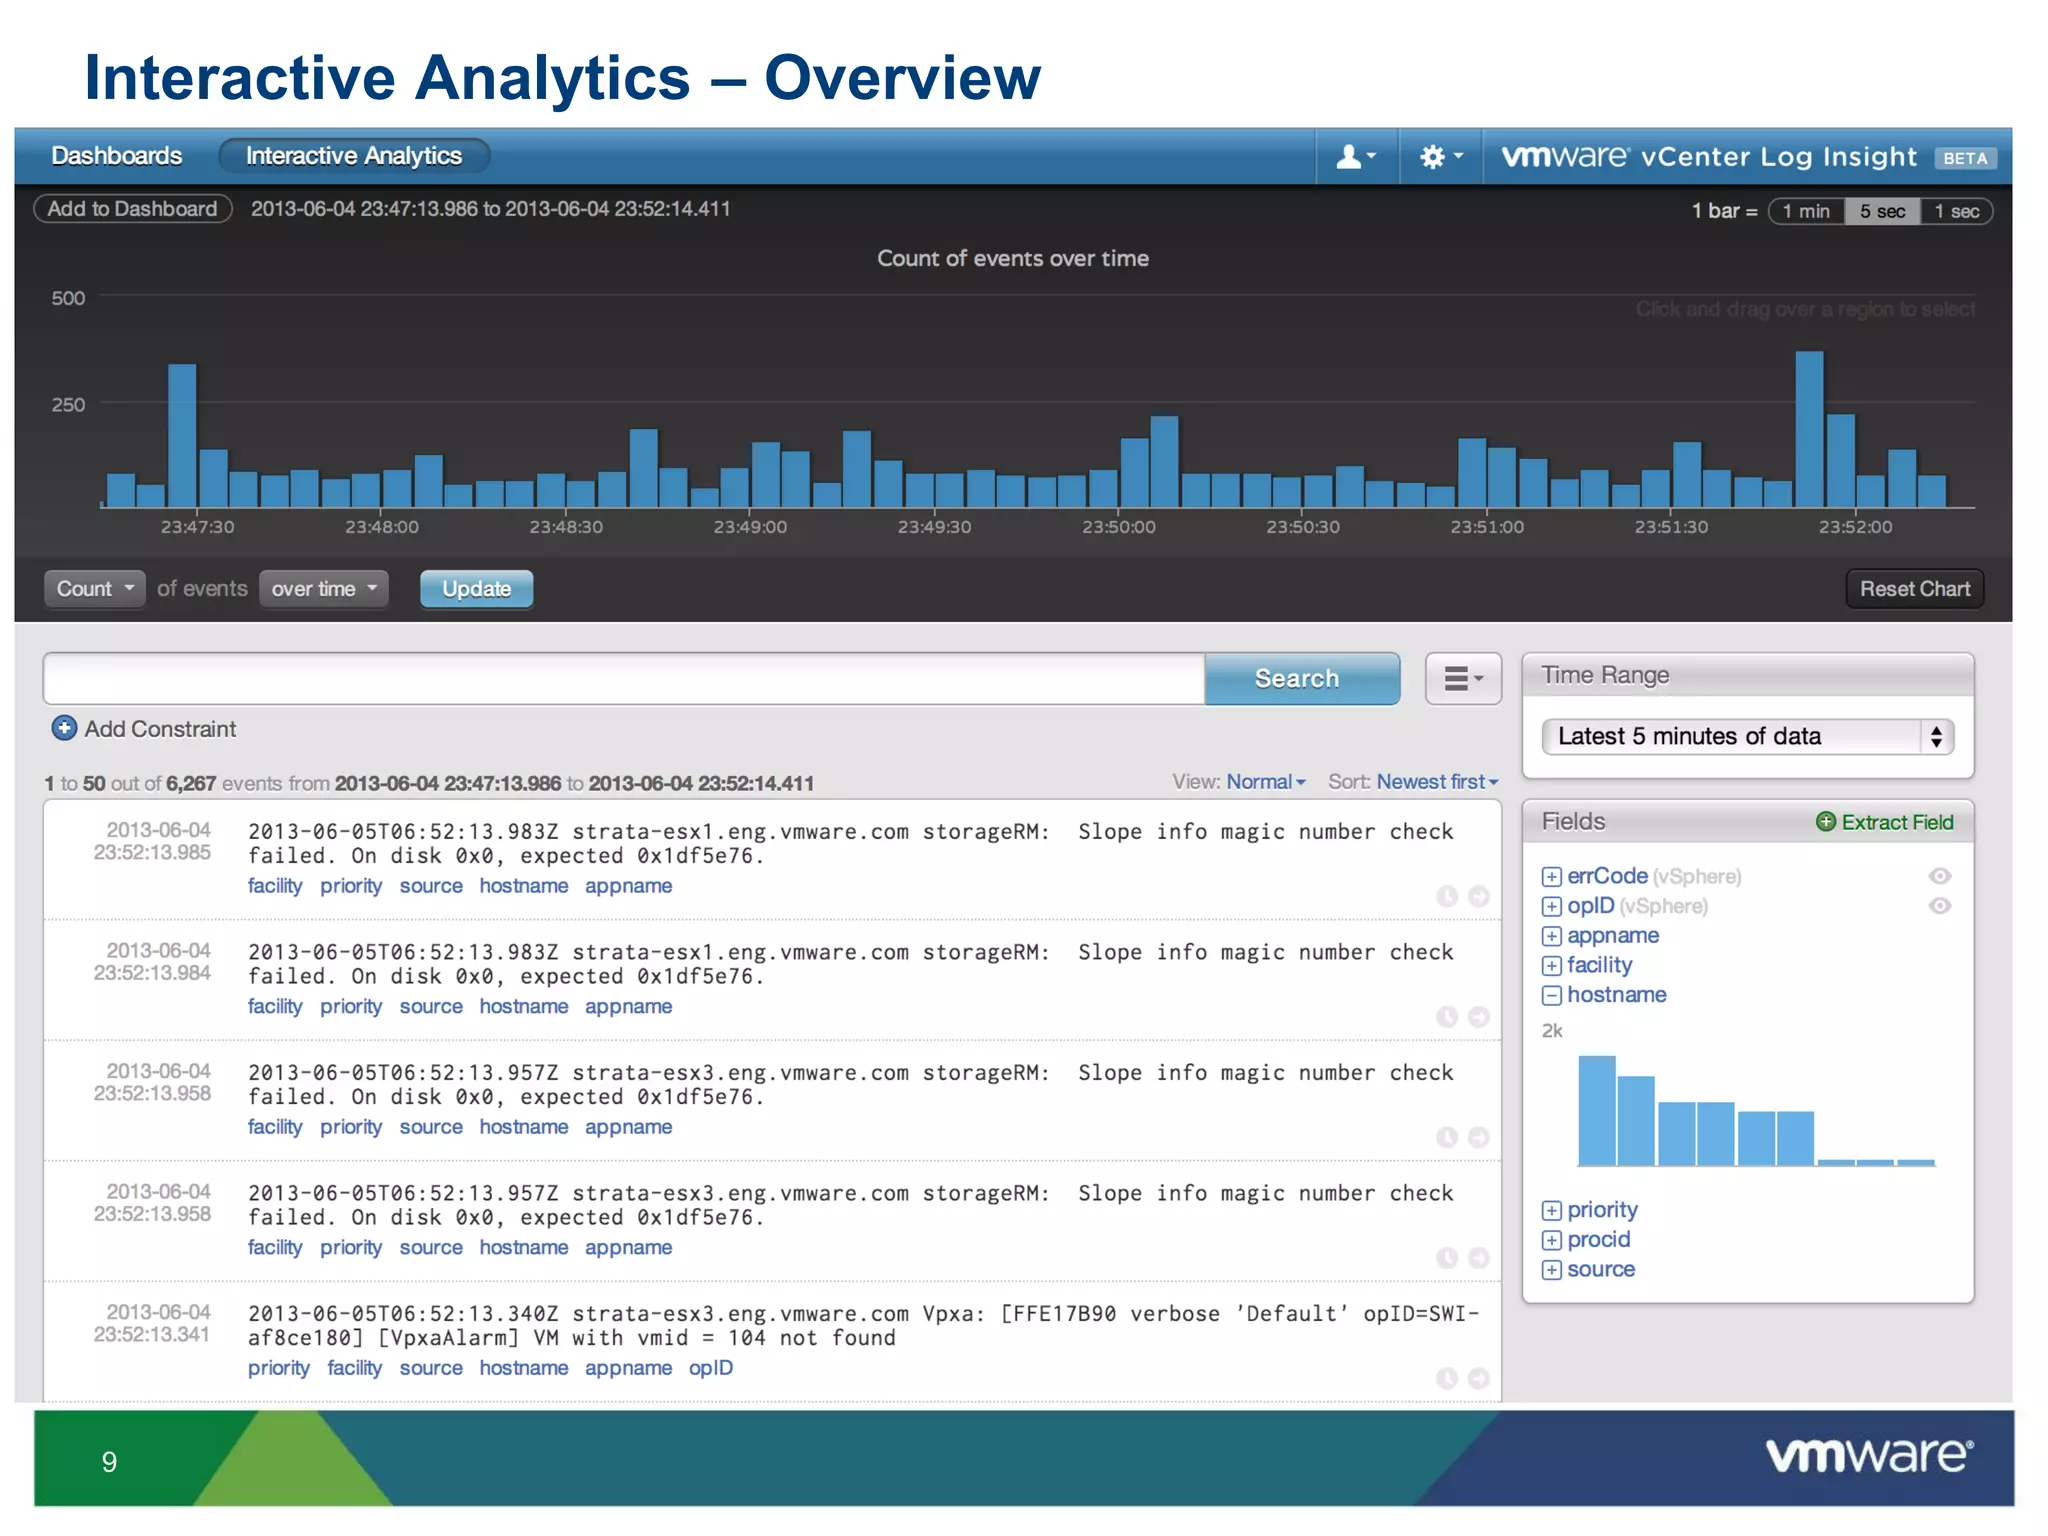
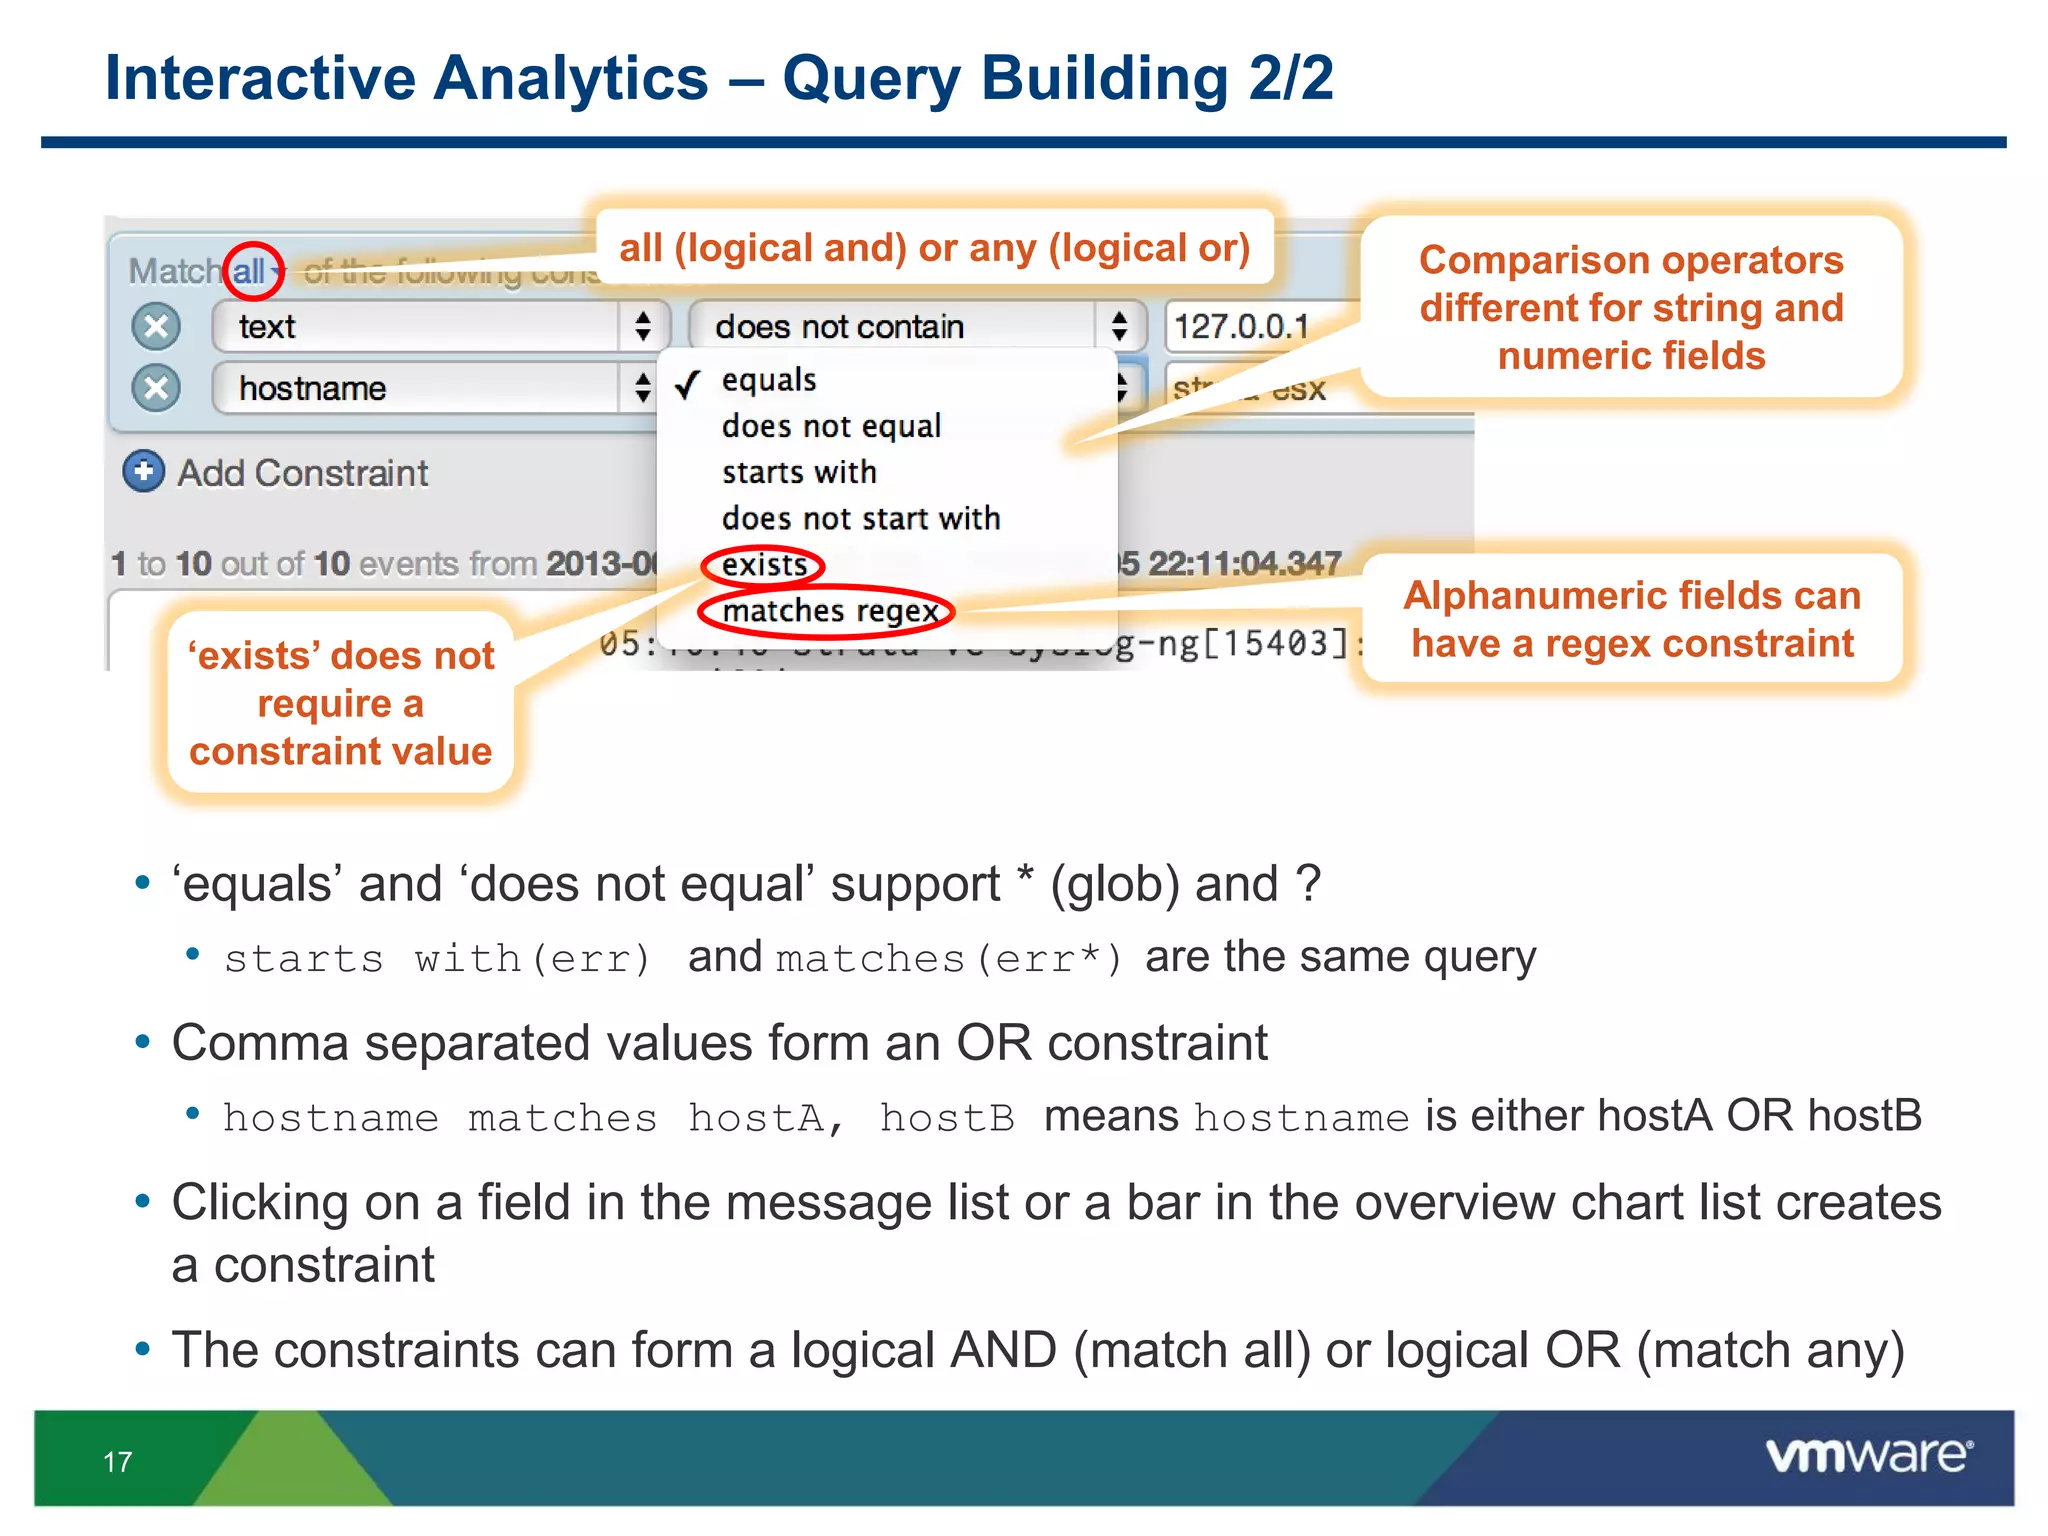
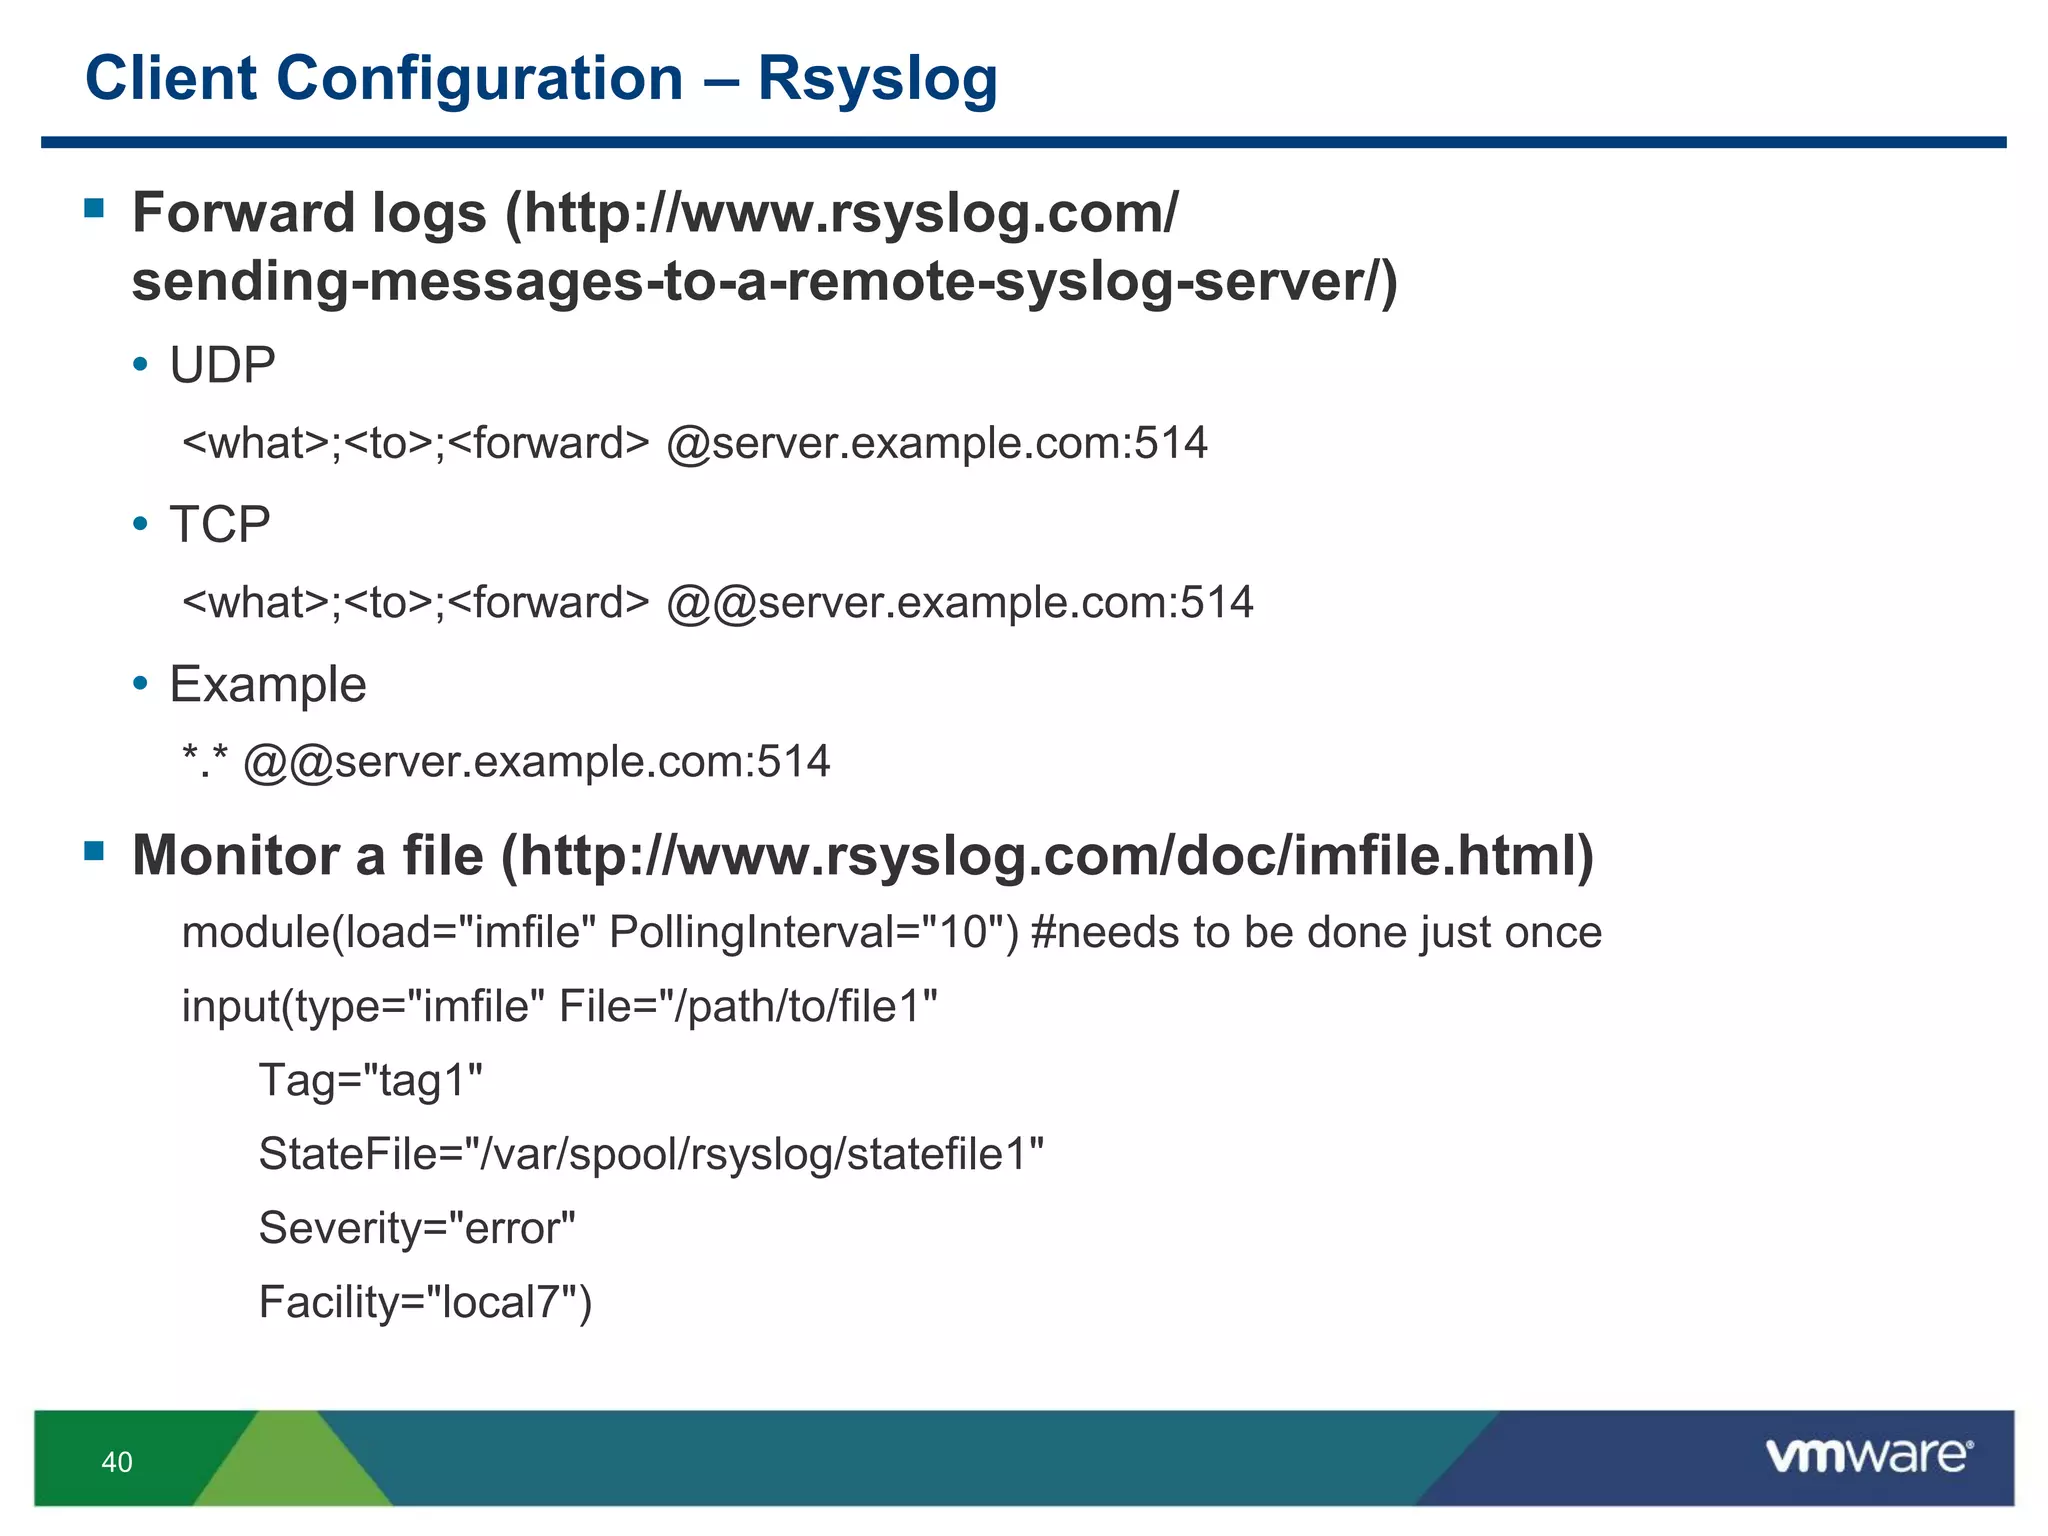
Interactive Analytics – Timestamp
• The displayed timezone is that of the browser
• The Time Range follows the browser time
• If the current time is 9pm PDT but the browser time is 8pm PDT, “Latest 5 minutes of
data” means [7:55pm PDT, 8pm PDT]
• The incoming messages are
timestamped at arrival with the
time of the Log Insight VA
It can cause a small discrepancy
between the timestamp in the timestamp
and timestamp that Log Insight uses](https://image.slidesharecdn.com/vcm4445formattedv3-140616172616-phpapp02/75/VMworld-2013-Deep-Dive-into-vSphere-Log-Management-with-vCenter-Log-Insight-48-2048.jpg)
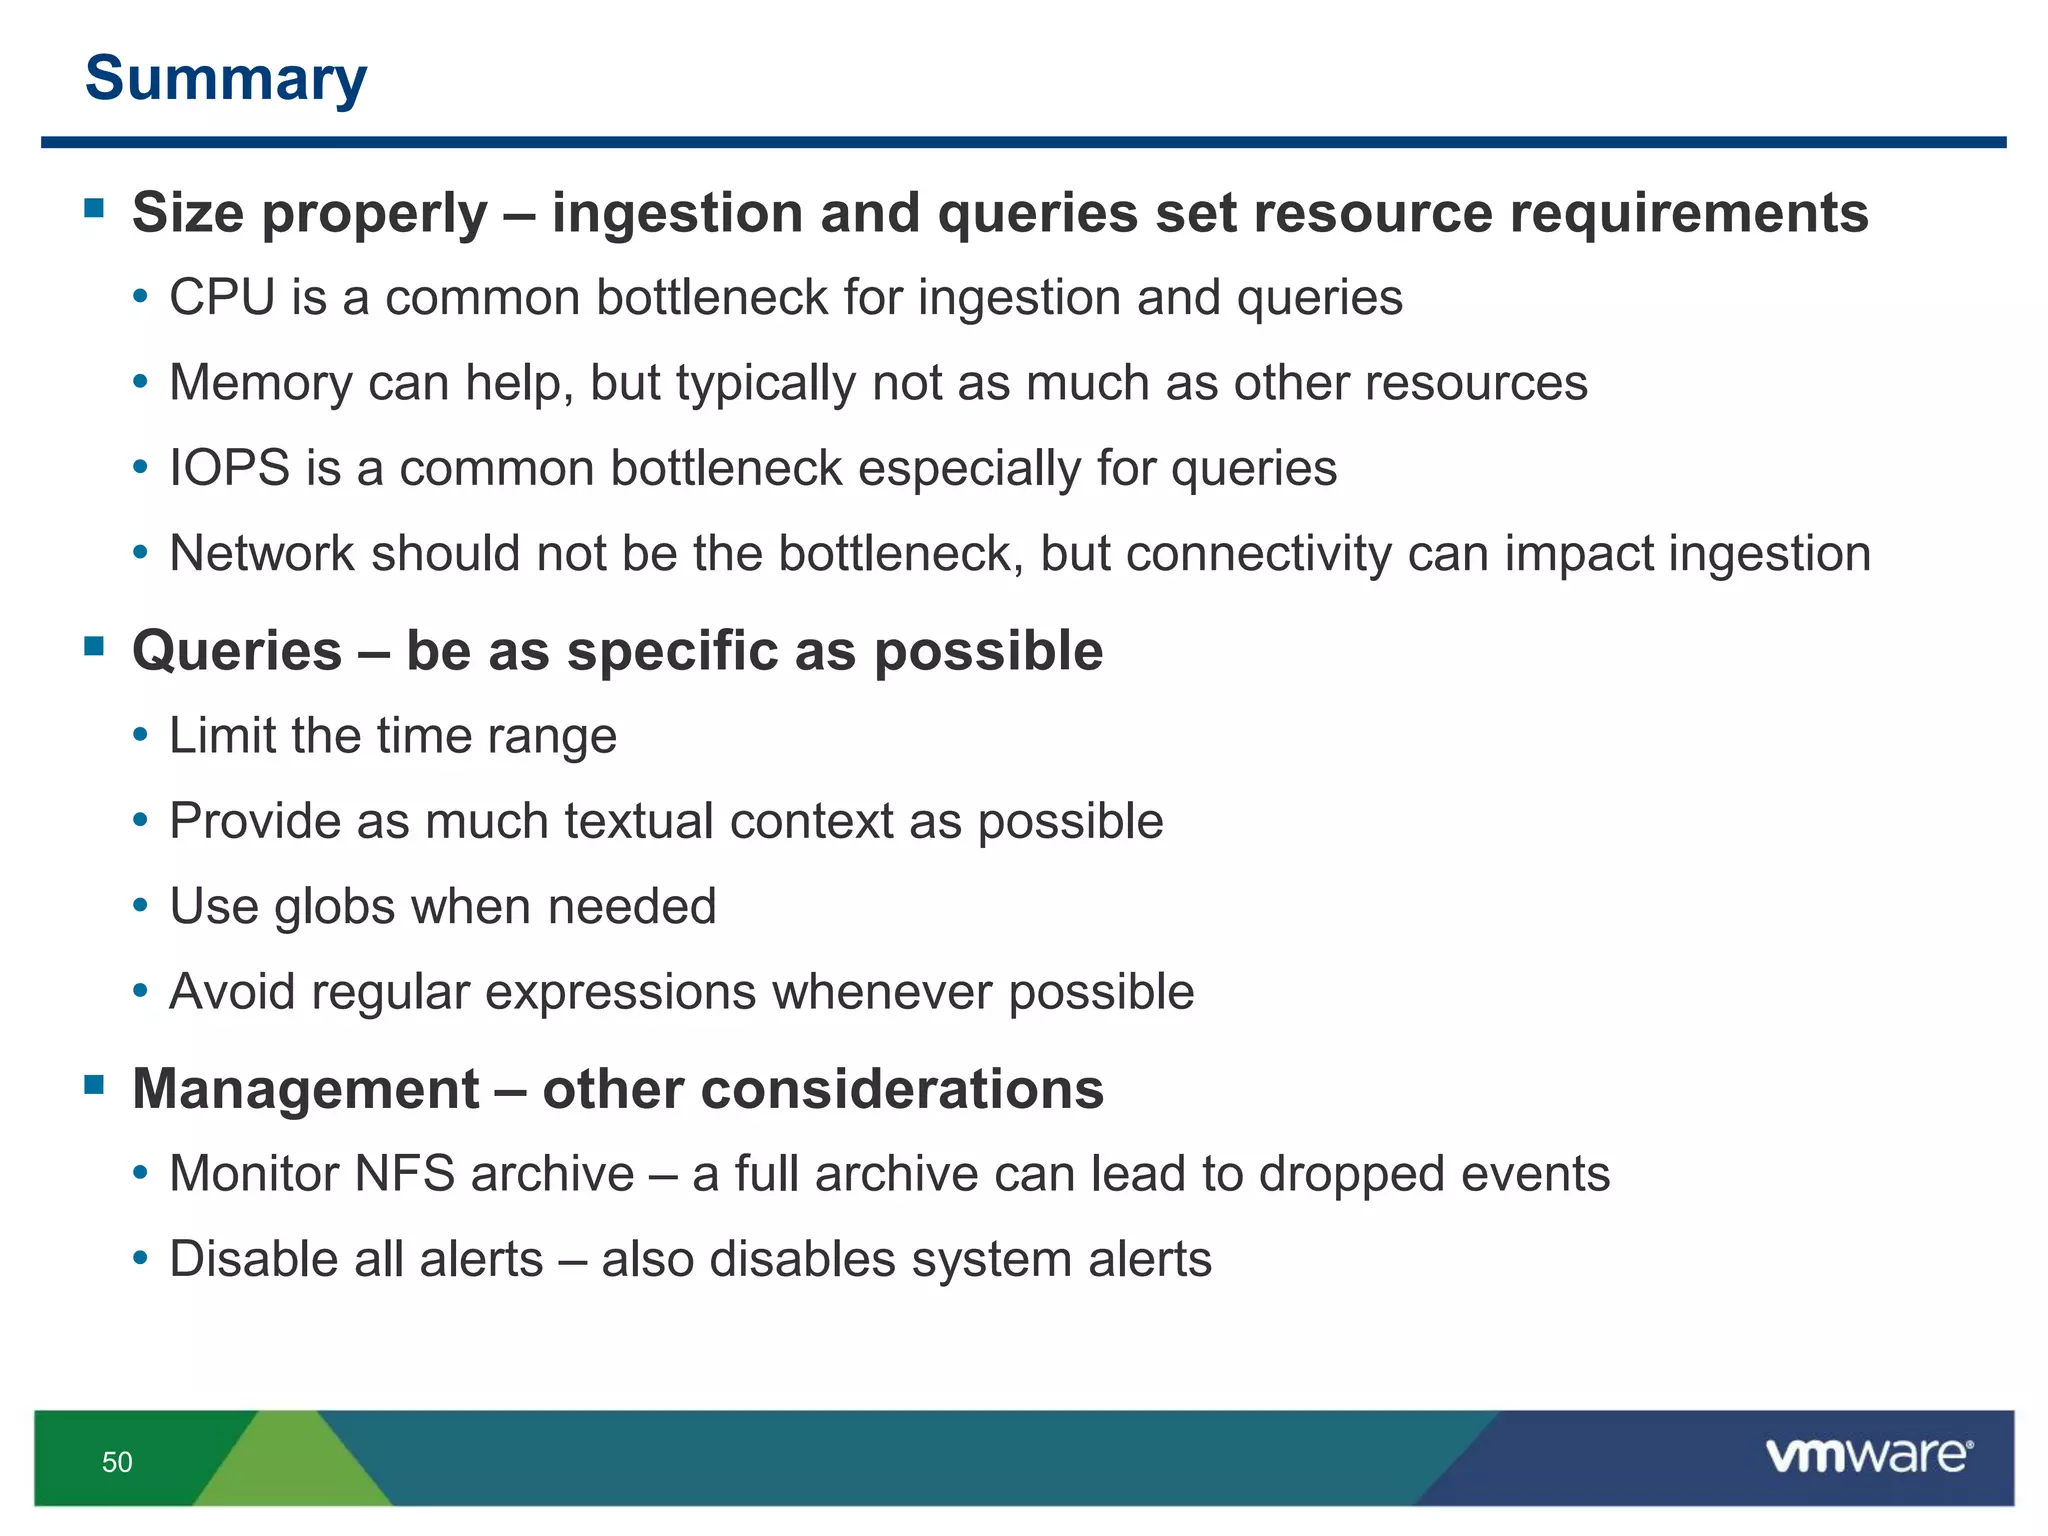


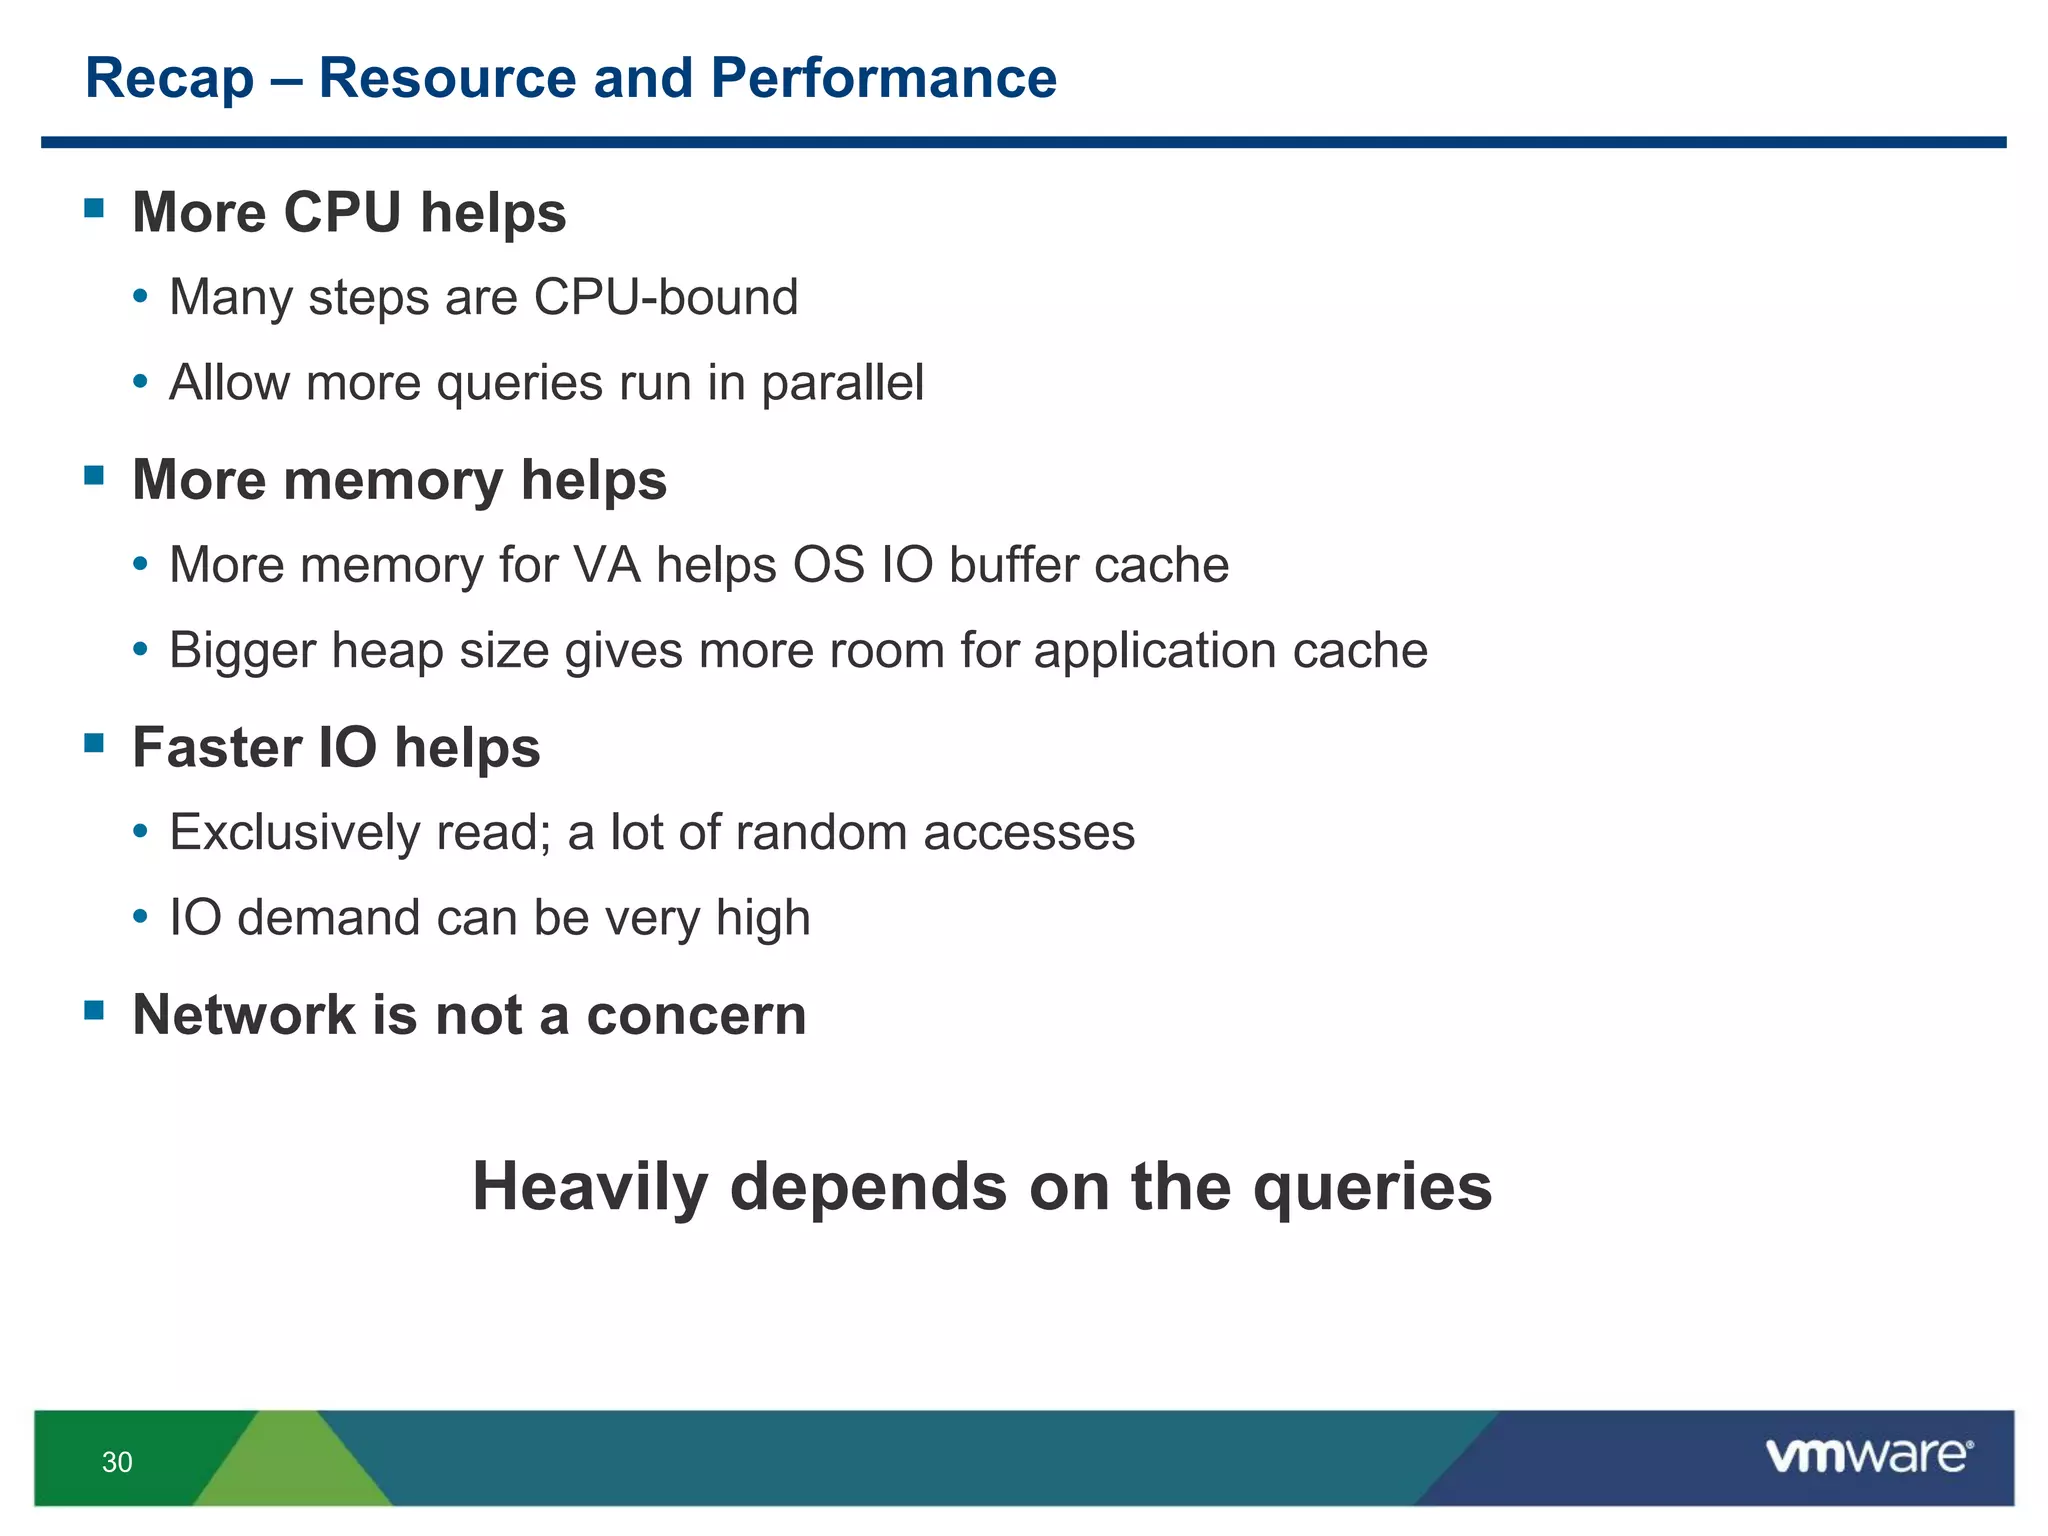
The document is a comprehensive presentation on vSphere log management using vCenter Log Insight, discussing query building, performance considerations, and log ingestion techniques. It also covers the architecture of the system, interactive analytics features, alert management, and practical client configurations for sending logs. The conclusion emphasizes managing resources effectively to improve overall log management performance.


![Vibe Coding vs. Spec-Driven Development [Free Meetup]](https://cdn.slidesharecdn.com/ss_thumbnails/vibecodingvsspecdrivendevelopment-251209105622-43f455e7-thumbnail.jpg?width=640&height=640&fit=bounds)


