This document discusses Vulcan Materials Company's implementation of spend analytics using Spend Radar. Vulcan Materials is the largest producer of construction aggregates in the US. The summary is:
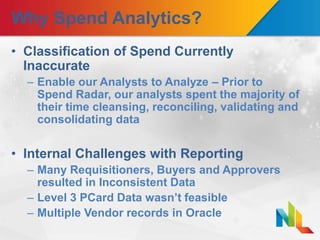
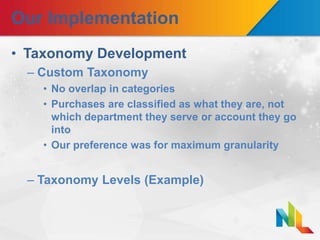
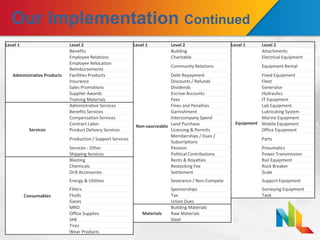
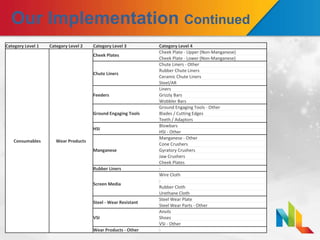
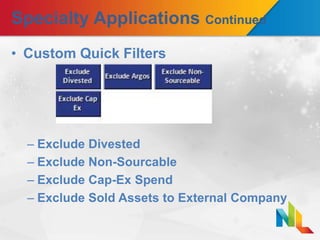
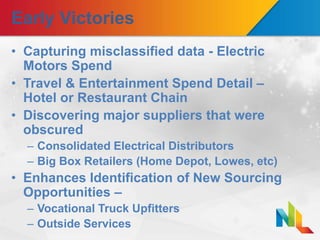
Vulcan Materials implemented spend analytics to gain accurate spend classification and consolidation of data from multiple sources. Spend Radar provided a custom taxonomy and initially classified spend to 95% accuracy. Vulcan used drill-down dashboards and custom reports for compliance, market share analysis, and managing organizational changes. Early victories included capturing misclassified spend and identifying obscured major suppliers. Vulcan Materials leverages spend analytics for sourcing opportunities and across financial, tax, audit, and operations functions.