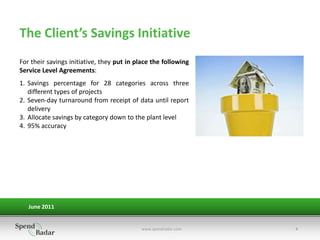
Spend Radar’s Award-Winning
  Spend Analysis Case Study


June 2011


            www.spendradar.com   1
Background
Spend Radar was contacted by a leading
Business Process Outsourcing (BPO) provider to
support their multi-year agreement to provide
strategic sourcing and spend management for
their client - a global 200 consumer packaged
goods manufacturing company.


  June 2011


                                       www.spendradar.com   2
The Client’s Cost Cutting Initiative
The client had an ambitious plan for cost cutting.
Cost-cutting programs had been implemented that
represented less than 3% percent of their cost of goods
and the client was pushing for that figure to be more
than 4%.


   June 2011


                                          www.spendradar.com   3
The Client’s Savings Initiative
For their savings initiative, they put in place the following
Service Level Agreements:
1. Savings percentage for 28 categories across three
   different types of projects
2. Seven-day turnaround from receipt of data until report
   delivery
3. Allocate savings by category down to the plant level
4. 95% accuracy


   June 2011


                                           www.spendradar.com   4
Spend Radar’s Responsibilities
Specifically, Spend Radar was responsible for
collecting, cleansing and classifying spend data
from over 90 global locations.


But it didn’t stop there. After identifying the savings opportunities, Spend Radar was responsible
for tracking and allocating the savings back to the various operating companies, product lines,
spend categories and plant locations.


   June 2011


                                          www.spendradar.com                                    5
The Project
All projects at Spend Radar follow a six-step
process outlined in our Project Excellence program.

This program was implemented to ensure the
consistency and quality of all of our projects.


  June 2011


                                         www.spendradar.com   6
Step One: Project Kickoff
Each client is designated a project manager that is
responsible for keeping the project on target, on
time and on budget, as well as ensuring that the
client is kept up to date.
Introductions are made, roles are defined and
communication guidelines are set.


The project kickoff is also used to ensure that we clearly understand the client’s business, an
important aspect when determining categories and classification codes. A commodity that is
classified as MRO for one company may be classified as a direct spend for another.


   June 2011


                                         www.spendradar.com                                  7
Step Two: Acquiring the Data
Within one day of receiving the 1.5 gigabytes of spend data, the       Fast Facts:
data was uploaded to Spend Radar’s Data Manager, a master data
                                                                        1.5G of spend data
management (MDM) module designed specifically for spend data.
                                                                        +$20B in global spend
All of the data had been extracted from multiple SAP instances. This
data represented over $20 billion in annual global                      90 global locations
spend, representing the following four high-level indirect spend        1 day to upload
categories:
                                                                        4 indirect categories
 1.   Manufacturing Equipment
                                                                        4 SLAs
 2.   Corporate Services
 3.   Information Technology and Telecommunications                     95% accuracy
 4.   Human Resources and Professional Services


   June 2011


                                         www.spendradar.com                                      8
Step Three: Cleansing and Classifying the Data
All data is collected and stored in the Spend Radar Data
Manager module and managed by an internal team of solutions
consultants that have been fully informed of the company’s
business-specific categorization needs.
The Data Manager’s Rule Builder creates, edits and manages
company-specific supplier and transaction classification rules.
Based on our extensive history with data classification, we have
also included pre-built, commonly used rules into the
application to assist with the classification process.

Without the use of this flexible master data management module, a quick turnaround would not
have been possible.


  June 2011


                                          www.spendradar.com                               9
Step Four: Client Workshops & Business Reviews
Constant, immediate feedback from the BPO as well
as the client allowed us to complete the cleansing
and classification within three weeks. The BPO had
visibility into the process at all times, ensuring that
the data was being cleansed and classified in a
manner consistent with the BPO’s sourcing strategies.


The data was cleansed at 95% accuracy – a level of accuracy that was agreed upon by the client.
We used our data accuracy model to ensure this SLA was achieved. The data accuracy model is a
formula that is used to generate a representative sample of an overall data set that is approved
by the client.


   June 2011


                                           www.spendradar.com                                10
Step Five: Delivery of Reporting and Analysis
The BPO leveraged the Spend Radar Reporting and Analysis
module, allowing the end users to create reports, analyses and         “We’ve been struggling to
                                                                       pull this data together for
views in mere seconds, with minimal to no training. And               months. I’m amazed at how
because the tool is easy to use, end users could manipulate              quickly this project was
reports and analyses on their own, without the need for IT or                          delivered.”
senior analyst support.                                                                  -Finance
Once the savings were identified, we:
 Tracked and allocated the savings back to the various operating companies, product
  lines, spend categories and plant locations using an organizational hierarchy that we
  incorporated into the Data Manager module.
 Integrated sourcing award savings data and cost allocation percentages by business
  unit, plant, etc., as per the organizational financial model and as desired.
 Applied the savings and cost allocation percentages back to the business units, plants and
  locations as defined by the organizational hierarchy and savings allocation model.


   June 2011


                                        www.spendradar.com                                    11
Step Six: Ongoing Data Refreshes
Since the initial cleansing and classification process, we
have been conducting ongoing monthly refreshes of the
client’s spend data. Monthly refreshes are made possible
by the extensive initial cleansing and classification process
that we conducted. Company-specific rules for item
classification were created that can be used for all future
refreshes and changes and additions can easily be made.


   June 2011


                                            www.spendradar.com   12
Challenges

The challenge for this project was incorporating a
customer-specific financial allocation model within Data
Manager. This was not standard functionality and
required custom development to accomplish. The client
provided their organizational hierarchy and allocation
model, and we were able to include this information into
Spend Radar’s Data Manager.


All software customization is done in-house so we have complete control over timelines and can
quickly adapt to new customer requests. And since Data Manager is offered as Software-as-a-
Service (SaaS), once the enhancements were complete they became available to all clients.


  June 2011


                                        www.spendradar.com                                 13
Results
This case study describes an advanced spend
management project that resulted in:
  Merging global spend from over 90 locations
  Providing indisputable proof of realized cost
   reductions
  Providing insight into forthcoming cost
   reductions
  Relating impact to the bottom line by product
   line, operating company, category and location


                                      www.spendradar.com   14
Key Takeaways
The most important lesson of this or any other spend analysis
project is that spend analysis is not simply about identifying
potential cost-reduction opportunities. Any savings should
then be measured, validated and tracked so that true success
can be quantified and managed in an ongoing, repeatable
manner.


And for some businesses, it is critical to ultimately trace back and allocate any realized cost
reductions directly to the individual locations or business units. Not all organizations manage
their savings and cost allocations directly to each individual organizational entity, but for the
many that do, having a spend analysis solution that can fully manage this process in an
indisputable manner is critical.


  June 2011


                                         www.spendradar.com                                   15
Conclusion
Managing costs has always been important. In the
current economic climate, it is imperative. However,
the promise and hype of spend analysis has left much
to be desired from previous generations of spend
analysis solutions. Unlike our predecessors, Spend
Radar is delivering fast, accurate and measurable
impact to our customer’s bottom line. Isn’t that what
spend management is all about?


This case study outlines the real-world experiences of this team and their project. We hope that
you are able to learn from and leverage this insight to define and implement a successful spend
management project at your company.

   June 2011


                                          www.spendradar.com                                   16
Award-Winning
Upon completion of the initial phase of this project, the
team at Spend Radar realized they had accomplished
something special – a twist on the typical spend analysis
project that provided even greater savings and sourcing
opportunities. When submissions for the Supply &
Demand Chain Executive 100 became available, we knew
that we had to submit this project for
consideration, illustrating the tangible benefits that can be
achieved through spend analysis. We’re pleased to
announce that this project resulted in winning this
prestigious award.


Supply & Demand Chain Executive is the executive's user manual for successful supply and demand chain transformation, utilizing hard-hitting
analysis, viewpoints and unbiased case studies to steer executives and supply management professionals through the complicated, yet critical, world of
supply and demand chain enablement to gain competitive advantage. It is located on the web at www.SDCExec.com. Ten years ago, Supply & Demand
Chain Executive announced its first "100" list of supply chain solution providers, consultants and other organizations that were helping lead the way in
transforming companies' supply and demand chains. To learn more about this award, visit www.sdce.com/content/awards.jsp..


    June 2011


                                                                 www.spendradar.com                                                                 17
Contact Us to Learn More
Spend Radar
311 S. Wacker Drive
Suite 2270
Chicago, IL 60606
+1 312.262.9810
sales@spendradar.com
www.spendradar.com
www.spendradar.com/blog


  June 2011


                          www.spendradar.com   18

Allocating Savings Using Spend Analysis

  • 1.
    Spend Radar’s Award-Winning Spend Analysis Case Study June 2011 www.spendradar.com 1
  • 2.
    Background Spend Radar wascontacted by a leading Business Process Outsourcing (BPO) provider to support their multi-year agreement to provide strategic sourcing and spend management for their client - a global 200 consumer packaged goods manufacturing company. June 2011 www.spendradar.com 2
  • 3.
    The Client’s CostCutting Initiative The client had an ambitious plan for cost cutting. Cost-cutting programs had been implemented that represented less than 3% percent of their cost of goods and the client was pushing for that figure to be more than 4%. June 2011 www.spendradar.com 3
  • 4.
    The Client’s SavingsInitiative For their savings initiative, they put in place the following Service Level Agreements: 1. Savings percentage for 28 categories across three different types of projects 2. Seven-day turnaround from receipt of data until report delivery 3. Allocate savings by category down to the plant level 4. 95% accuracy June 2011 www.spendradar.com 4
  • 5.
    Spend Radar’s Responsibilities Specifically,Spend Radar was responsible for collecting, cleansing and classifying spend data from over 90 global locations. But it didn’t stop there. After identifying the savings opportunities, Spend Radar was responsible for tracking and allocating the savings back to the various operating companies, product lines, spend categories and plant locations. June 2011 www.spendradar.com 5
  • 6.
    The Project All projectsat Spend Radar follow a six-step process outlined in our Project Excellence program. This program was implemented to ensure the consistency and quality of all of our projects. June 2011 www.spendradar.com 6
  • 7.
    Step One: ProjectKickoff Each client is designated a project manager that is responsible for keeping the project on target, on time and on budget, as well as ensuring that the client is kept up to date. Introductions are made, roles are defined and communication guidelines are set. The project kickoff is also used to ensure that we clearly understand the client’s business, an important aspect when determining categories and classification codes. A commodity that is classified as MRO for one company may be classified as a direct spend for another. June 2011 www.spendradar.com 7
  • 8.
    Step Two: Acquiringthe Data Within one day of receiving the 1.5 gigabytes of spend data, the Fast Facts: data was uploaded to Spend Radar’s Data Manager, a master data  1.5G of spend data management (MDM) module designed specifically for spend data.  +$20B in global spend All of the data had been extracted from multiple SAP instances. This data represented over $20 billion in annual global  90 global locations spend, representing the following four high-level indirect spend  1 day to upload categories:  4 indirect categories 1. Manufacturing Equipment  4 SLAs 2. Corporate Services 3. Information Technology and Telecommunications  95% accuracy 4. Human Resources and Professional Services June 2011 www.spendradar.com 8
  • 9.
    Step Three: Cleansingand Classifying the Data All data is collected and stored in the Spend Radar Data Manager module and managed by an internal team of solutions consultants that have been fully informed of the company’s business-specific categorization needs. The Data Manager’s Rule Builder creates, edits and manages company-specific supplier and transaction classification rules. Based on our extensive history with data classification, we have also included pre-built, commonly used rules into the application to assist with the classification process. Without the use of this flexible master data management module, a quick turnaround would not have been possible. June 2011 www.spendradar.com 9
  • 10.
    Step Four: ClientWorkshops & Business Reviews Constant, immediate feedback from the BPO as well as the client allowed us to complete the cleansing and classification within three weeks. The BPO had visibility into the process at all times, ensuring that the data was being cleansed and classified in a manner consistent with the BPO’s sourcing strategies. The data was cleansed at 95% accuracy – a level of accuracy that was agreed upon by the client. We used our data accuracy model to ensure this SLA was achieved. The data accuracy model is a formula that is used to generate a representative sample of an overall data set that is approved by the client. June 2011 www.spendradar.com 10
  • 11.
    Step Five: Deliveryof Reporting and Analysis The BPO leveraged the Spend Radar Reporting and Analysis module, allowing the end users to create reports, analyses and “We’ve been struggling to pull this data together for views in mere seconds, with minimal to no training. And months. I’m amazed at how because the tool is easy to use, end users could manipulate quickly this project was reports and analyses on their own, without the need for IT or delivered.” senior analyst support. -Finance Once the savings were identified, we:  Tracked and allocated the savings back to the various operating companies, product lines, spend categories and plant locations using an organizational hierarchy that we incorporated into the Data Manager module.  Integrated sourcing award savings data and cost allocation percentages by business unit, plant, etc., as per the organizational financial model and as desired.  Applied the savings and cost allocation percentages back to the business units, plants and locations as defined by the organizational hierarchy and savings allocation model. June 2011 www.spendradar.com 11
  • 12.
    Step Six: OngoingData Refreshes Since the initial cleansing and classification process, we have been conducting ongoing monthly refreshes of the client’s spend data. Monthly refreshes are made possible by the extensive initial cleansing and classification process that we conducted. Company-specific rules for item classification were created that can be used for all future refreshes and changes and additions can easily be made. June 2011 www.spendradar.com 12
  • 13.
    Challenges The challenge forthis project was incorporating a customer-specific financial allocation model within Data Manager. This was not standard functionality and required custom development to accomplish. The client provided their organizational hierarchy and allocation model, and we were able to include this information into Spend Radar’s Data Manager. All software customization is done in-house so we have complete control over timelines and can quickly adapt to new customer requests. And since Data Manager is offered as Software-as-a- Service (SaaS), once the enhancements were complete they became available to all clients. June 2011 www.spendradar.com 13
  • 14.
    Results This case studydescribes an advanced spend management project that resulted in:  Merging global spend from over 90 locations  Providing indisputable proof of realized cost reductions  Providing insight into forthcoming cost reductions  Relating impact to the bottom line by product line, operating company, category and location www.spendradar.com 14
  • 15.
    Key Takeaways The mostimportant lesson of this or any other spend analysis project is that spend analysis is not simply about identifying potential cost-reduction opportunities. Any savings should then be measured, validated and tracked so that true success can be quantified and managed in an ongoing, repeatable manner. And for some businesses, it is critical to ultimately trace back and allocate any realized cost reductions directly to the individual locations or business units. Not all organizations manage their savings and cost allocations directly to each individual organizational entity, but for the many that do, having a spend analysis solution that can fully manage this process in an indisputable manner is critical. June 2011 www.spendradar.com 15
  • 16.
    Conclusion Managing costs hasalways been important. In the current economic climate, it is imperative. However, the promise and hype of spend analysis has left much to be desired from previous generations of spend analysis solutions. Unlike our predecessors, Spend Radar is delivering fast, accurate and measurable impact to our customer’s bottom line. Isn’t that what spend management is all about? This case study outlines the real-world experiences of this team and their project. We hope that you are able to learn from and leverage this insight to define and implement a successful spend management project at your company. June 2011 www.spendradar.com 16
  • 17.
    Award-Winning Upon completion ofthe initial phase of this project, the team at Spend Radar realized they had accomplished something special – a twist on the typical spend analysis project that provided even greater savings and sourcing opportunities. When submissions for the Supply & Demand Chain Executive 100 became available, we knew that we had to submit this project for consideration, illustrating the tangible benefits that can be achieved through spend analysis. We’re pleased to announce that this project resulted in winning this prestigious award. Supply & Demand Chain Executive is the executive's user manual for successful supply and demand chain transformation, utilizing hard-hitting analysis, viewpoints and unbiased case studies to steer executives and supply management professionals through the complicated, yet critical, world of supply and demand chain enablement to gain competitive advantage. It is located on the web at www.SDCExec.com. Ten years ago, Supply & Demand Chain Executive announced its first "100" list of supply chain solution providers, consultants and other organizations that were helping lead the way in transforming companies' supply and demand chains. To learn more about this award, visit www.sdce.com/content/awards.jsp.. June 2011 www.spendradar.com 17
  • 18.
    Contact Us toLearn More Spend Radar 311 S. Wacker Drive Suite 2270 Chicago, IL 60606 +1 312.262.9810 sales@spendradar.com www.spendradar.com www.spendradar.com/blog June 2011 www.spendradar.com 18