Download as PDF, PPTX


The document discusses the importance of visualization in Agile project management, highlighting how effective visualization can improve communication, increase collaboration, and enhance project visibility. It outlines common causes of project failure and emphasizes the need for tools and techniques, such as information radiators and Kanban boards, to visualize workflow and manage tasks. Various visualization techniques and tools are suggested to help teams maintain focus and transparency throughout their Agile processes.
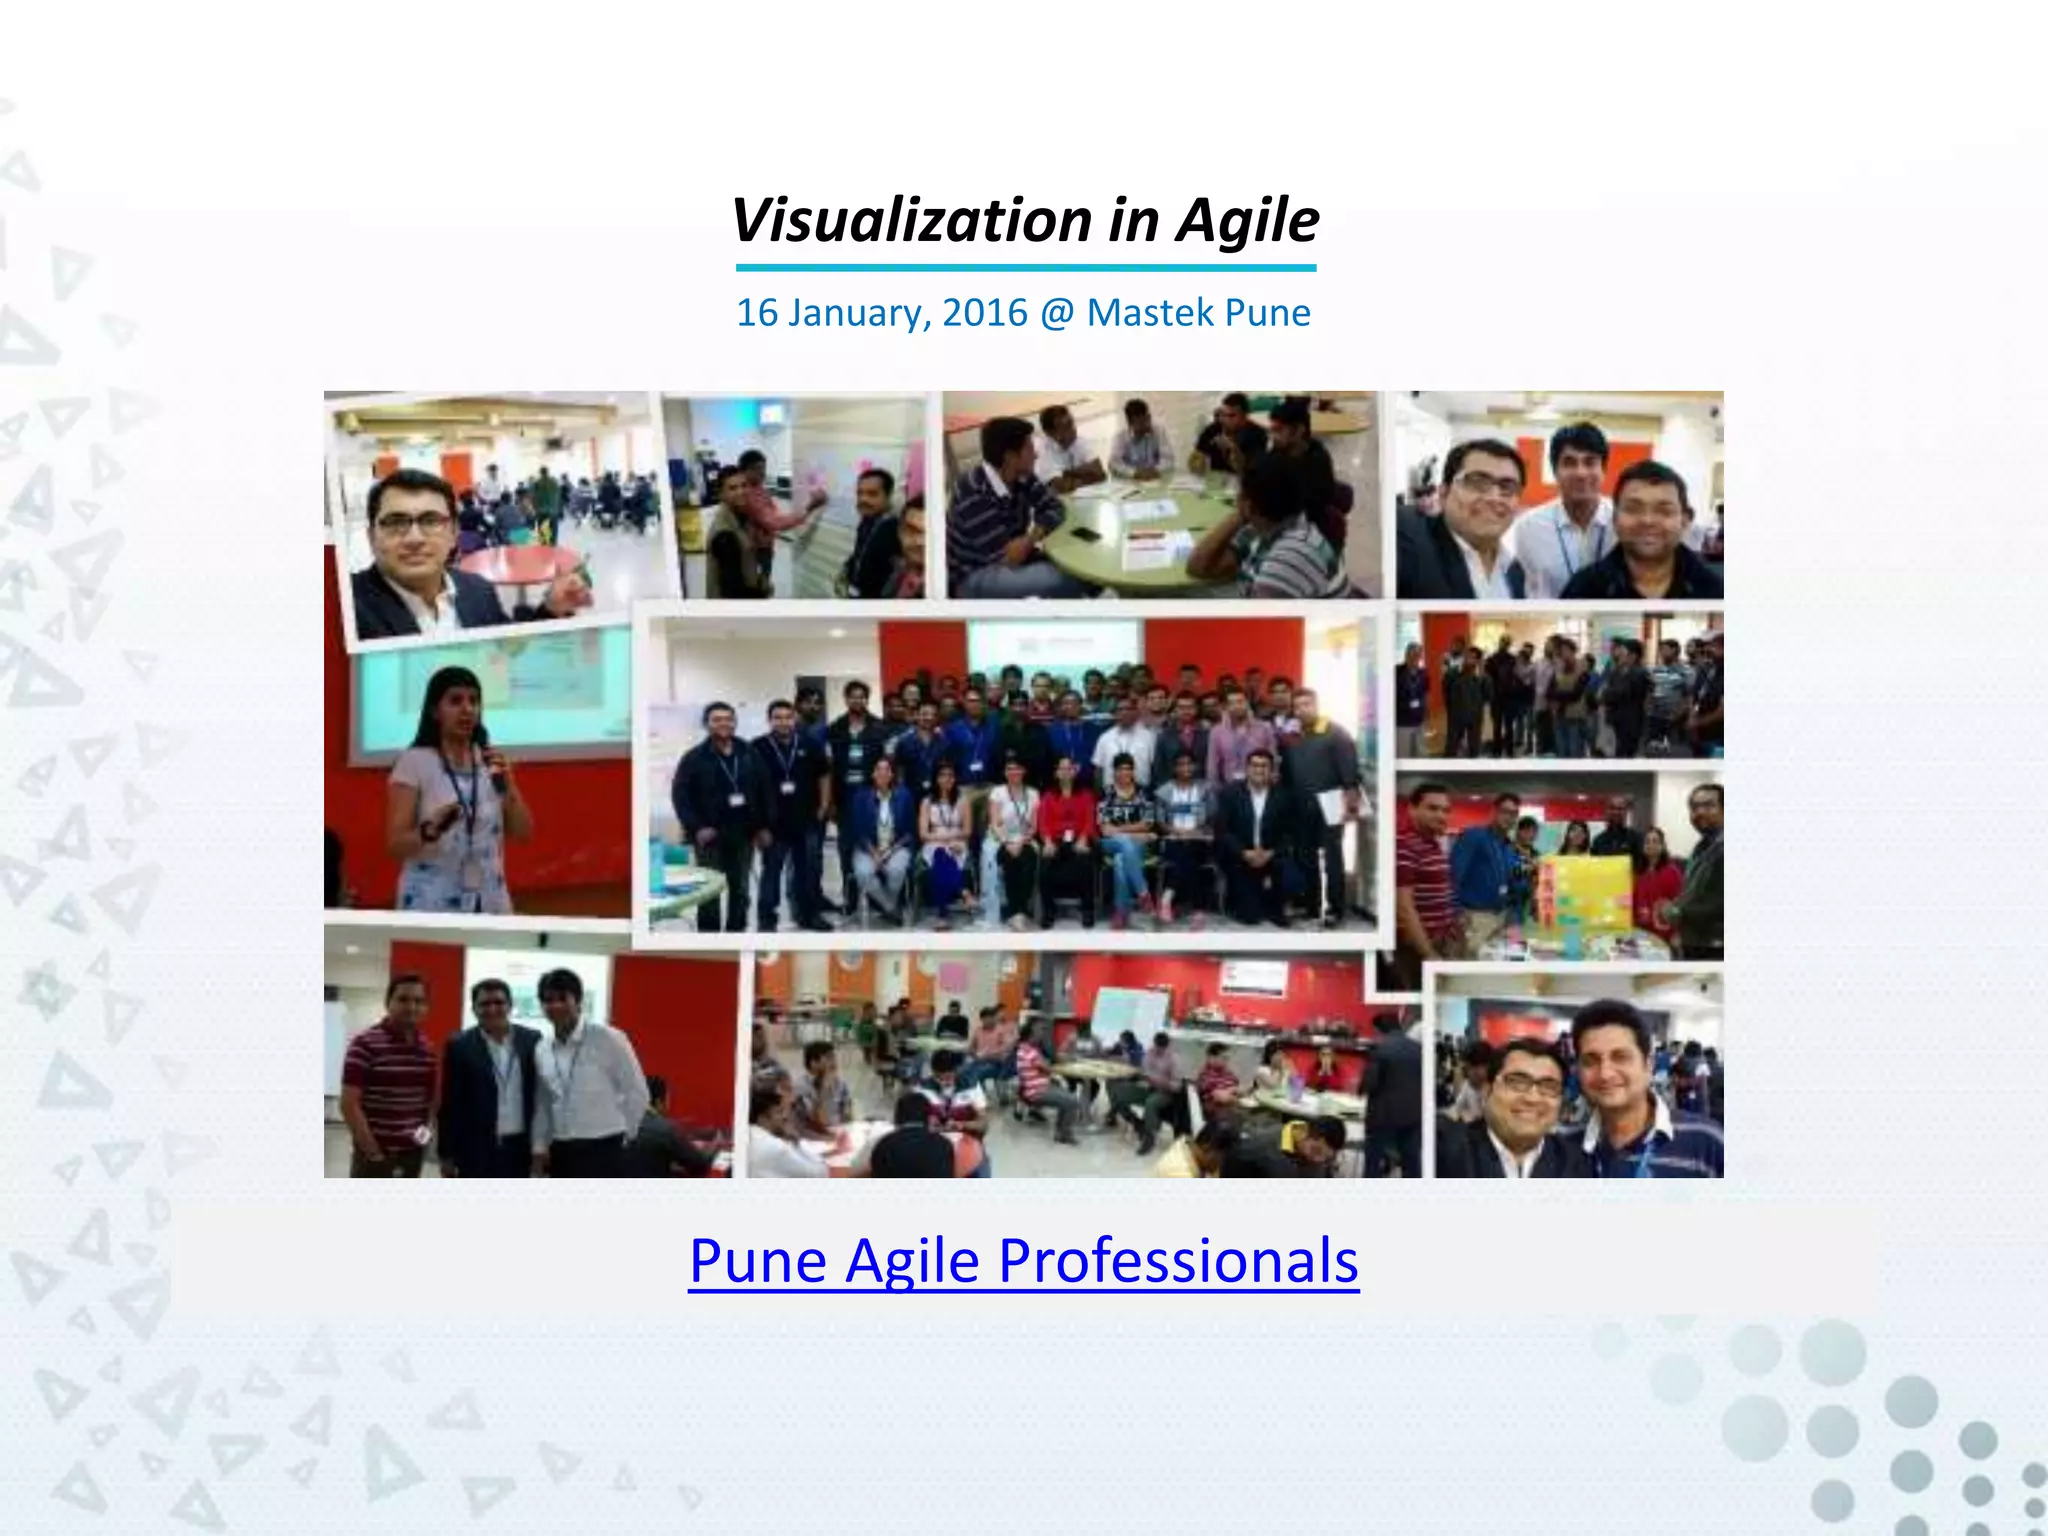
Introduction to Pune Agile Professionals meetup and the workshop on visualization.
Overview of 12 Agile principles including customer satisfaction, adaptability, and teamwork.
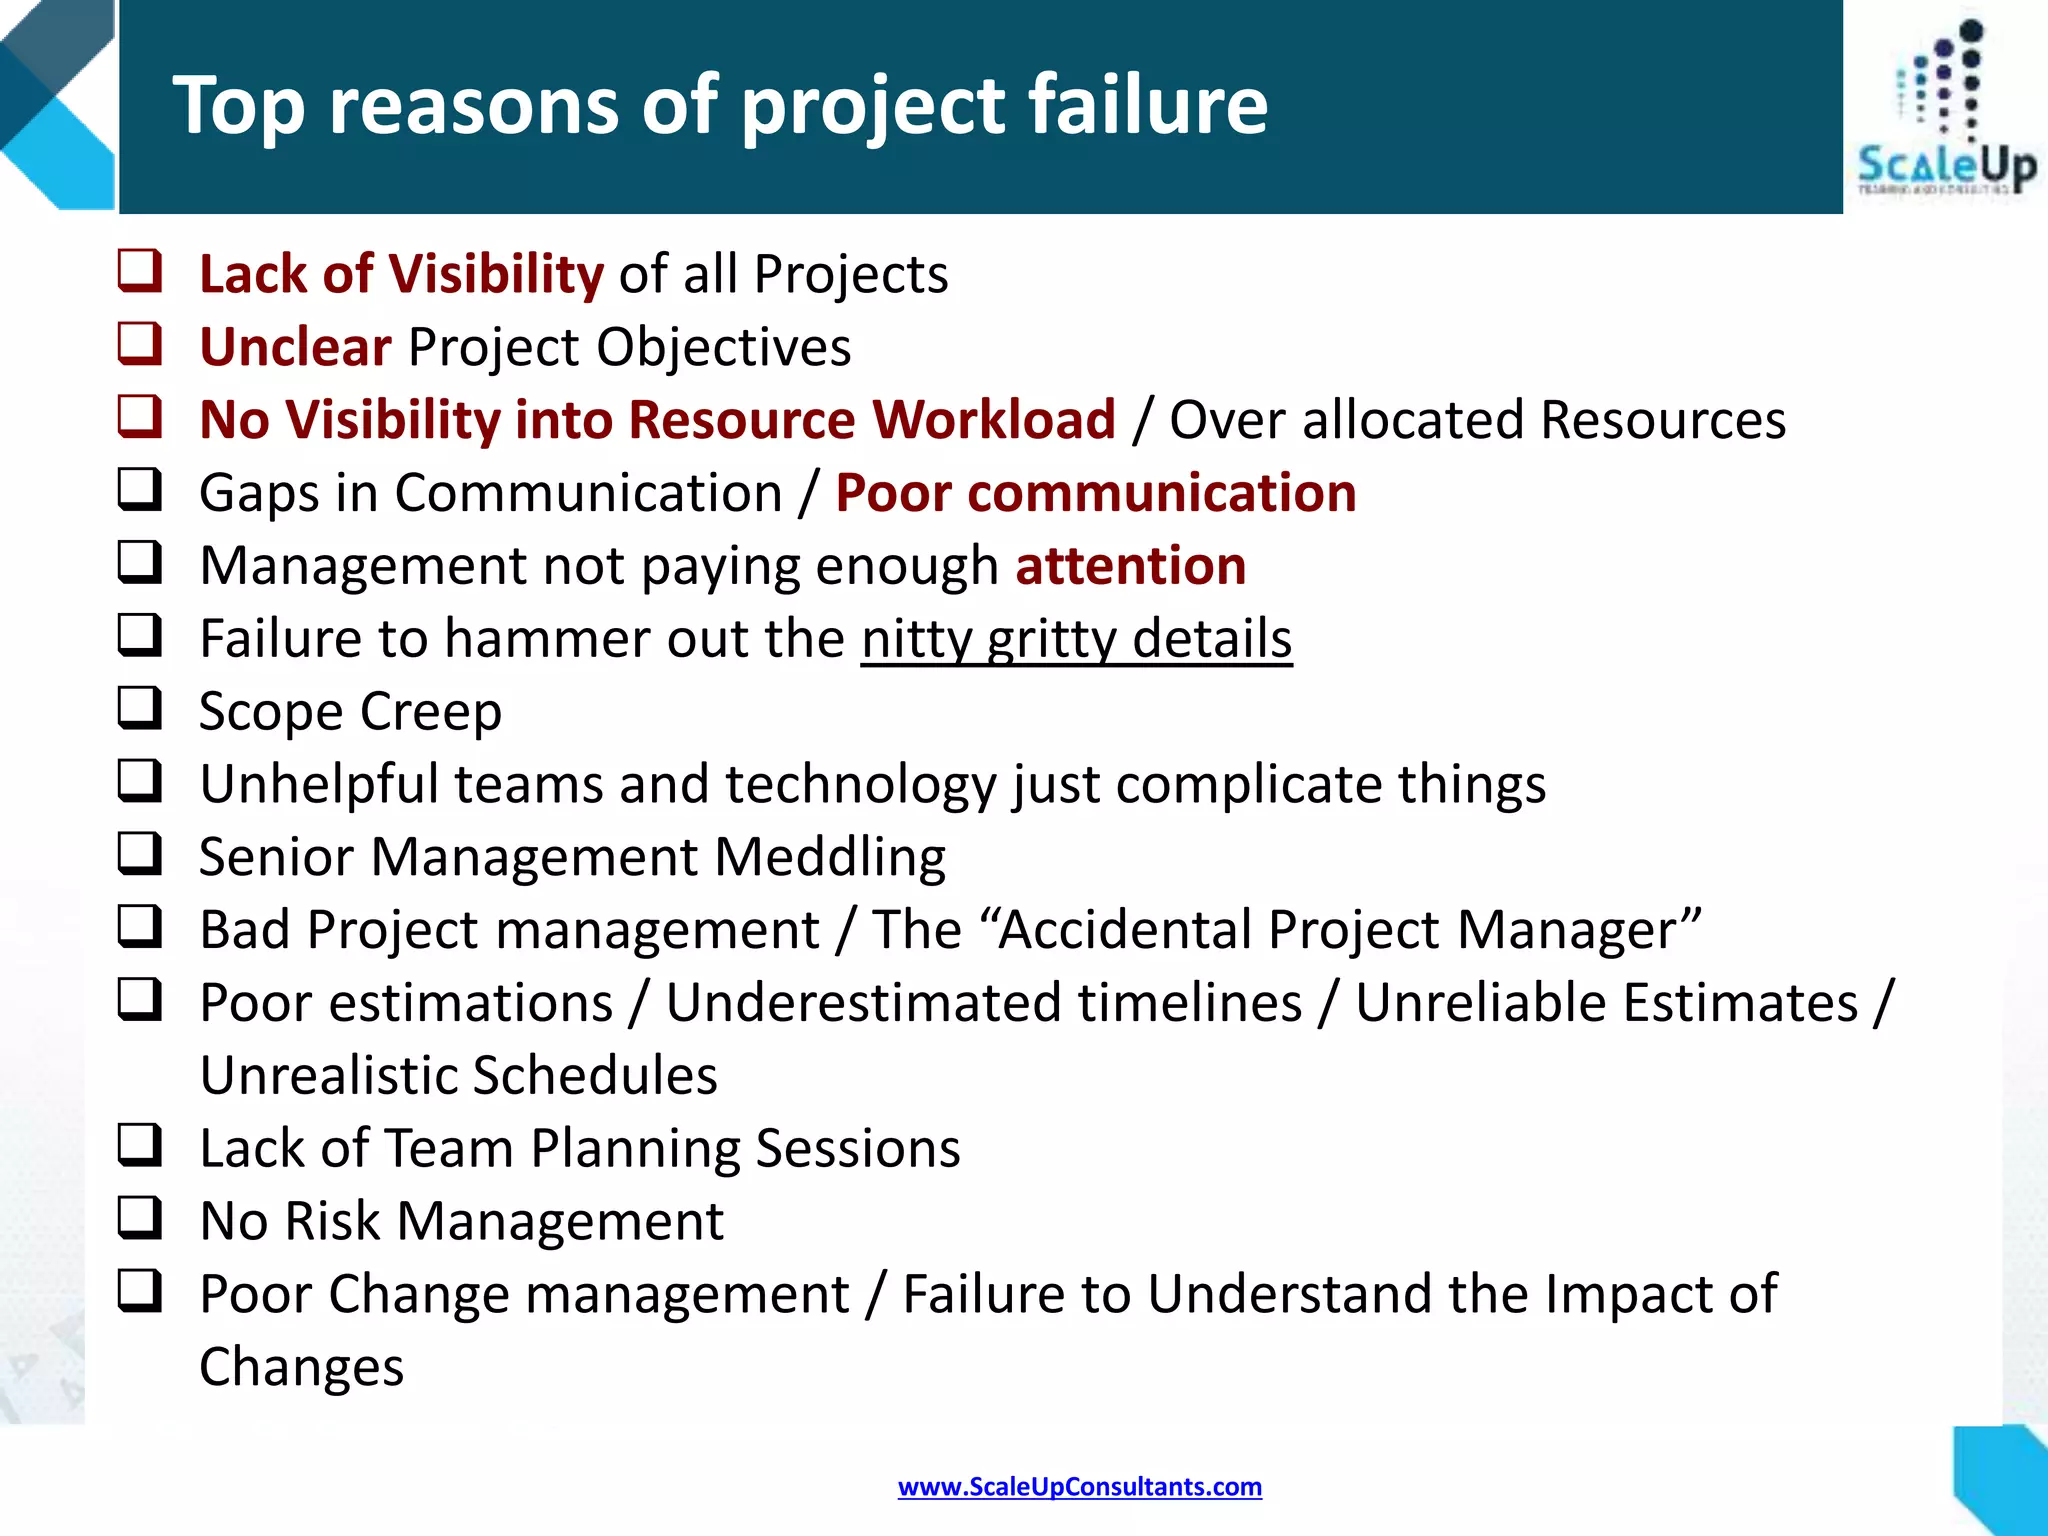
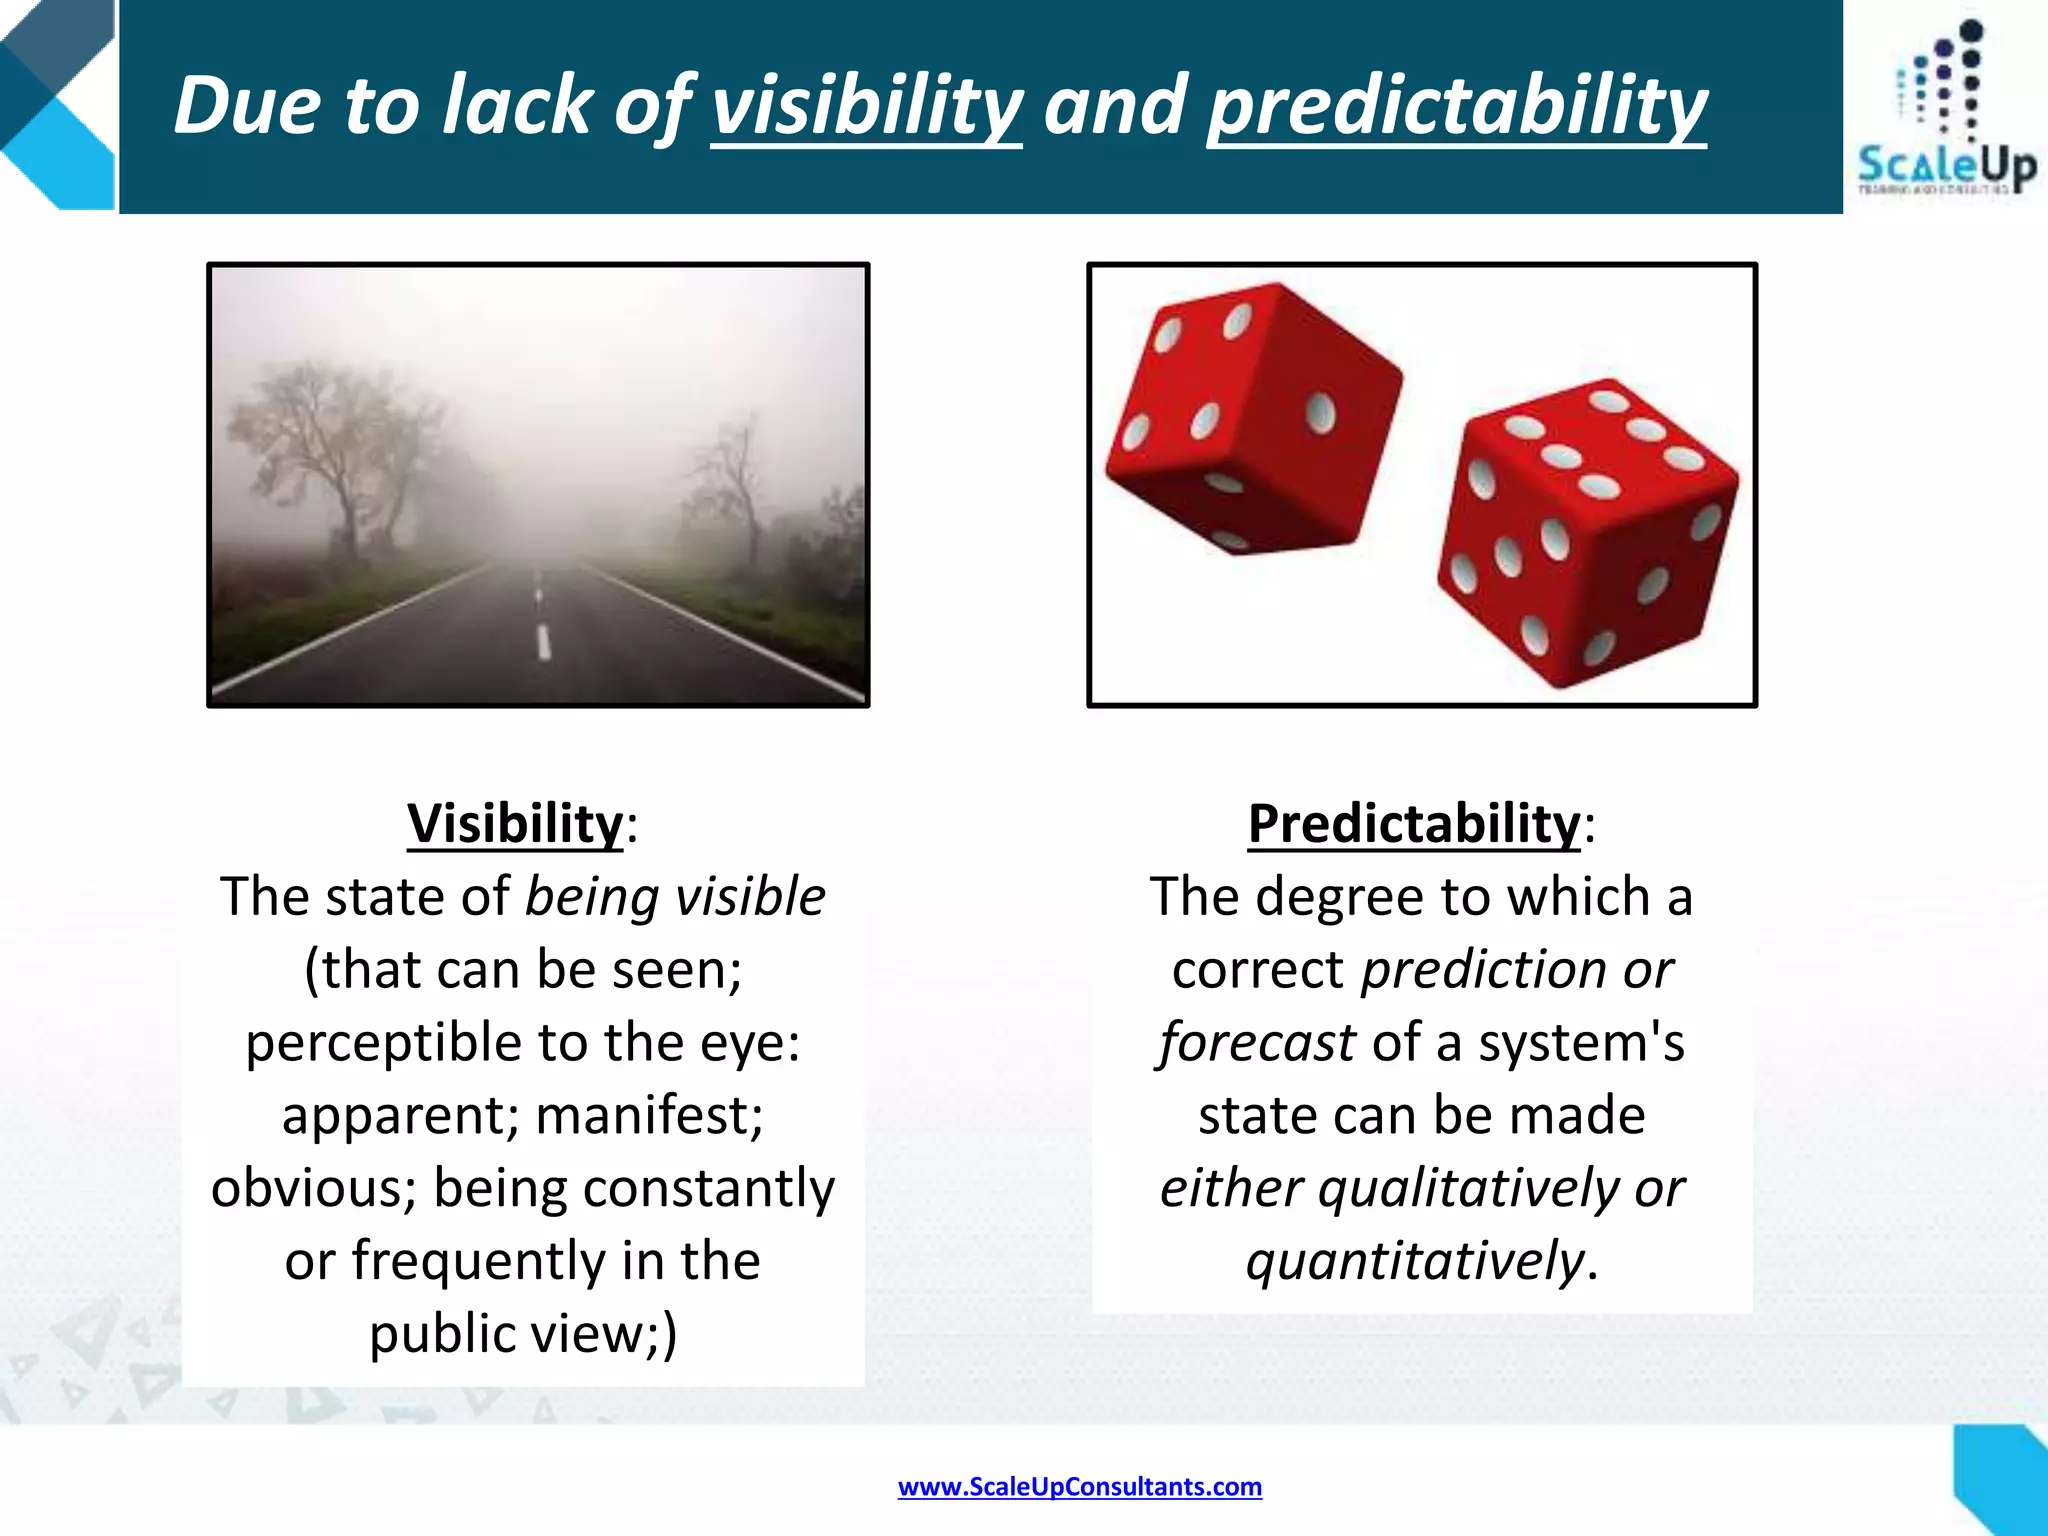
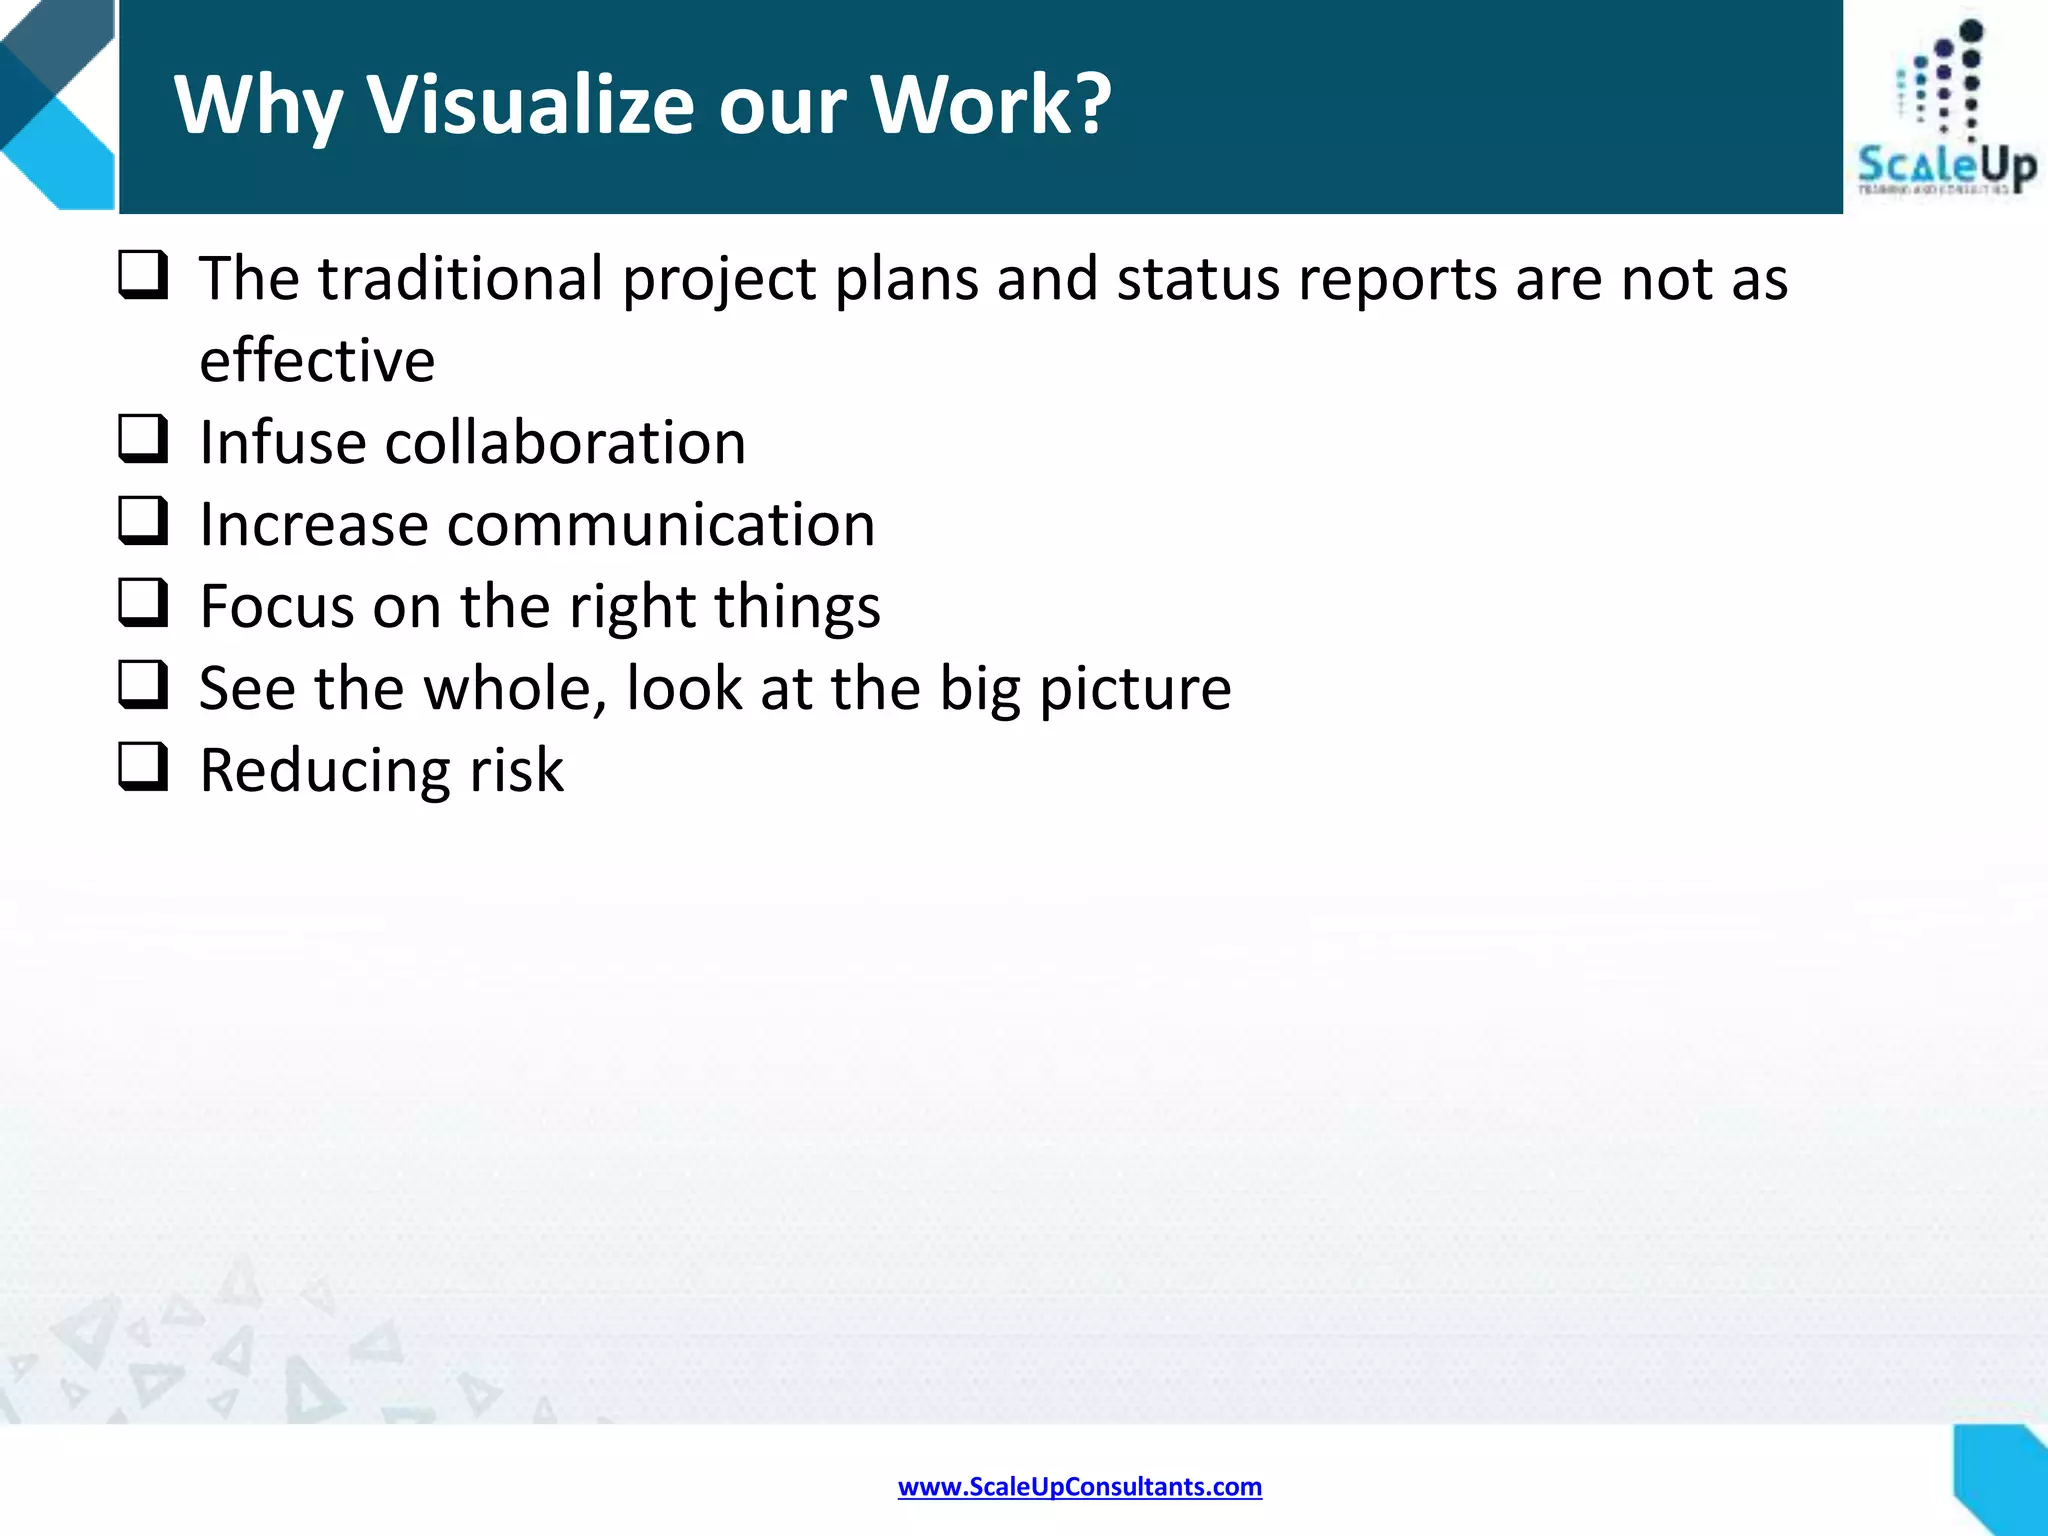
Examines reasons for project failures focusing on lack of visibility and predictability.
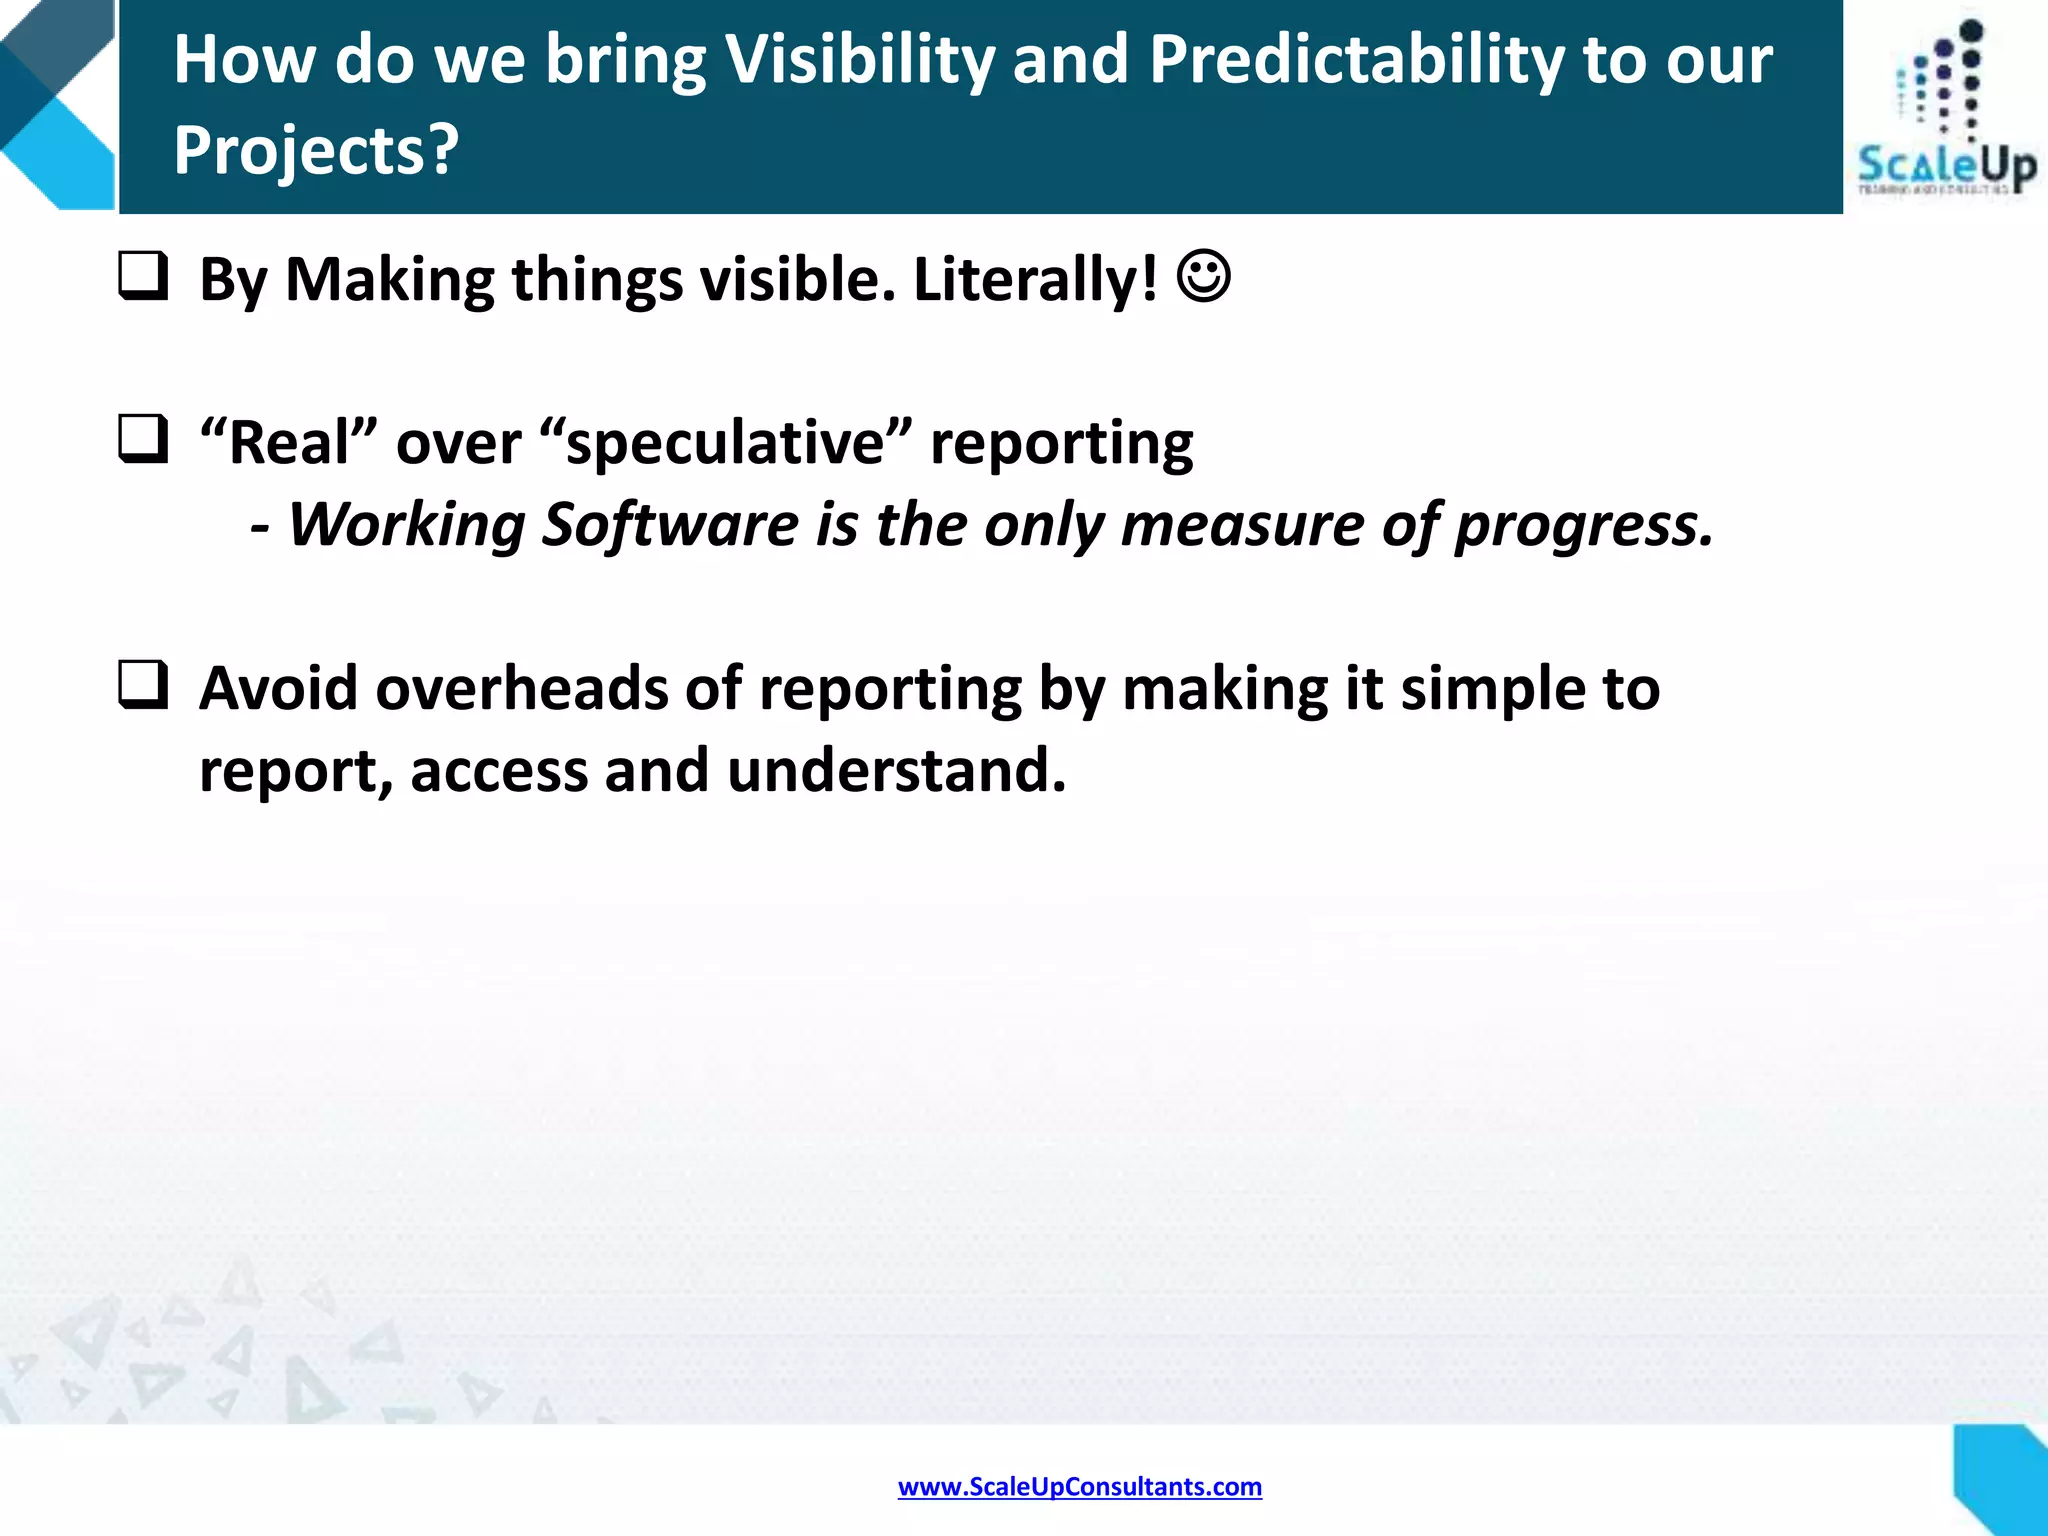
Discusses ways to increase project visibility and predictability through simple reporting methods.
Defines visualization and explains its significance in effective communication and reducing risks.
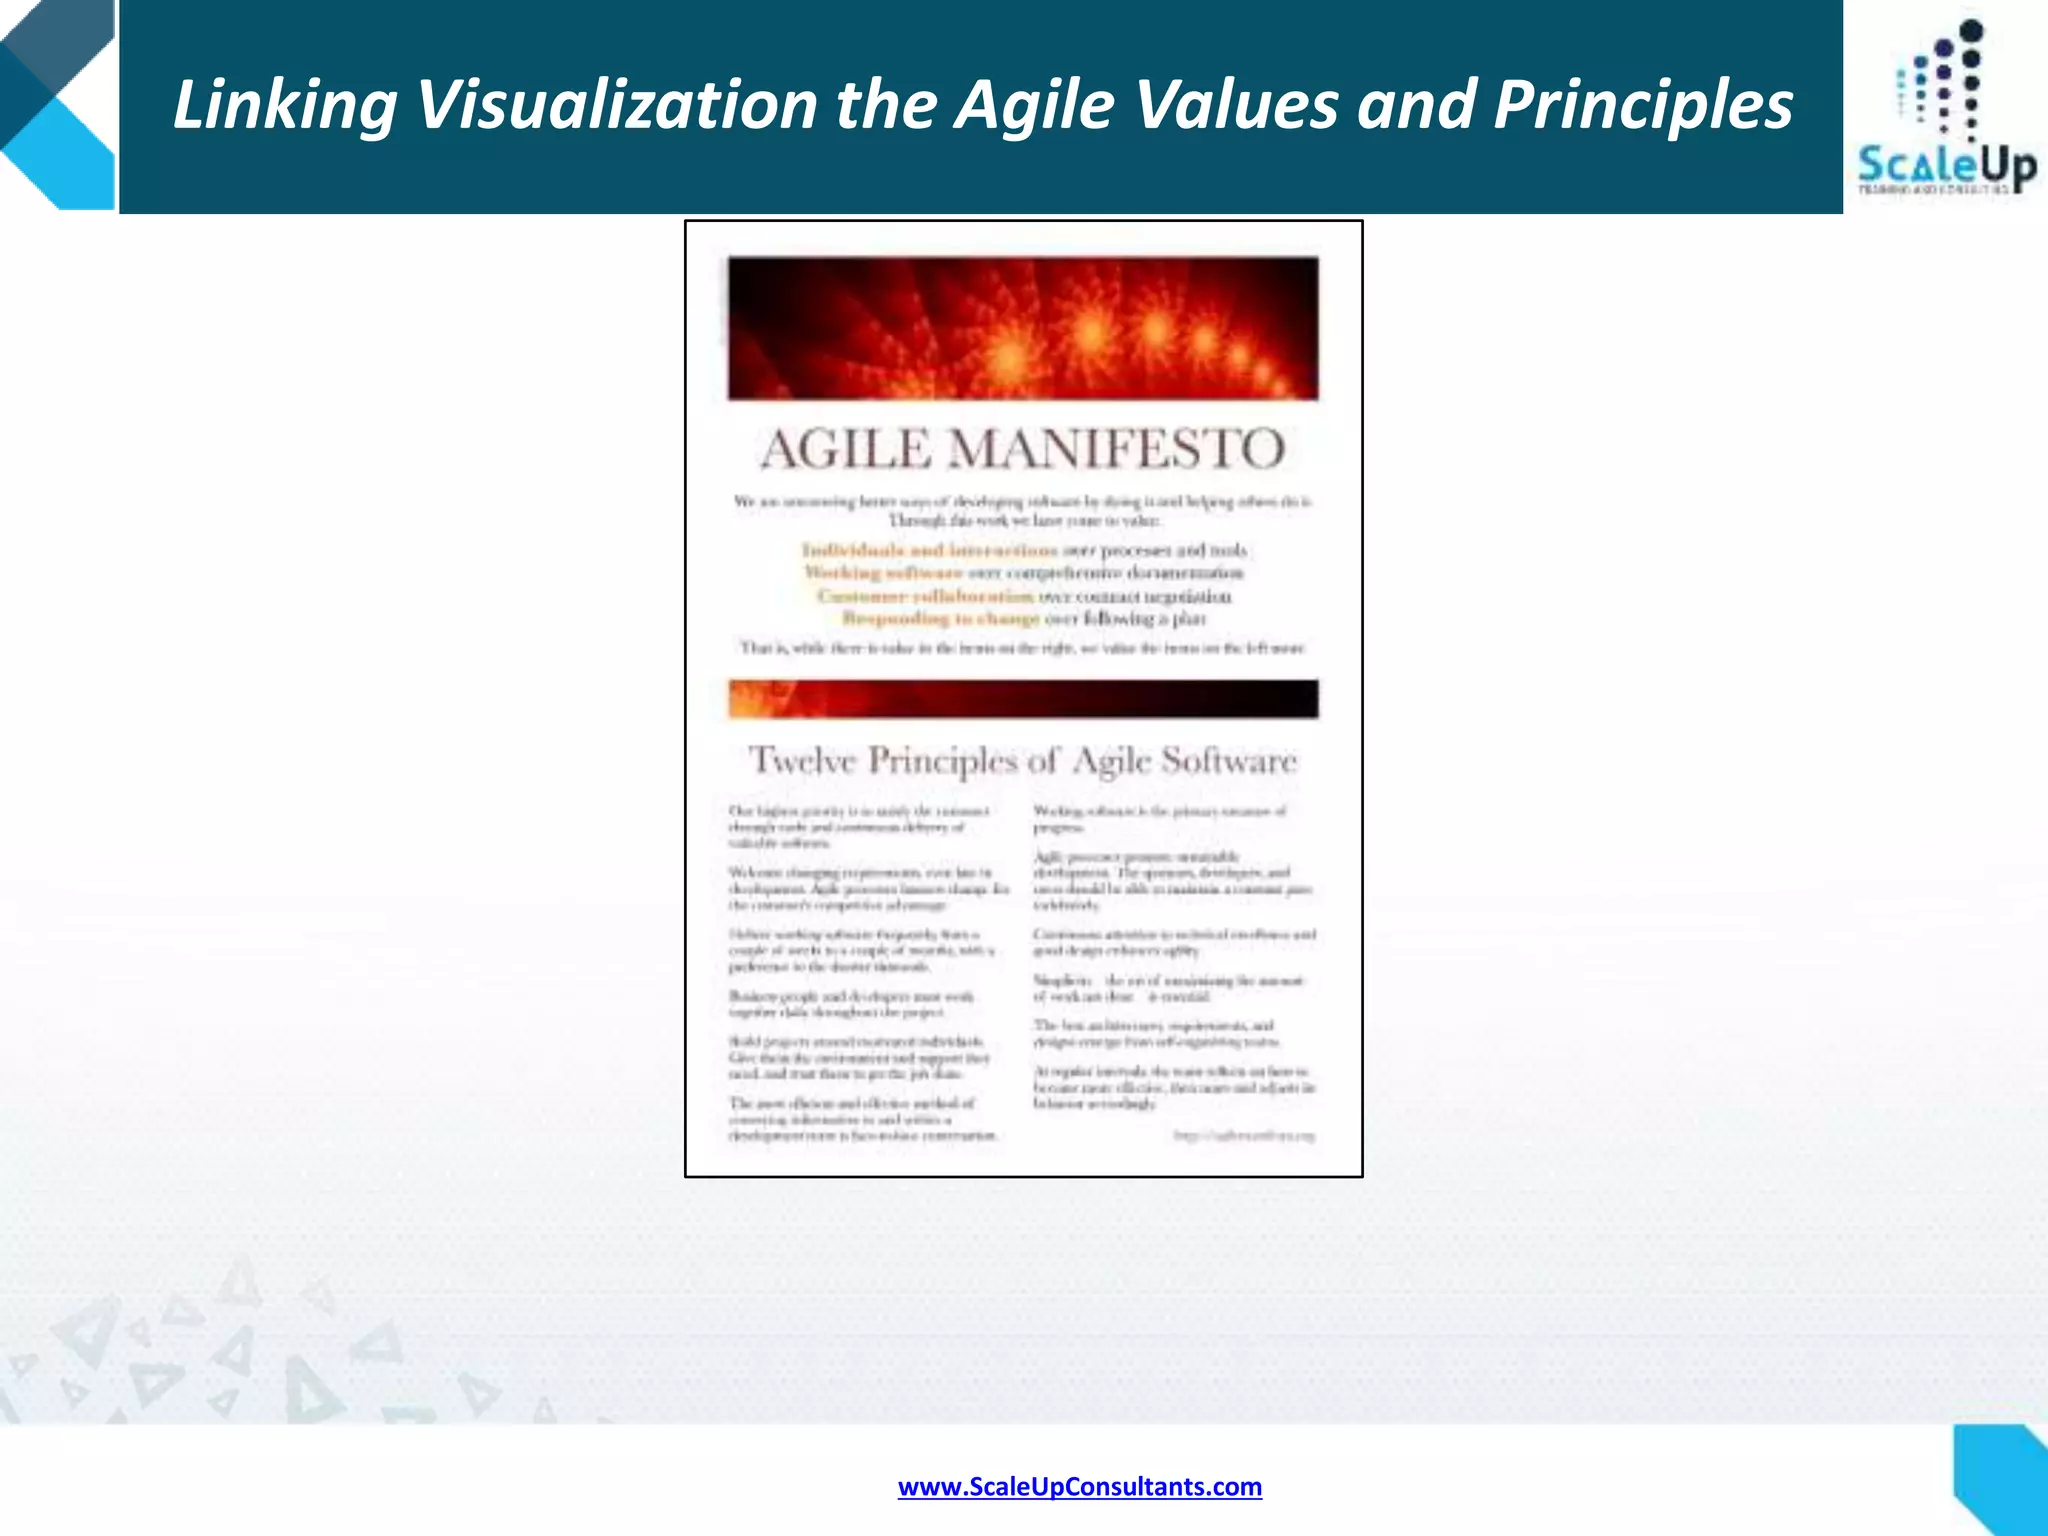
Links the concept of visualization to Agile values and principles to enhance team collaboration.
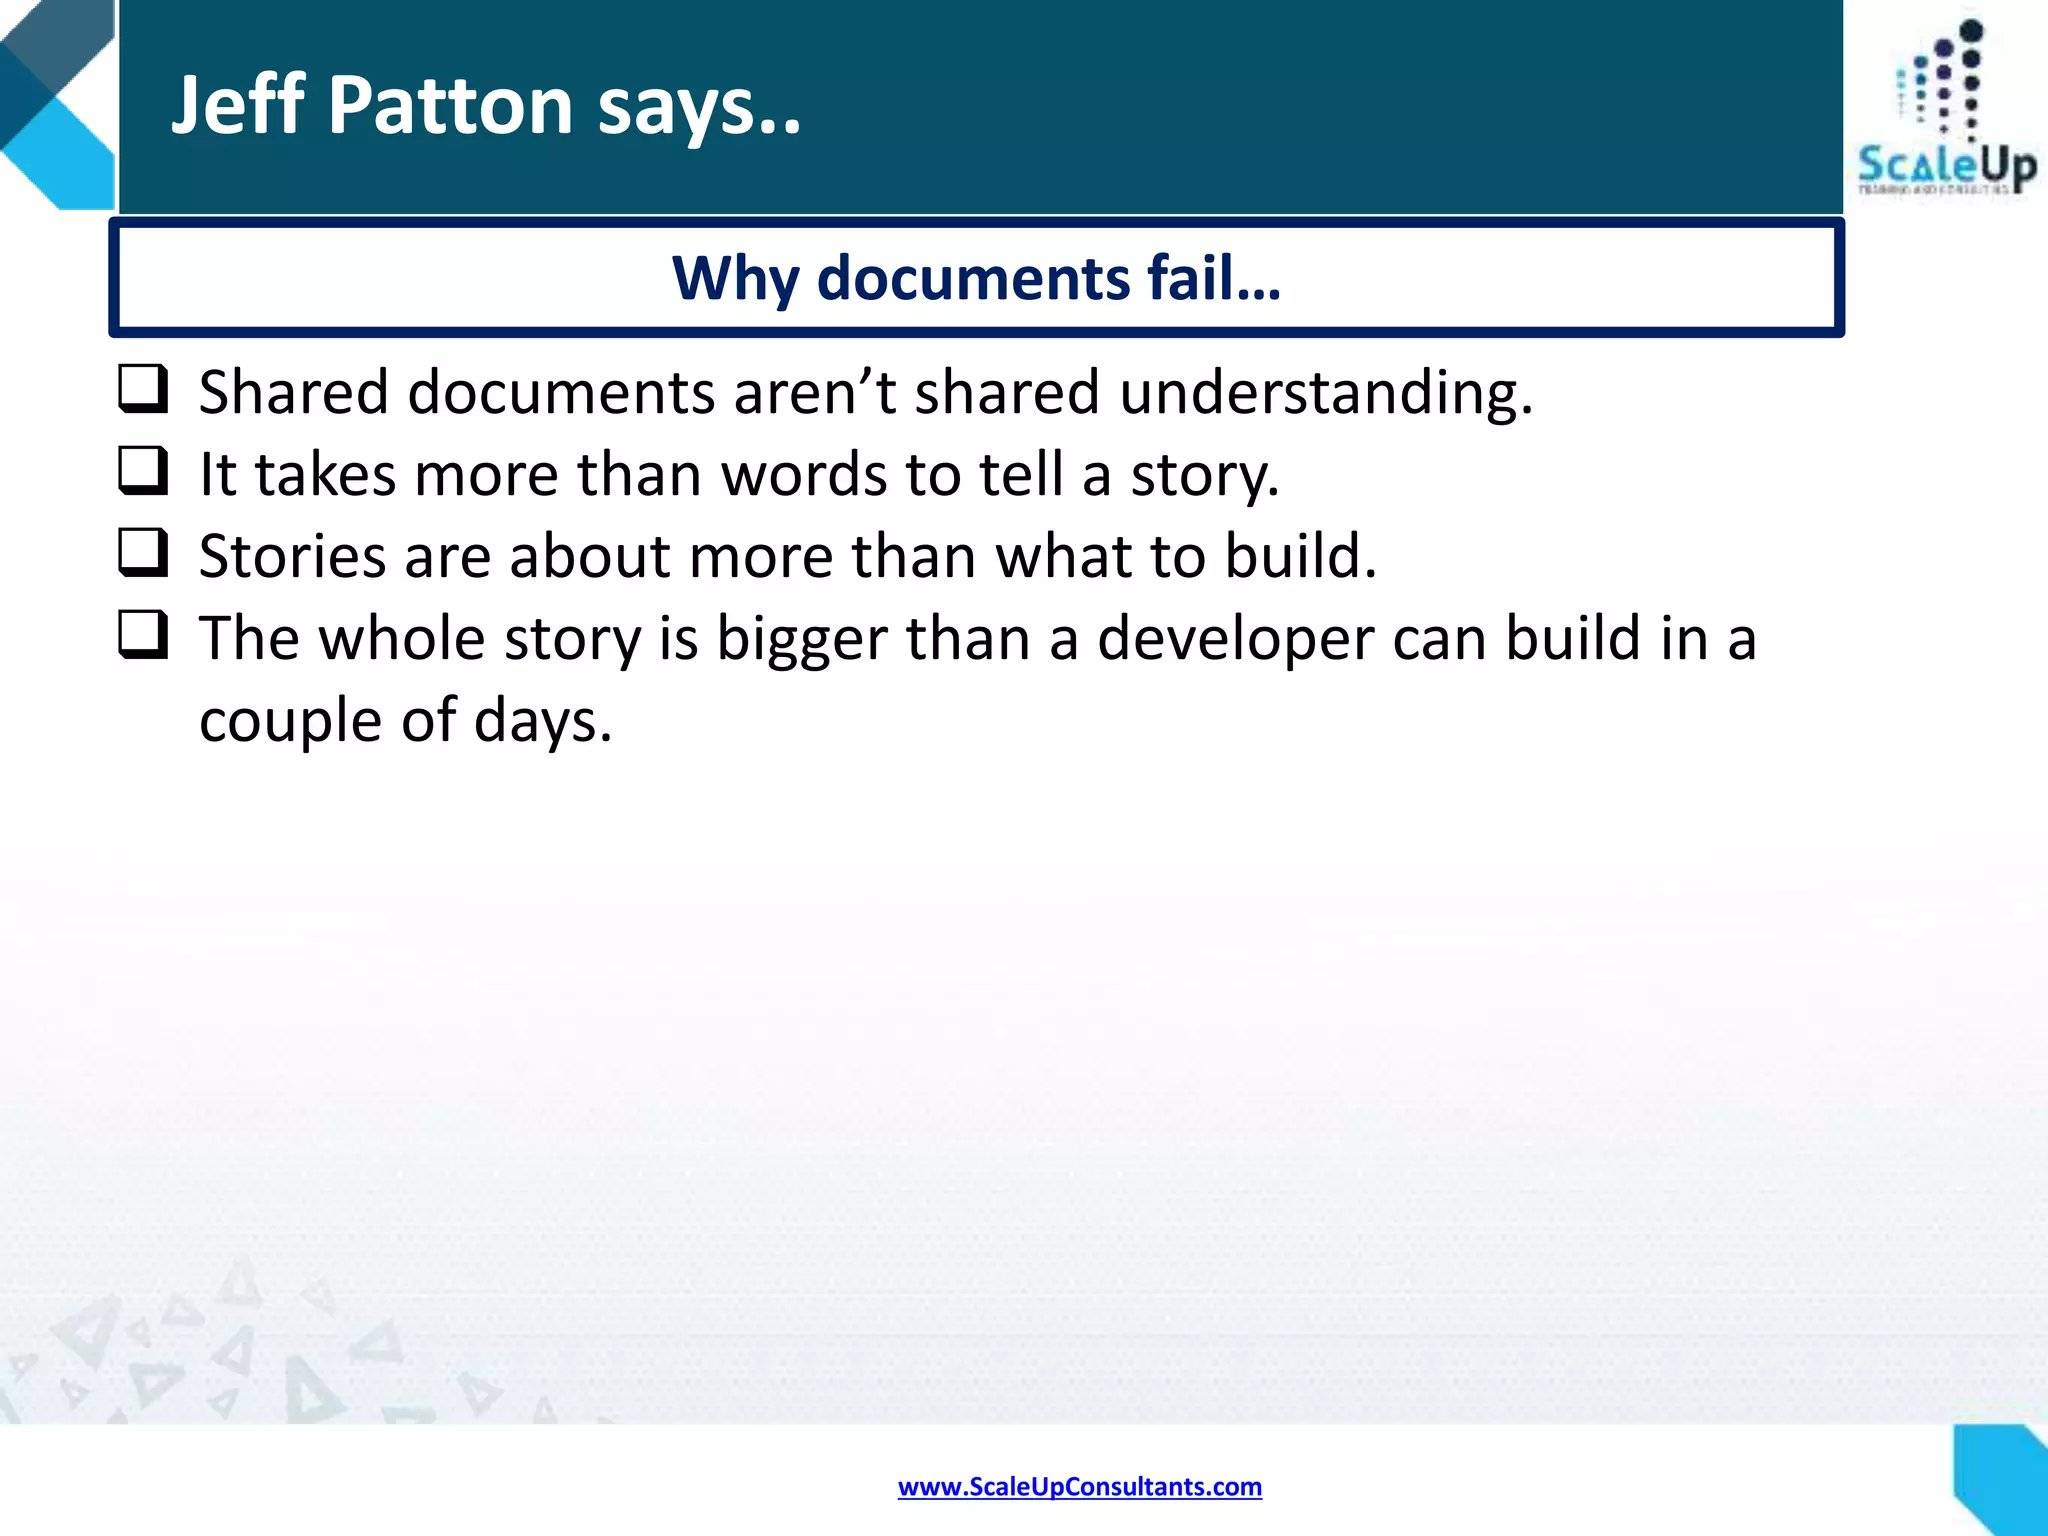
Discusses why shared documents do not ensure shared understanding in Agile practices.
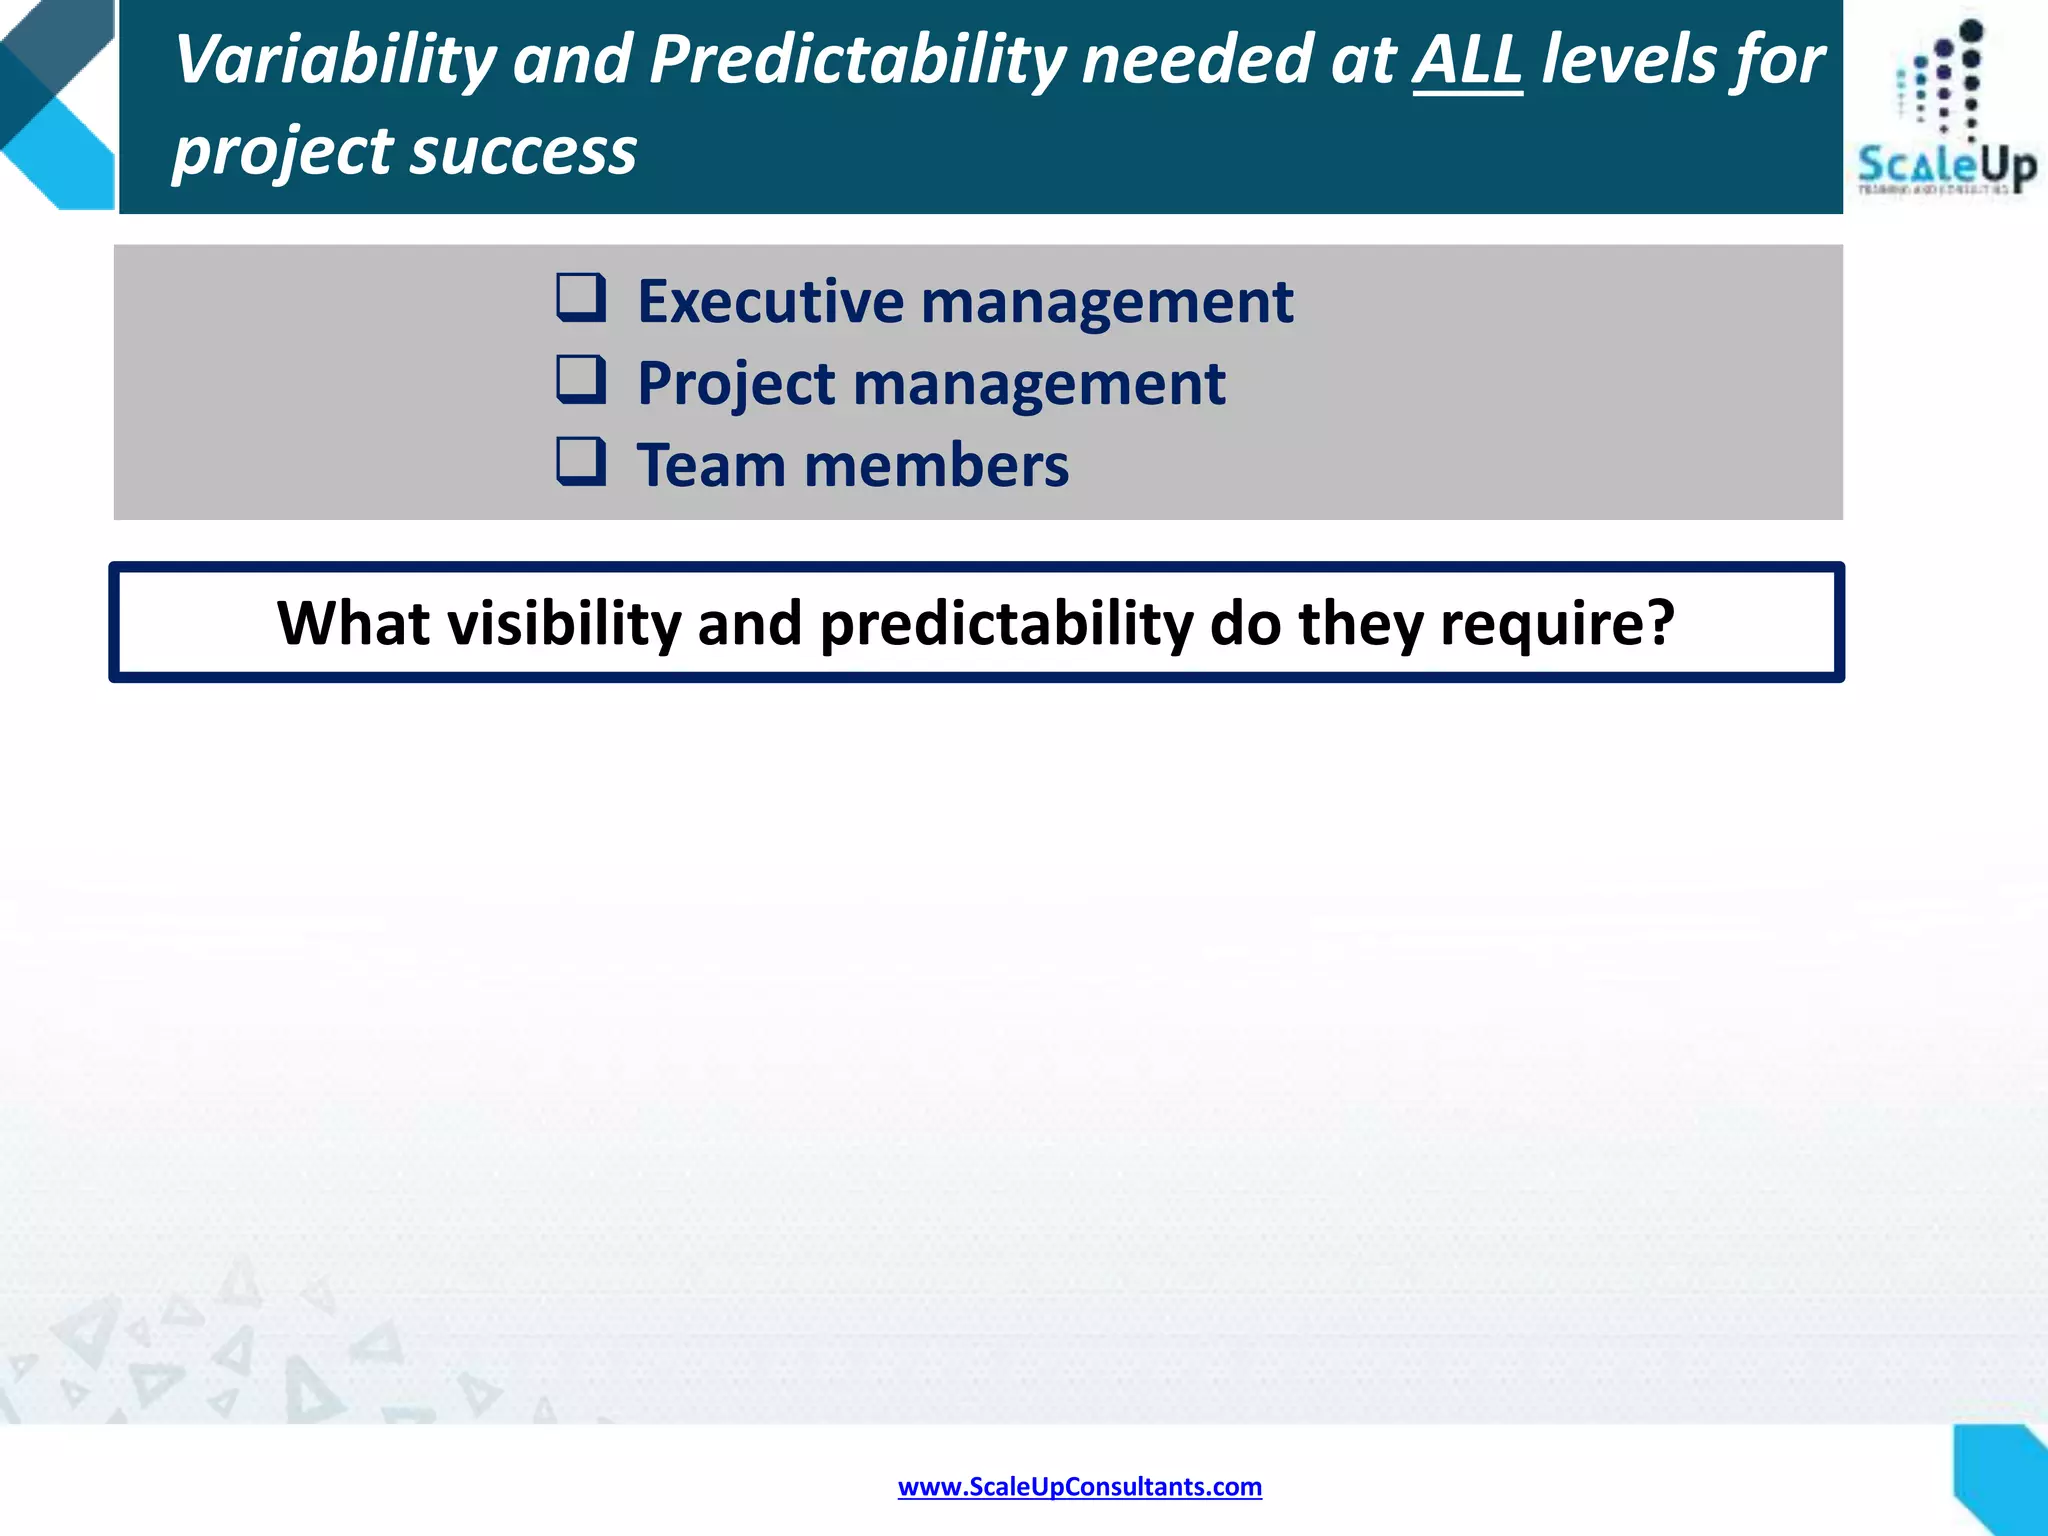
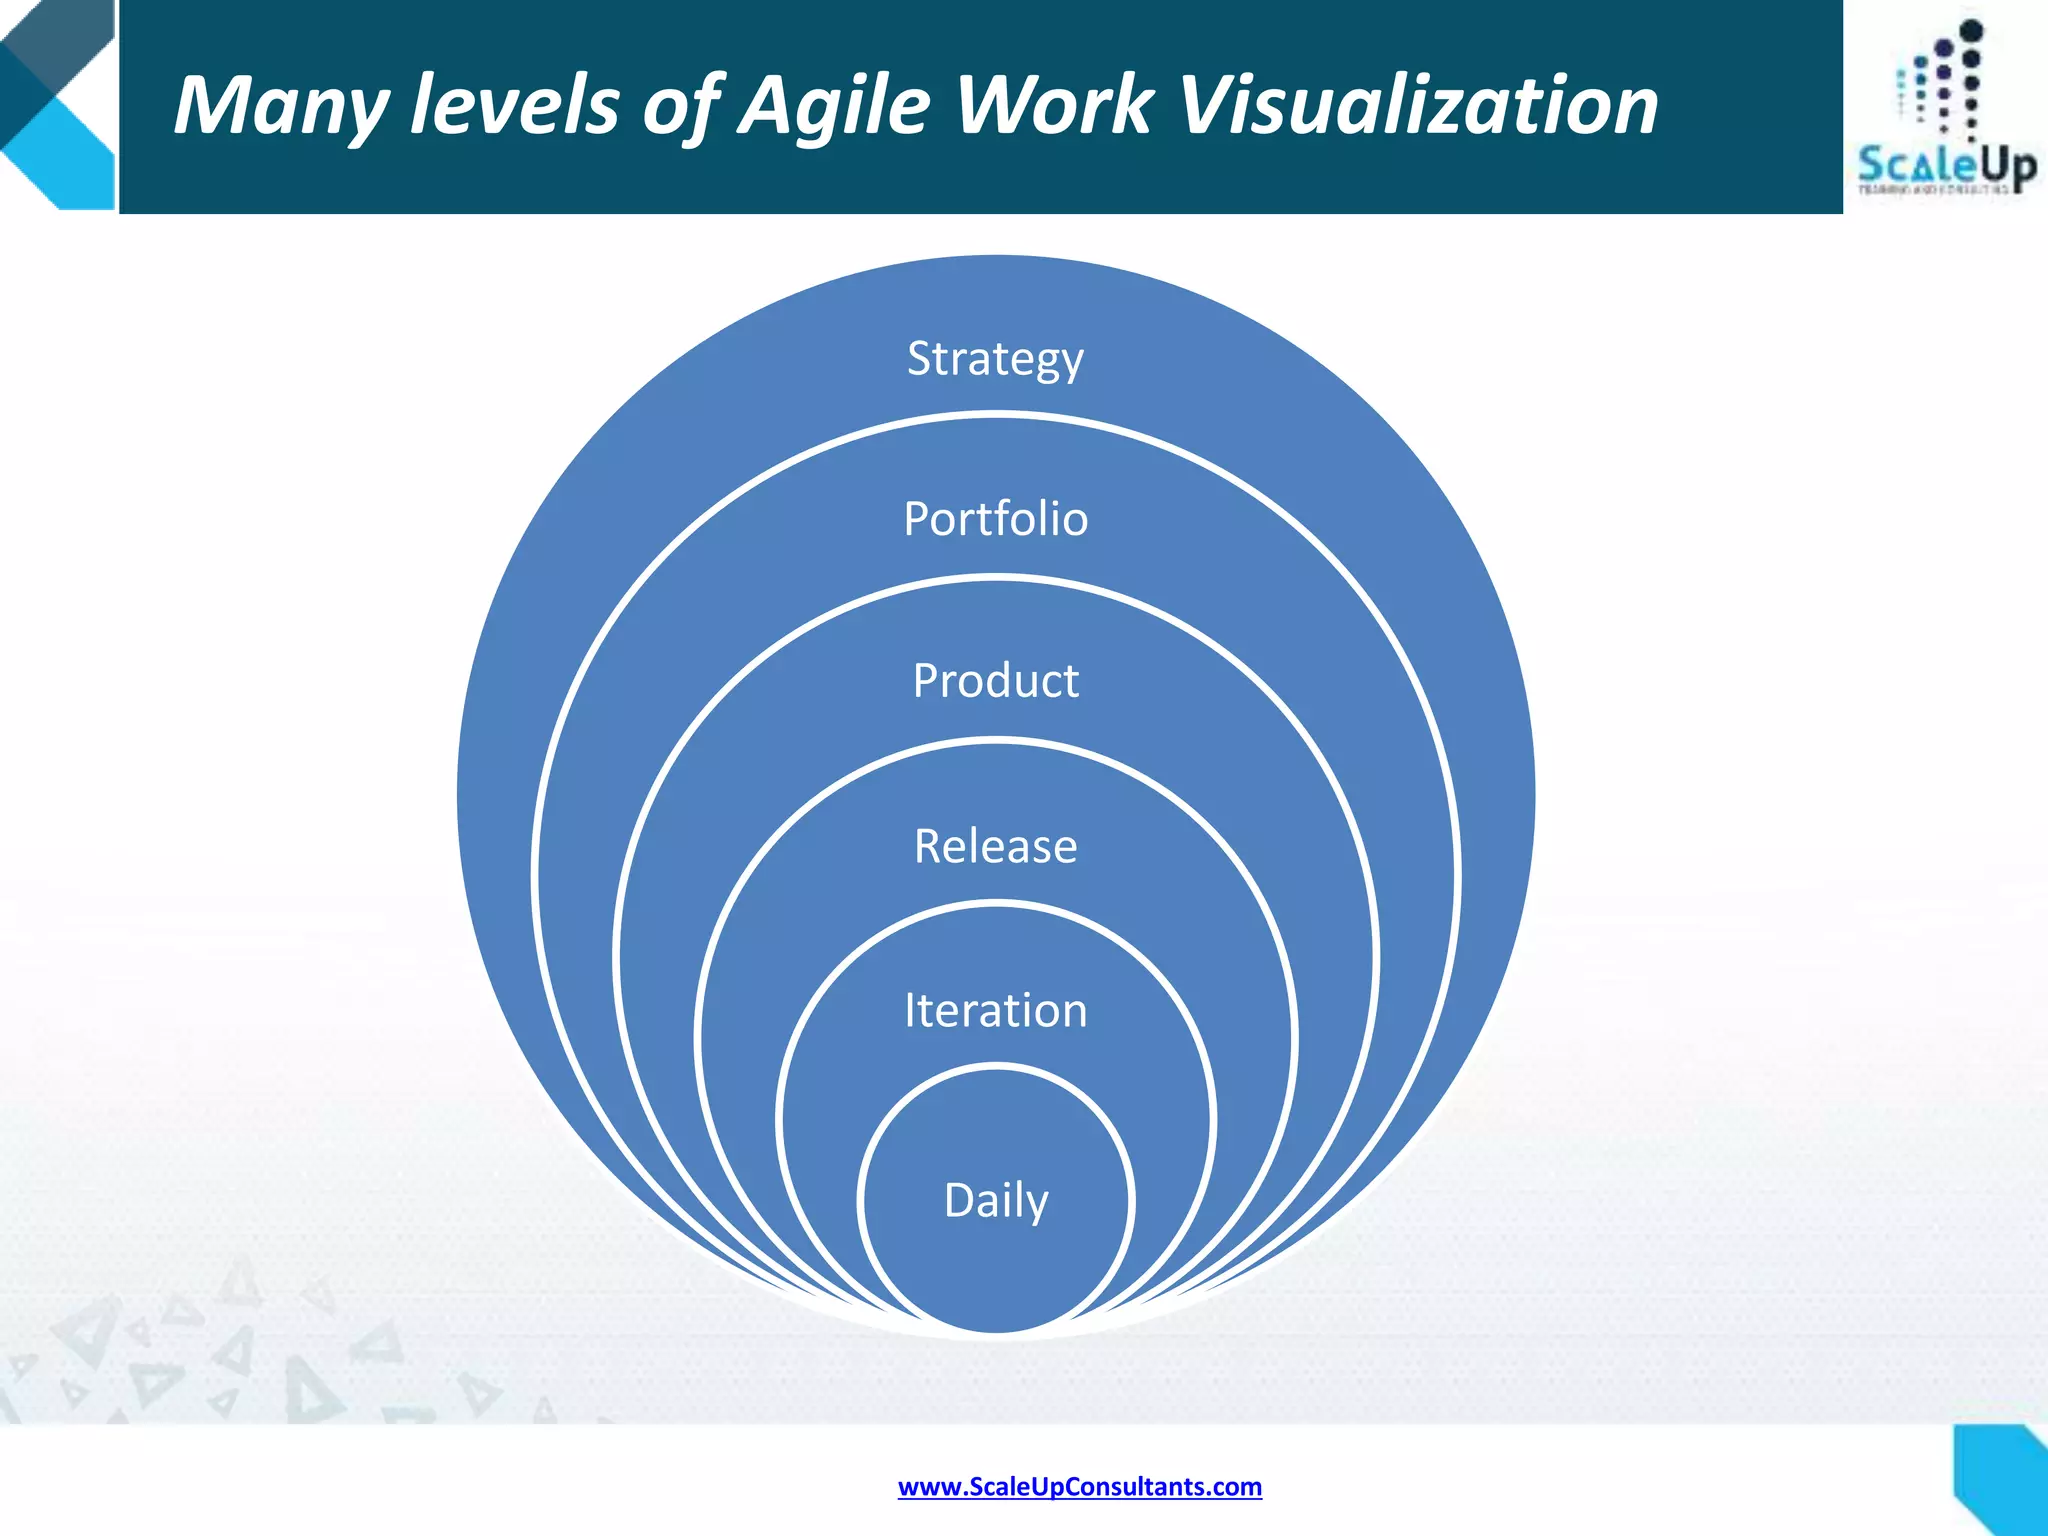
Identifies various levels of visualization needed in agile project management.
Introduces various tools for visualization in Agile environments.
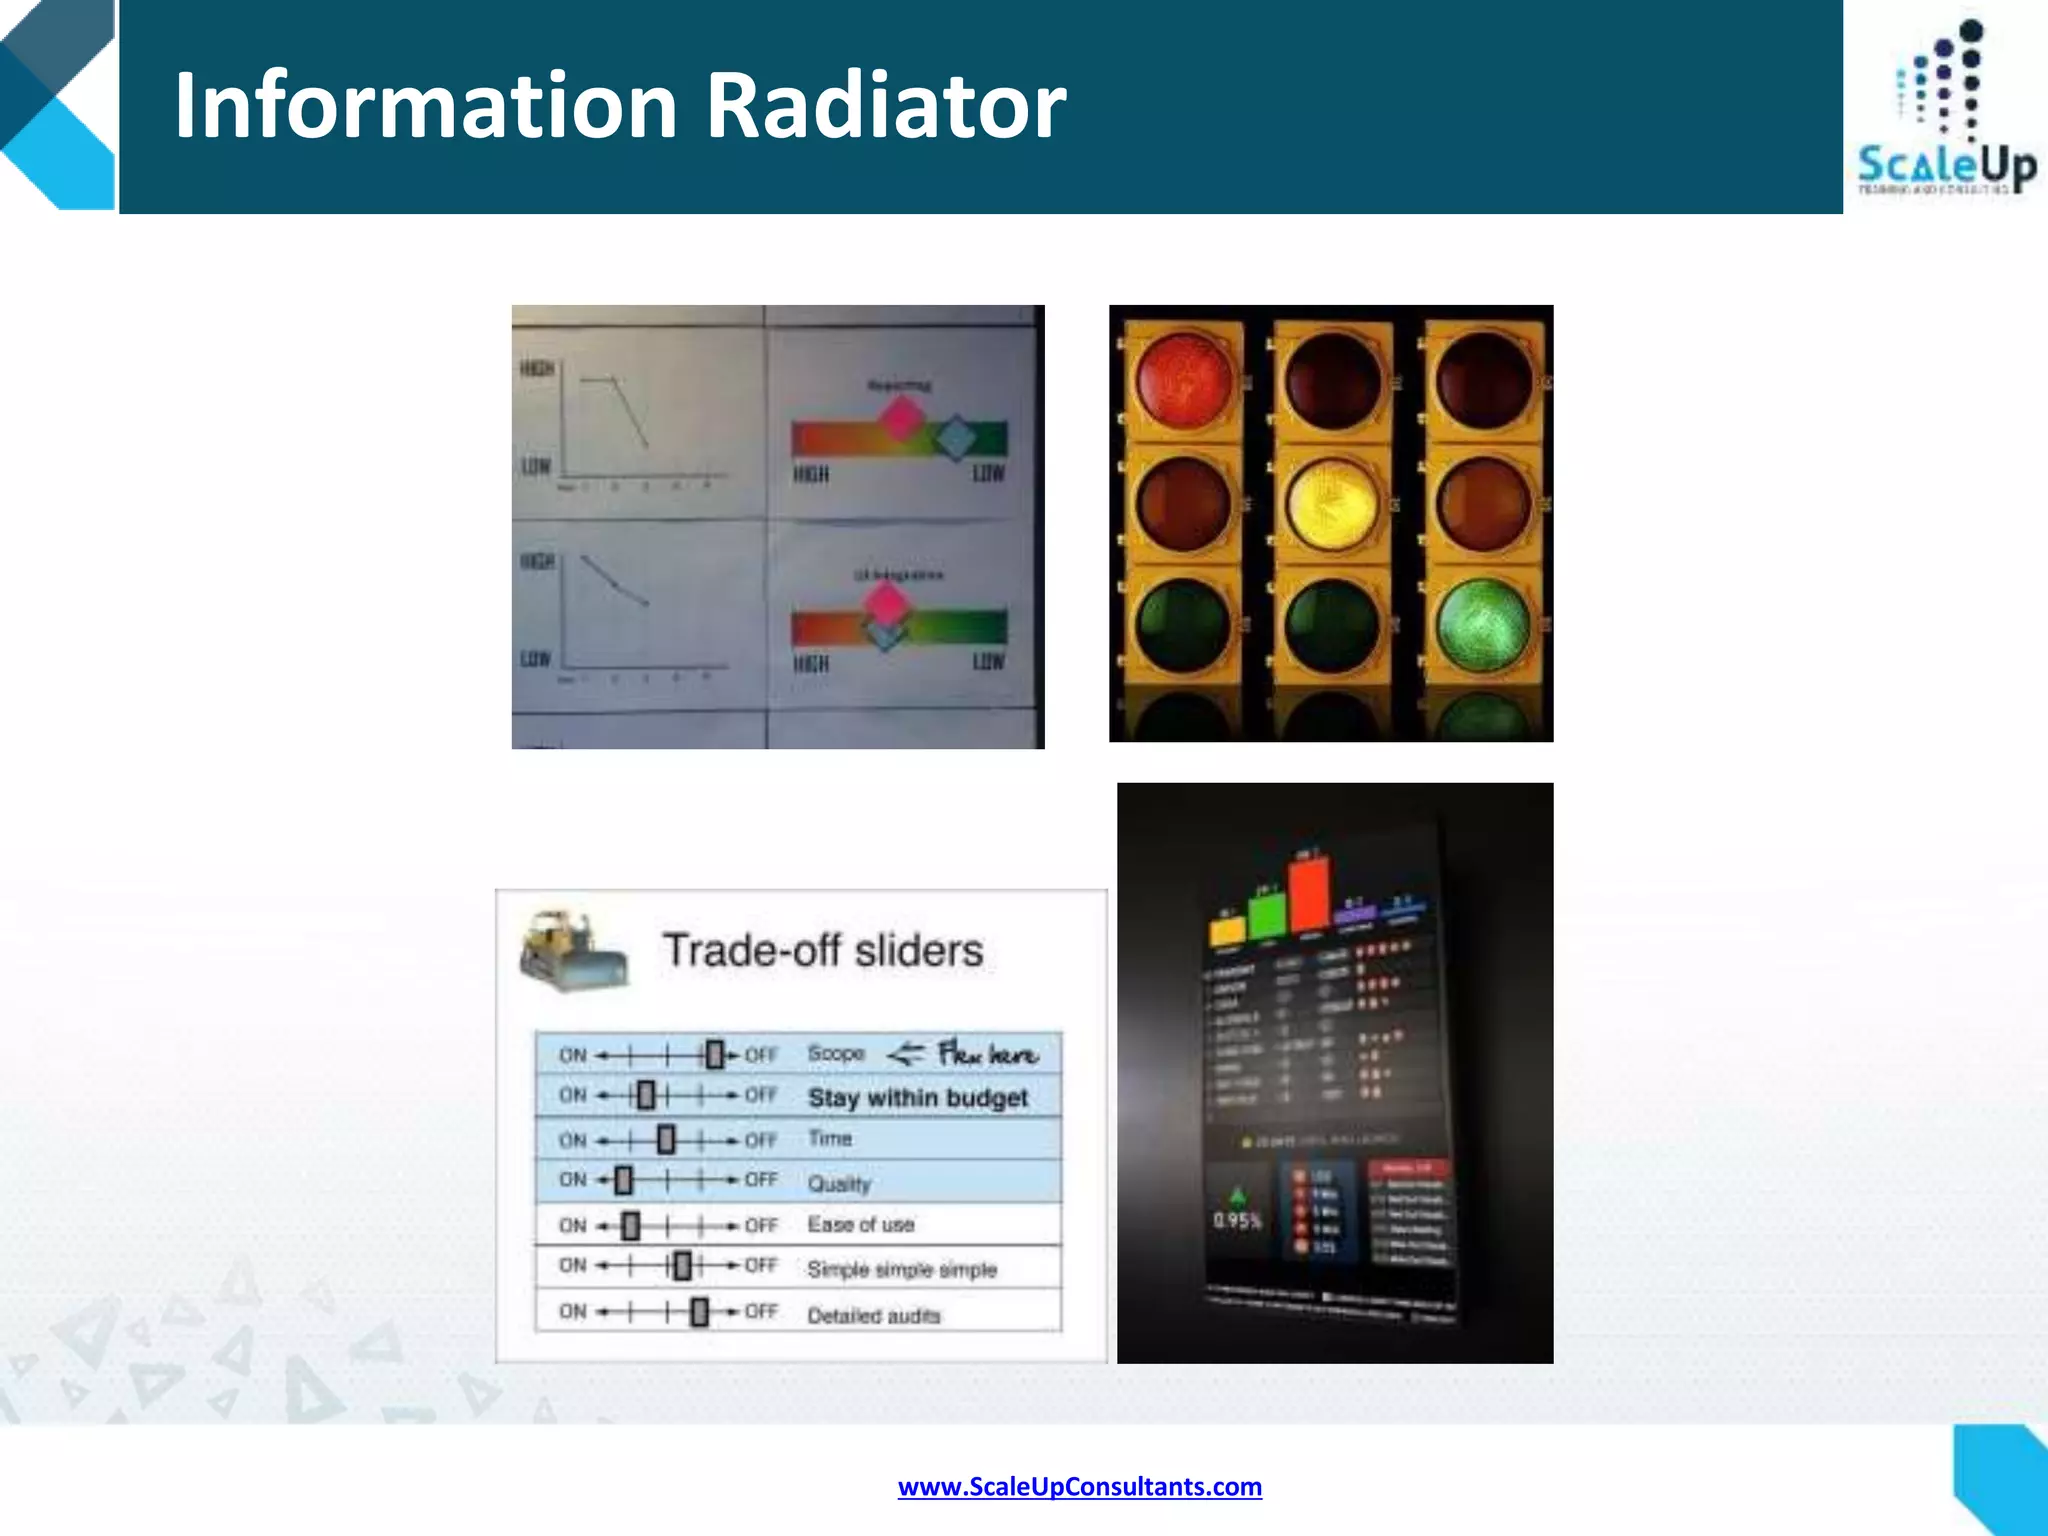
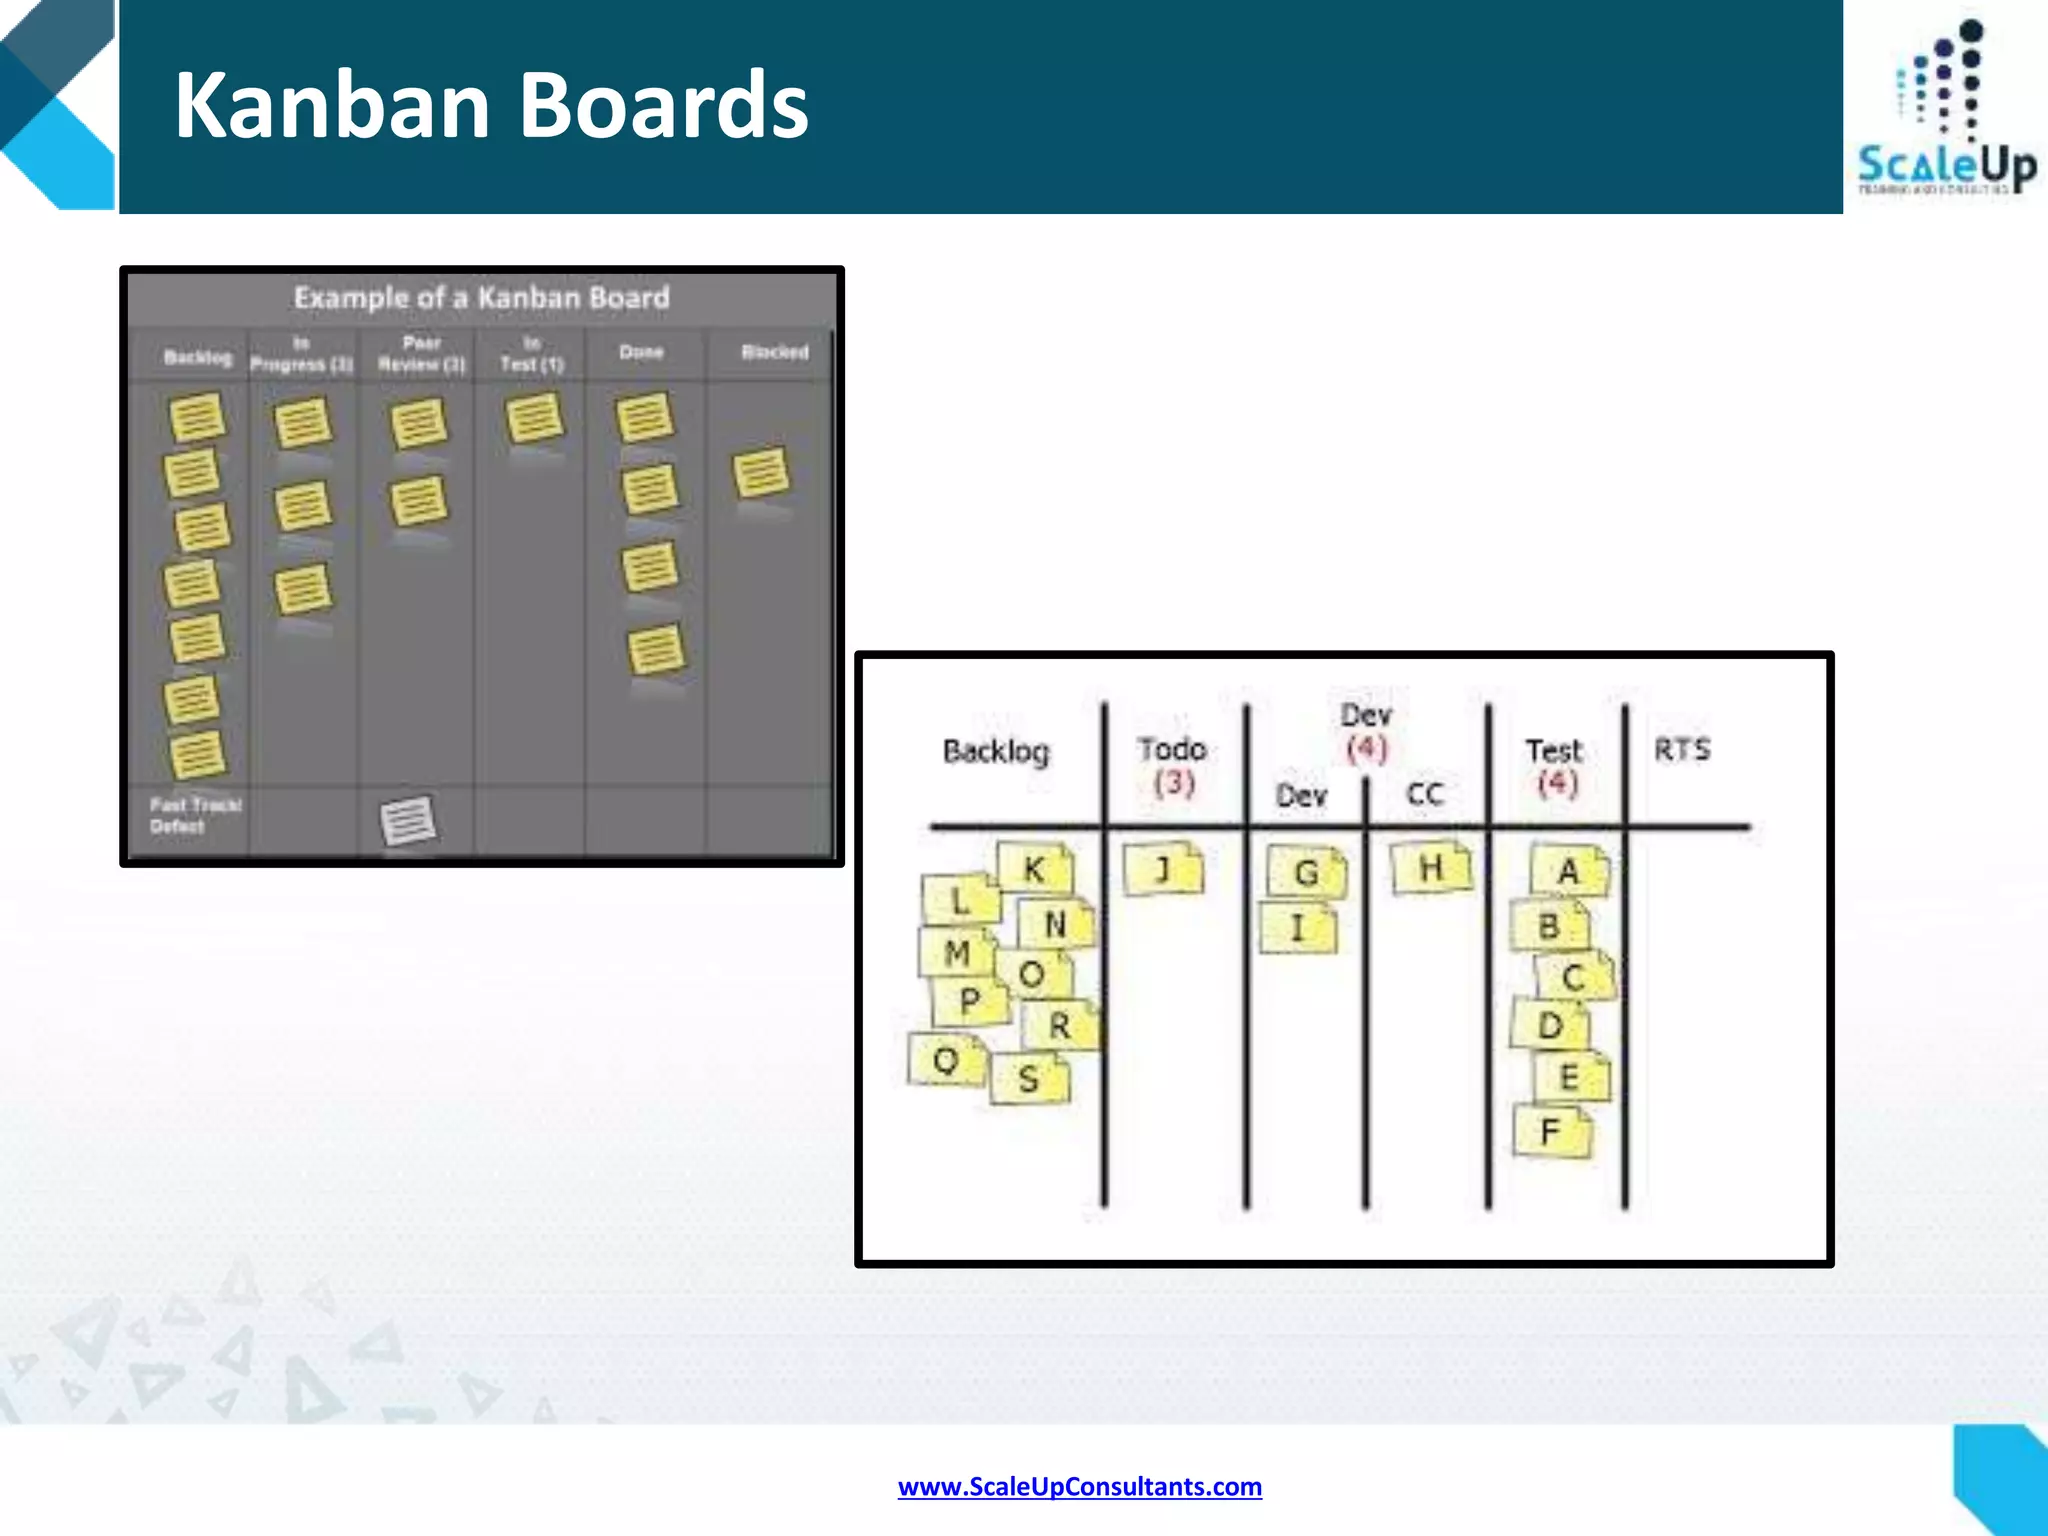
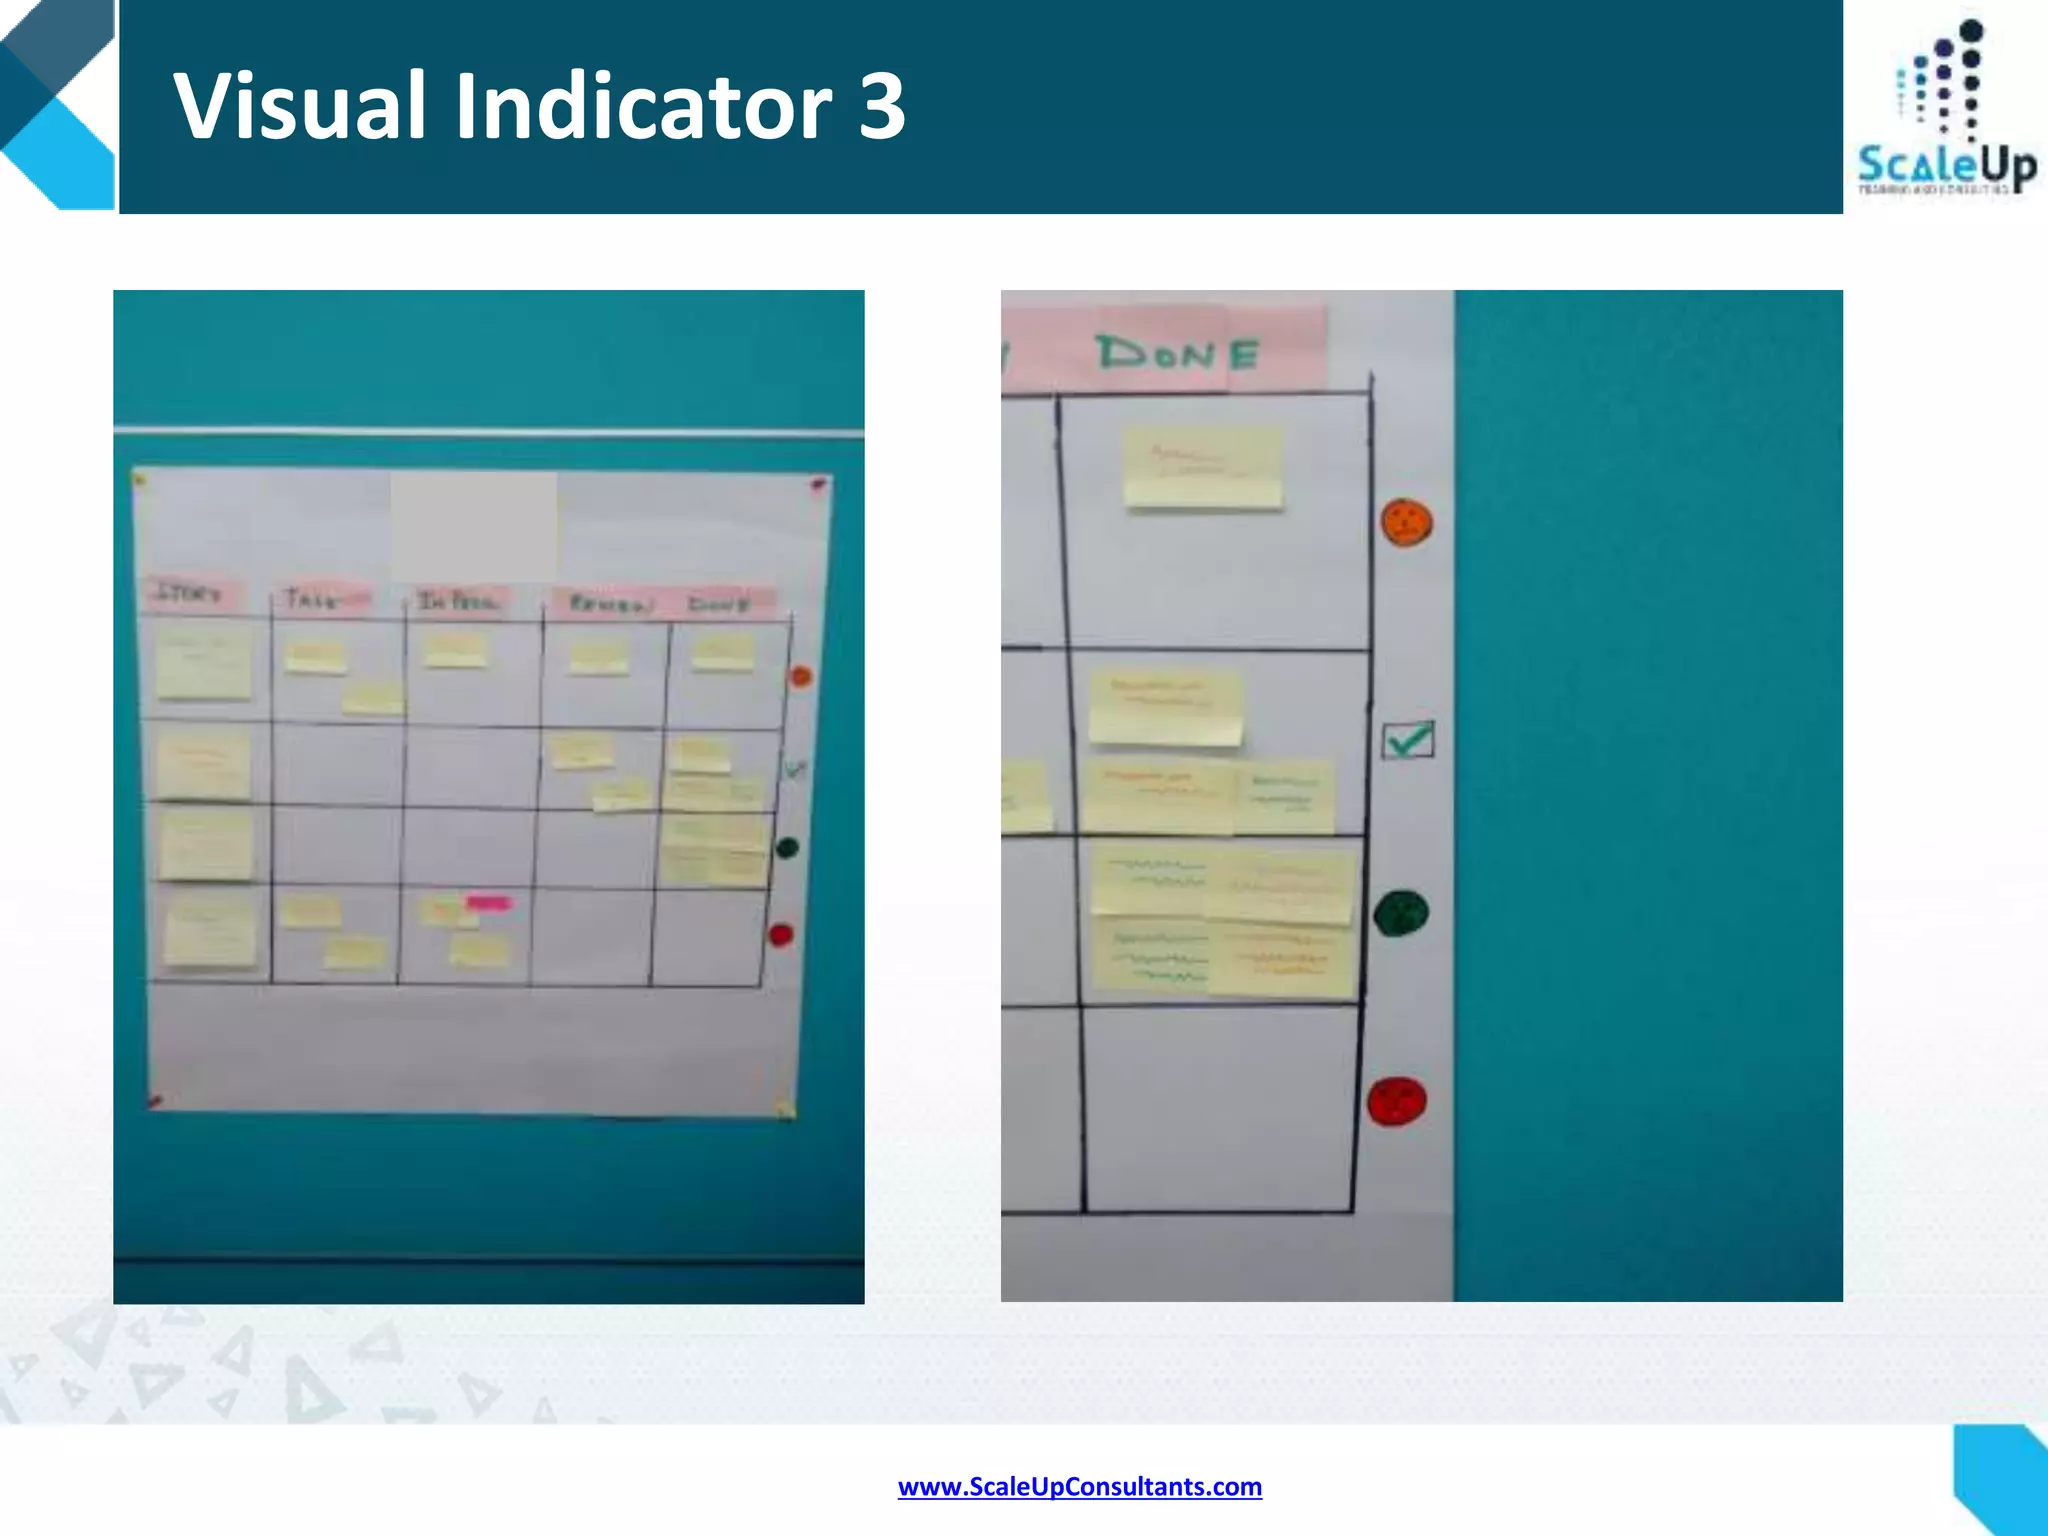
Defining and discussing characteristics of information radiators like task boards and charts.
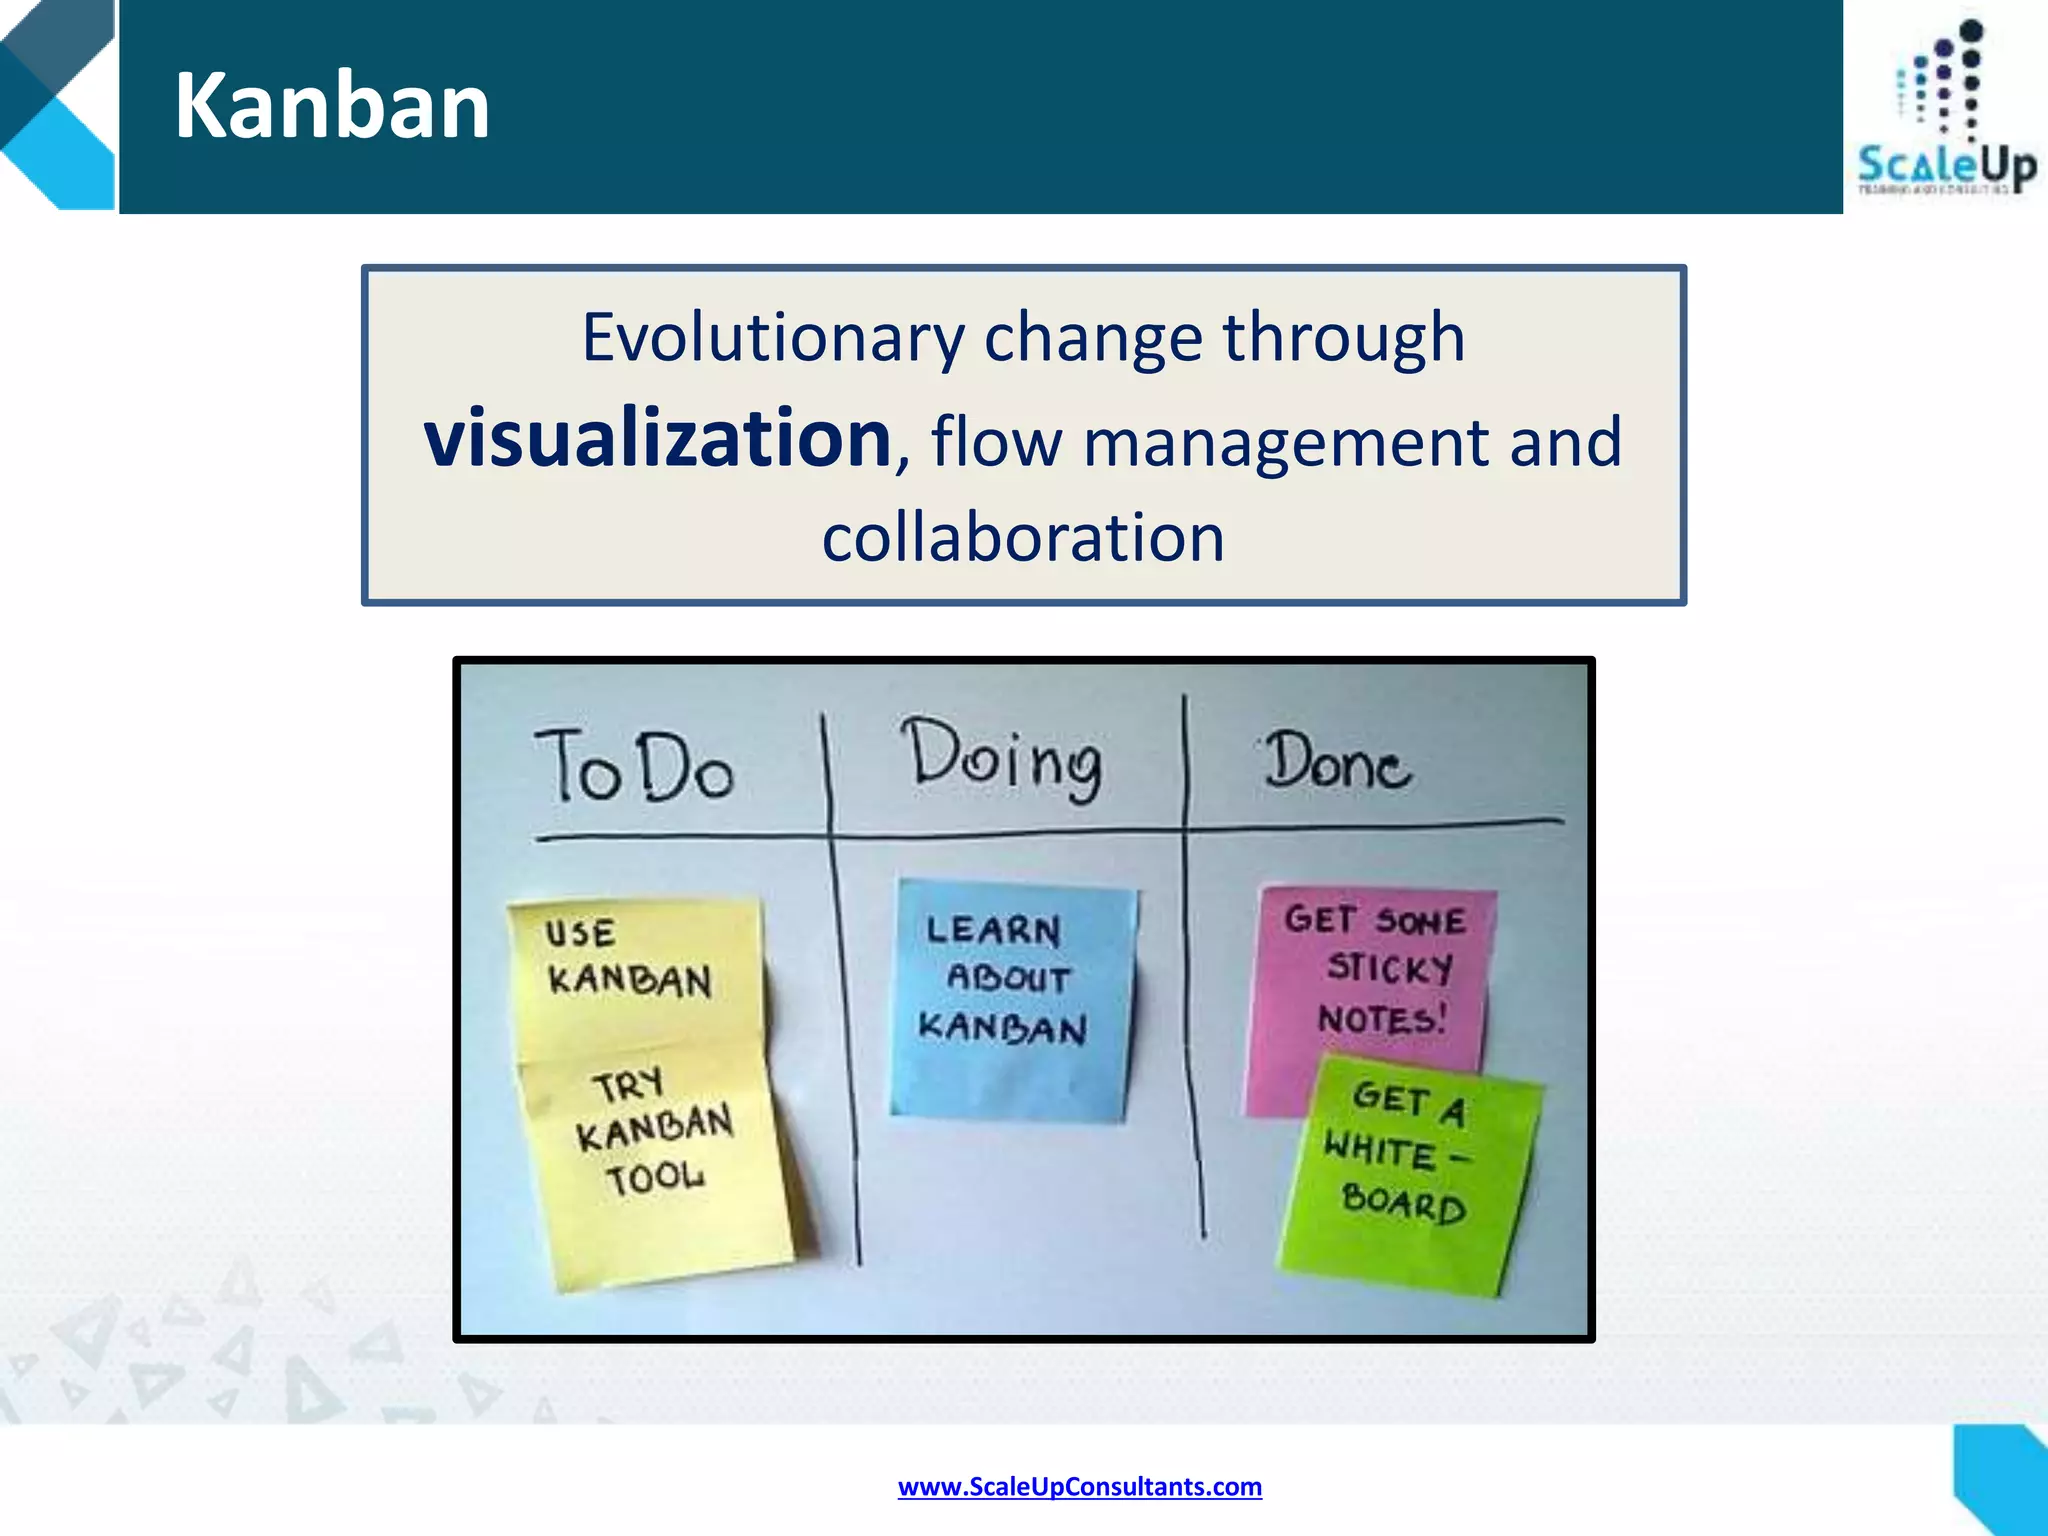
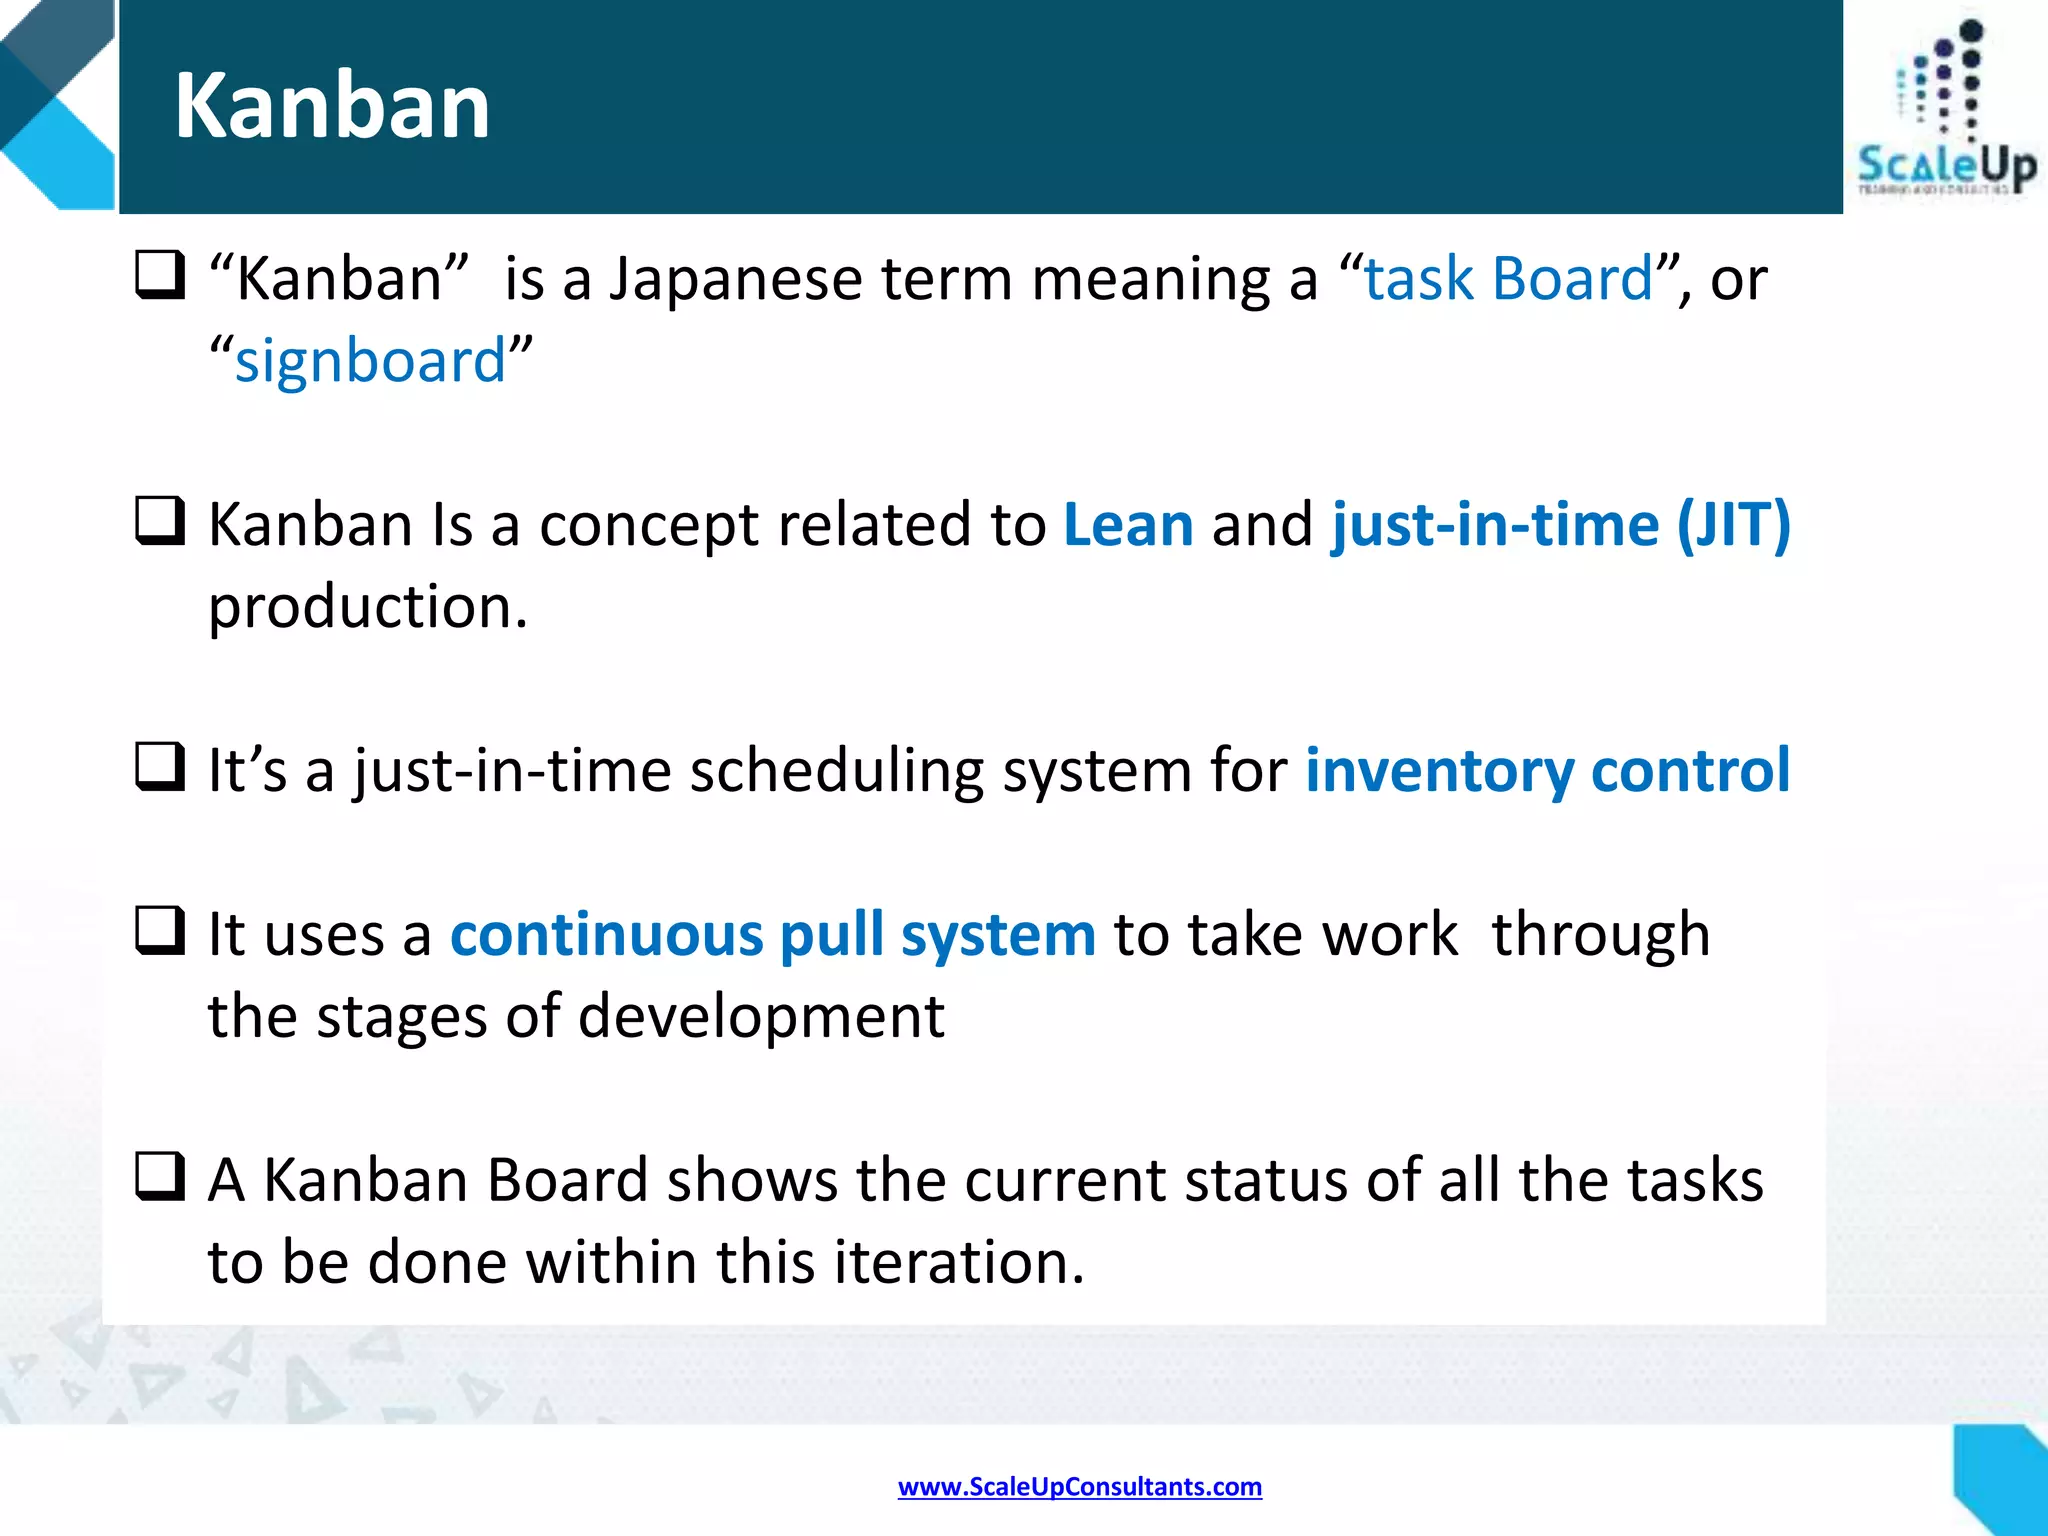
Introduction to Kanban principles and how it contributes to workflow management in Agile.
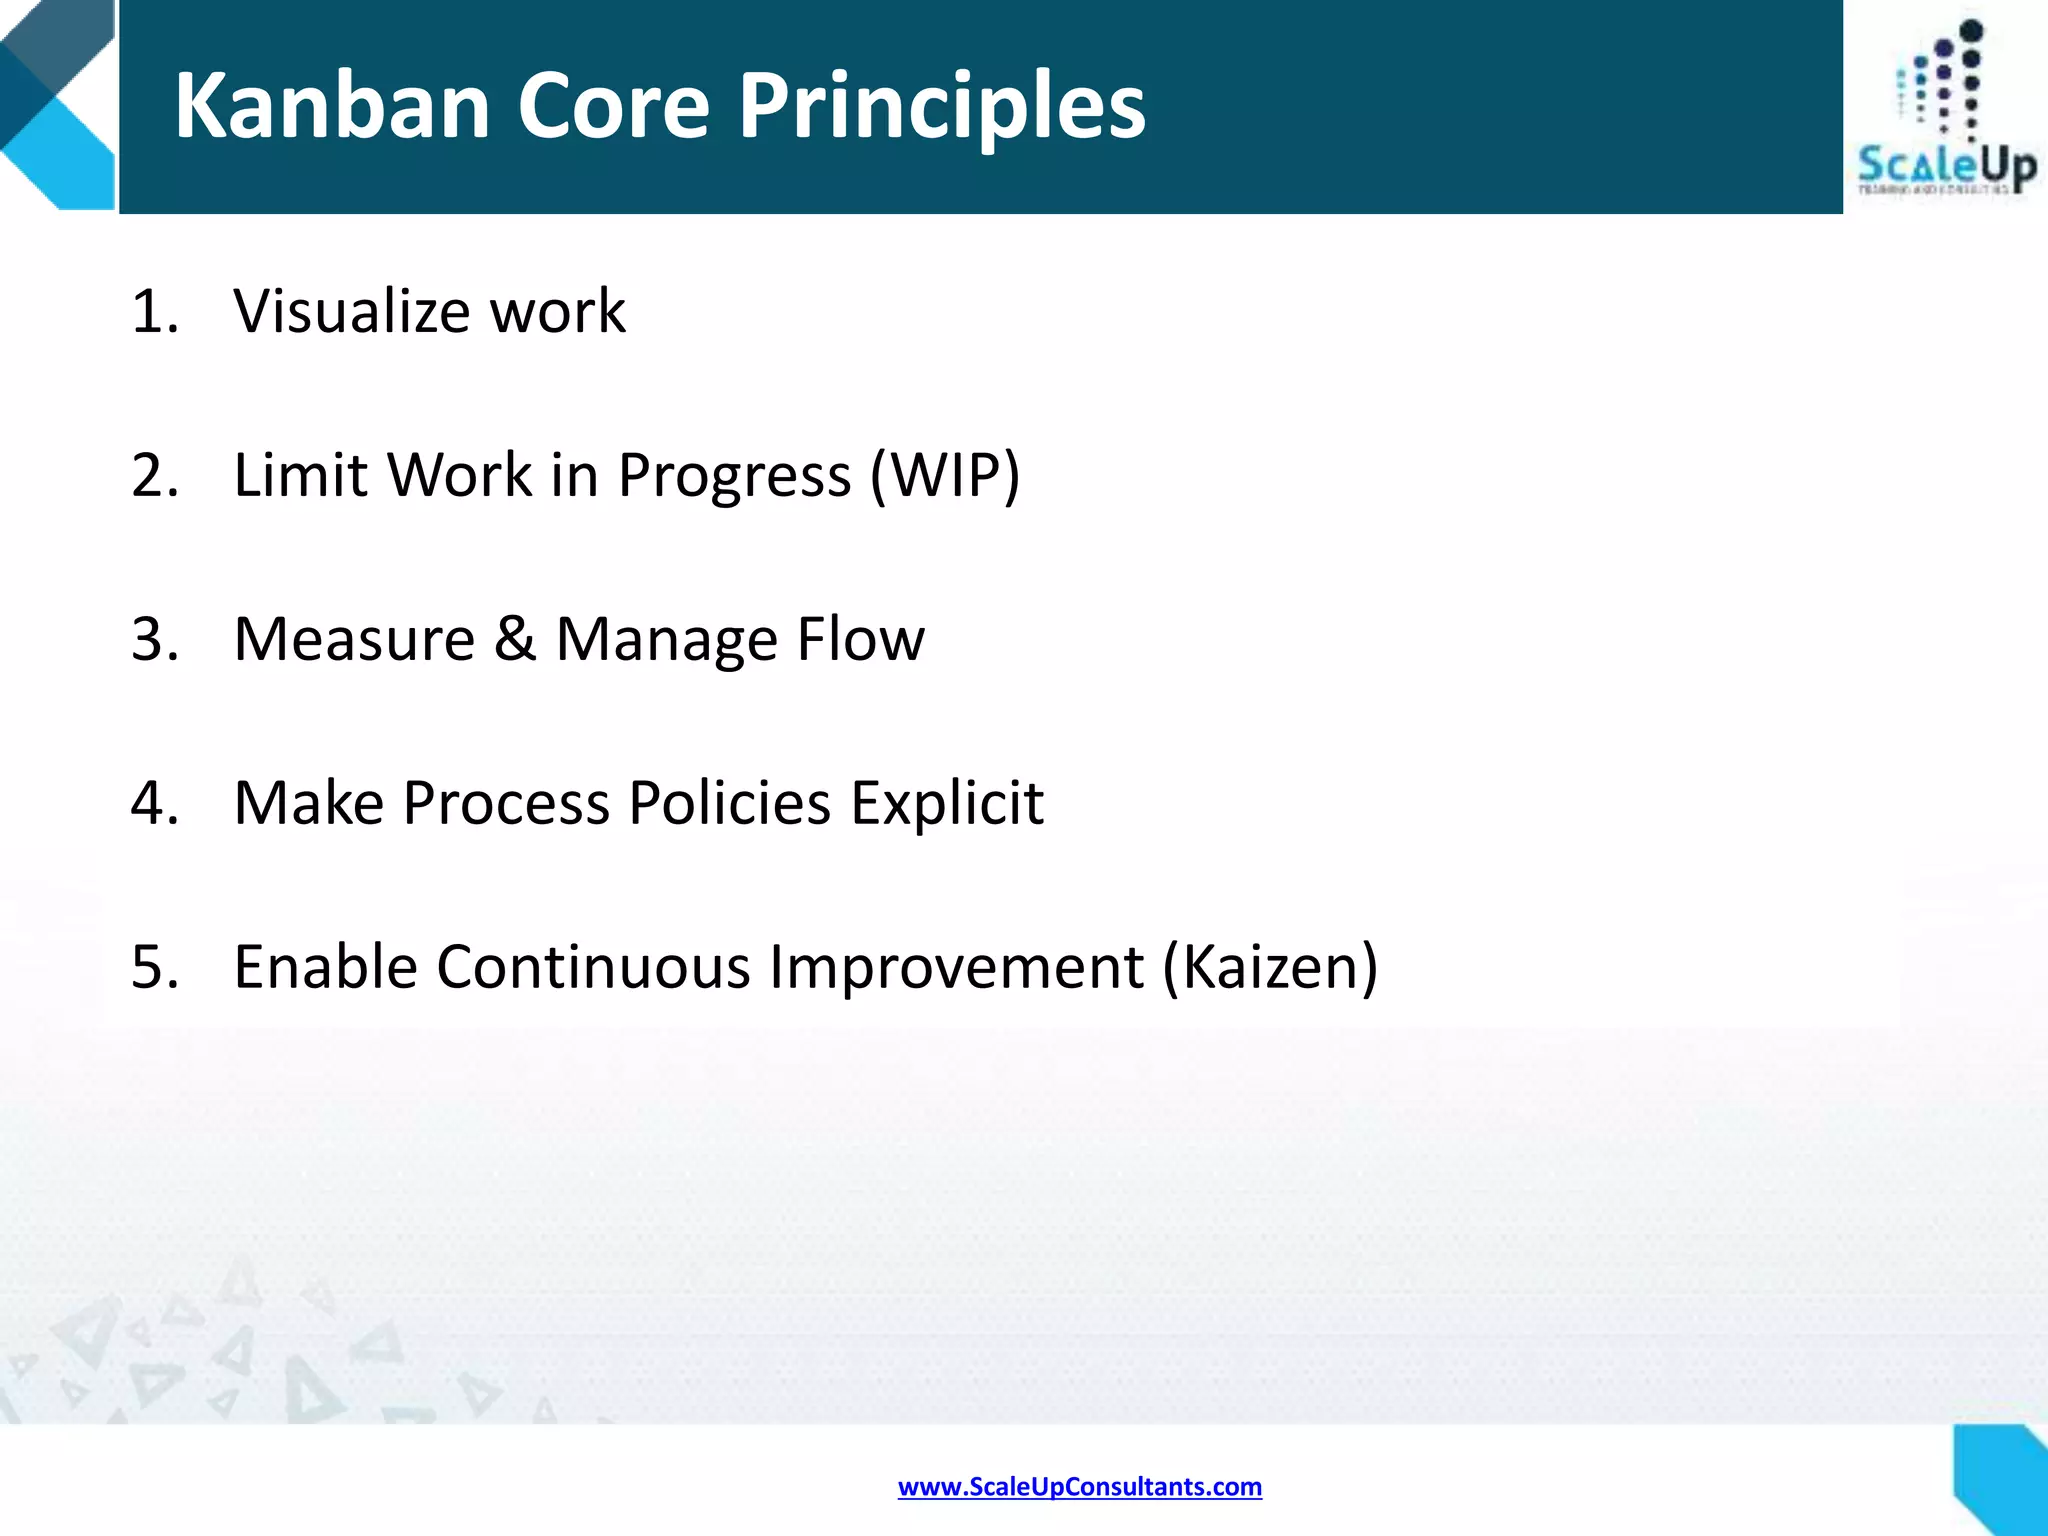
Details core principles of Kanban including work visualization and process policies.
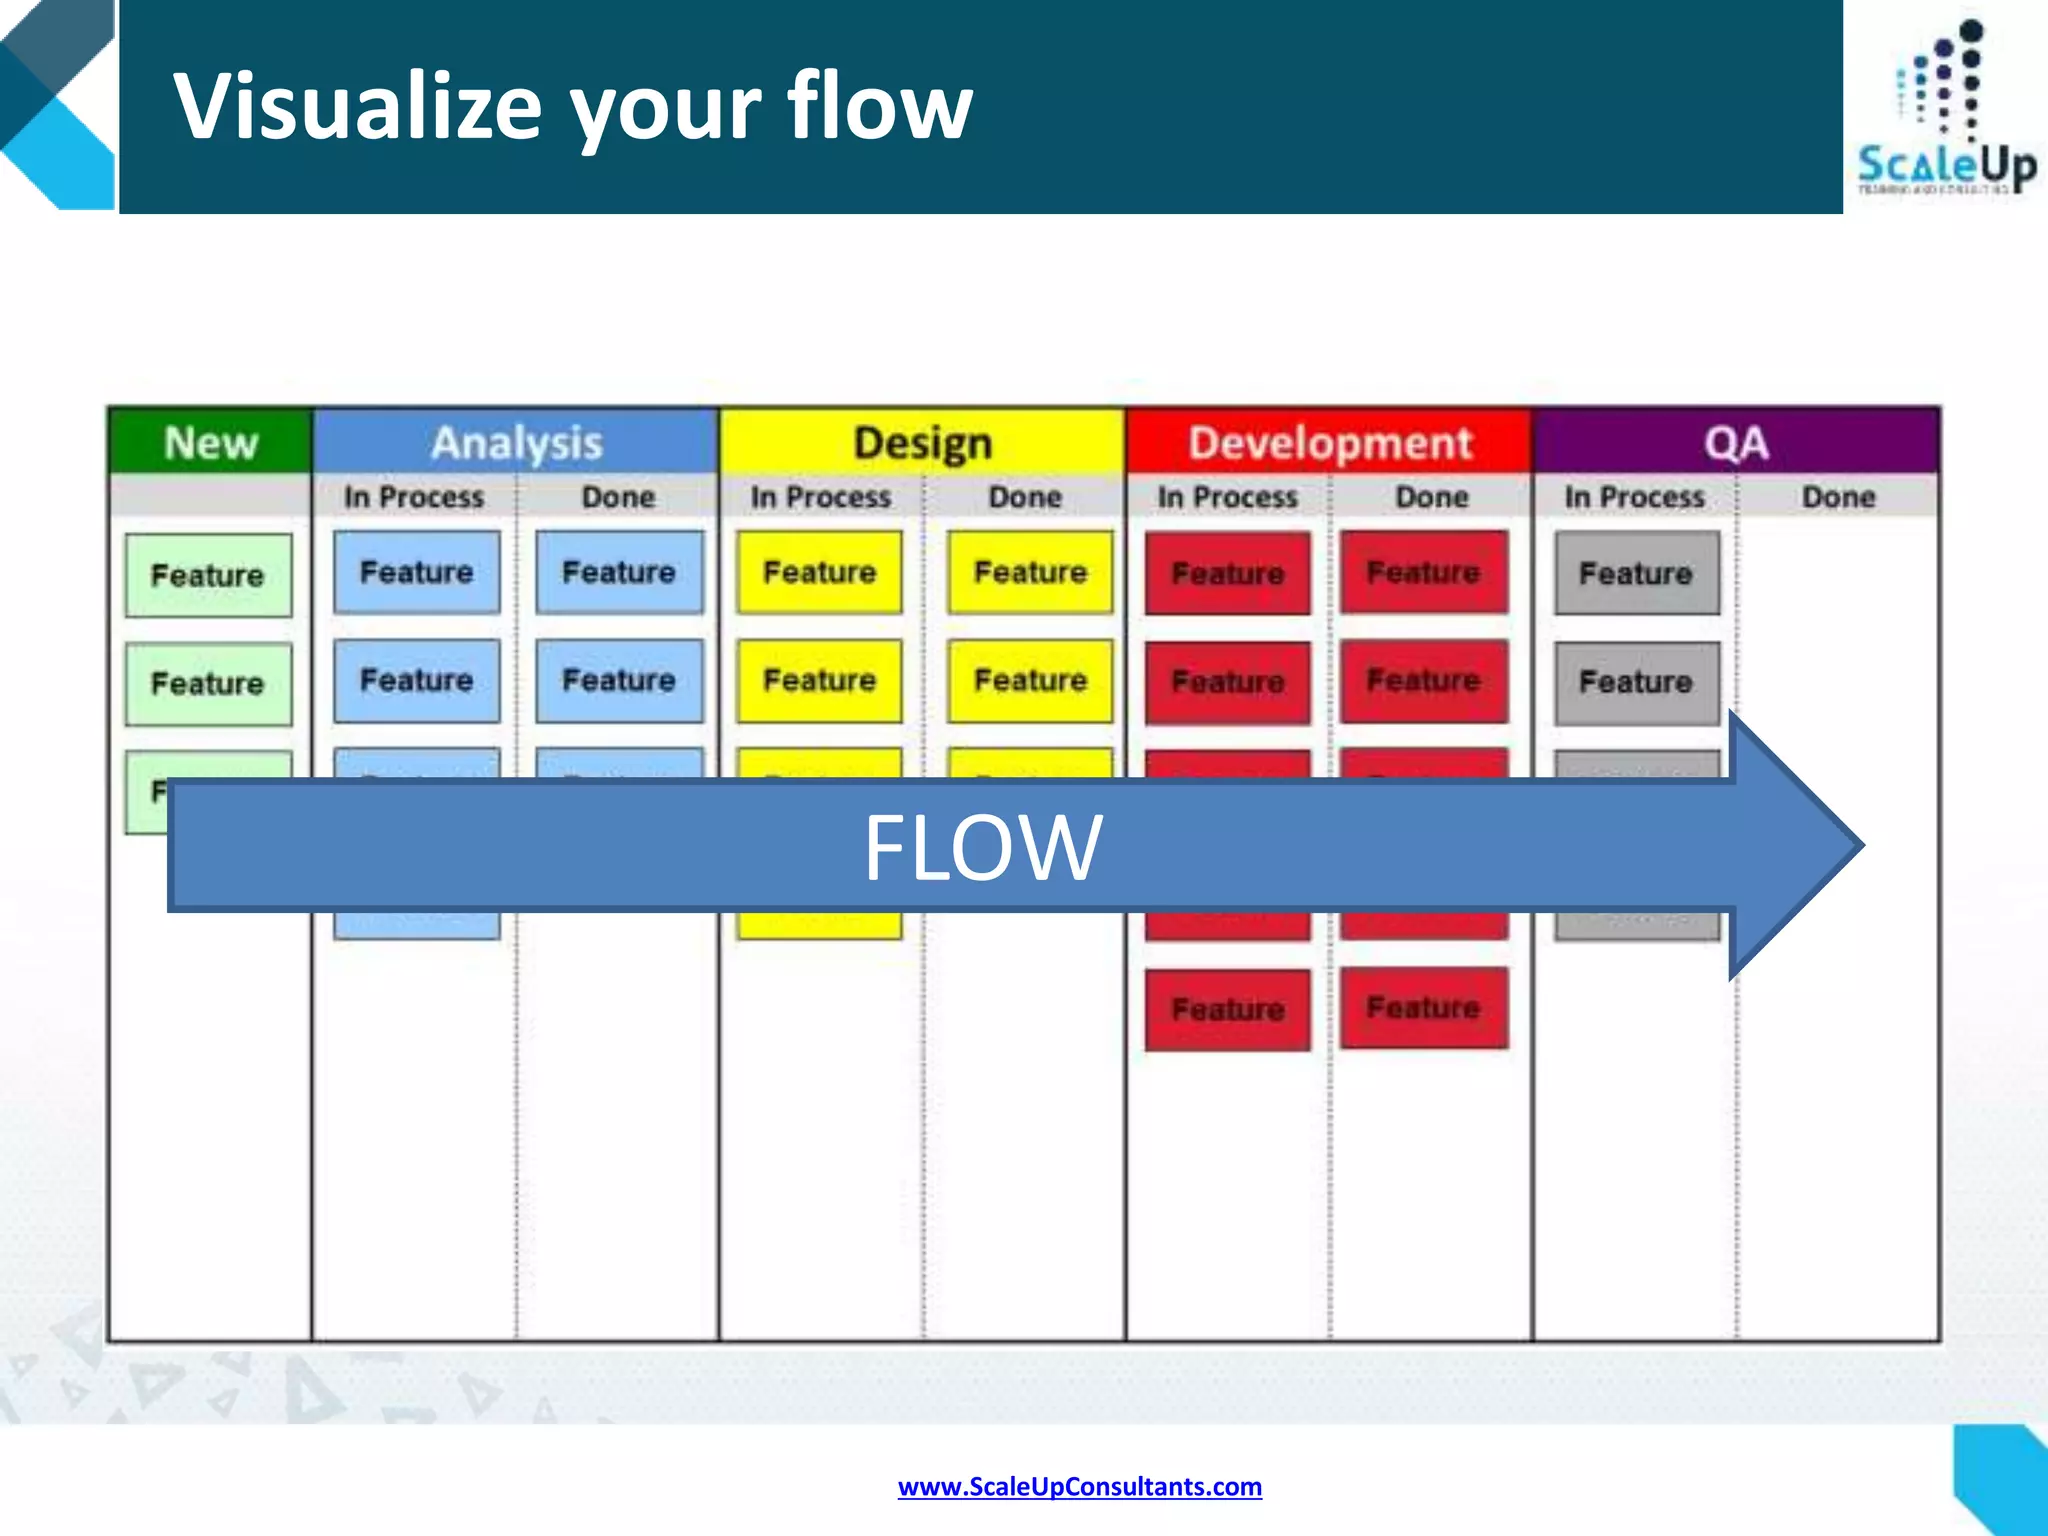
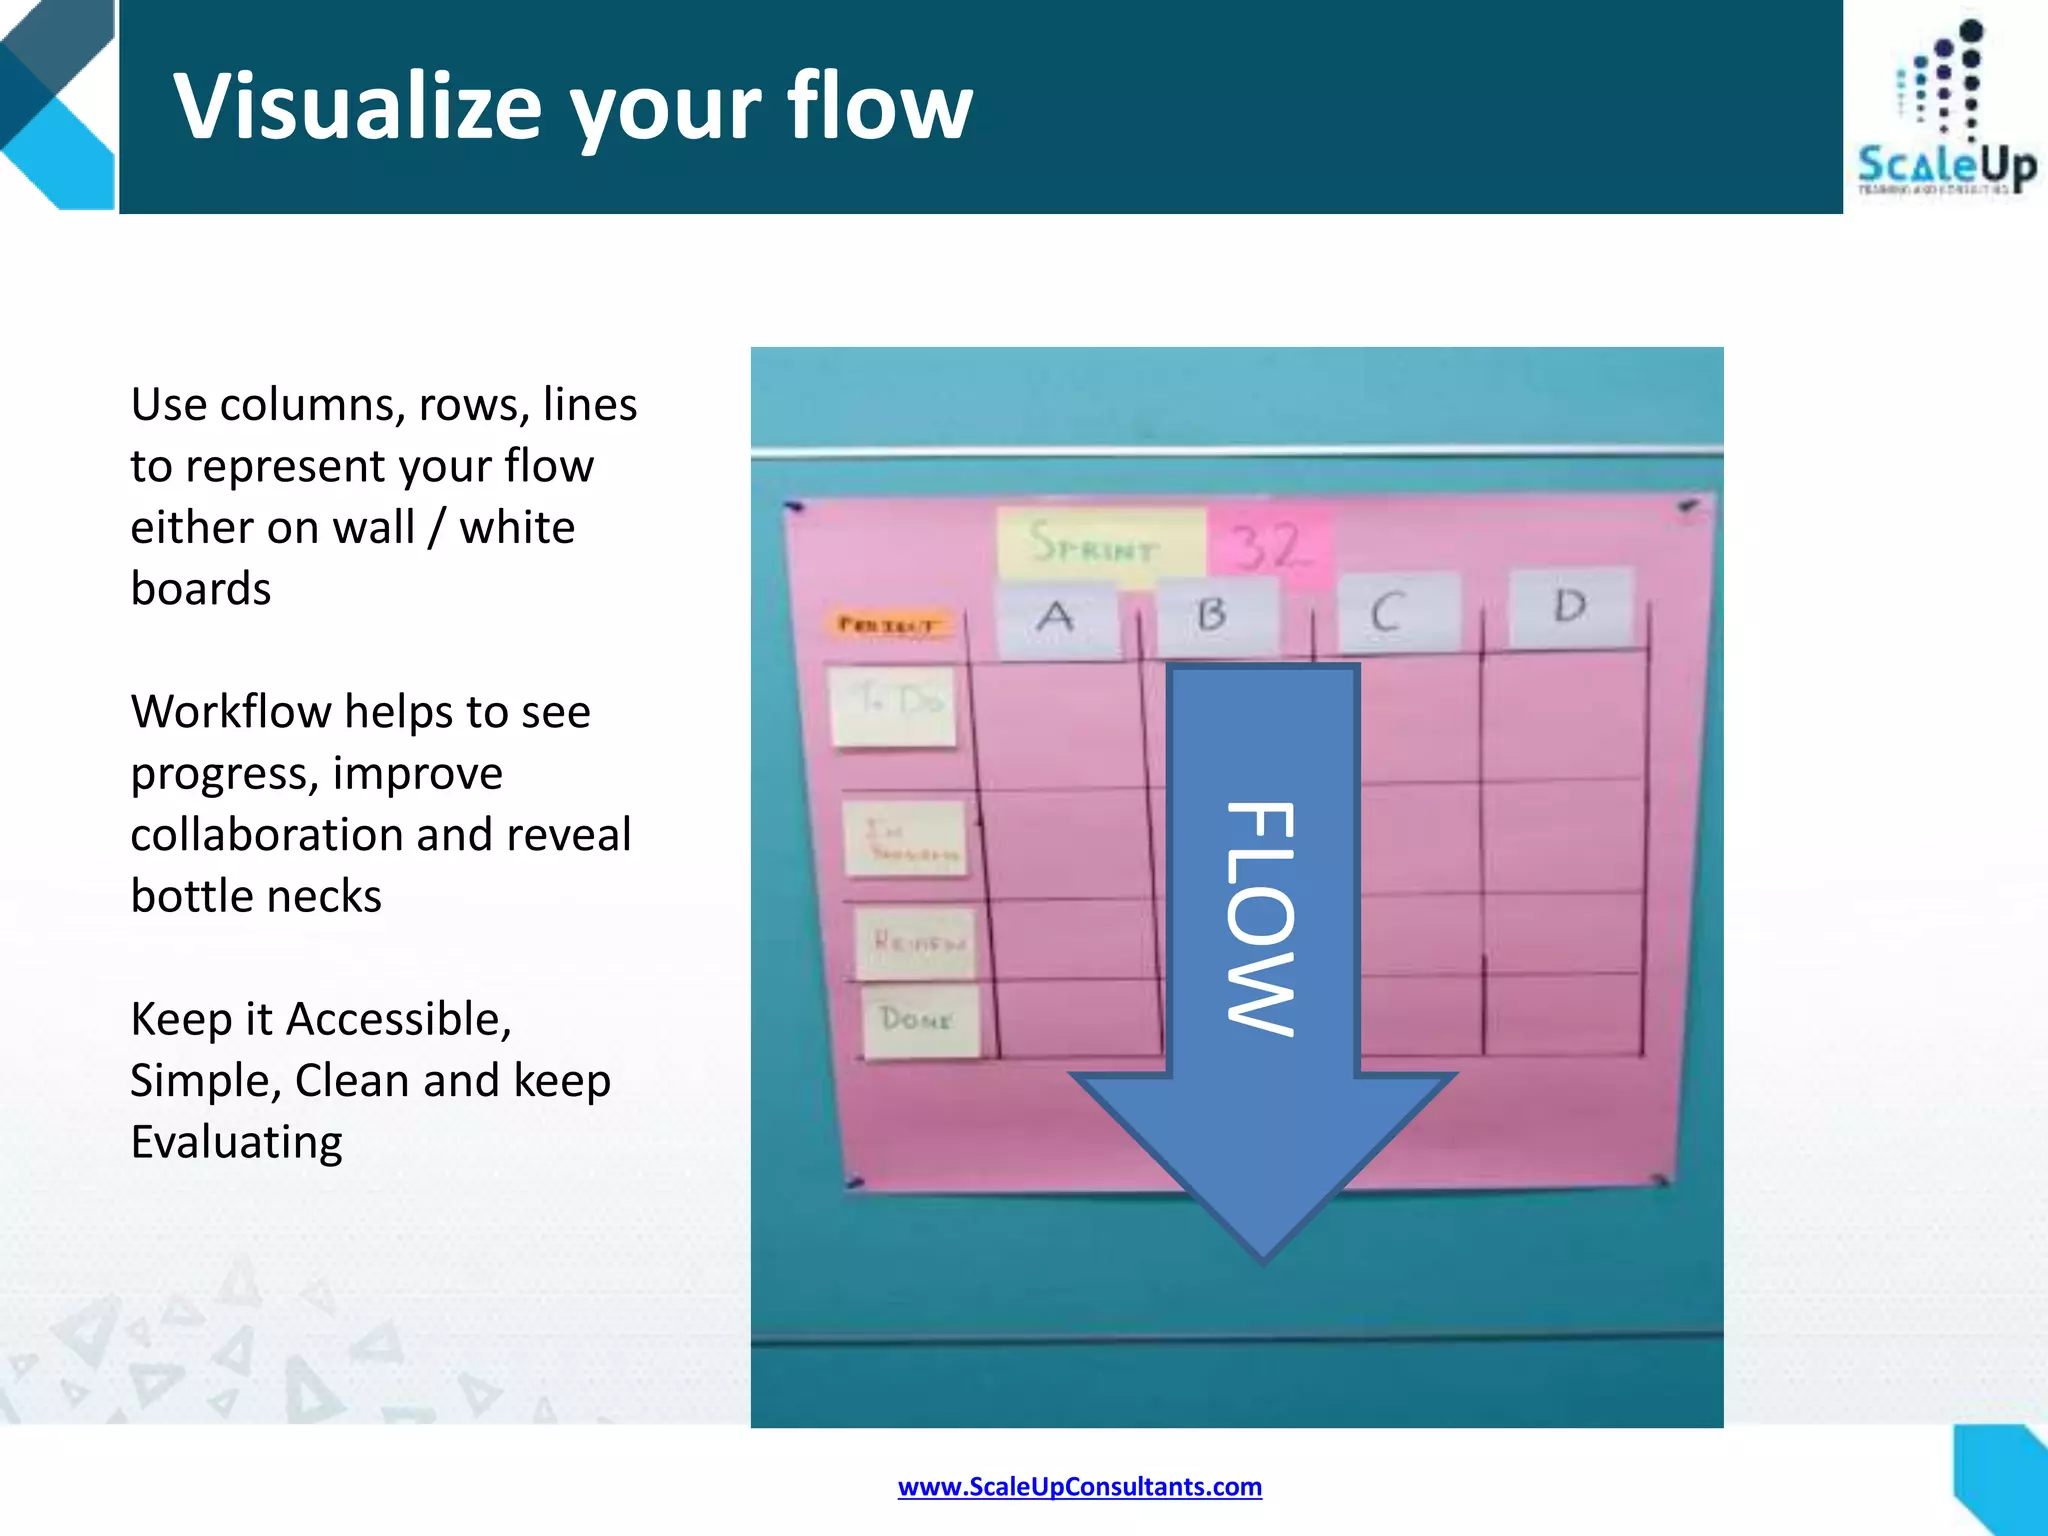
Emphasizes the importance of visualizing the flow of work and its impact on team collaboration.
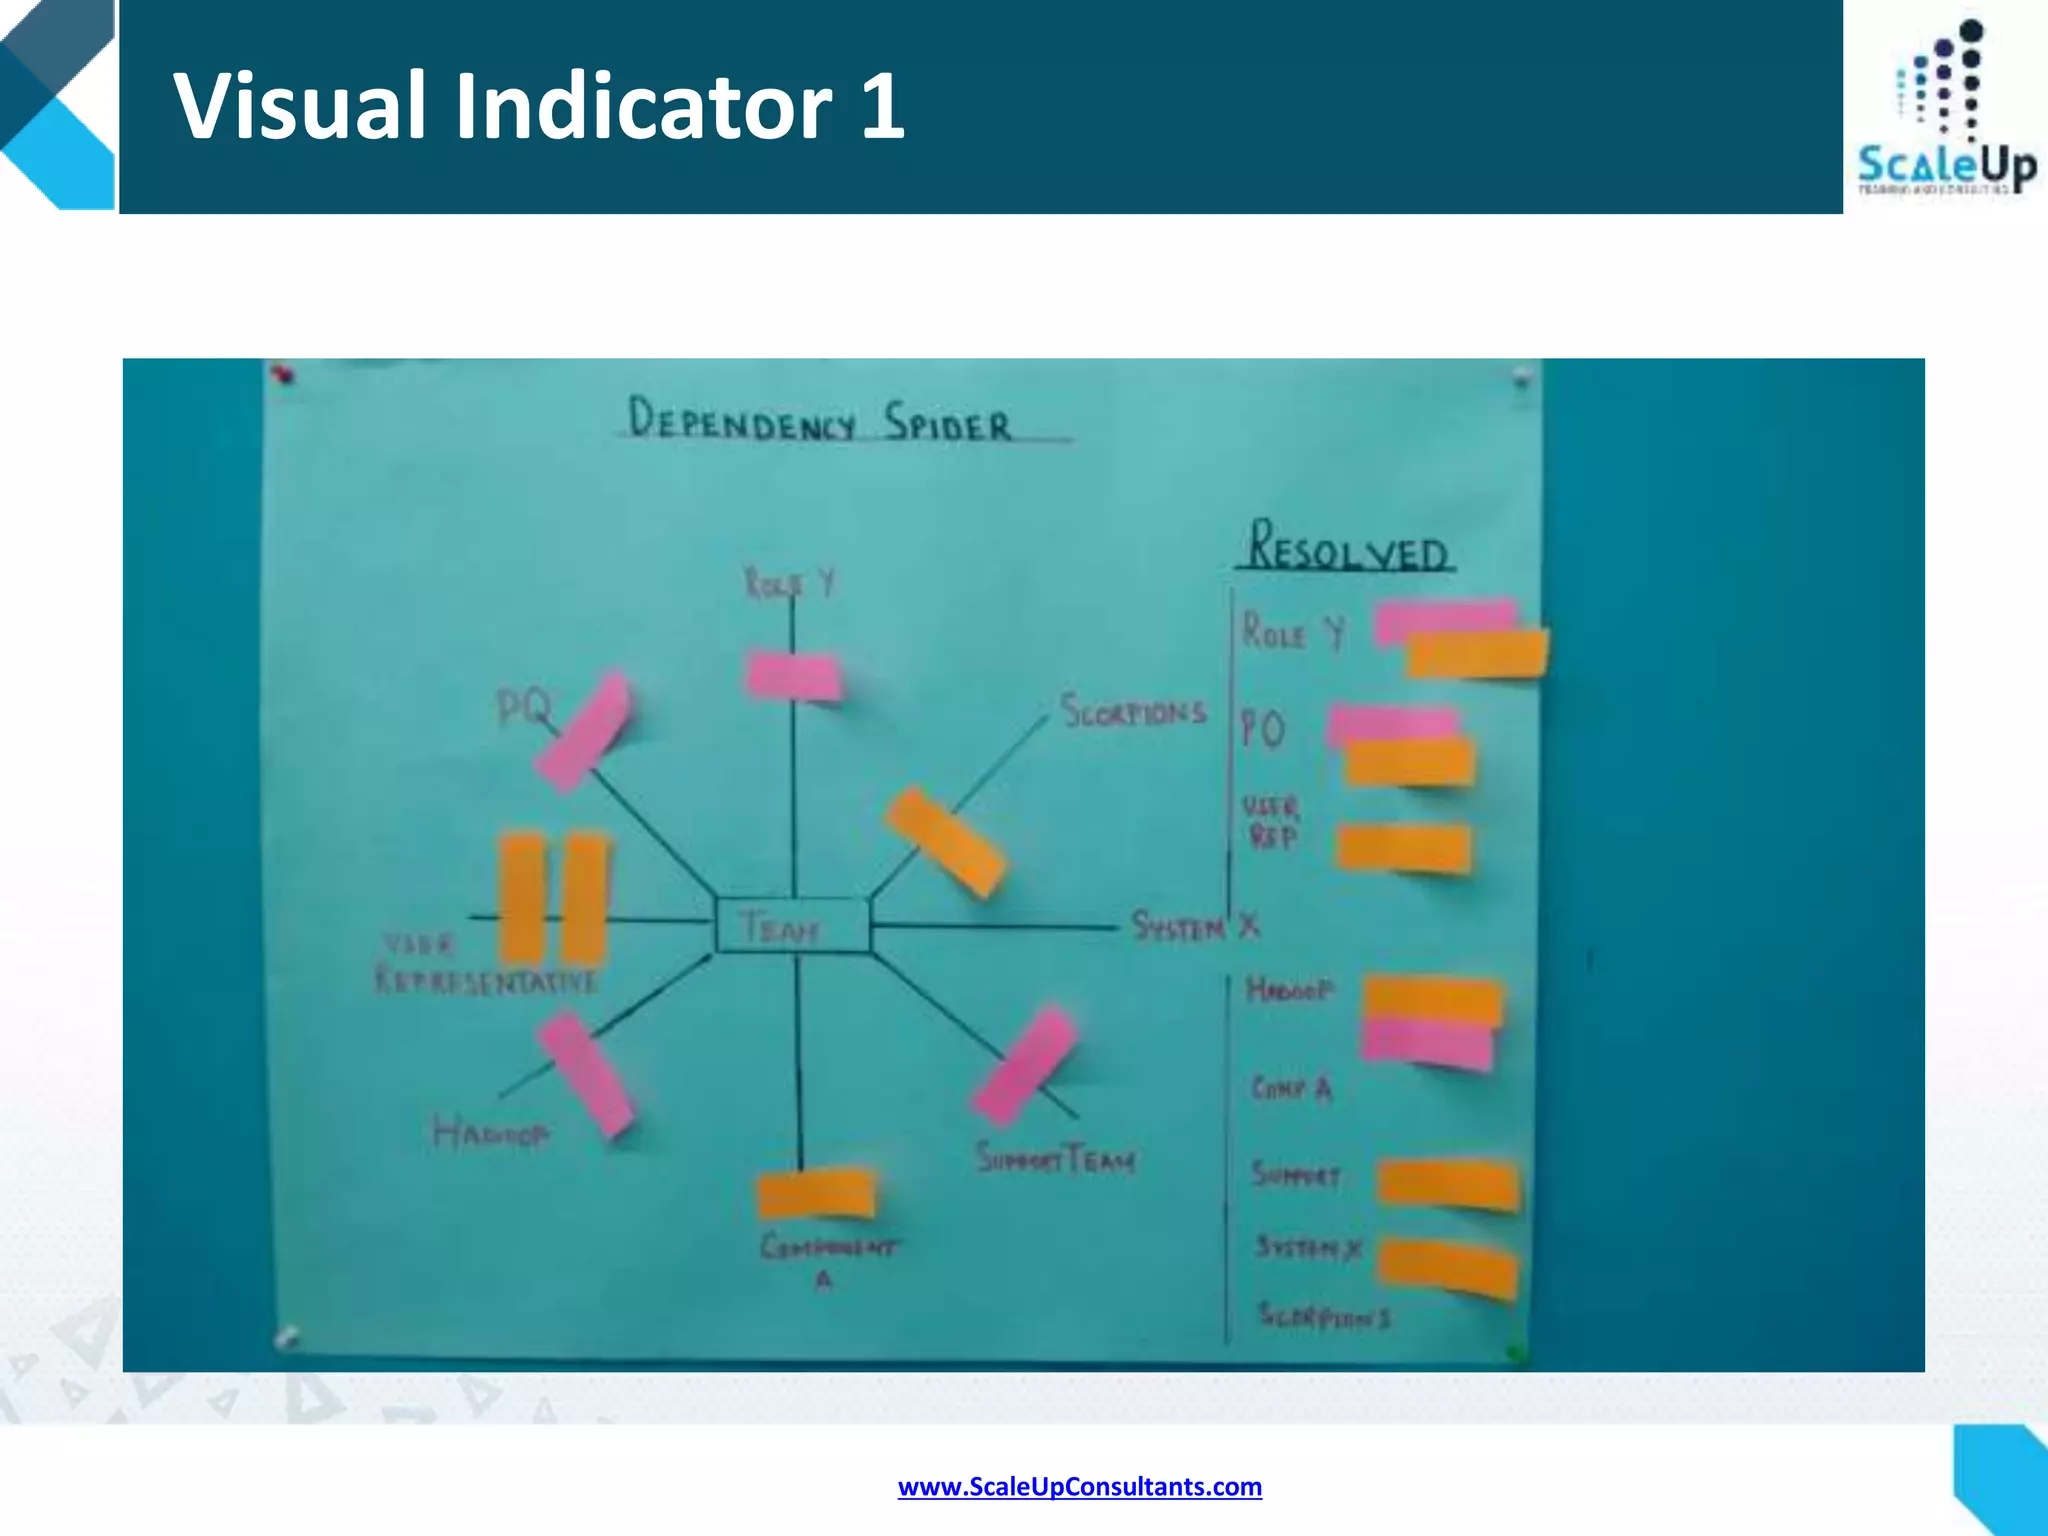
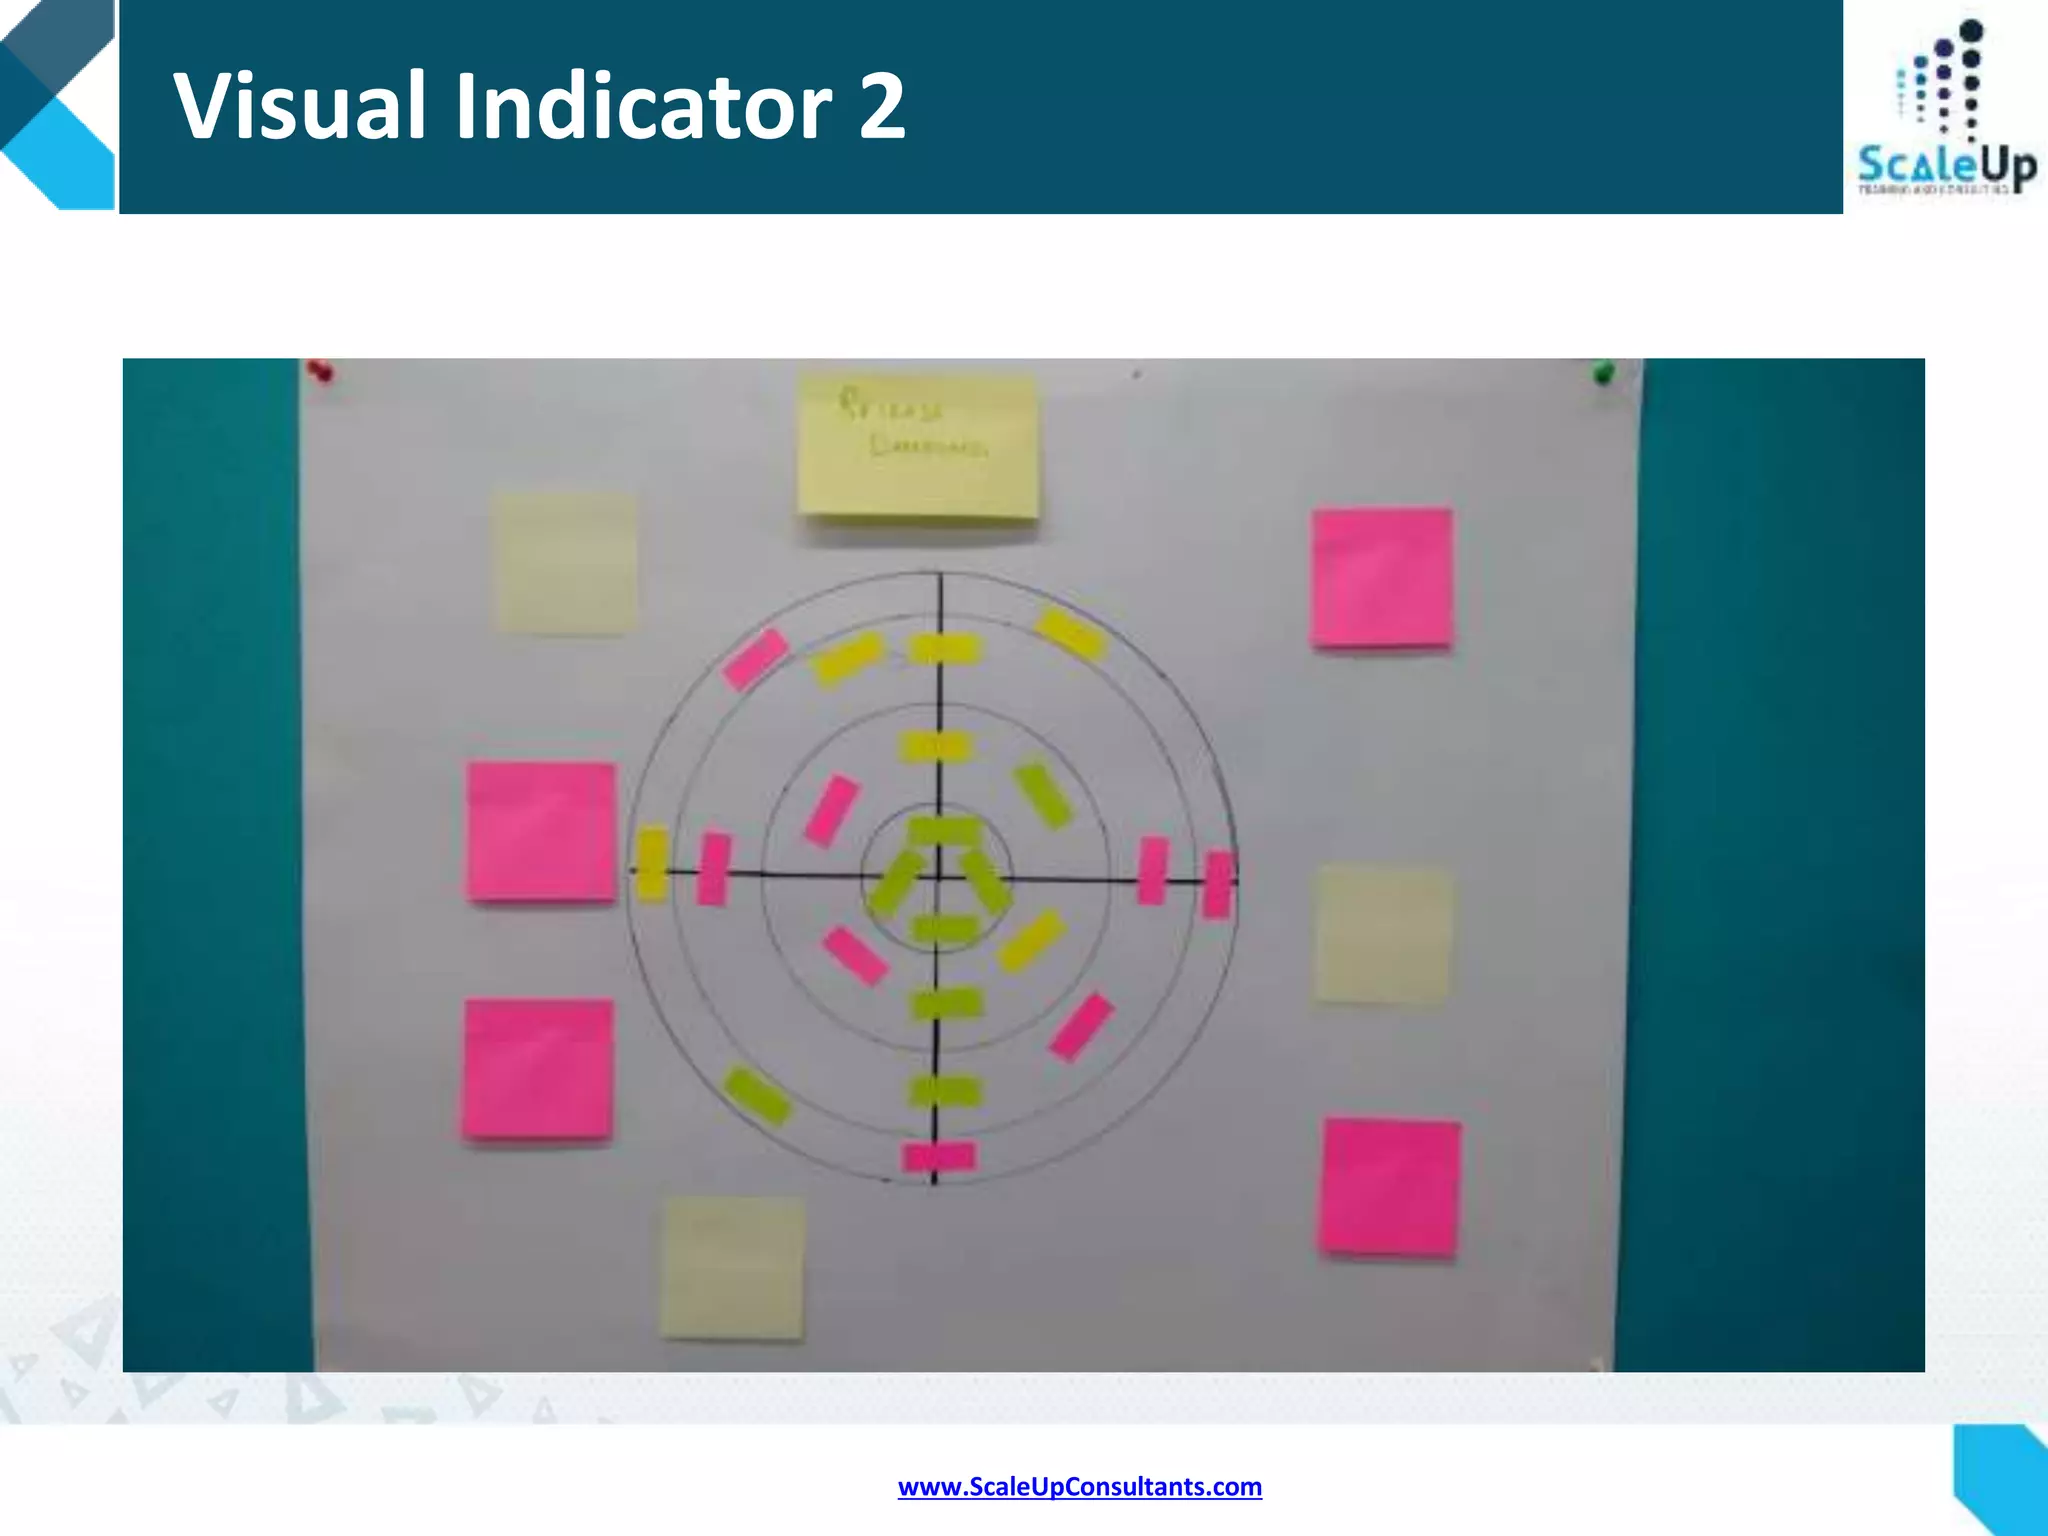
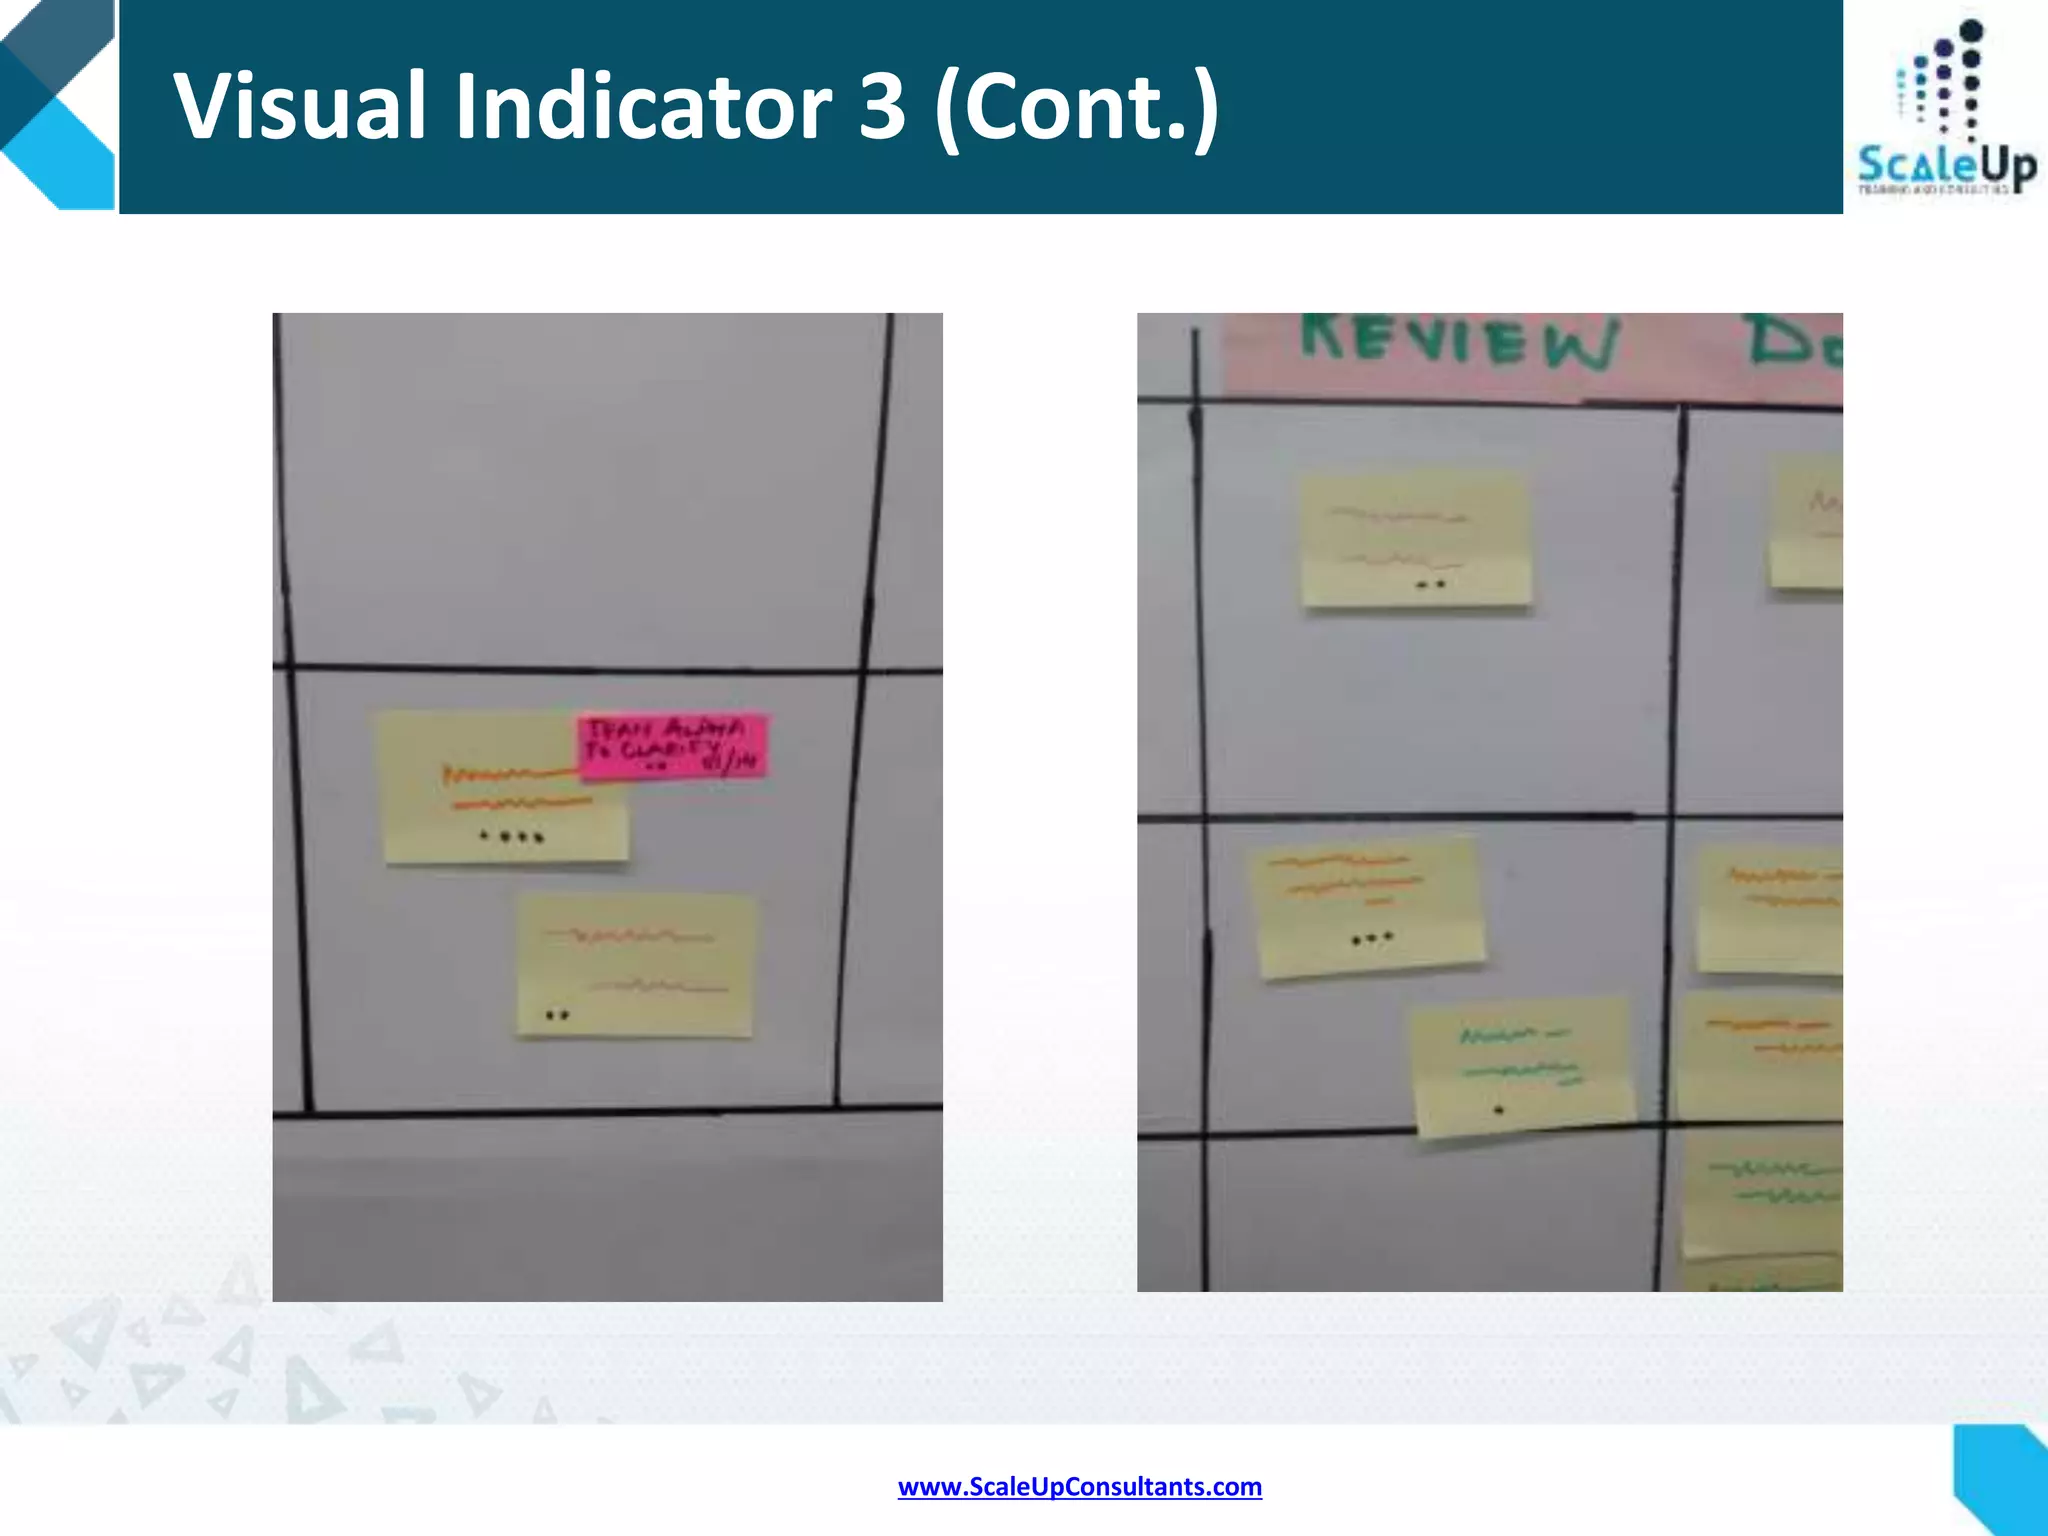
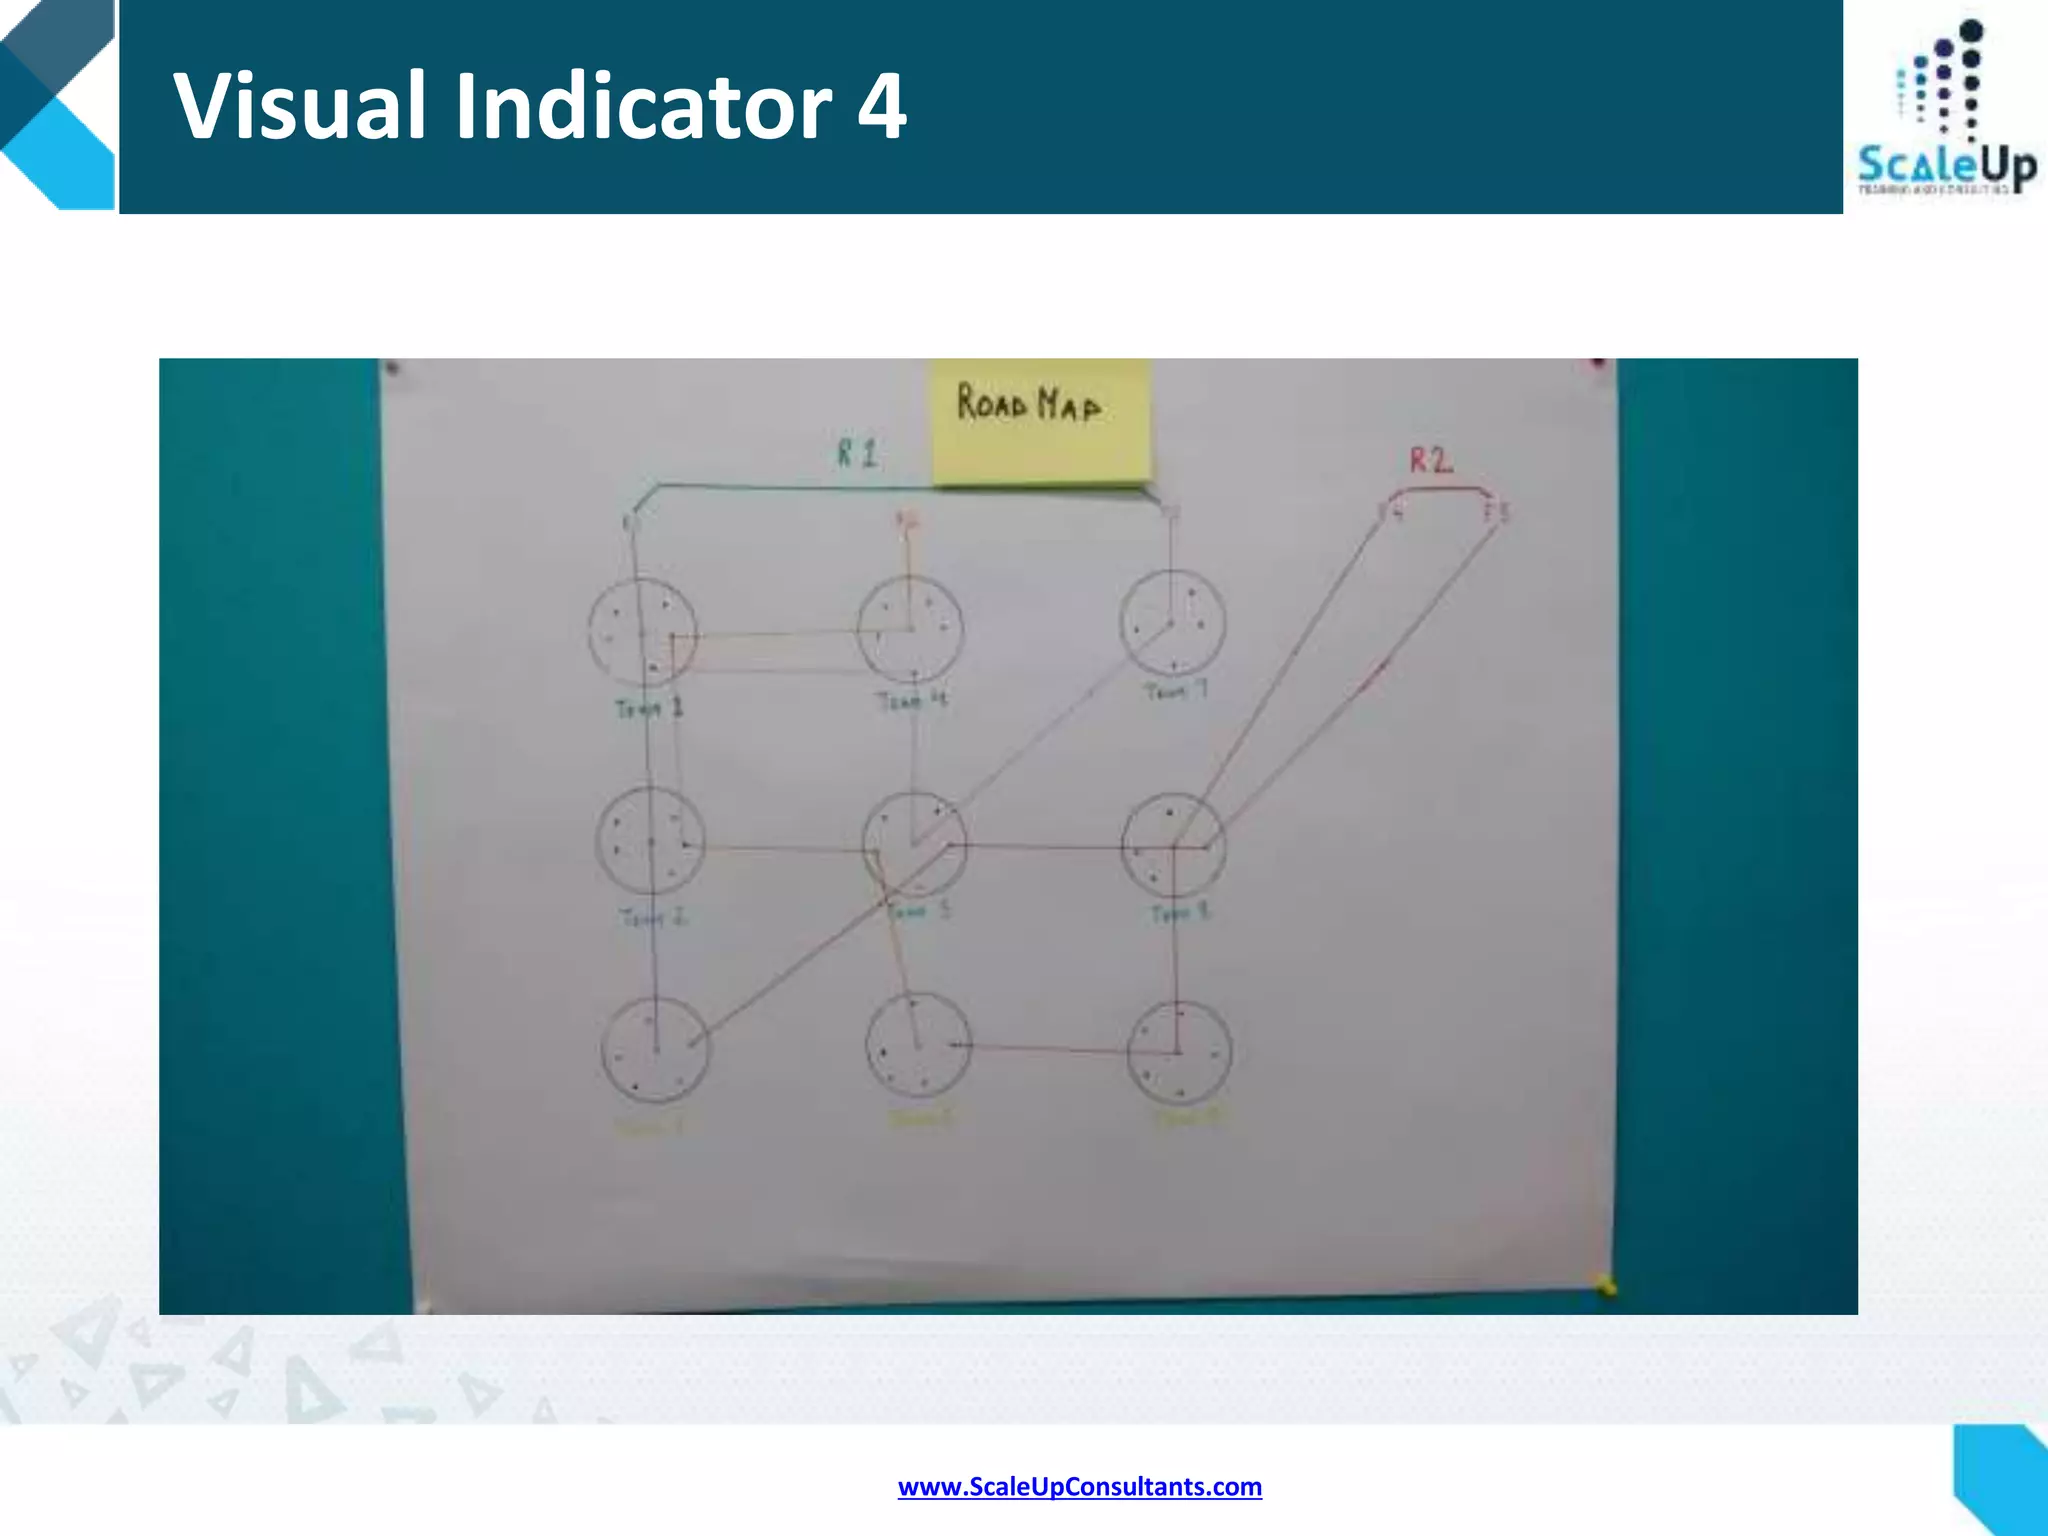
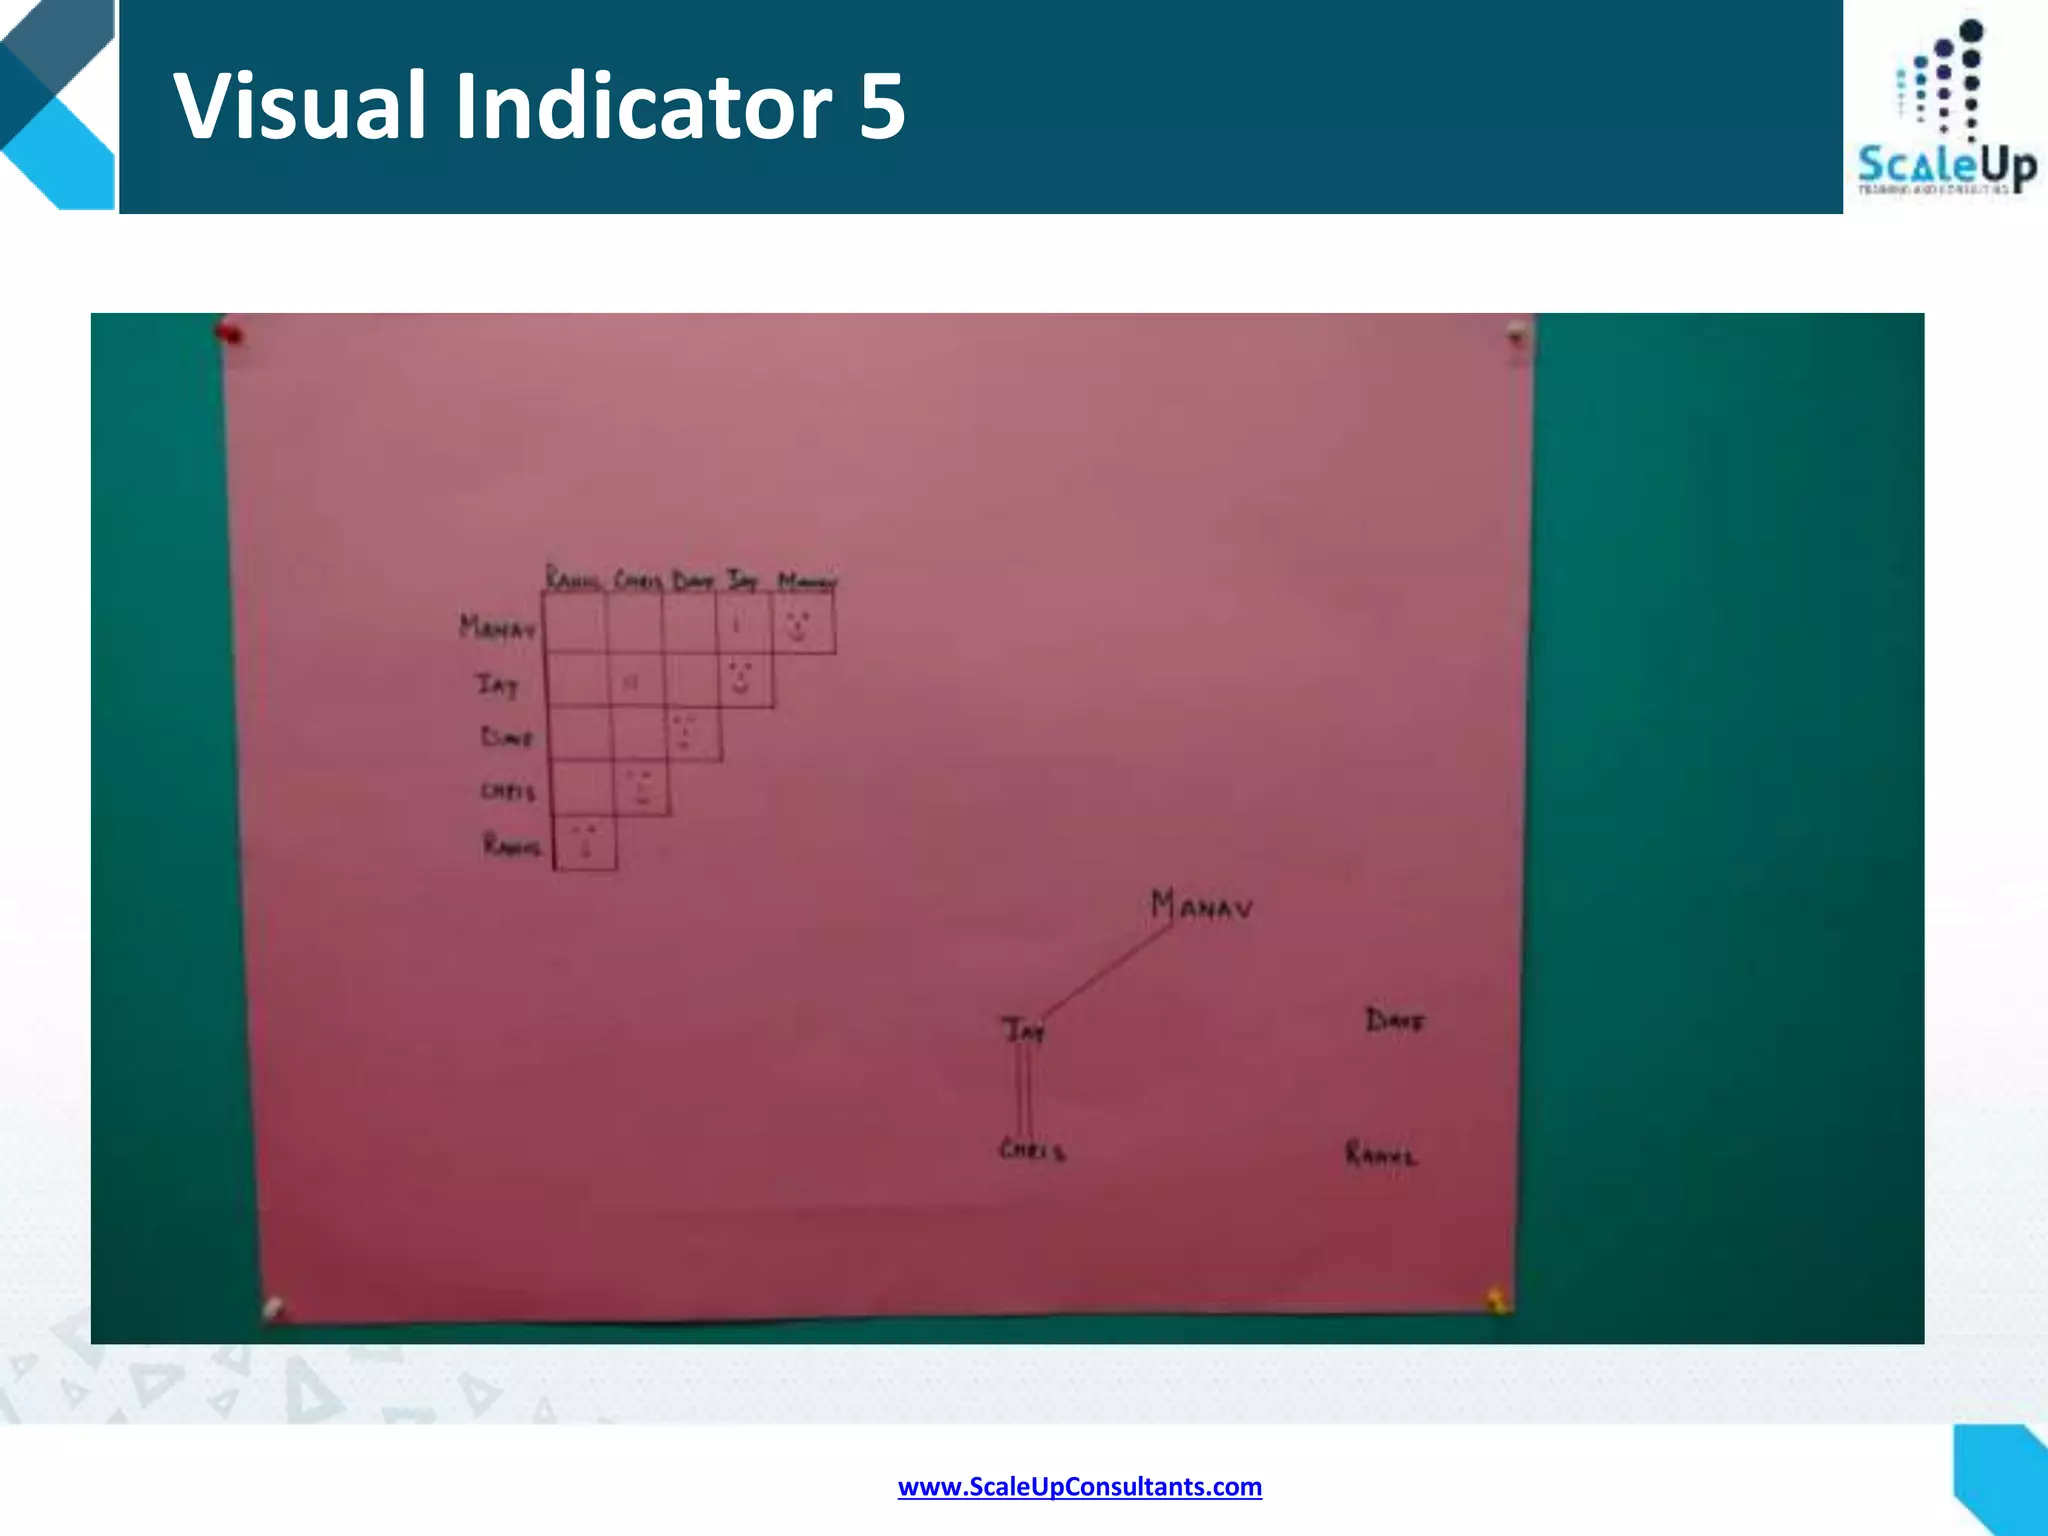
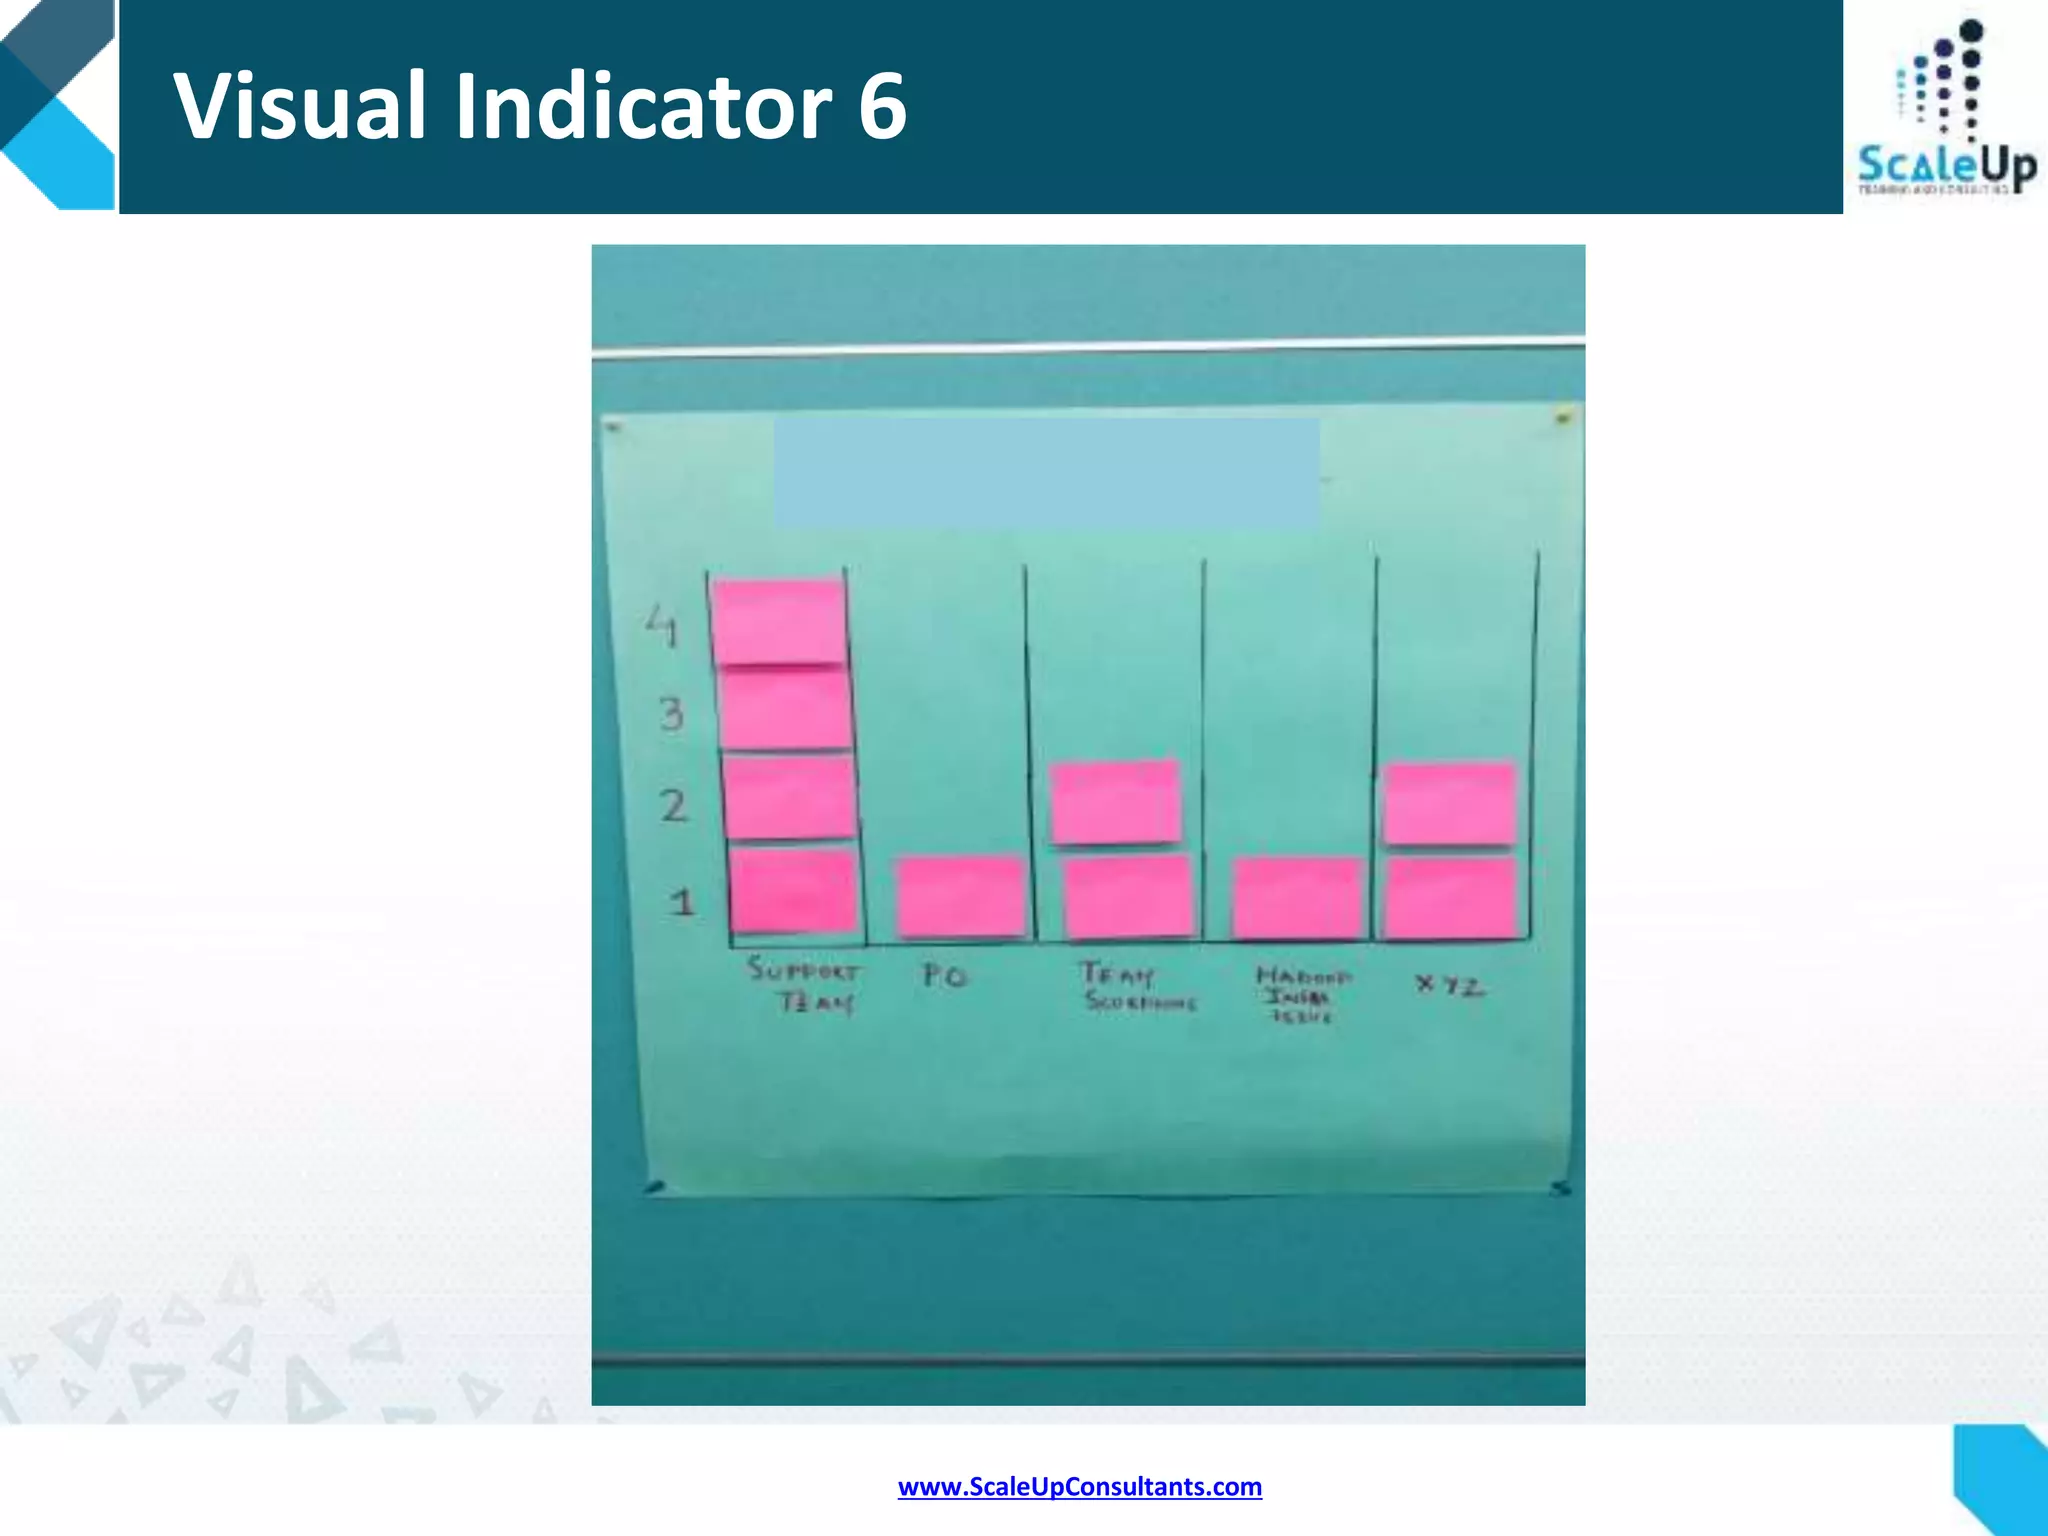
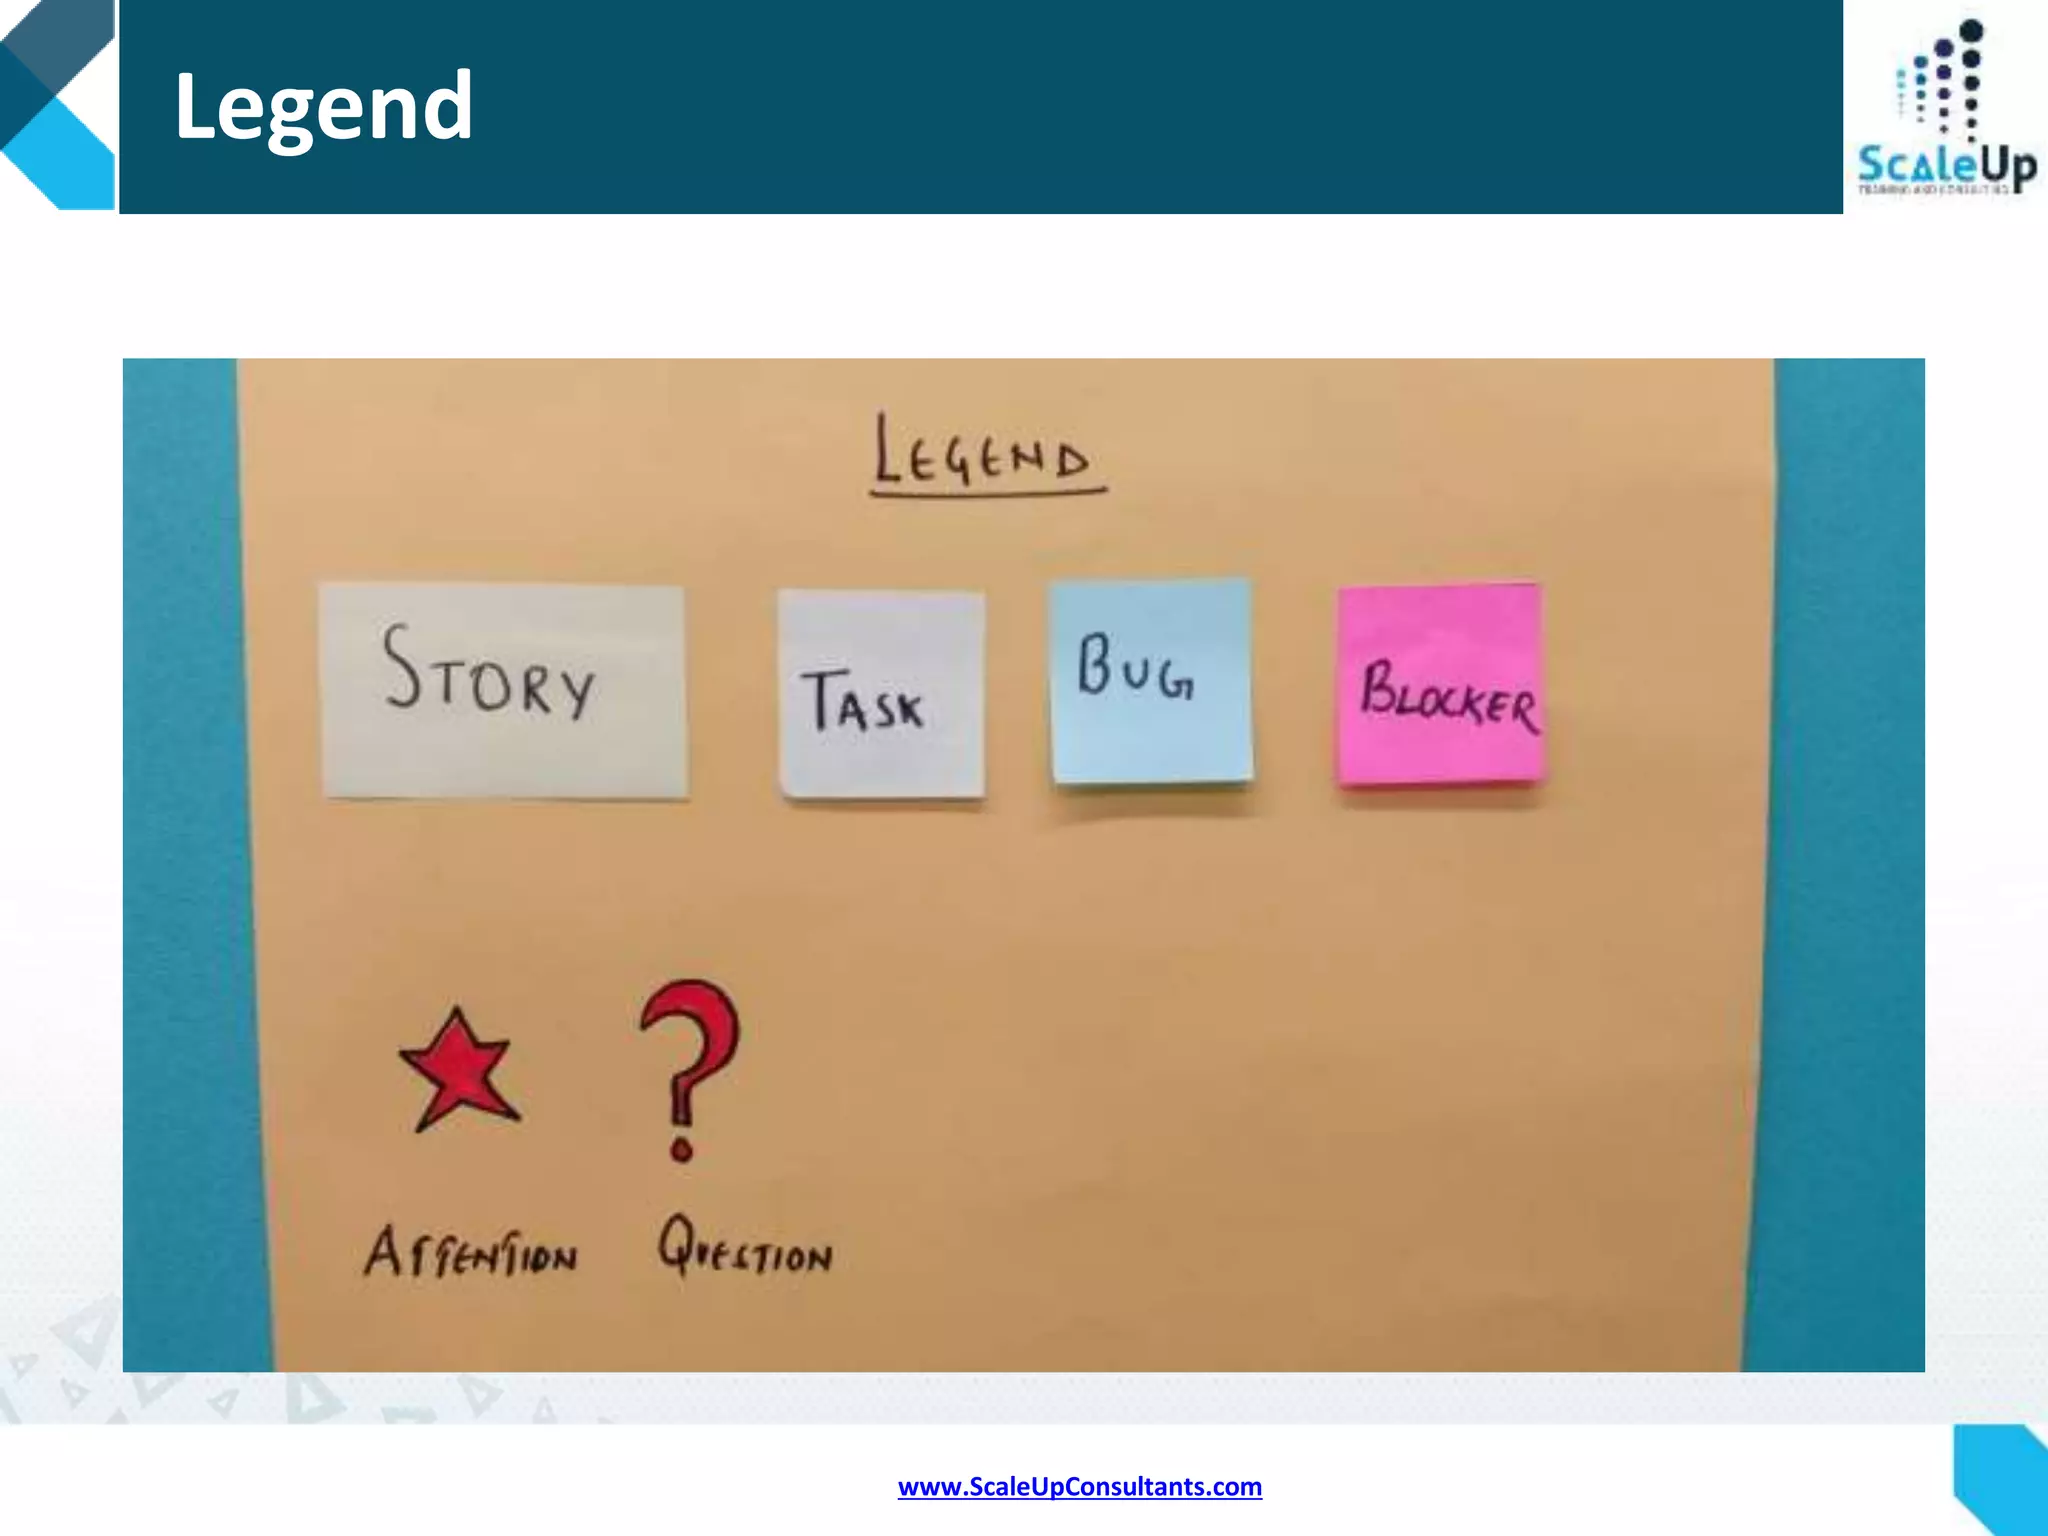
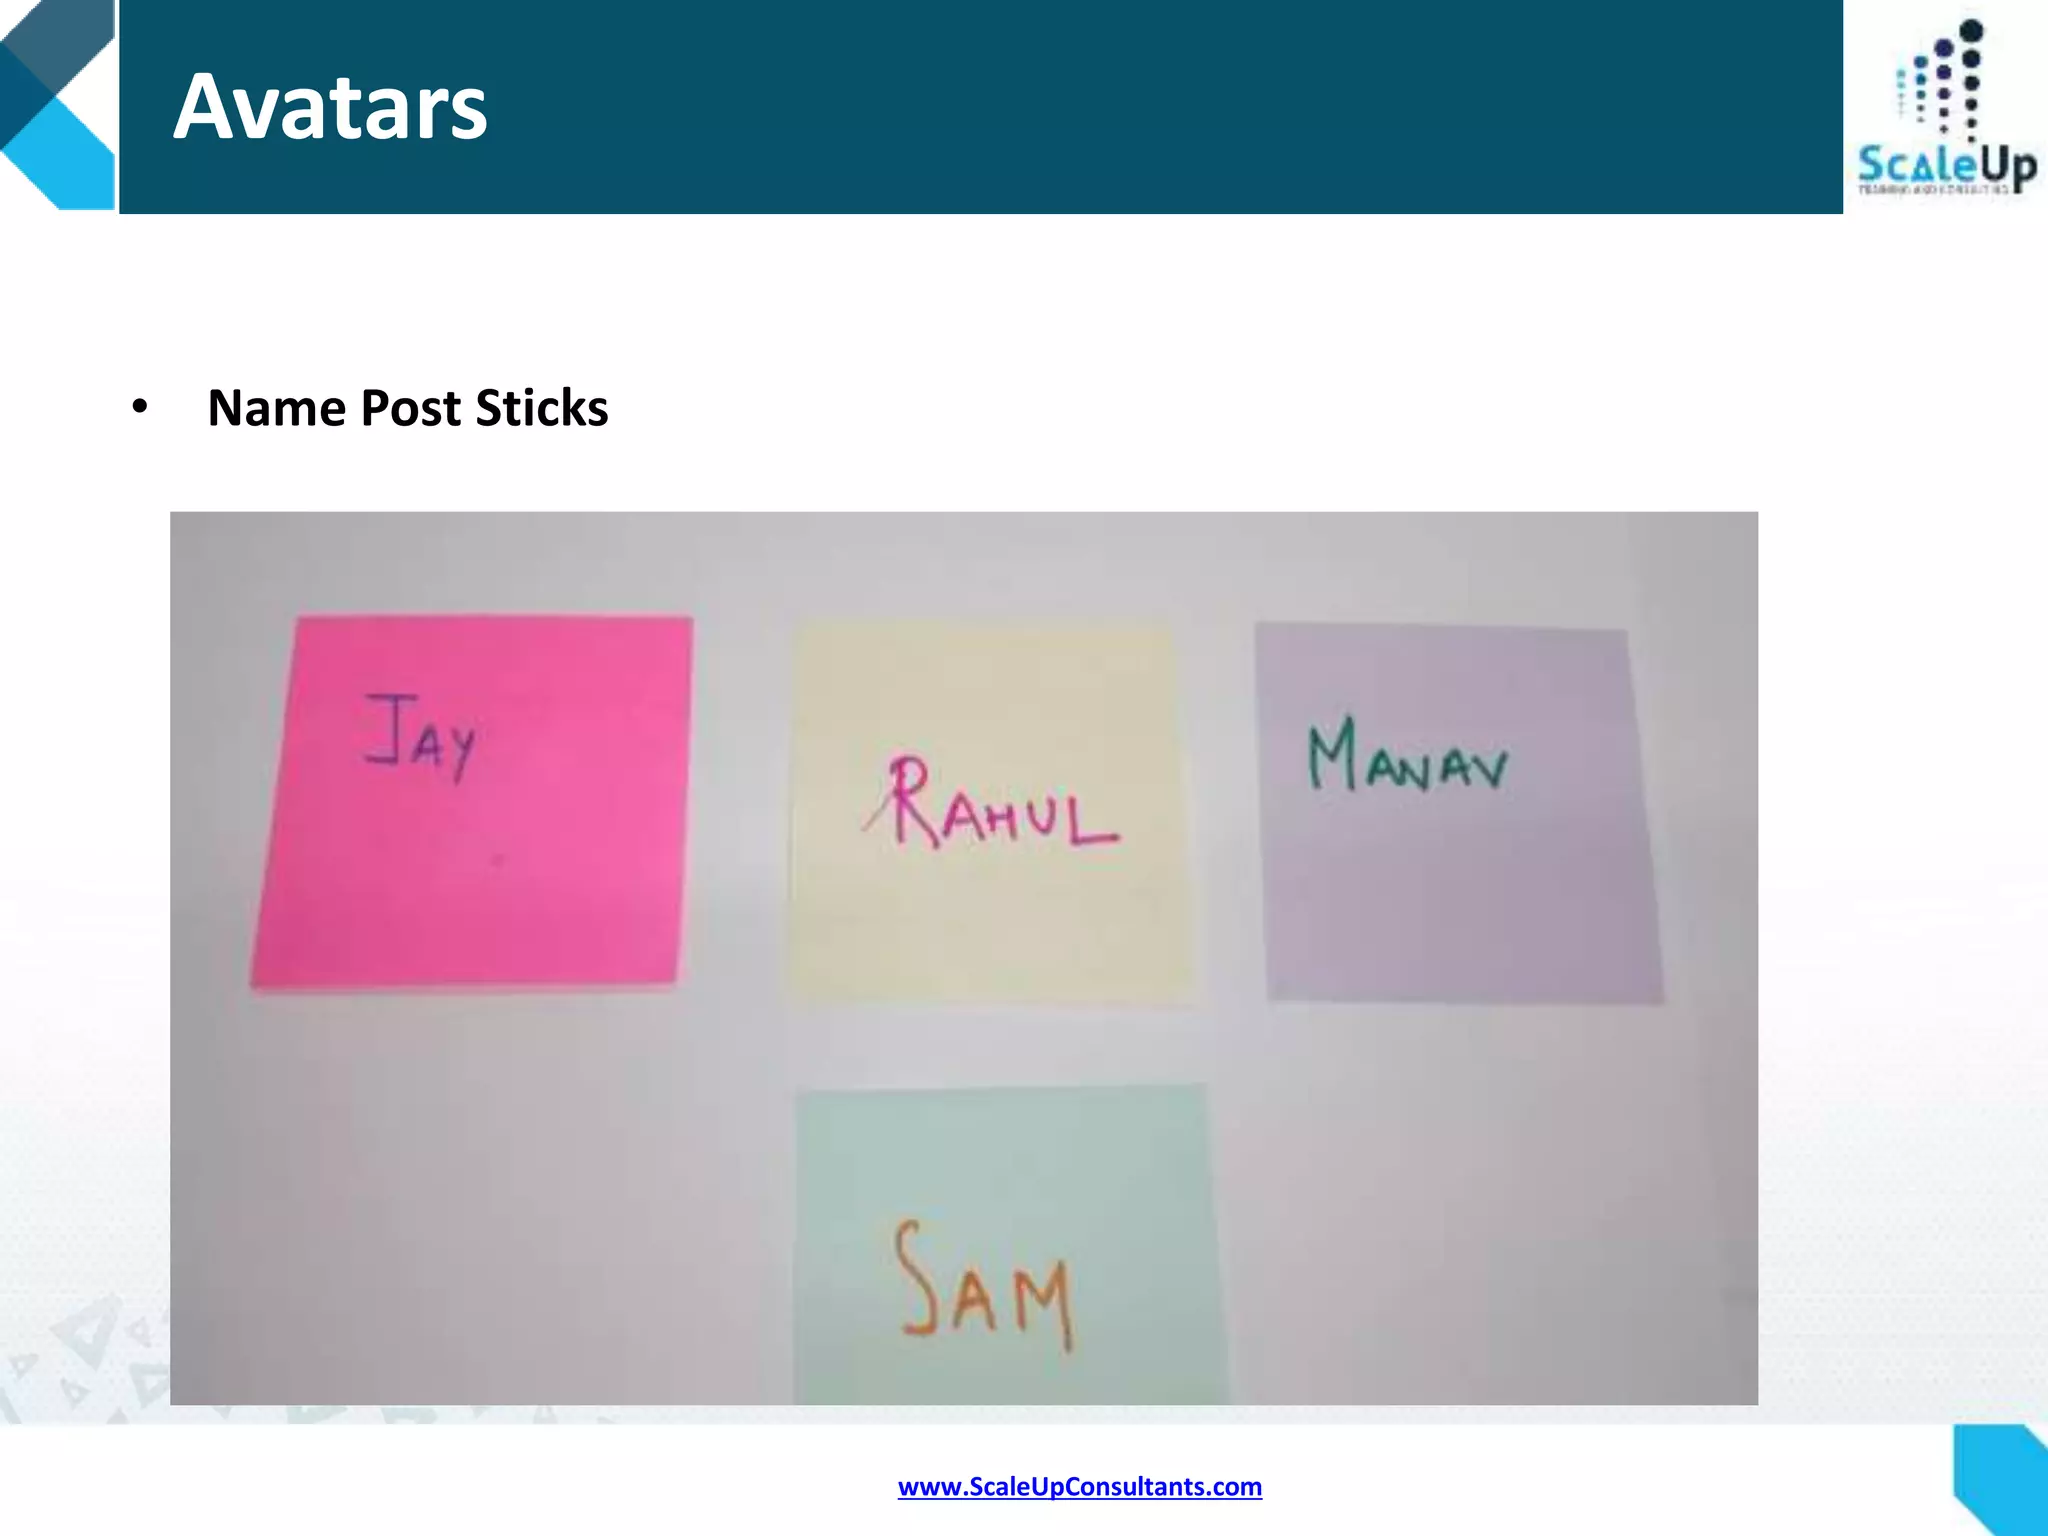
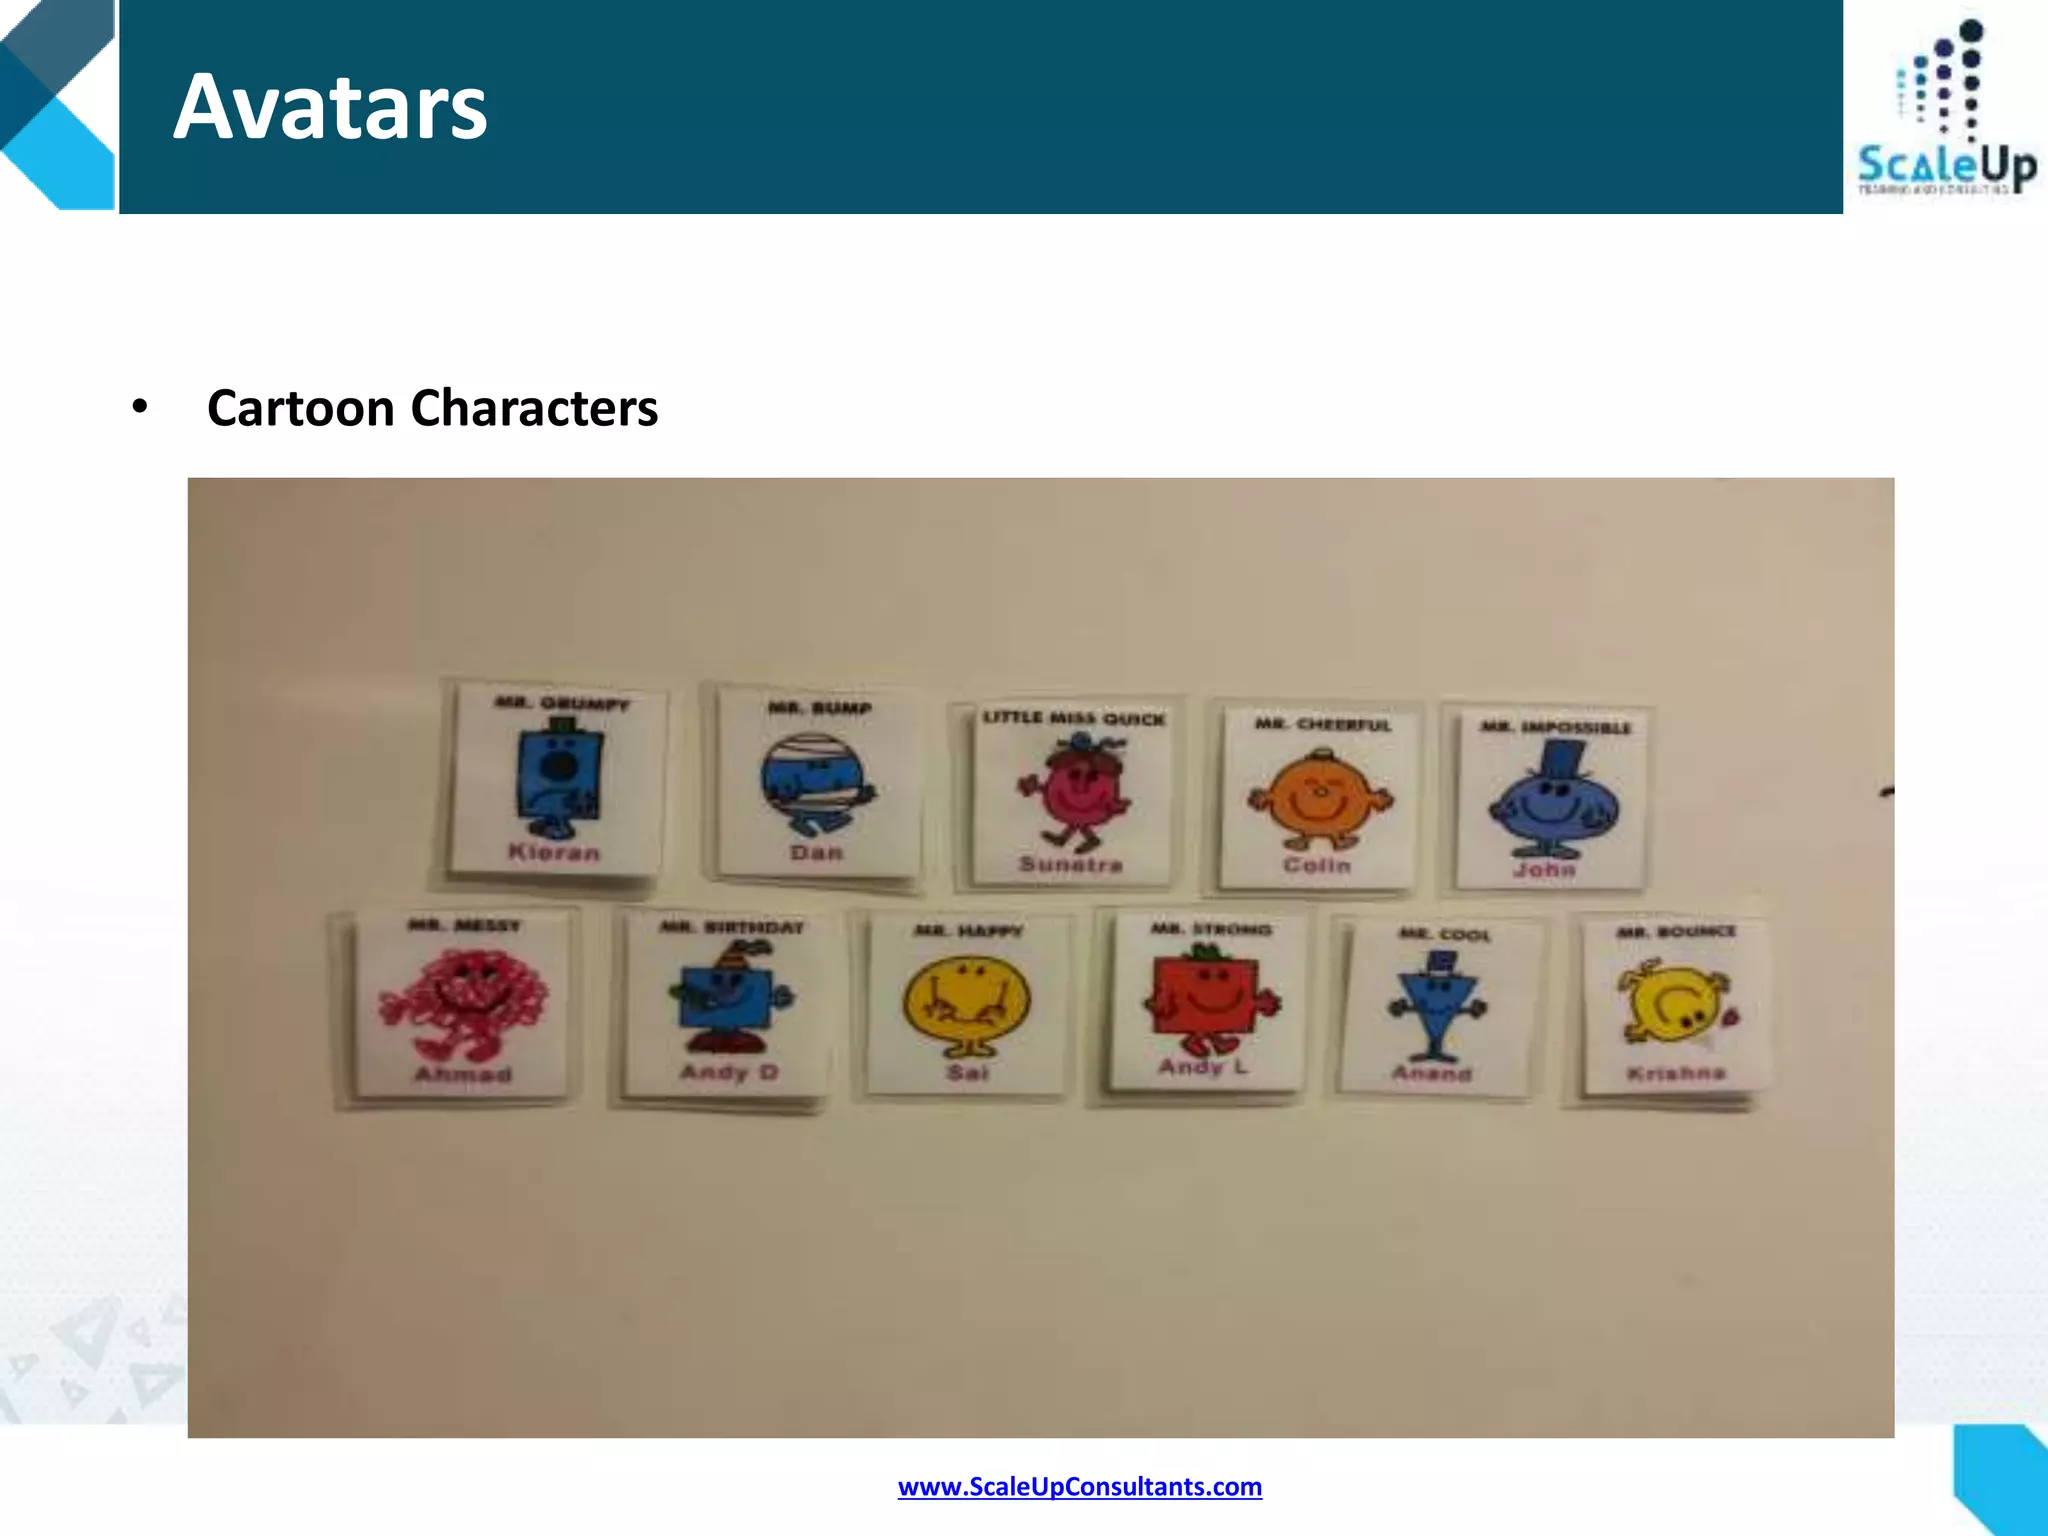
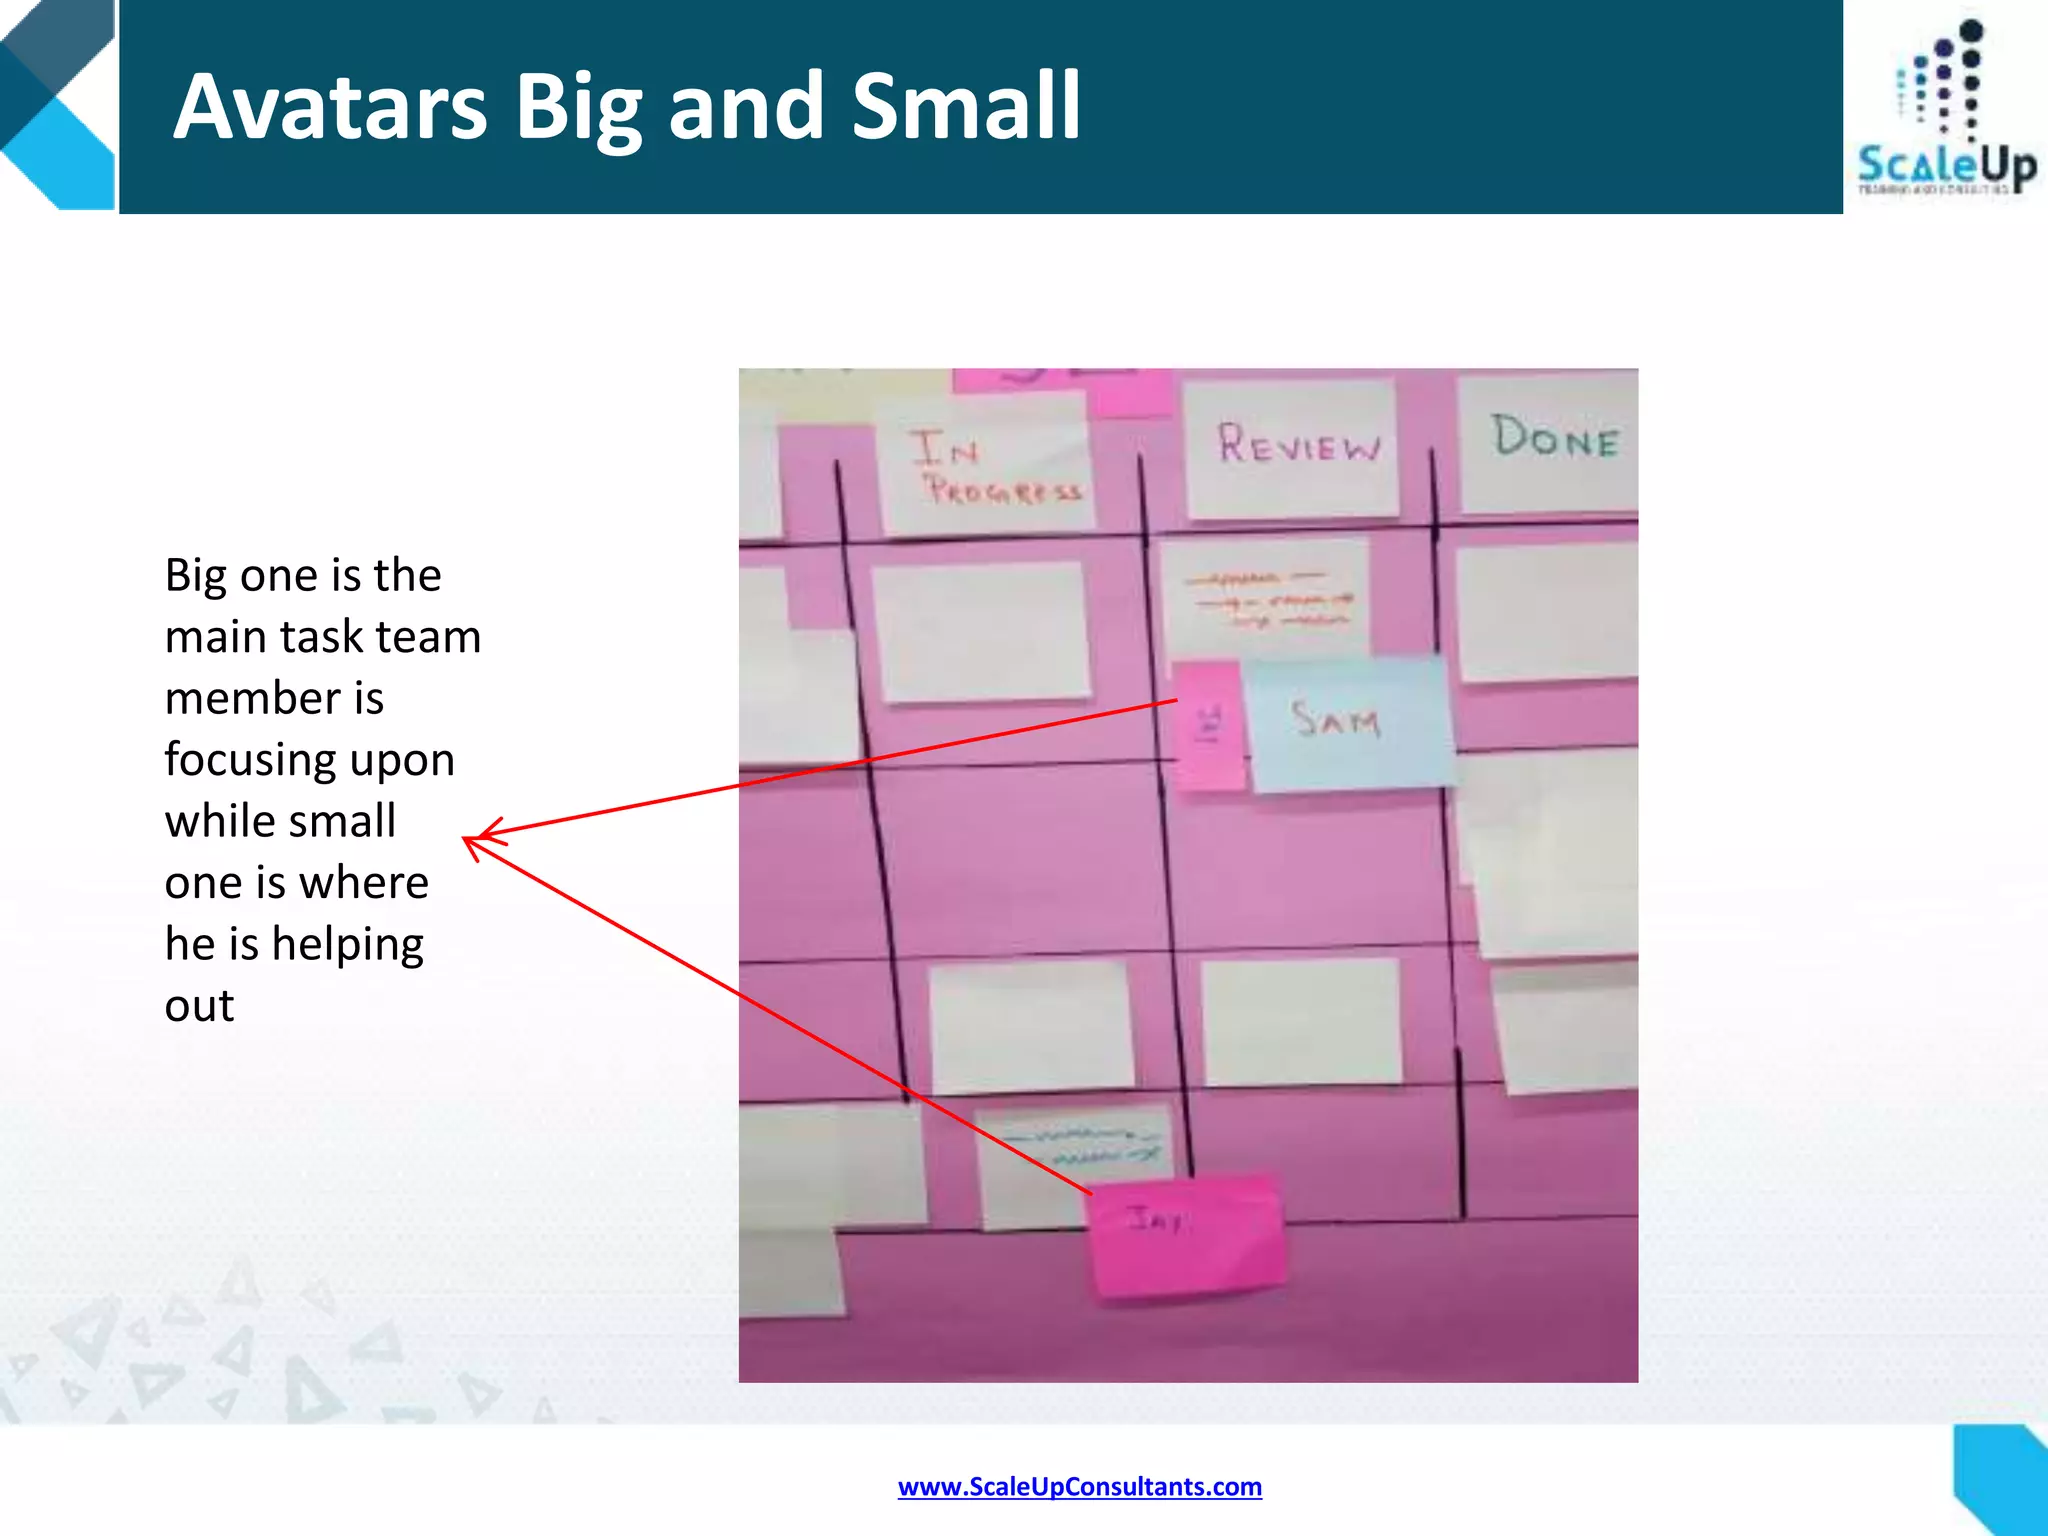
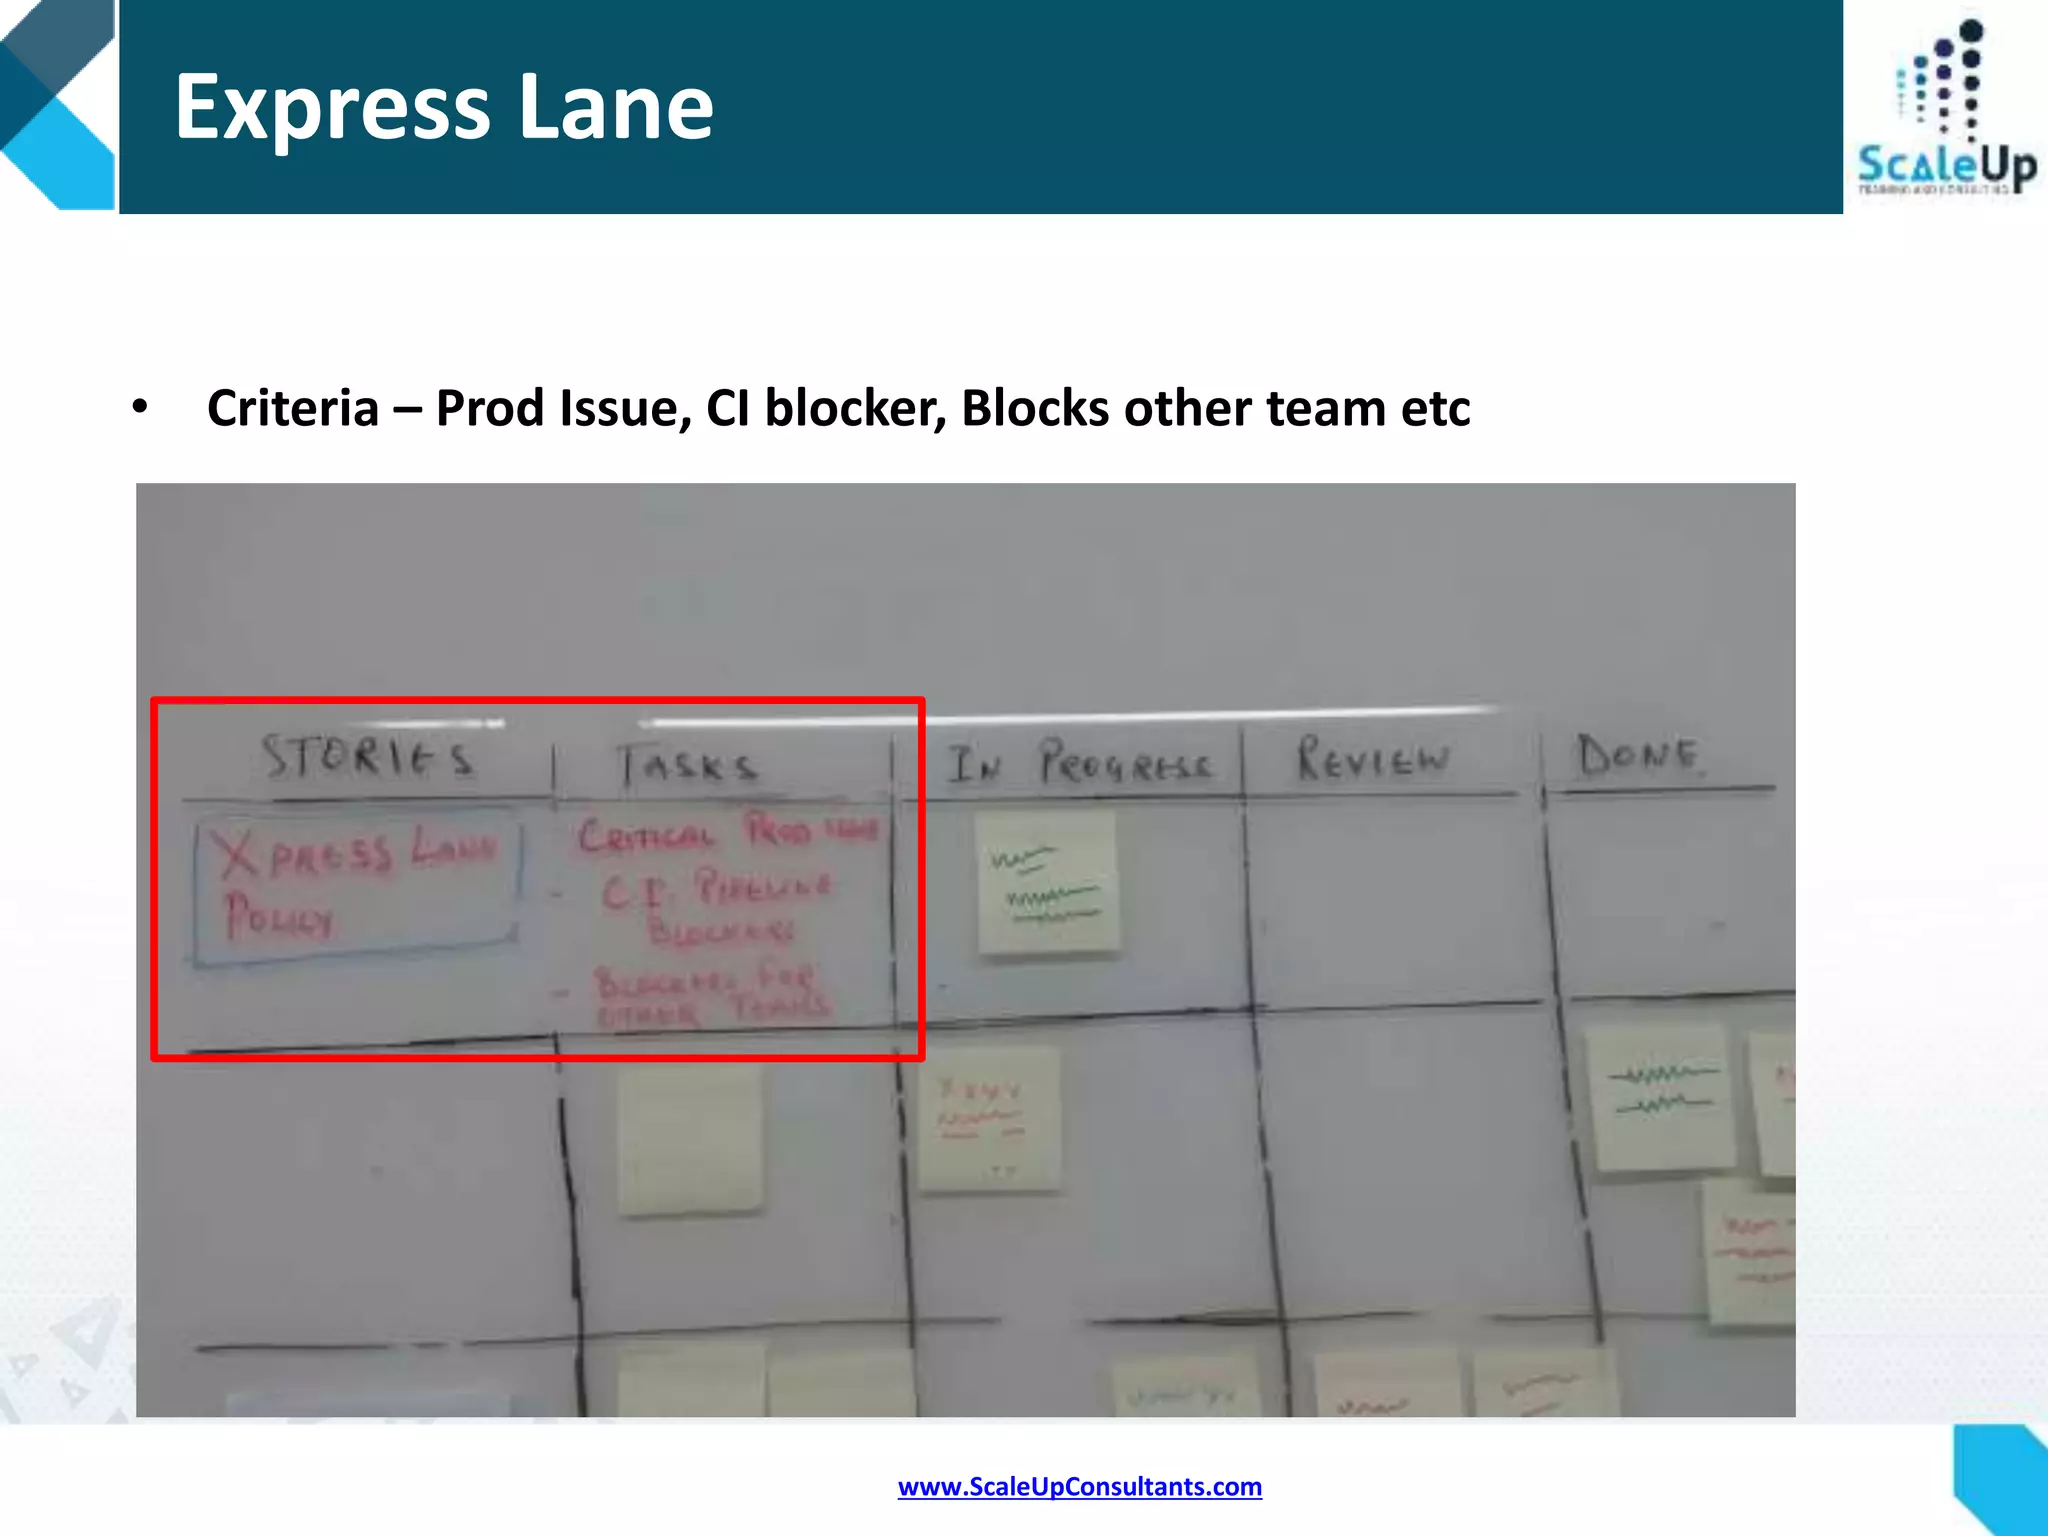
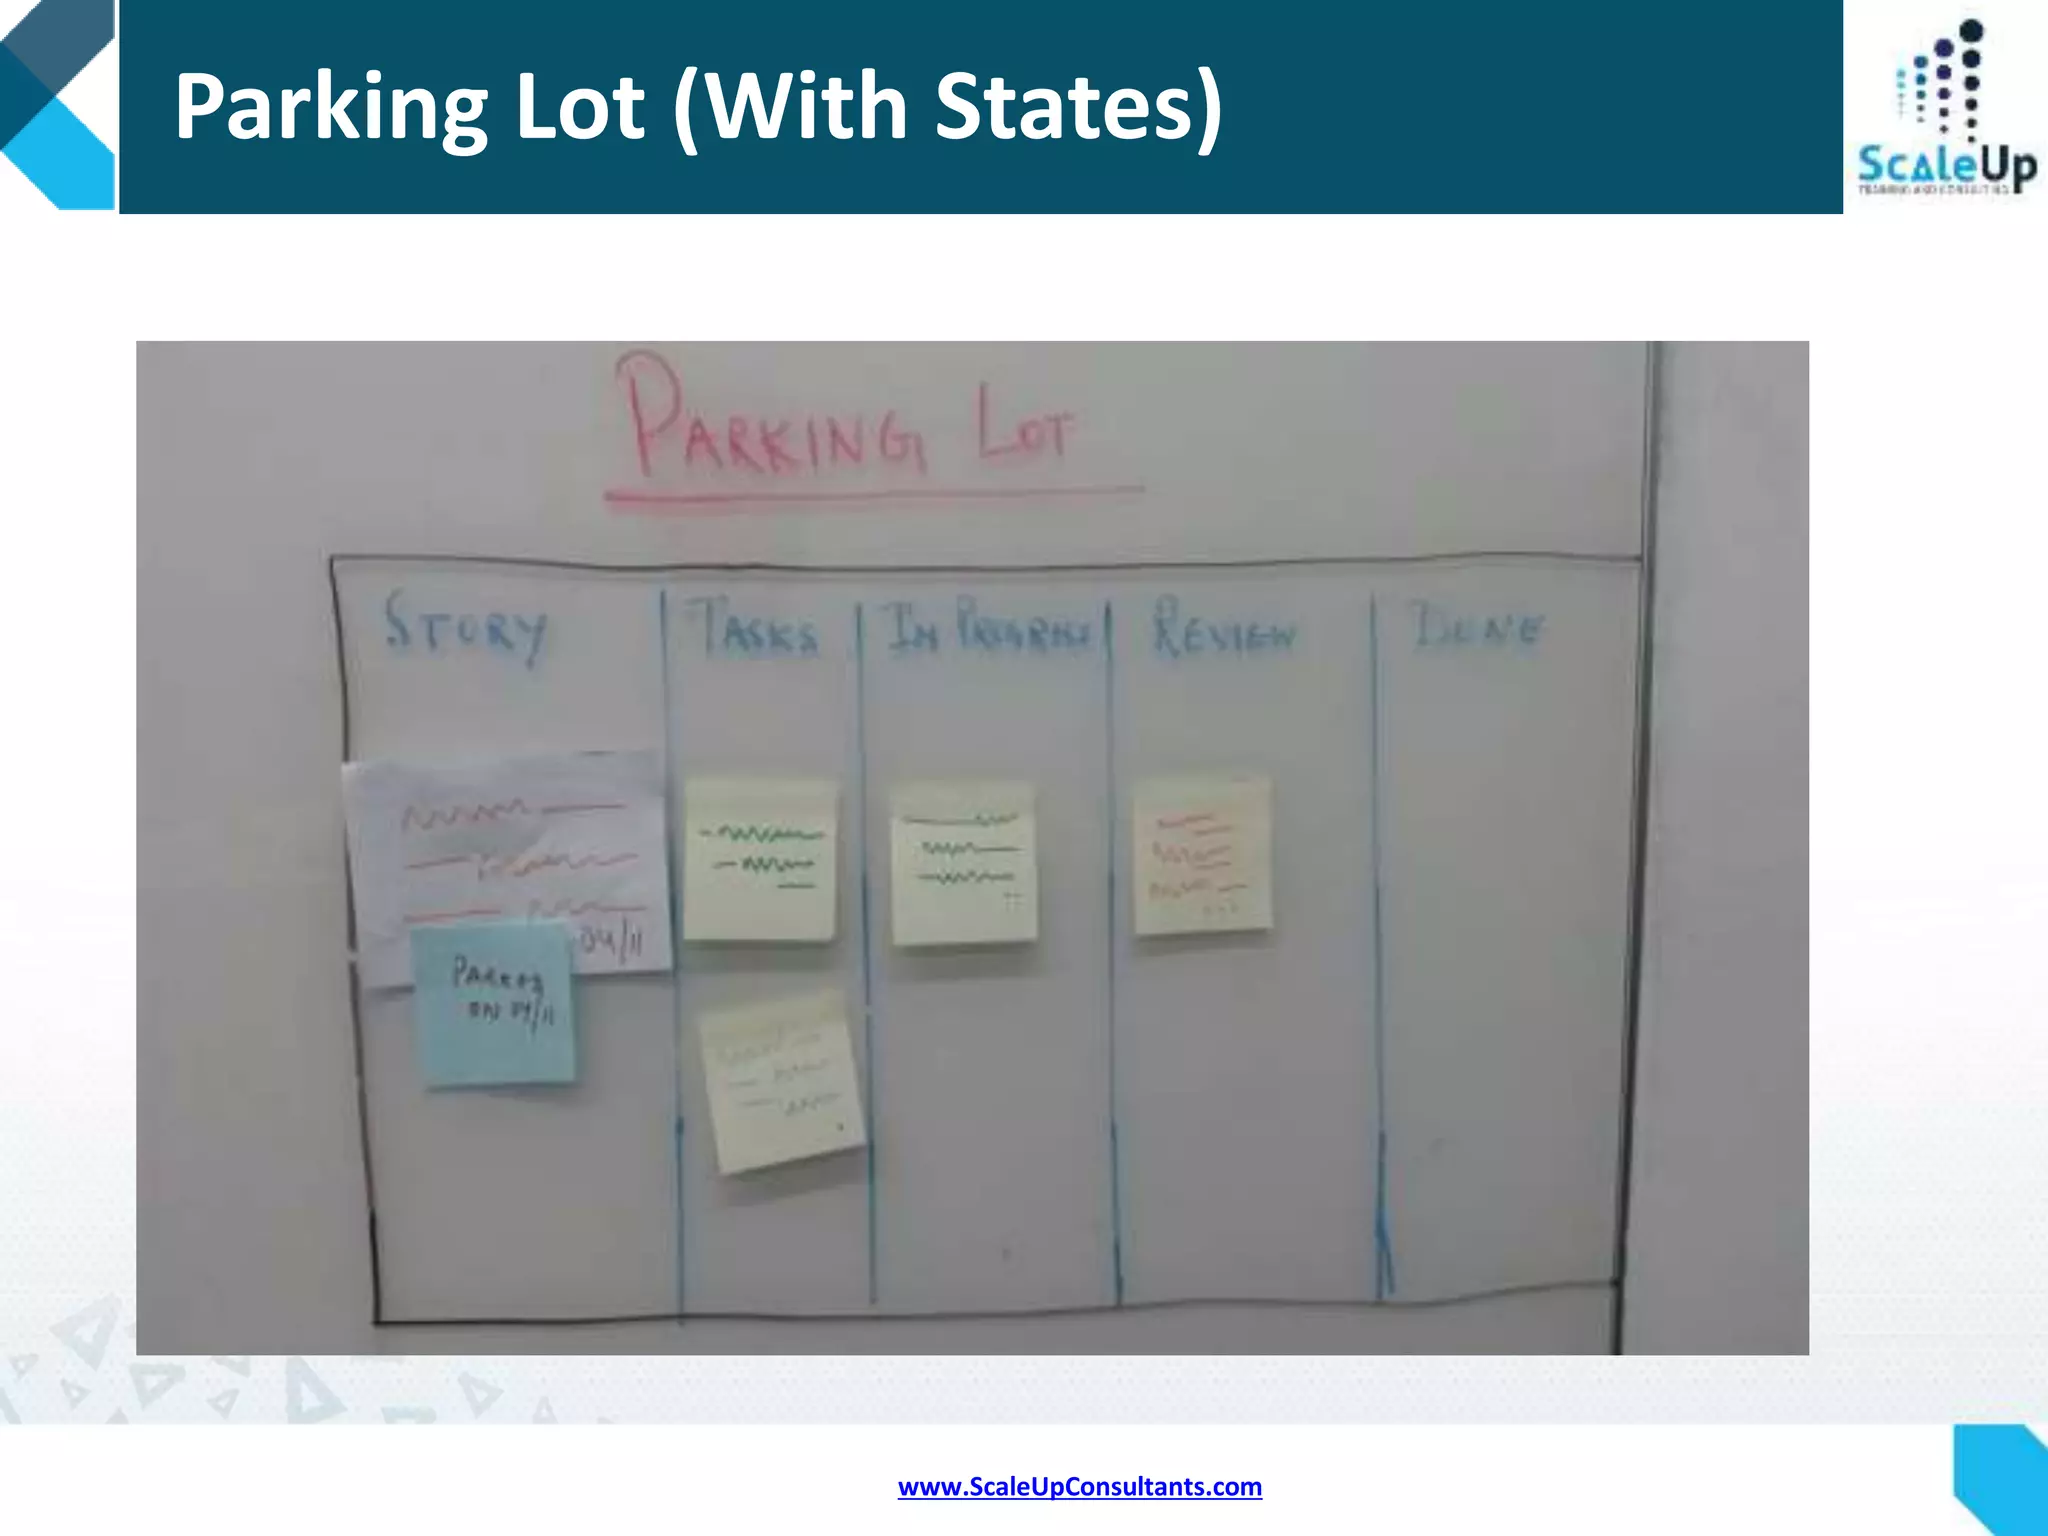
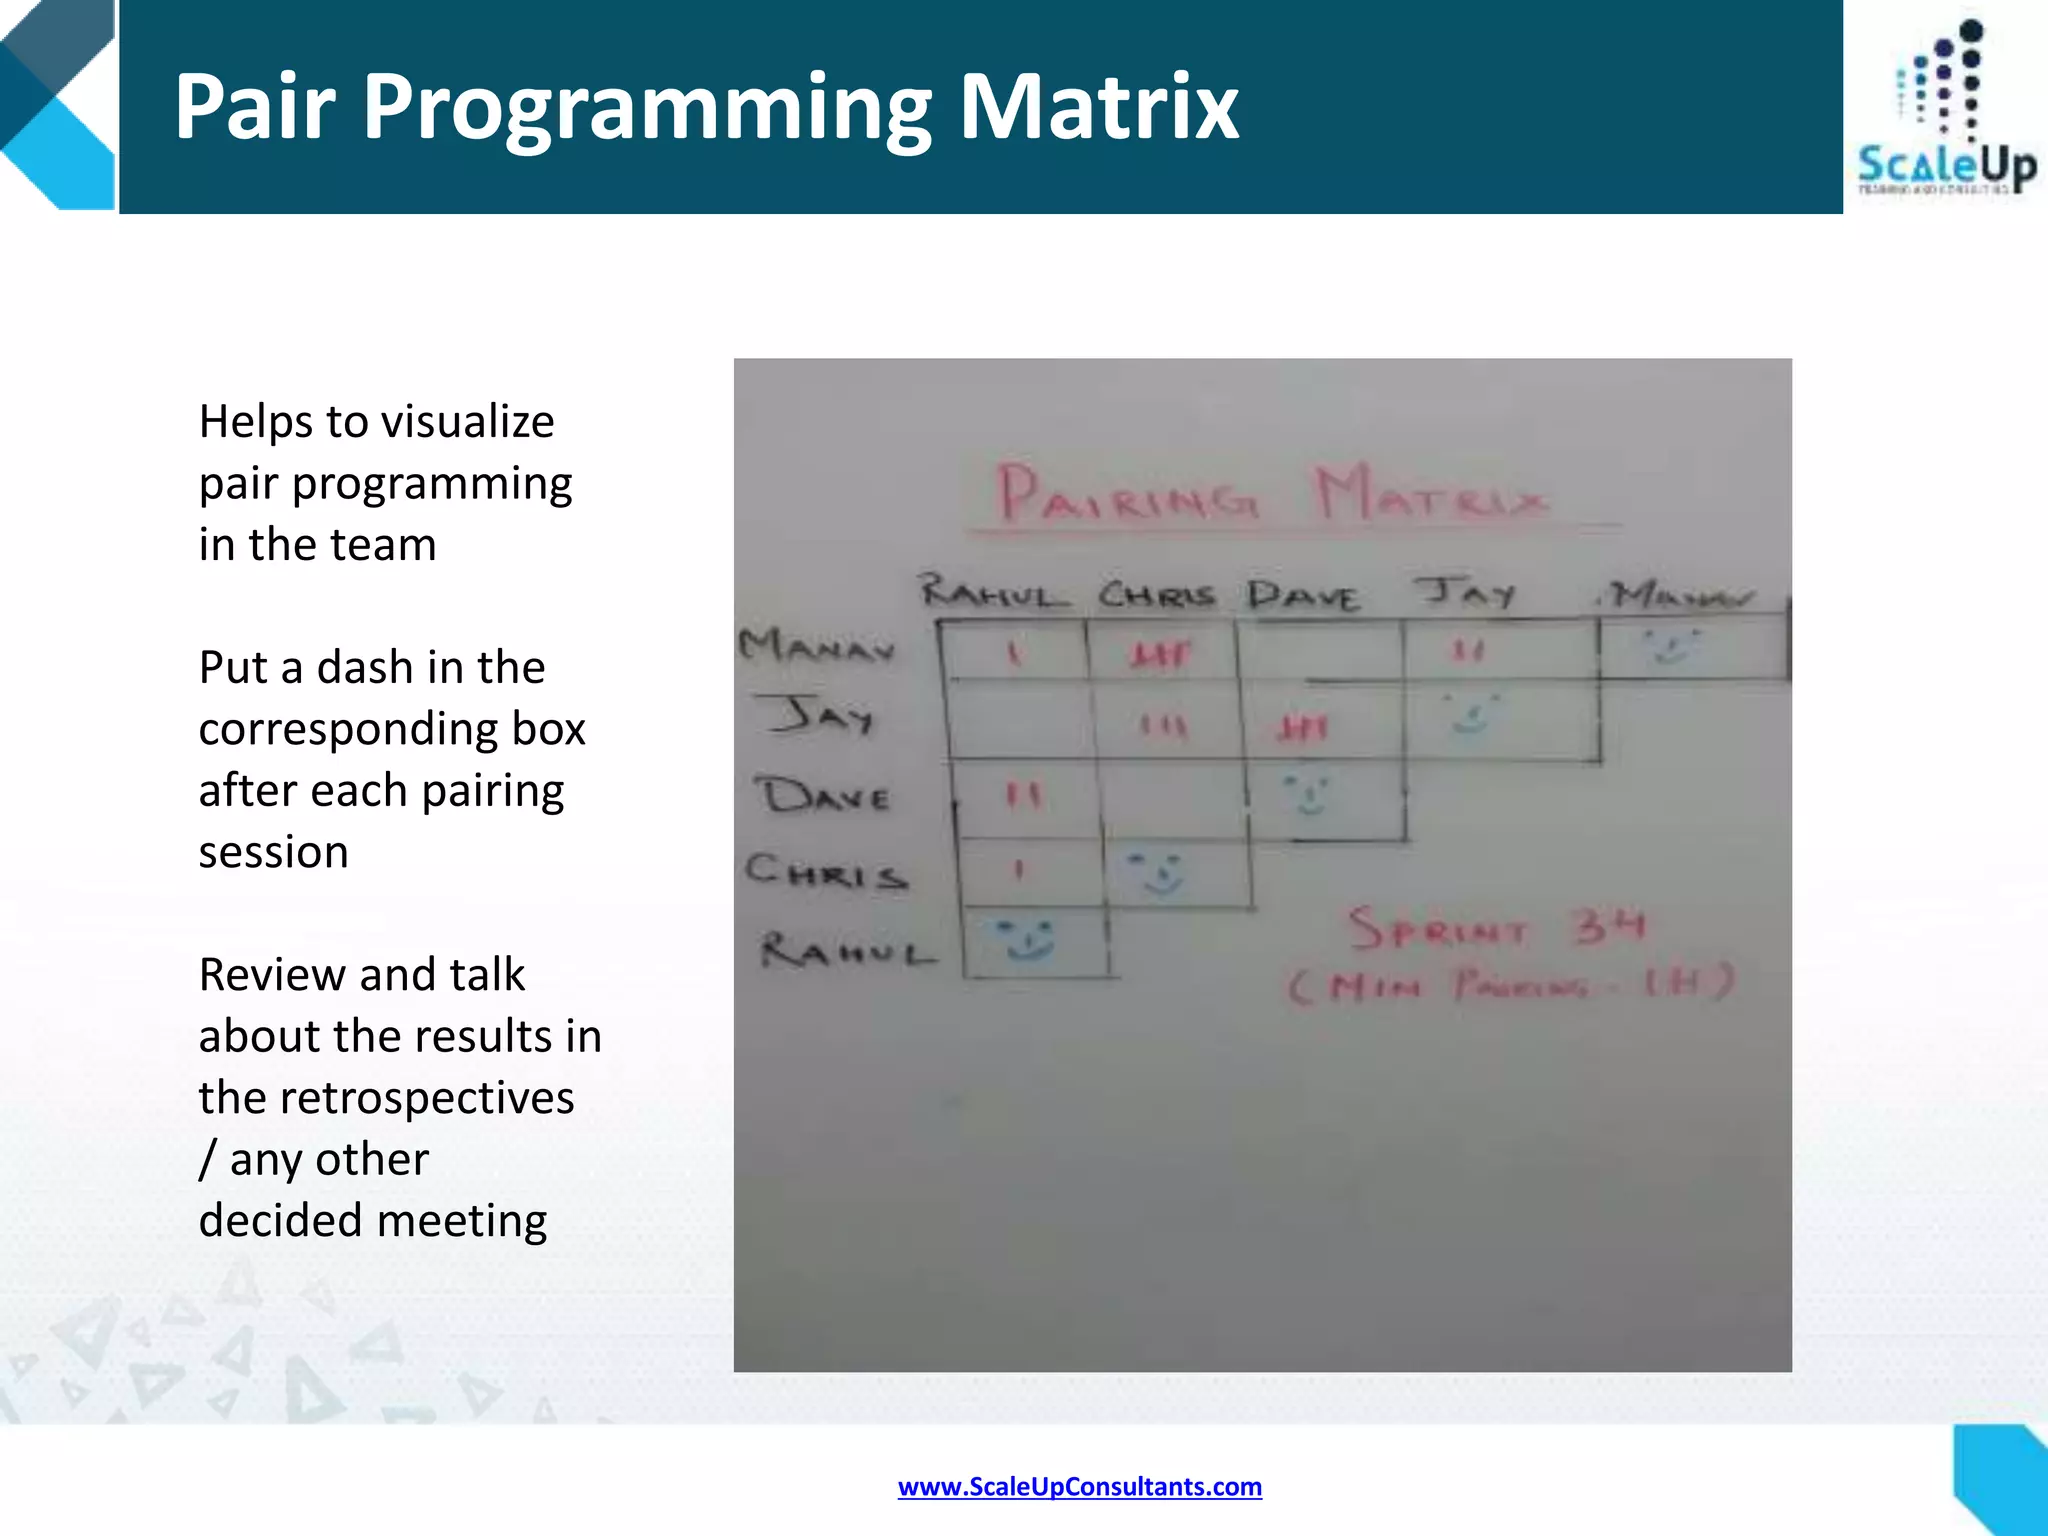
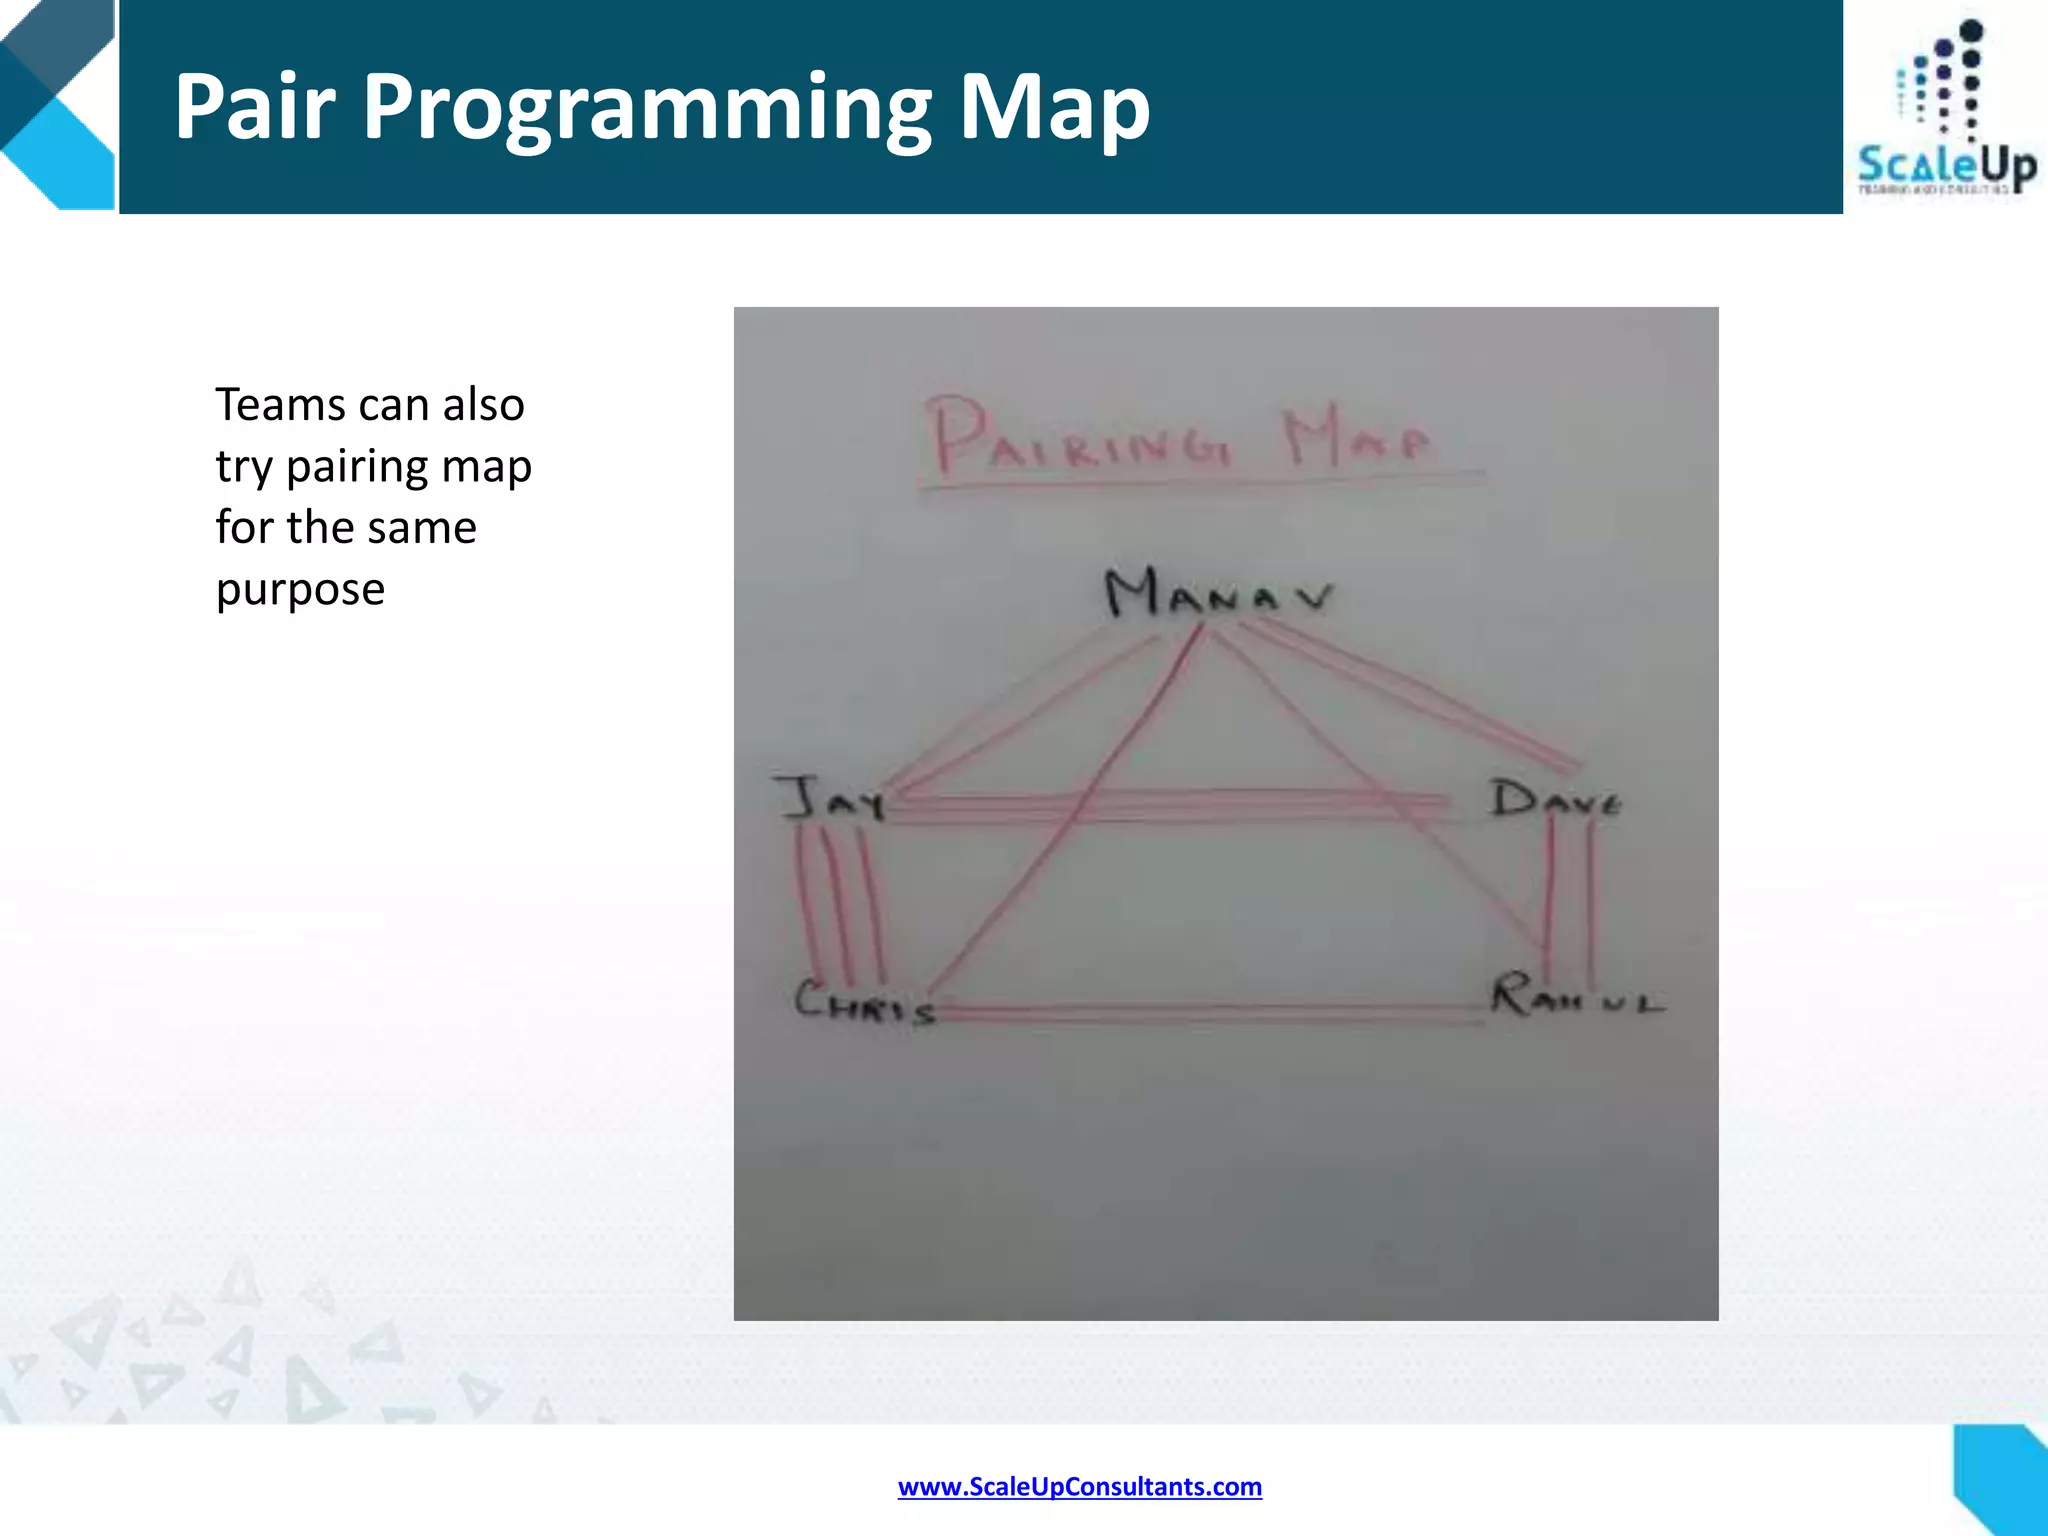
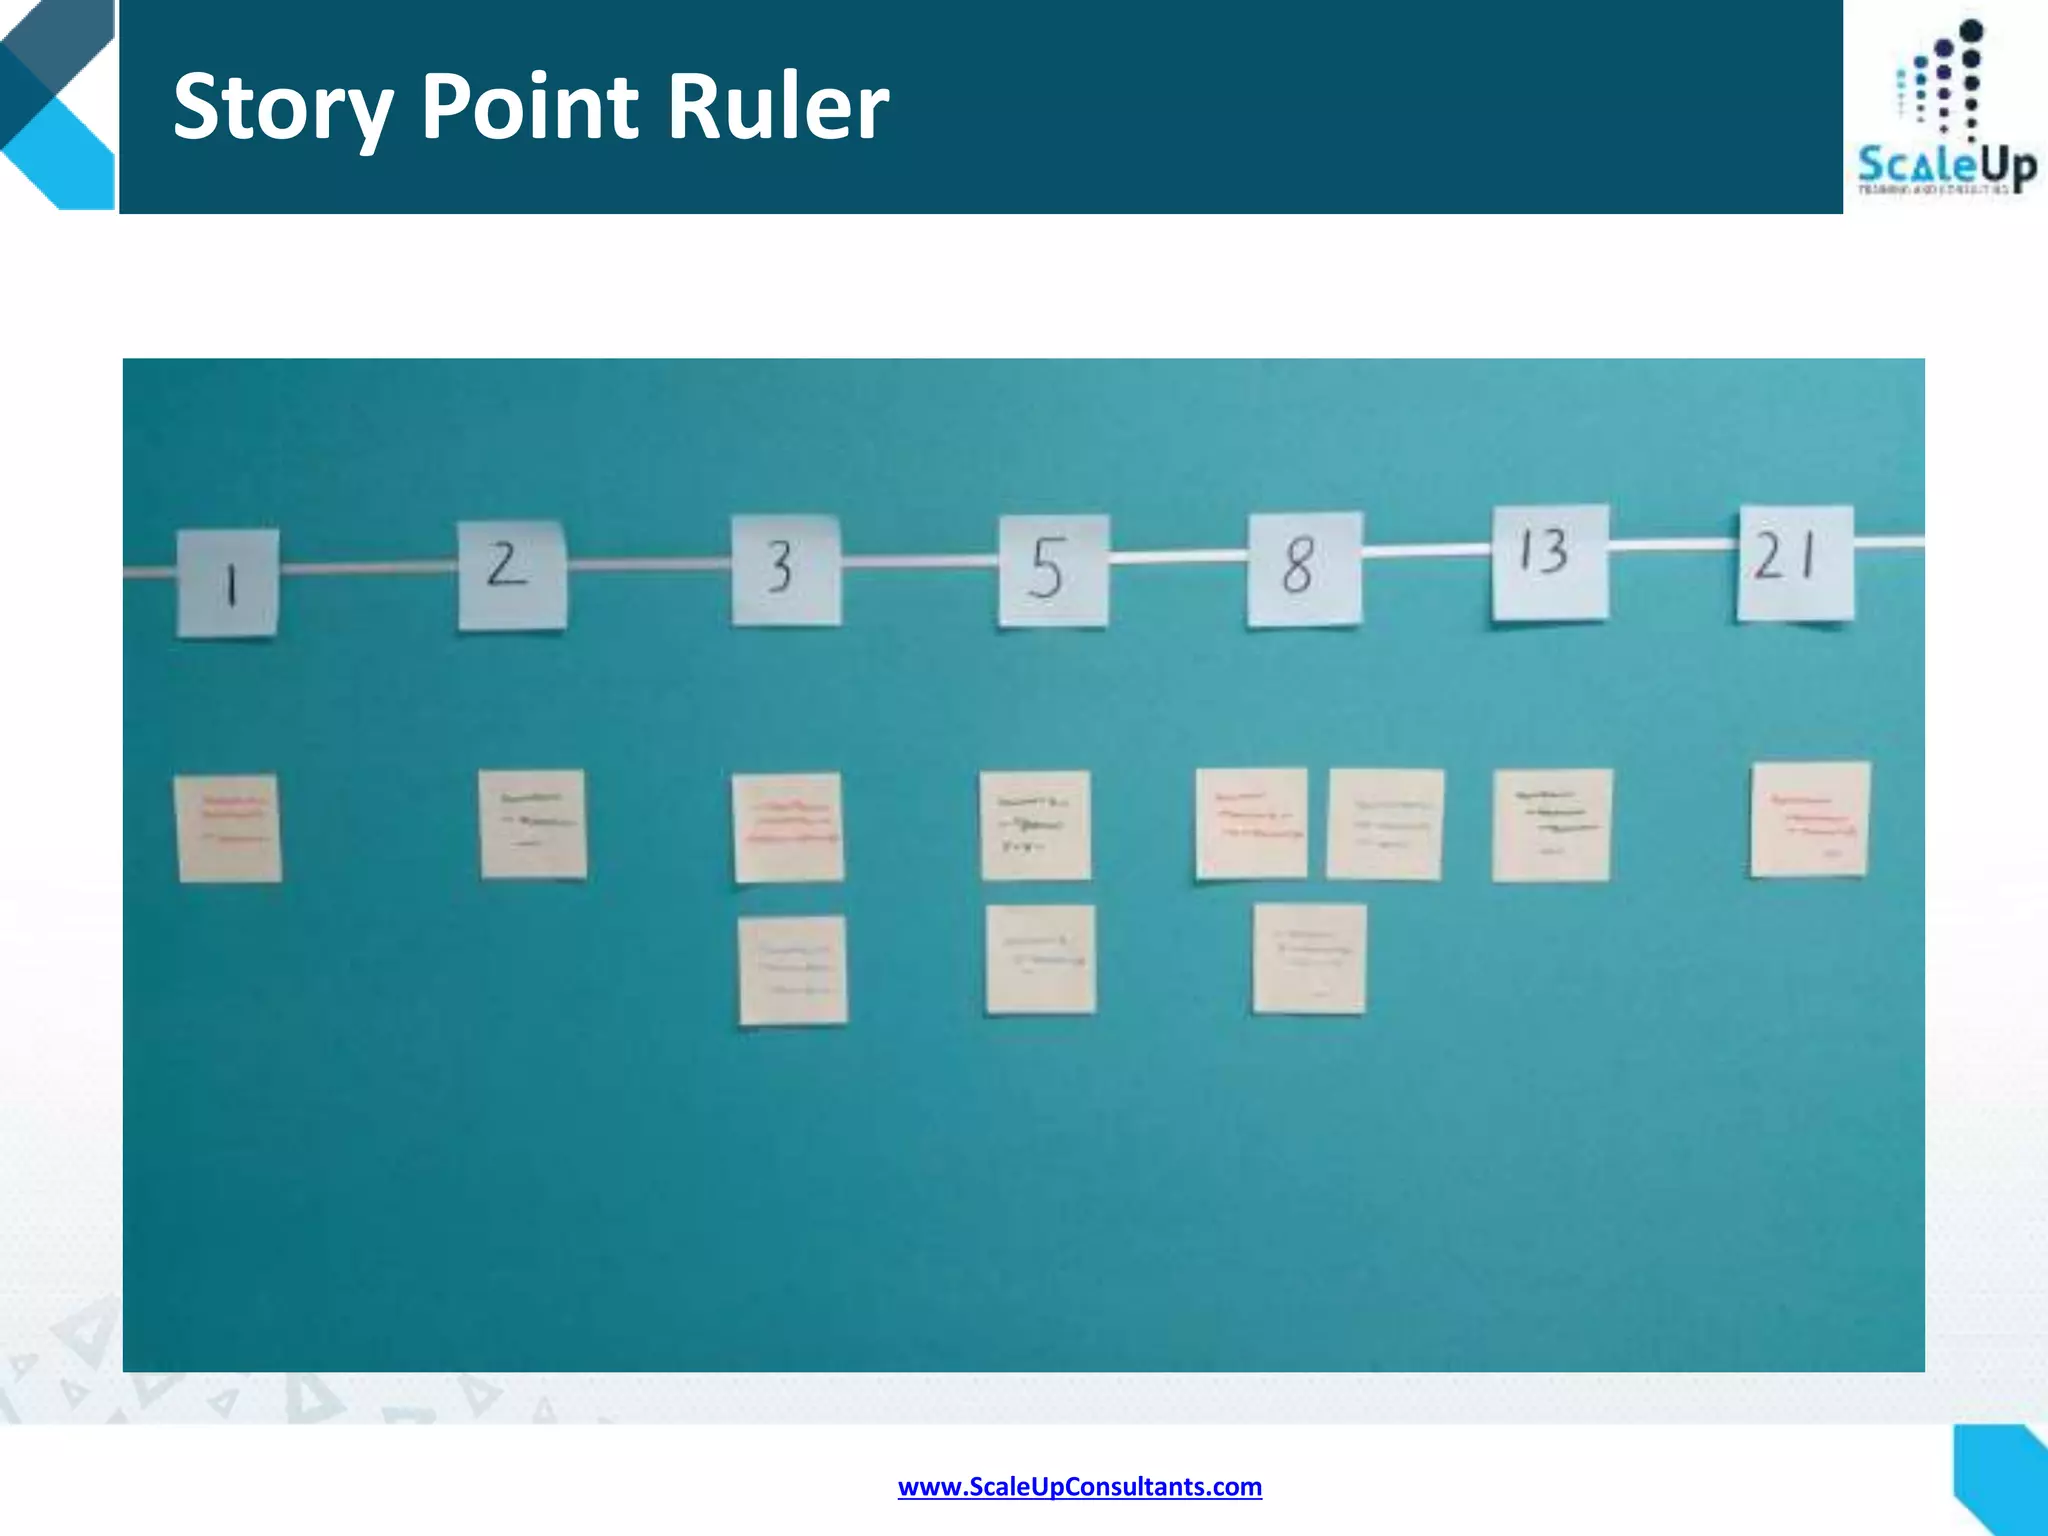
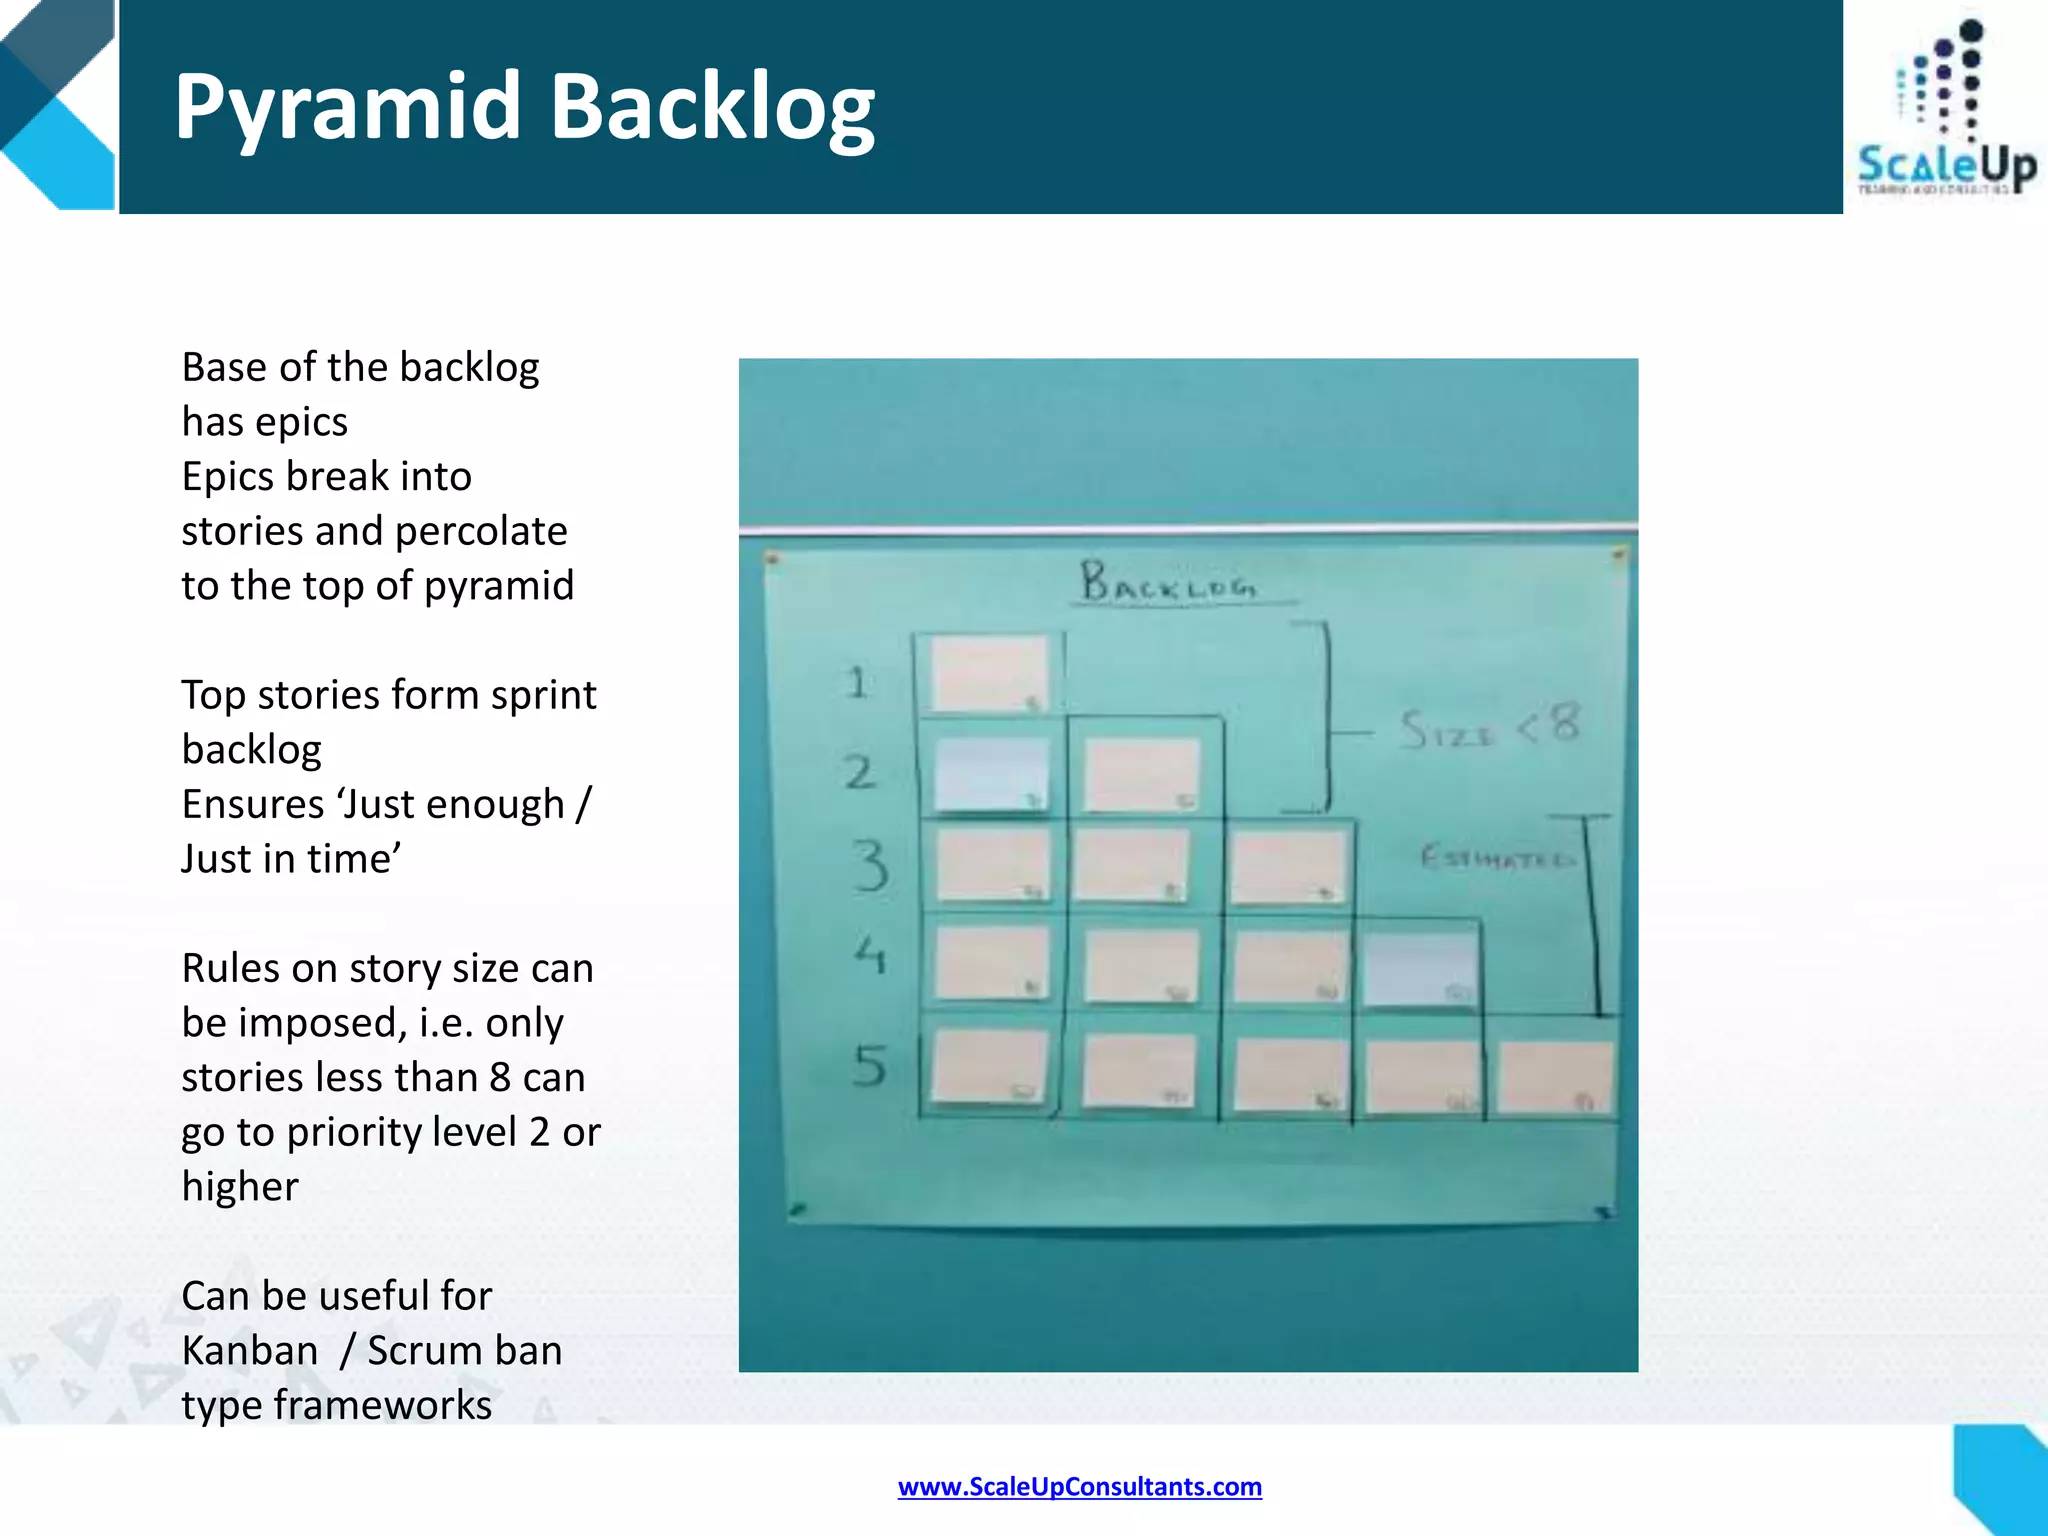
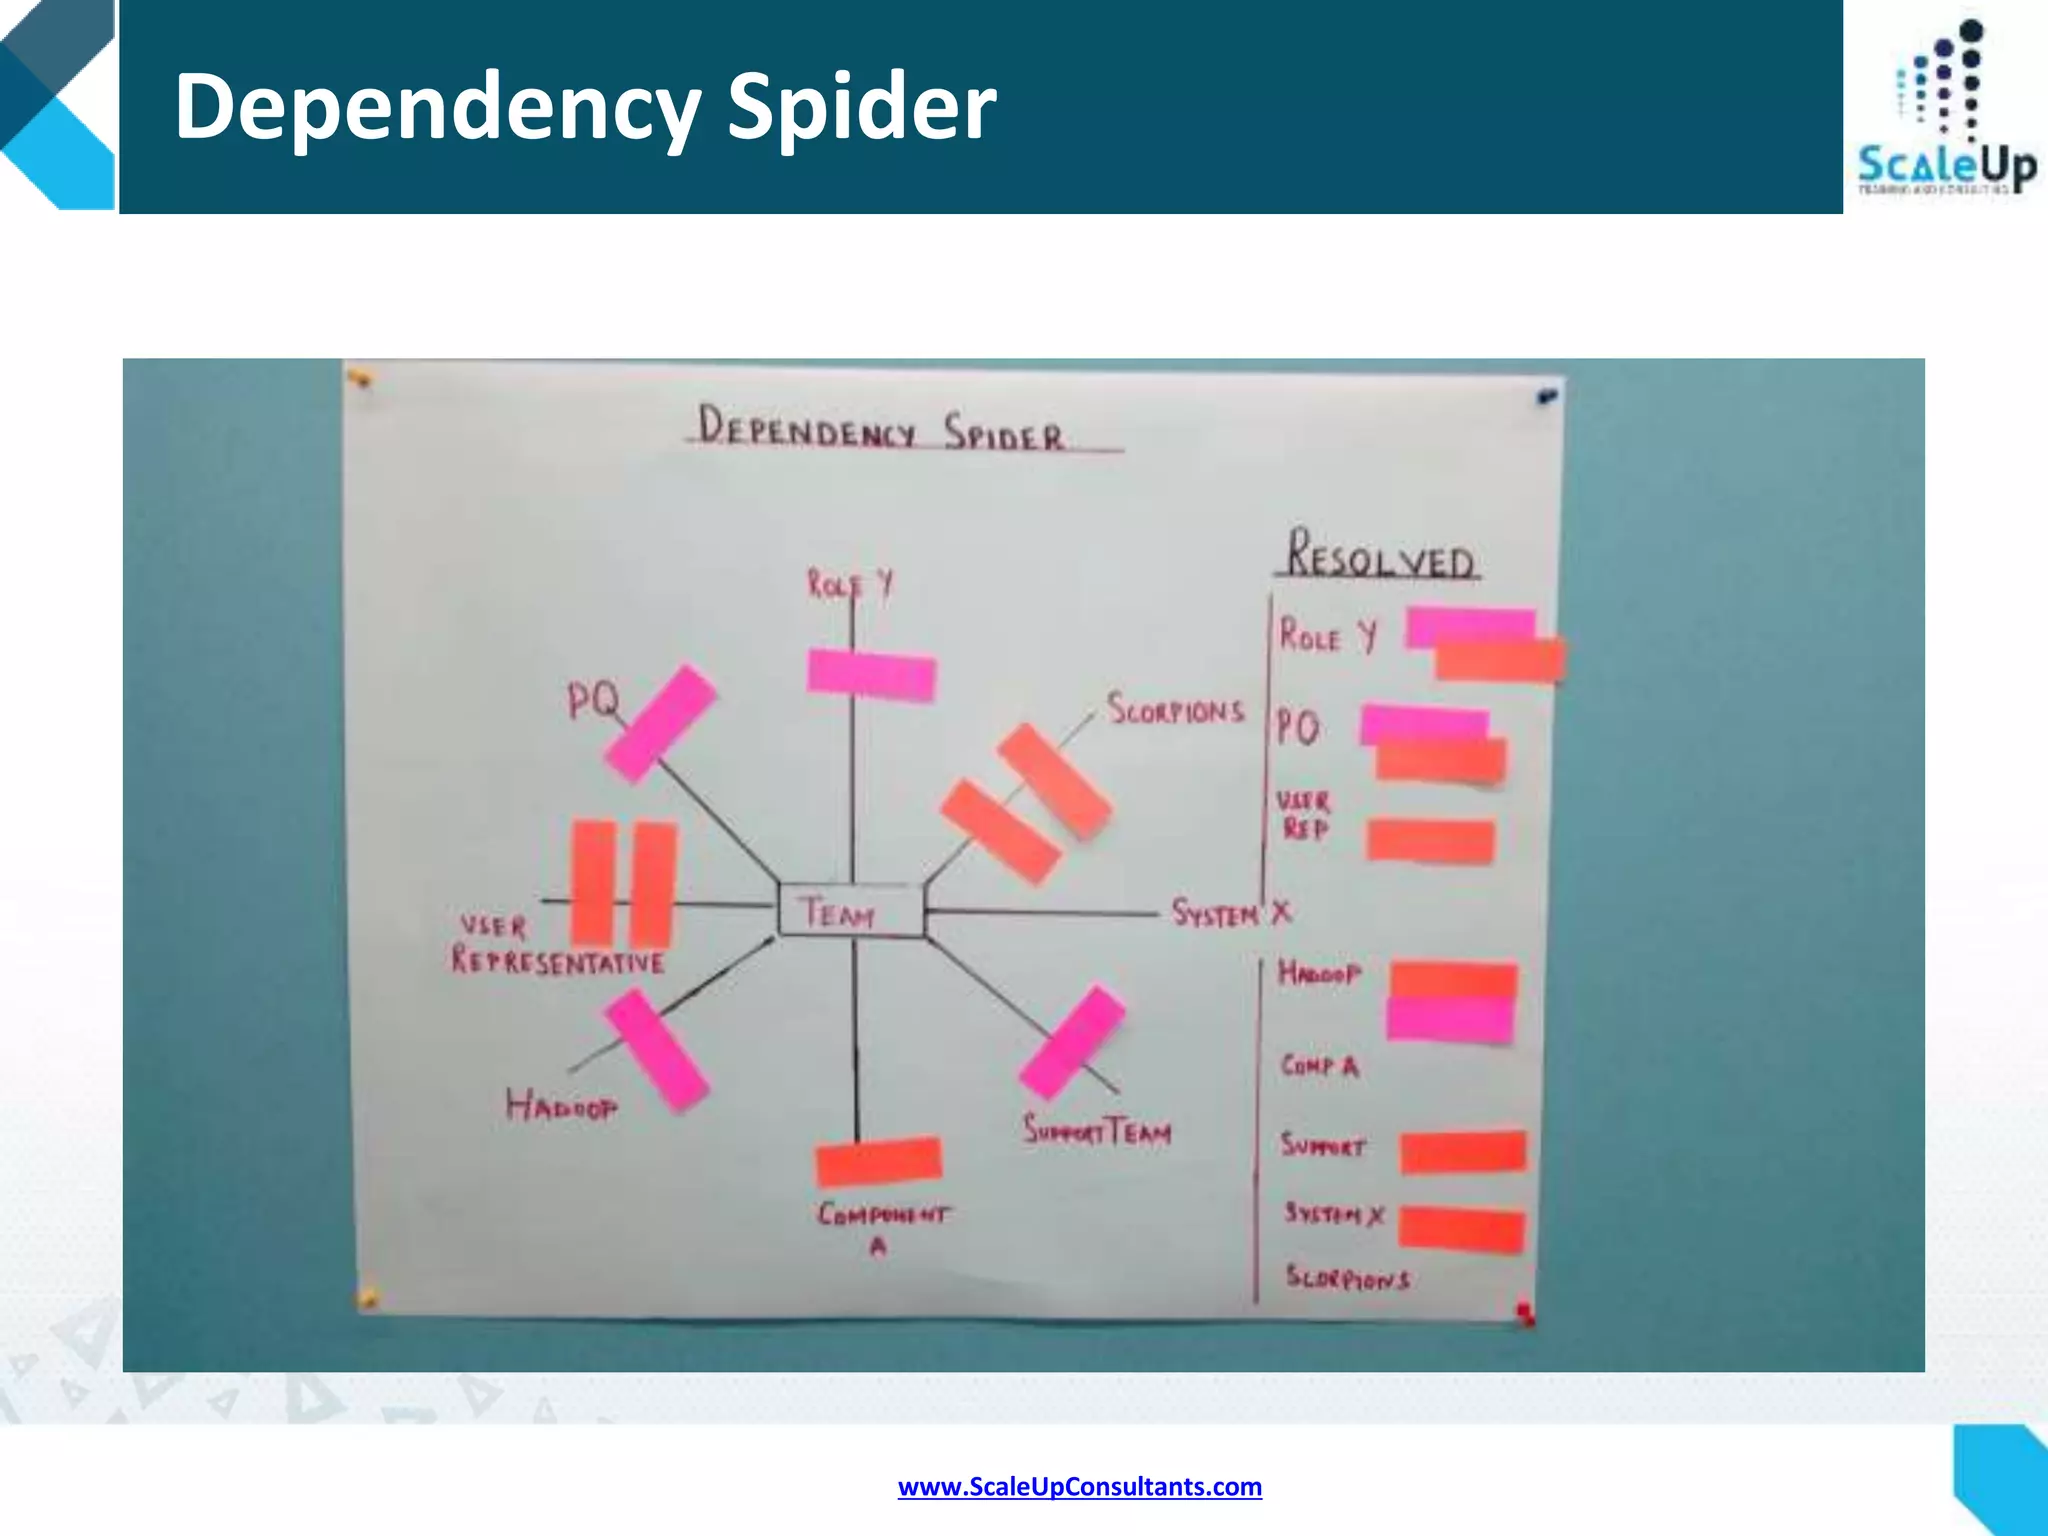
Provides multiple examples of visualization techniques applicable in Agile projects.
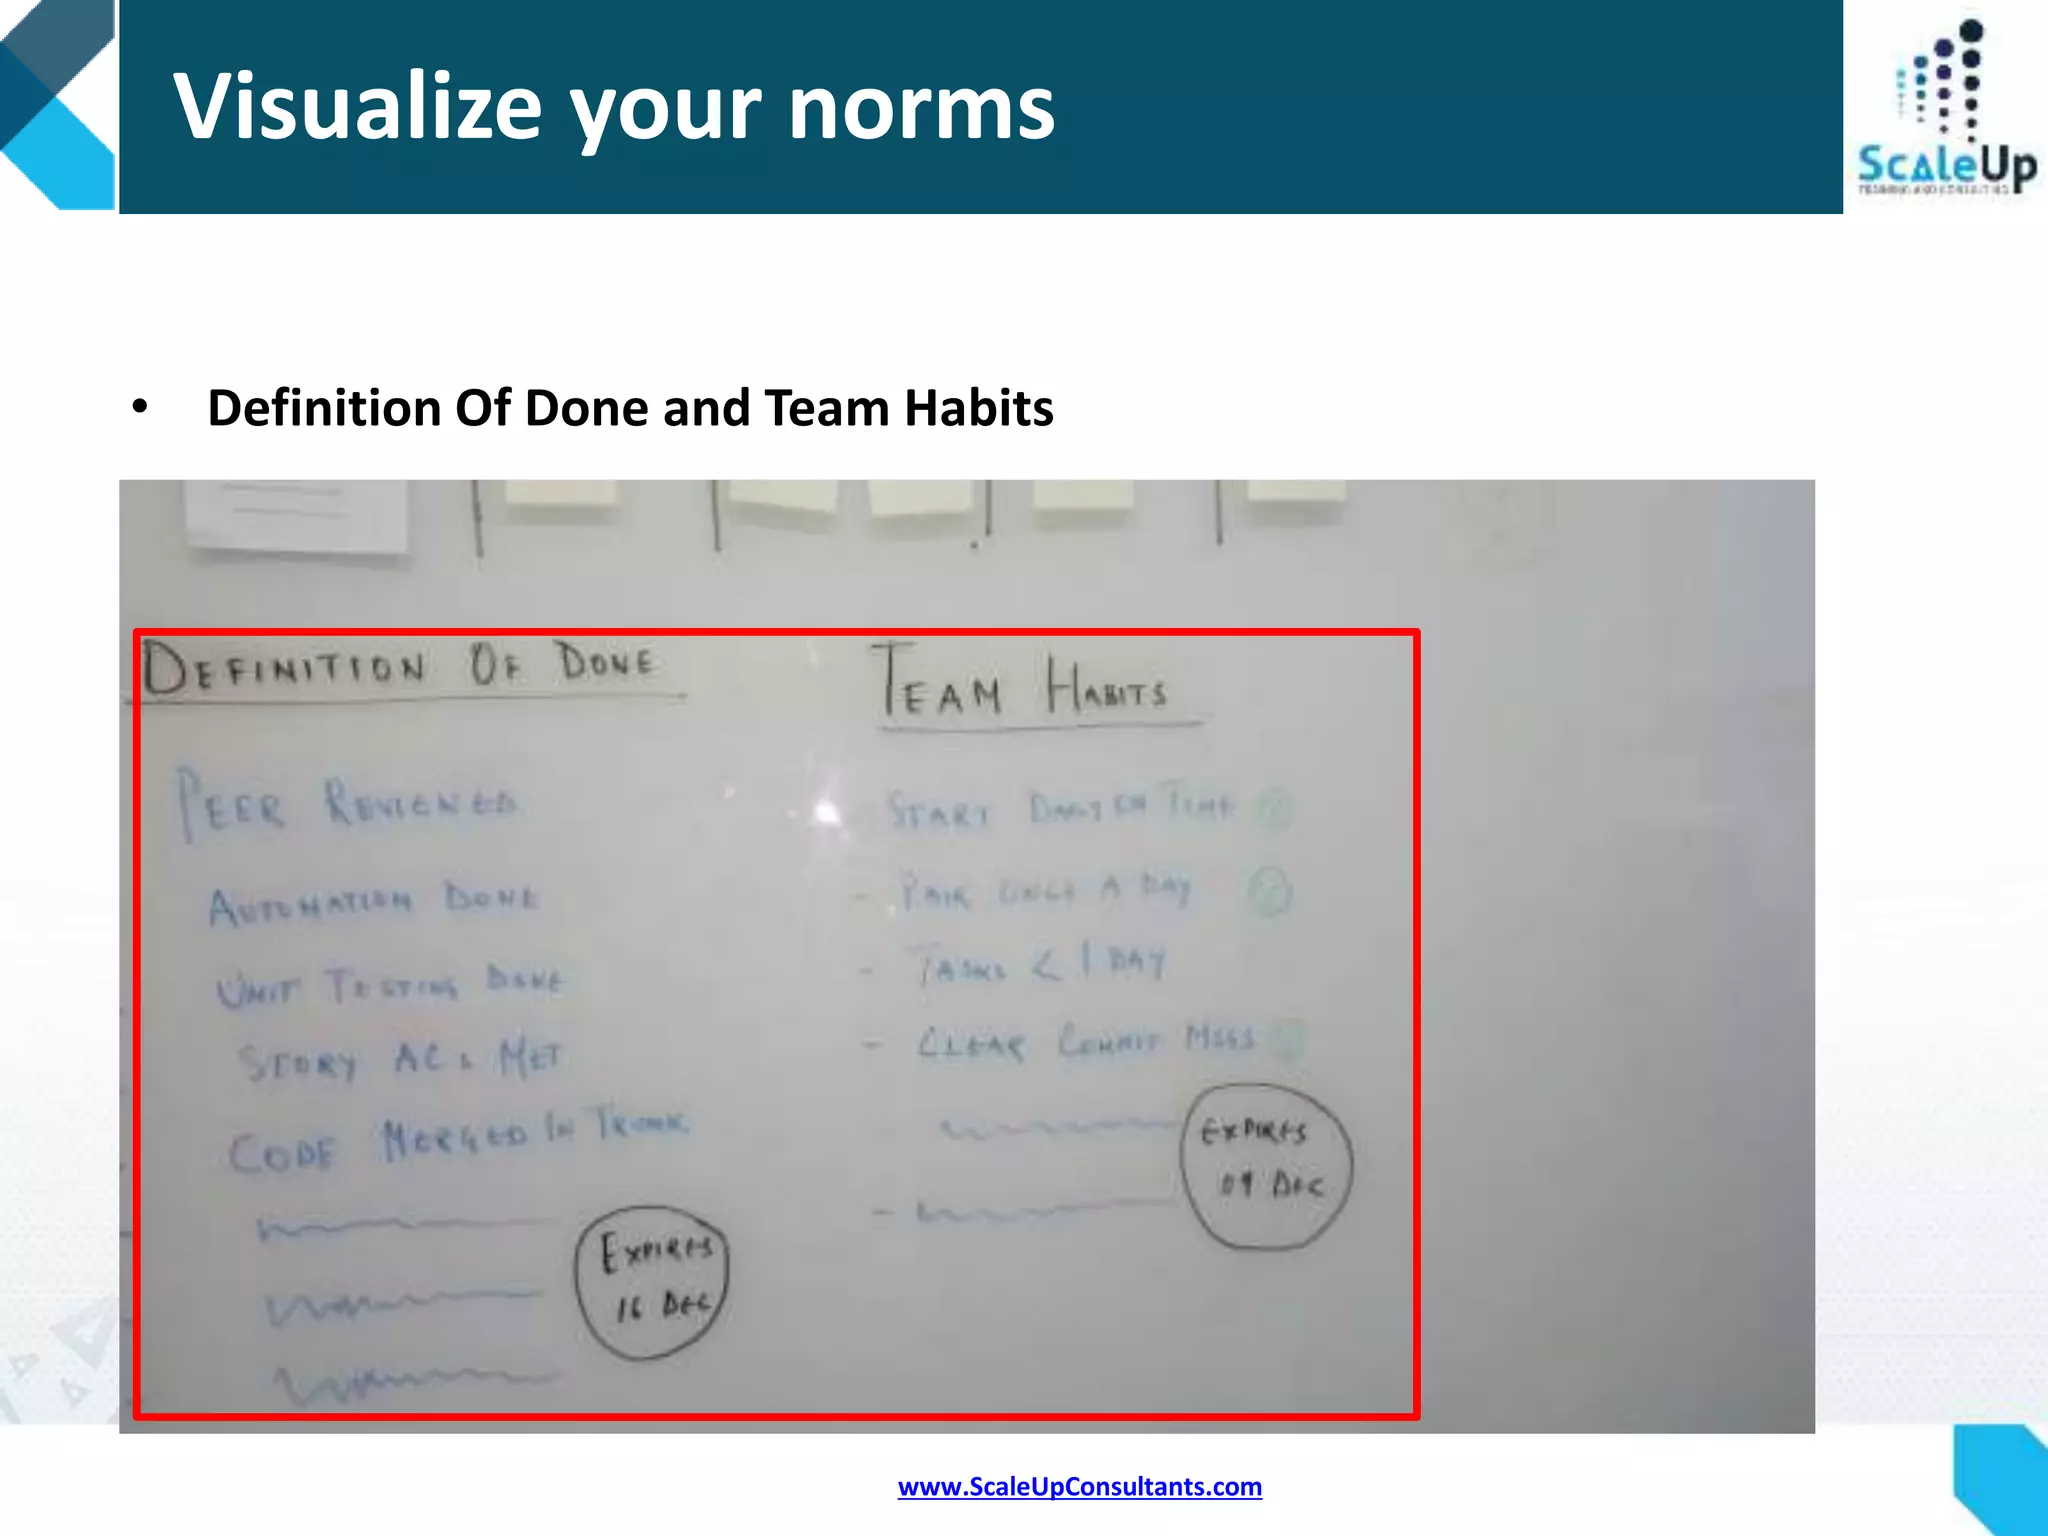
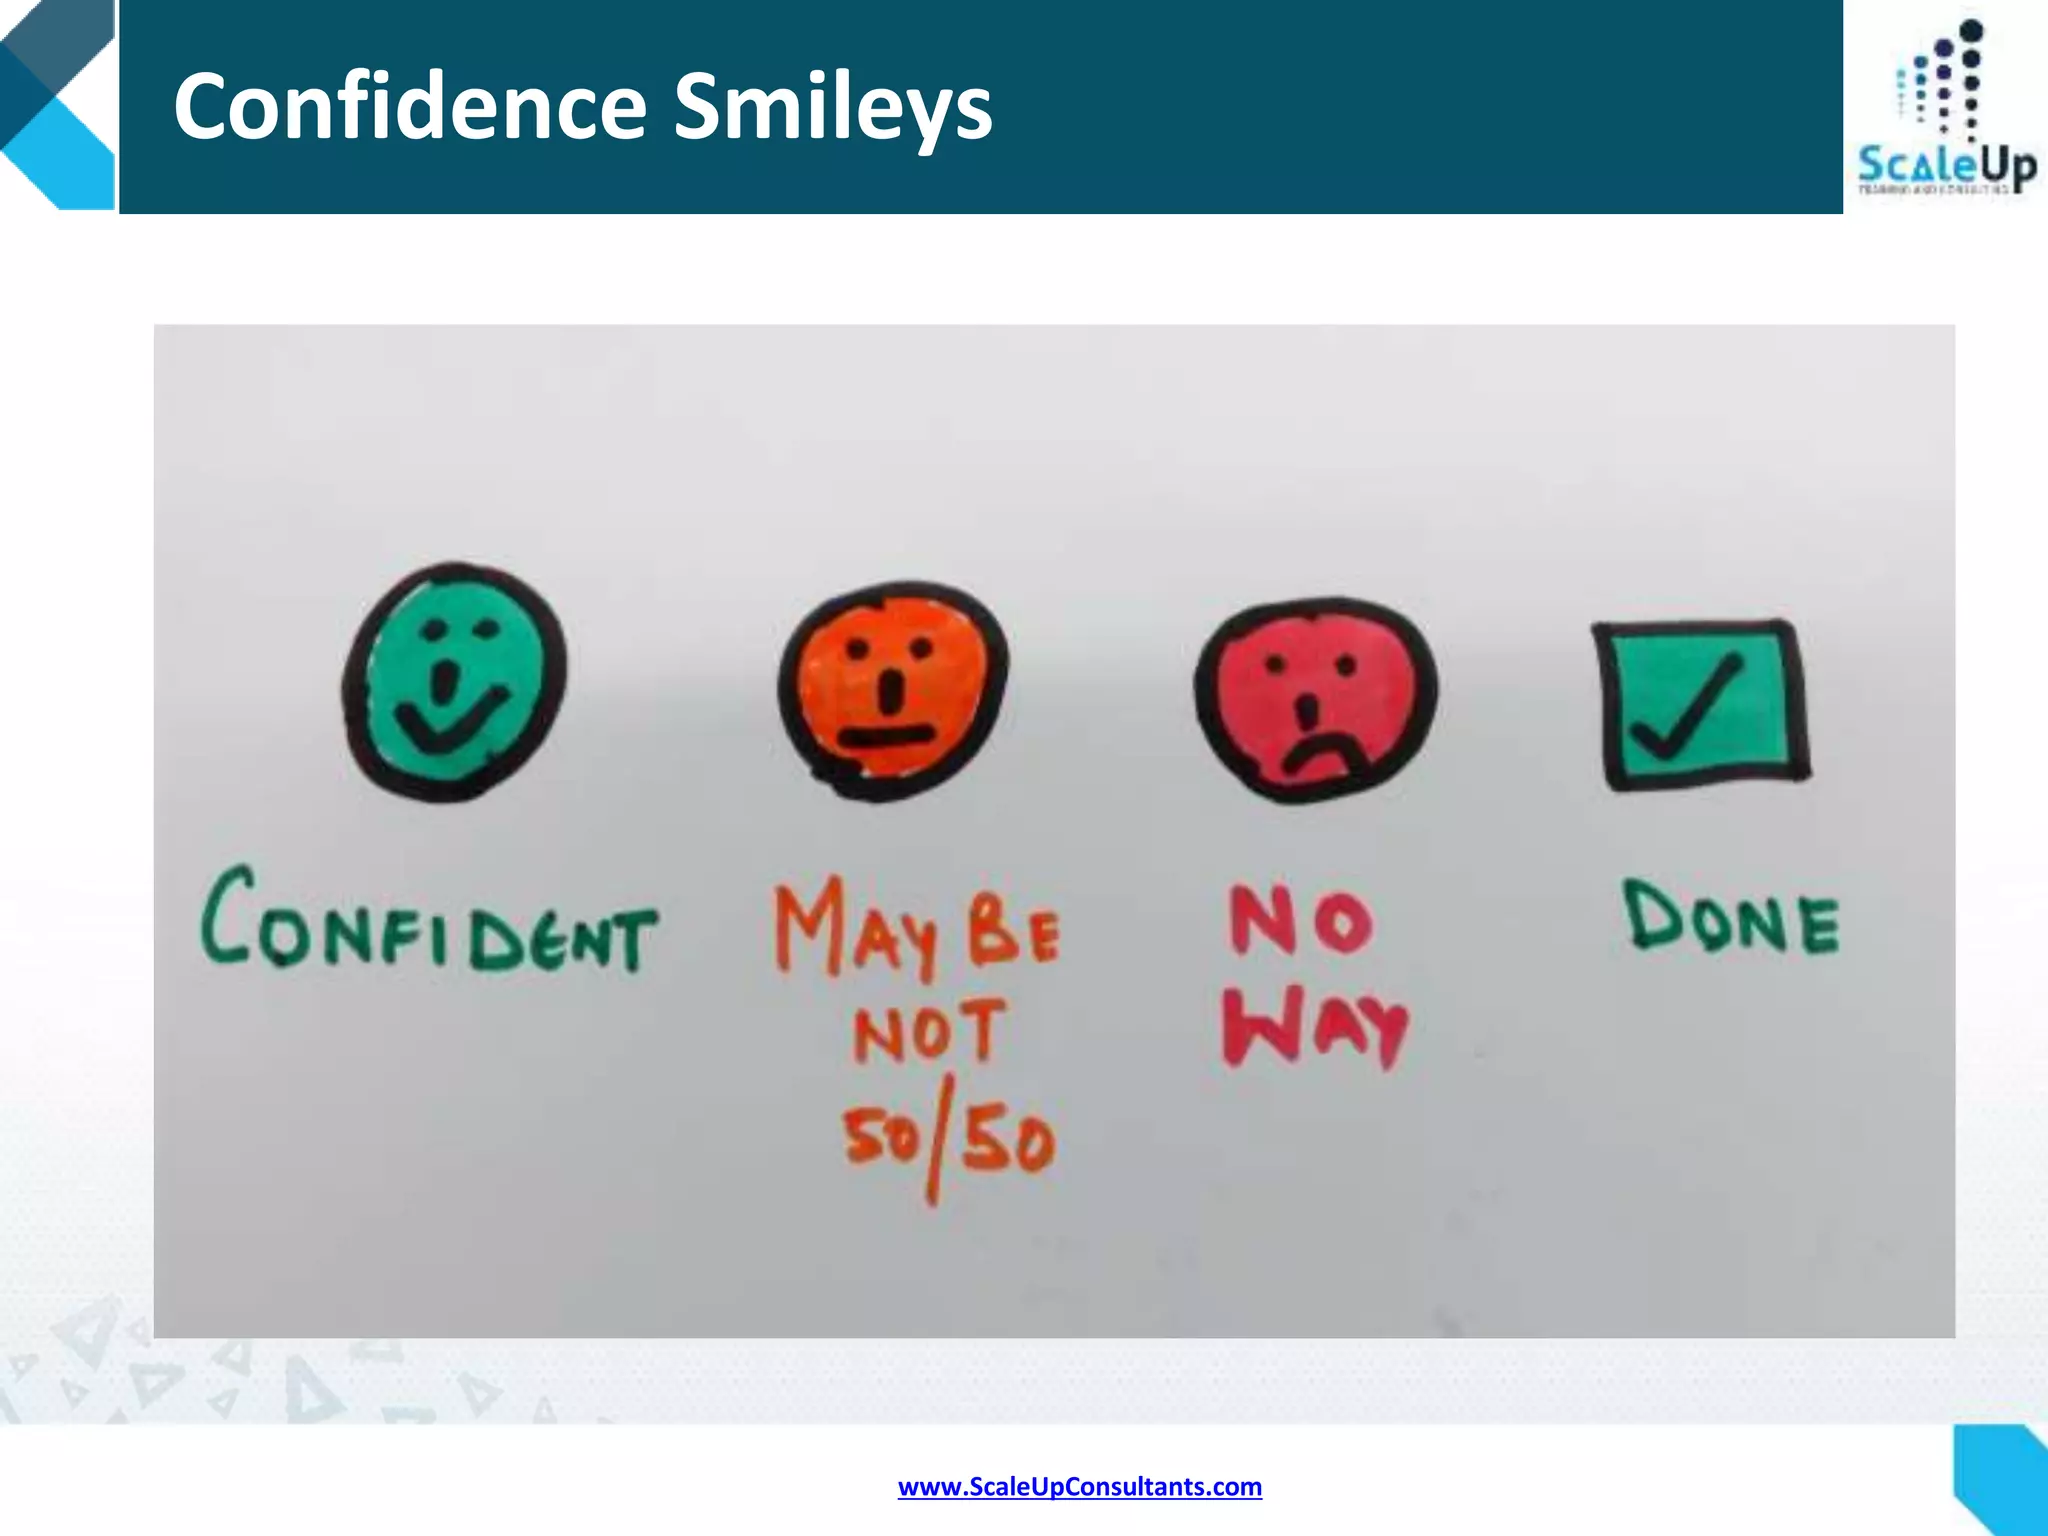
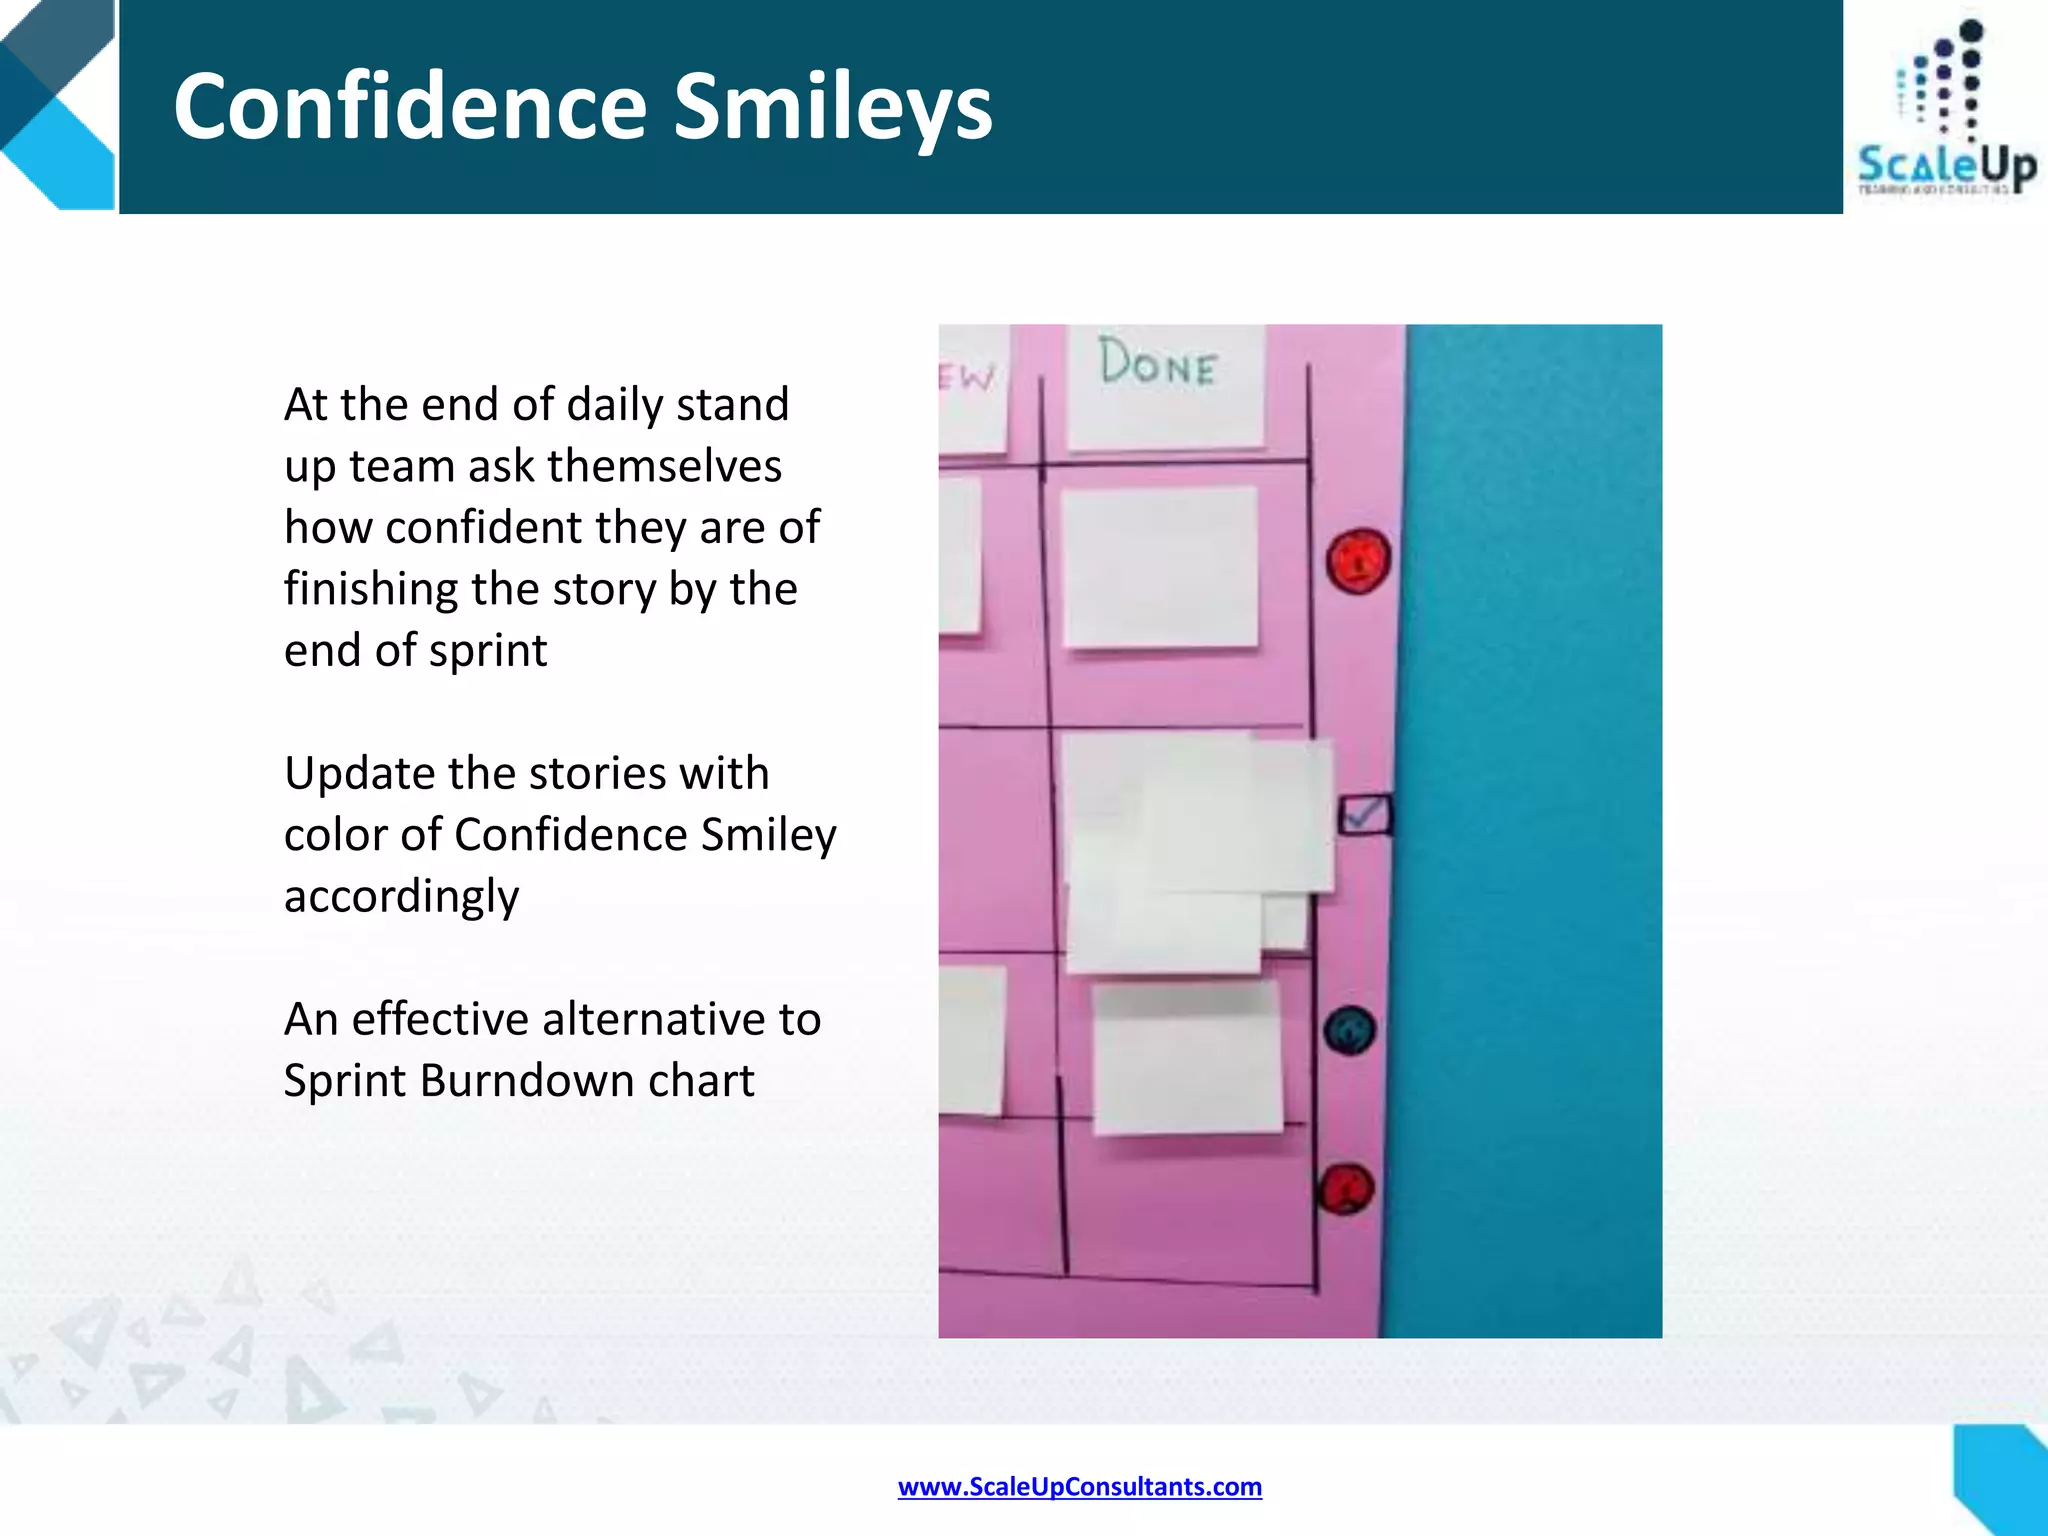
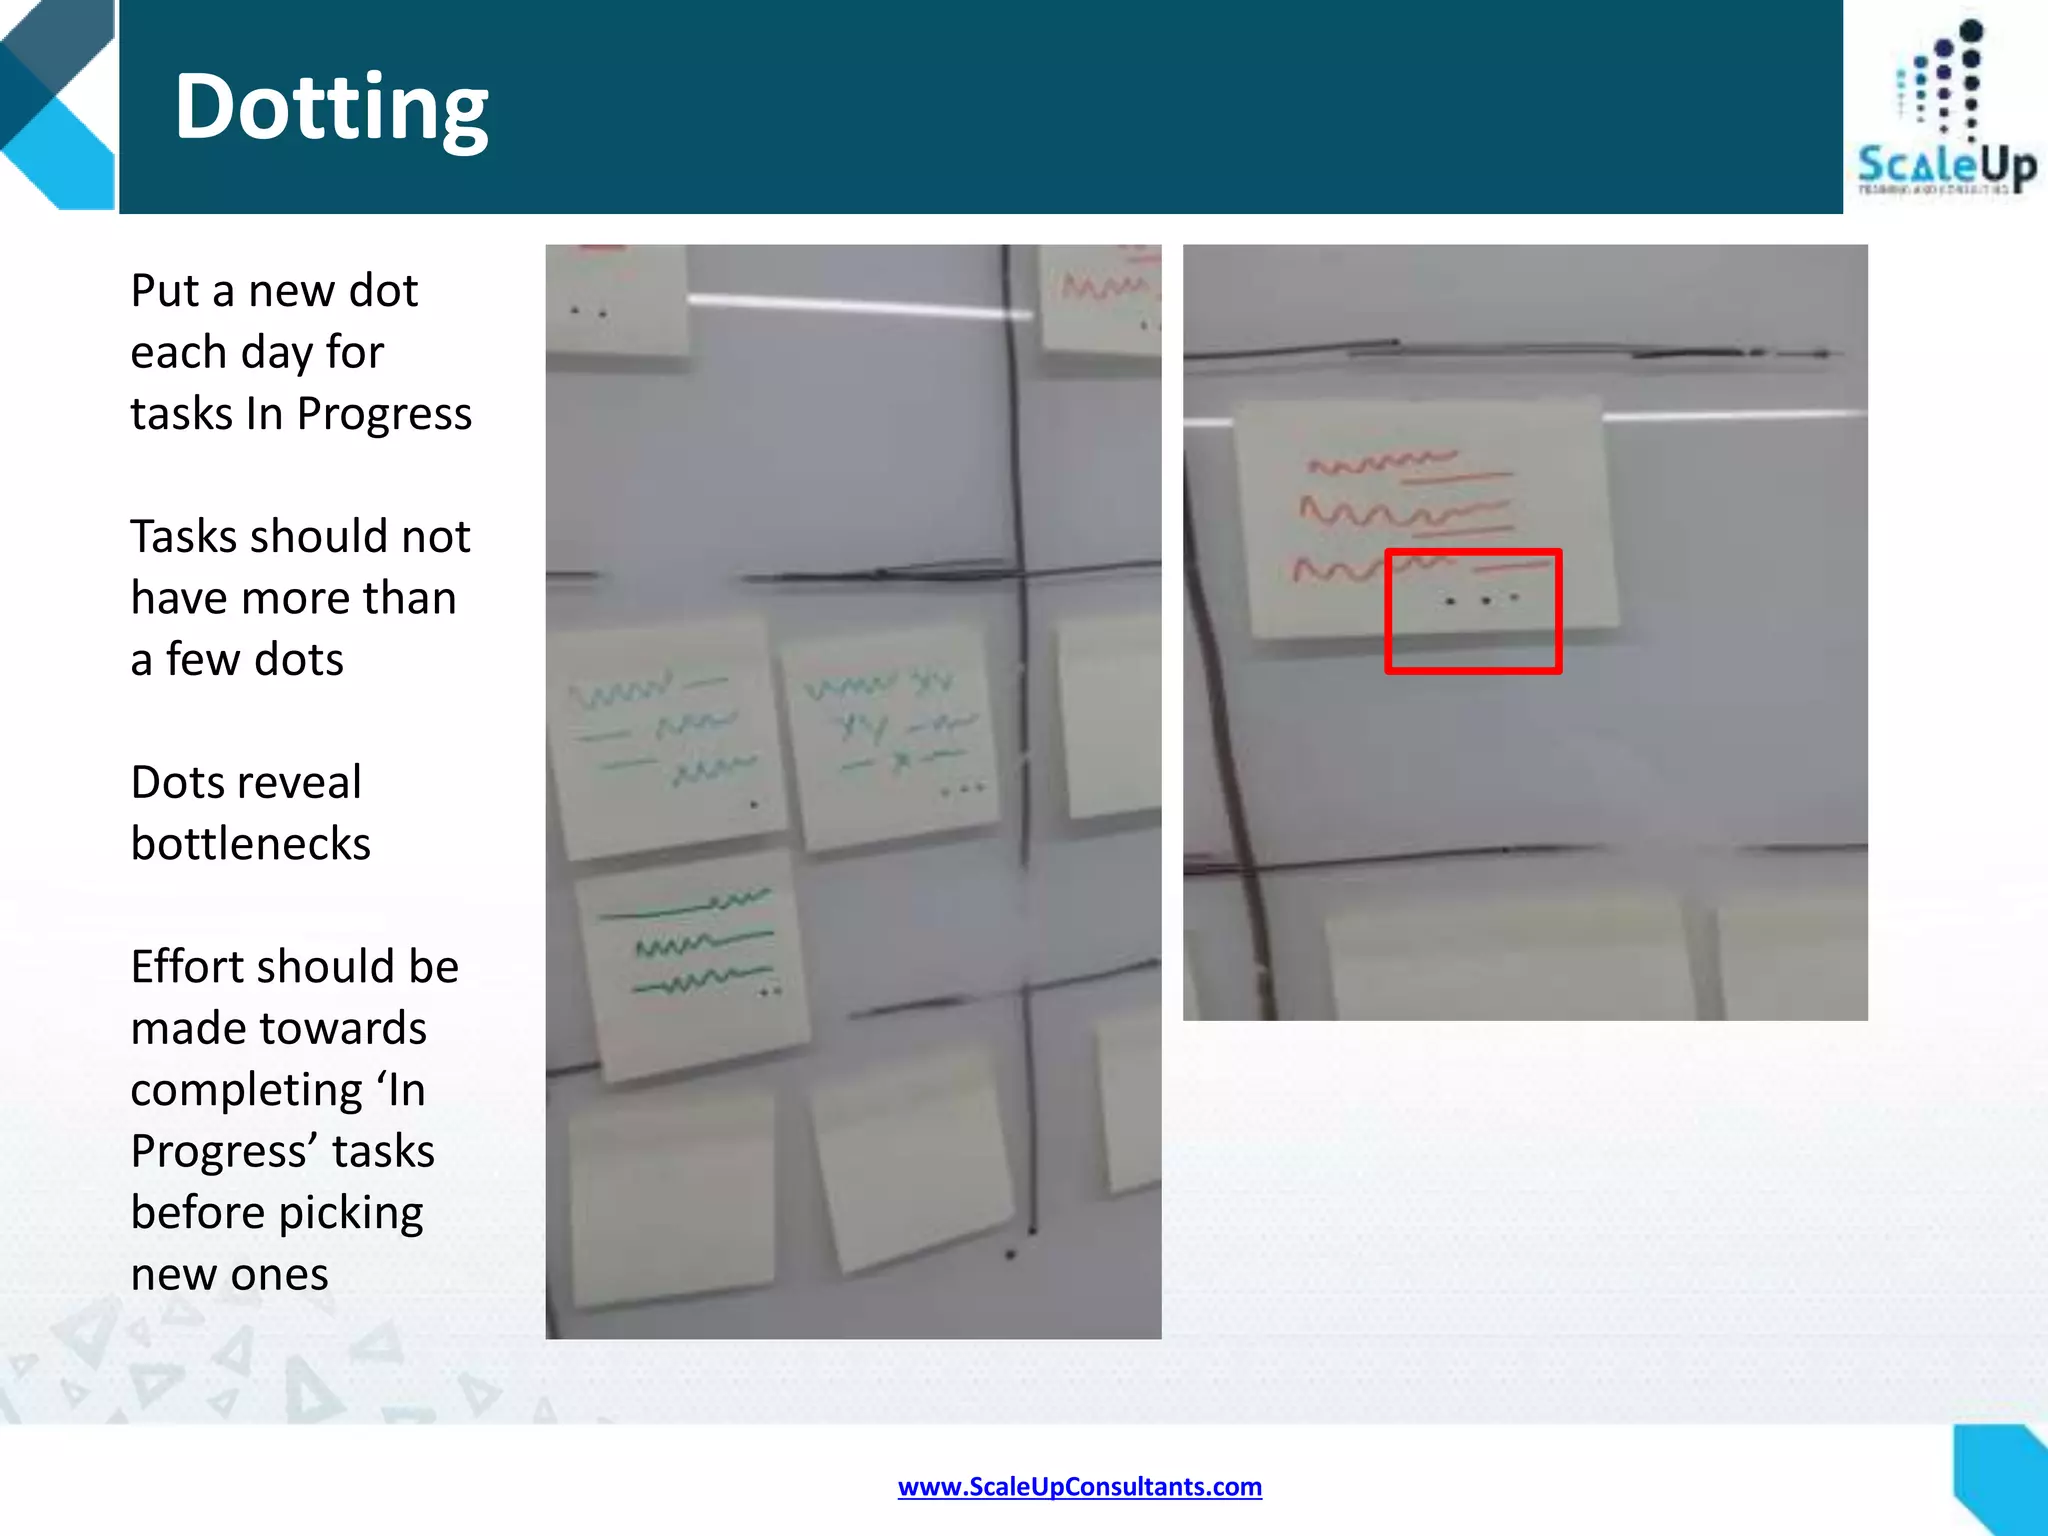
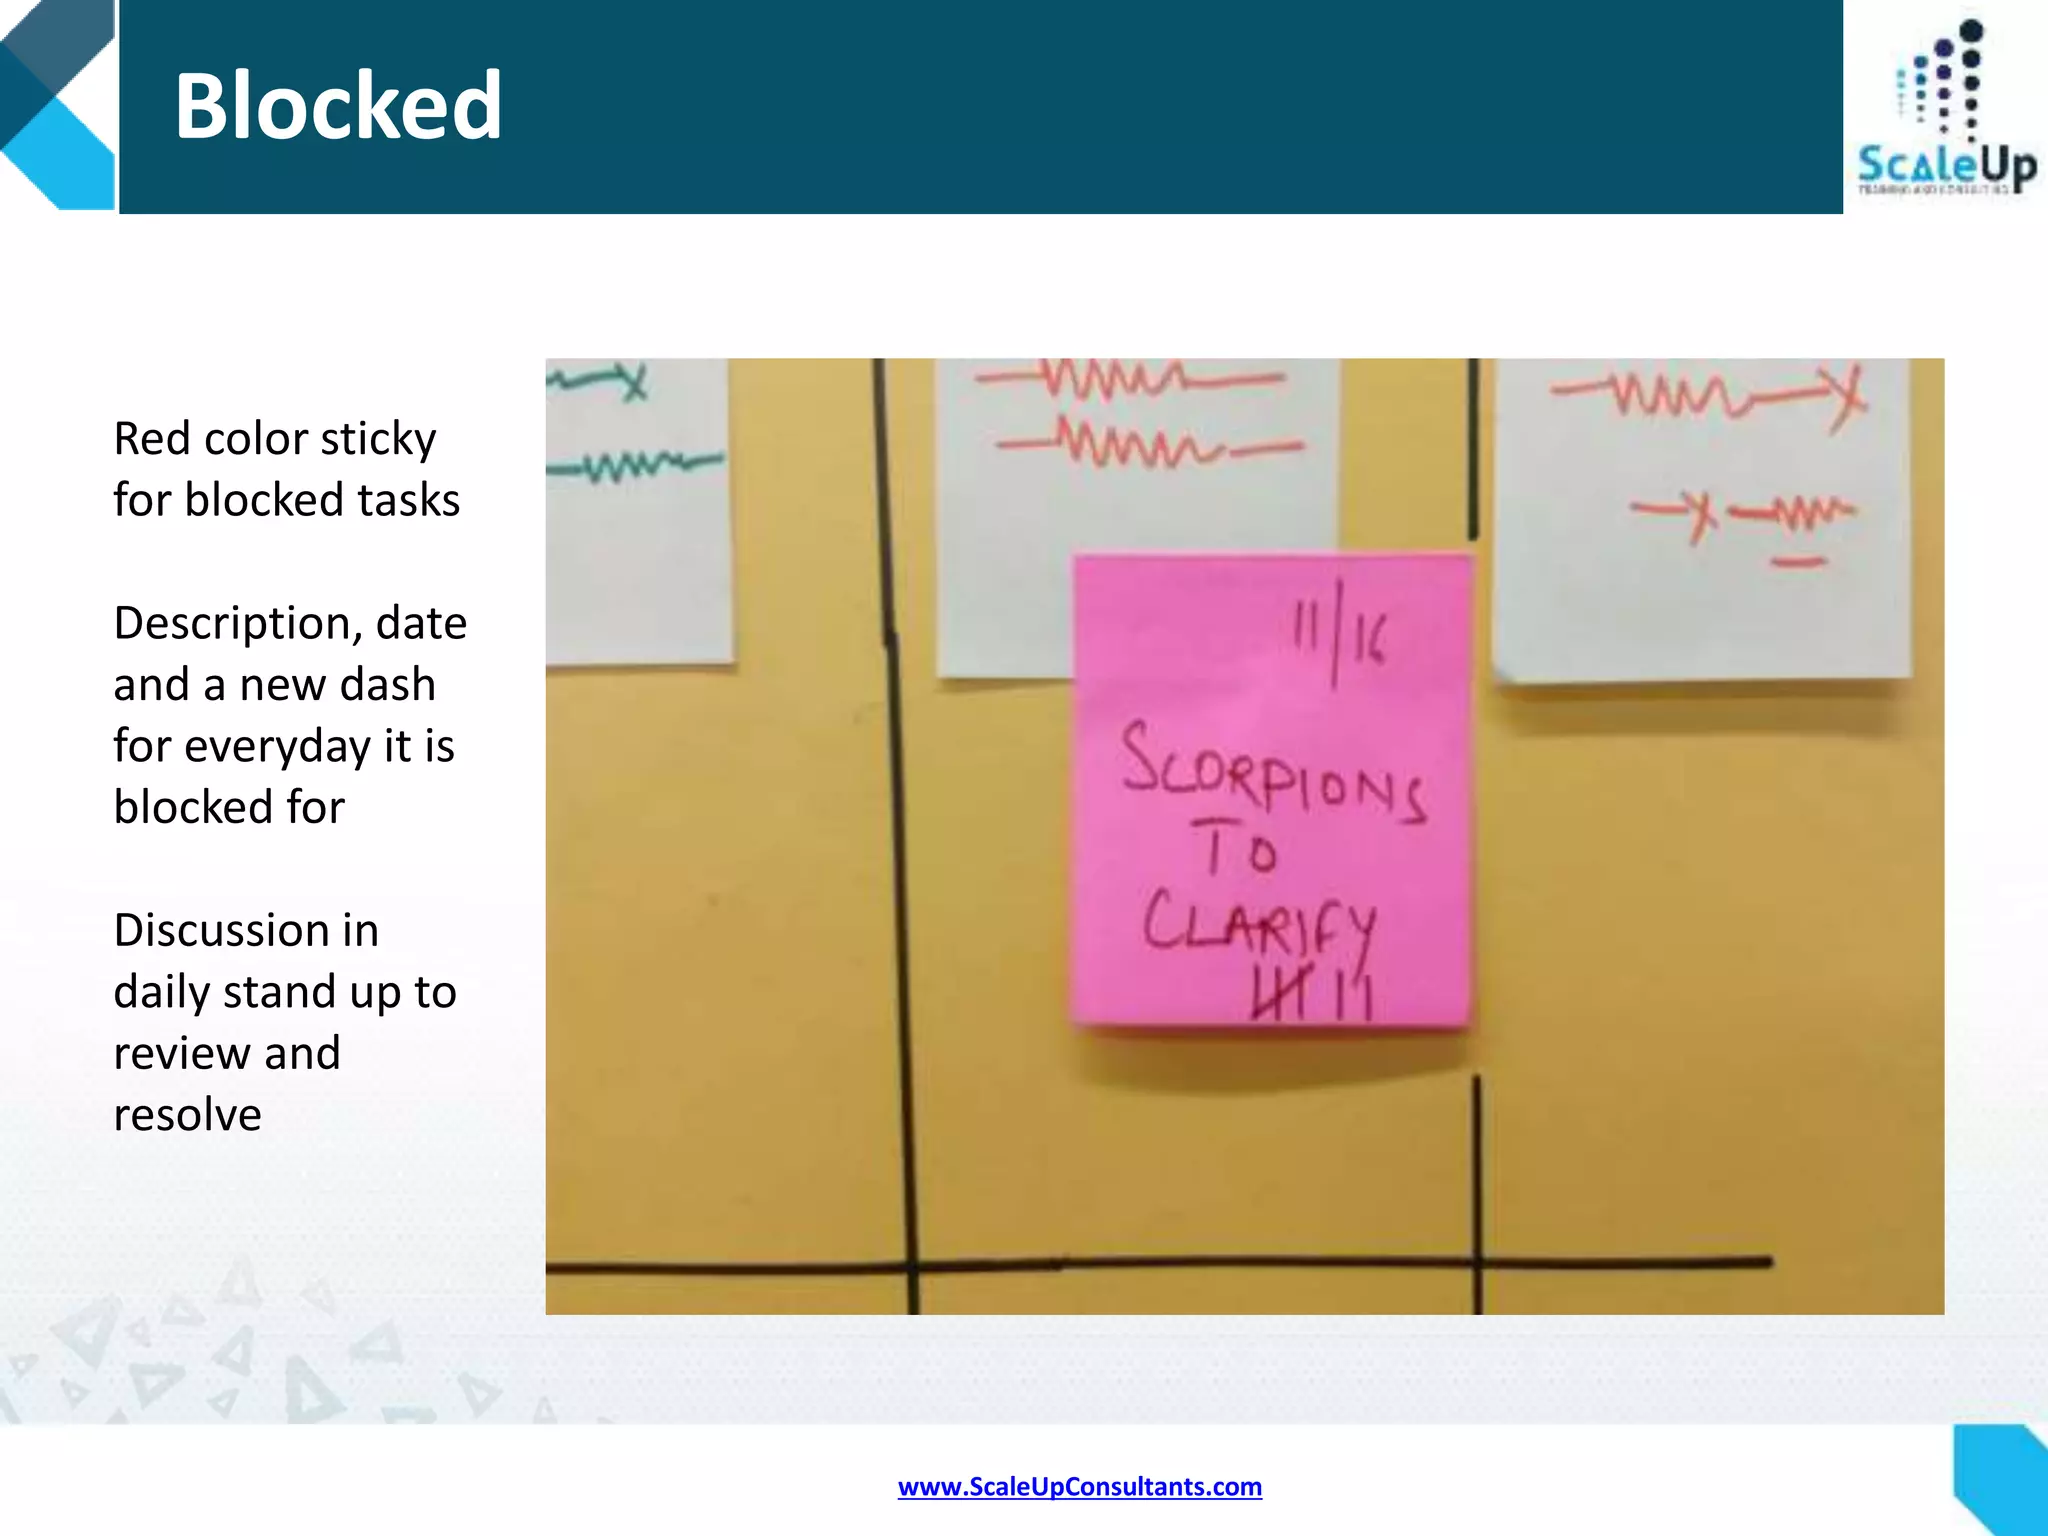
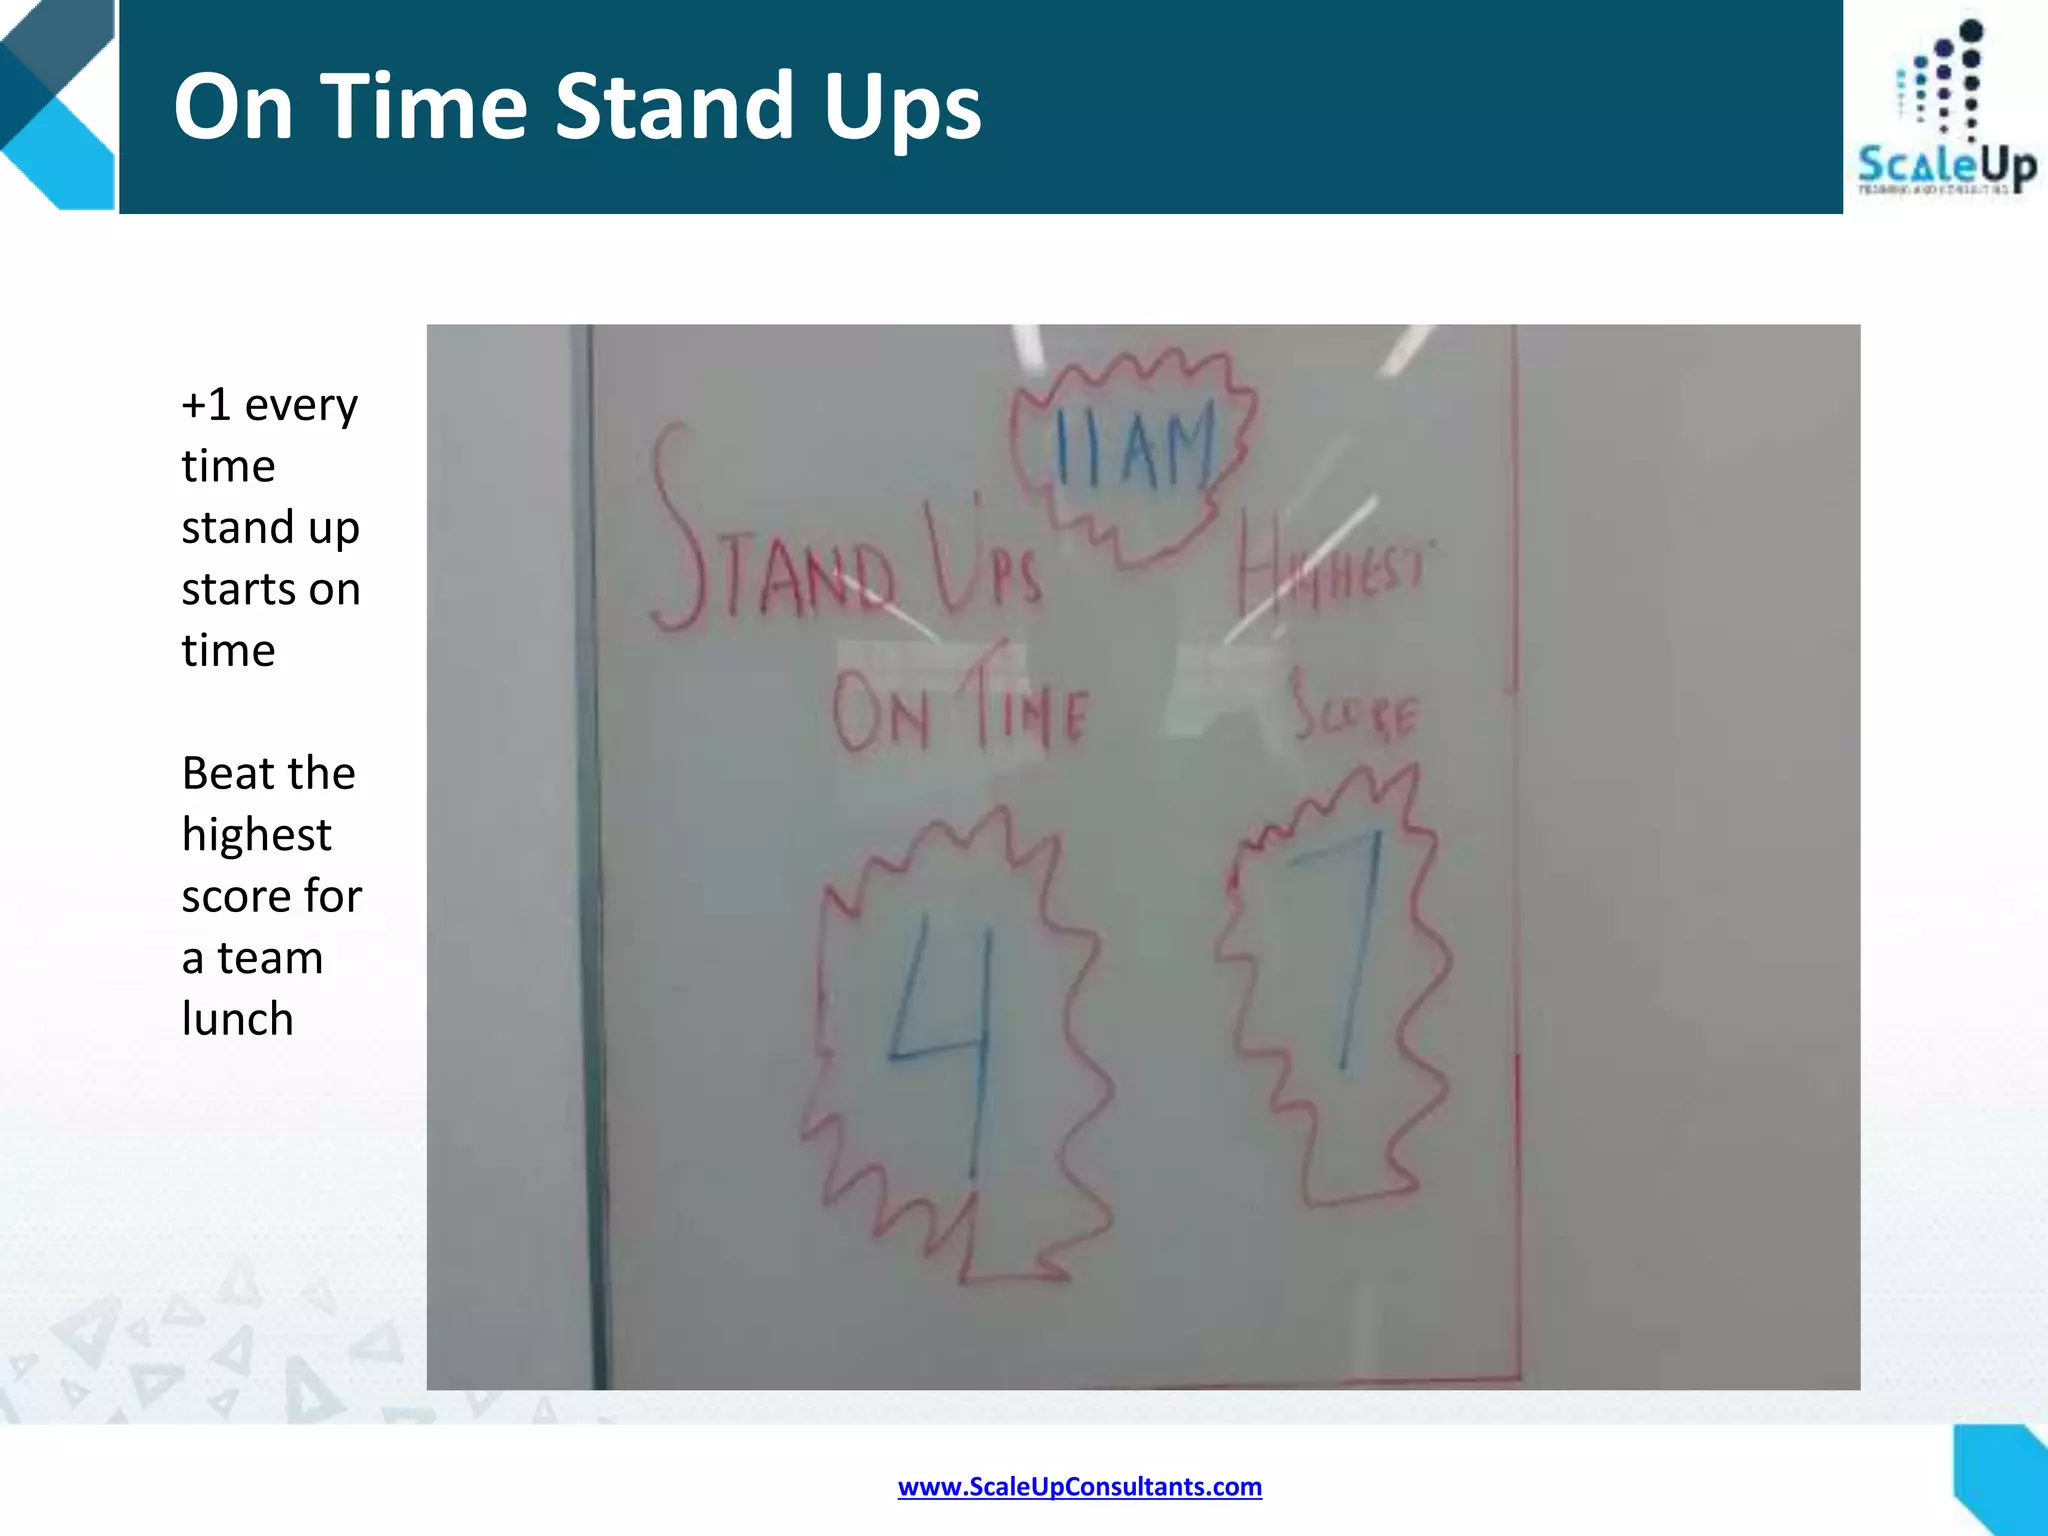
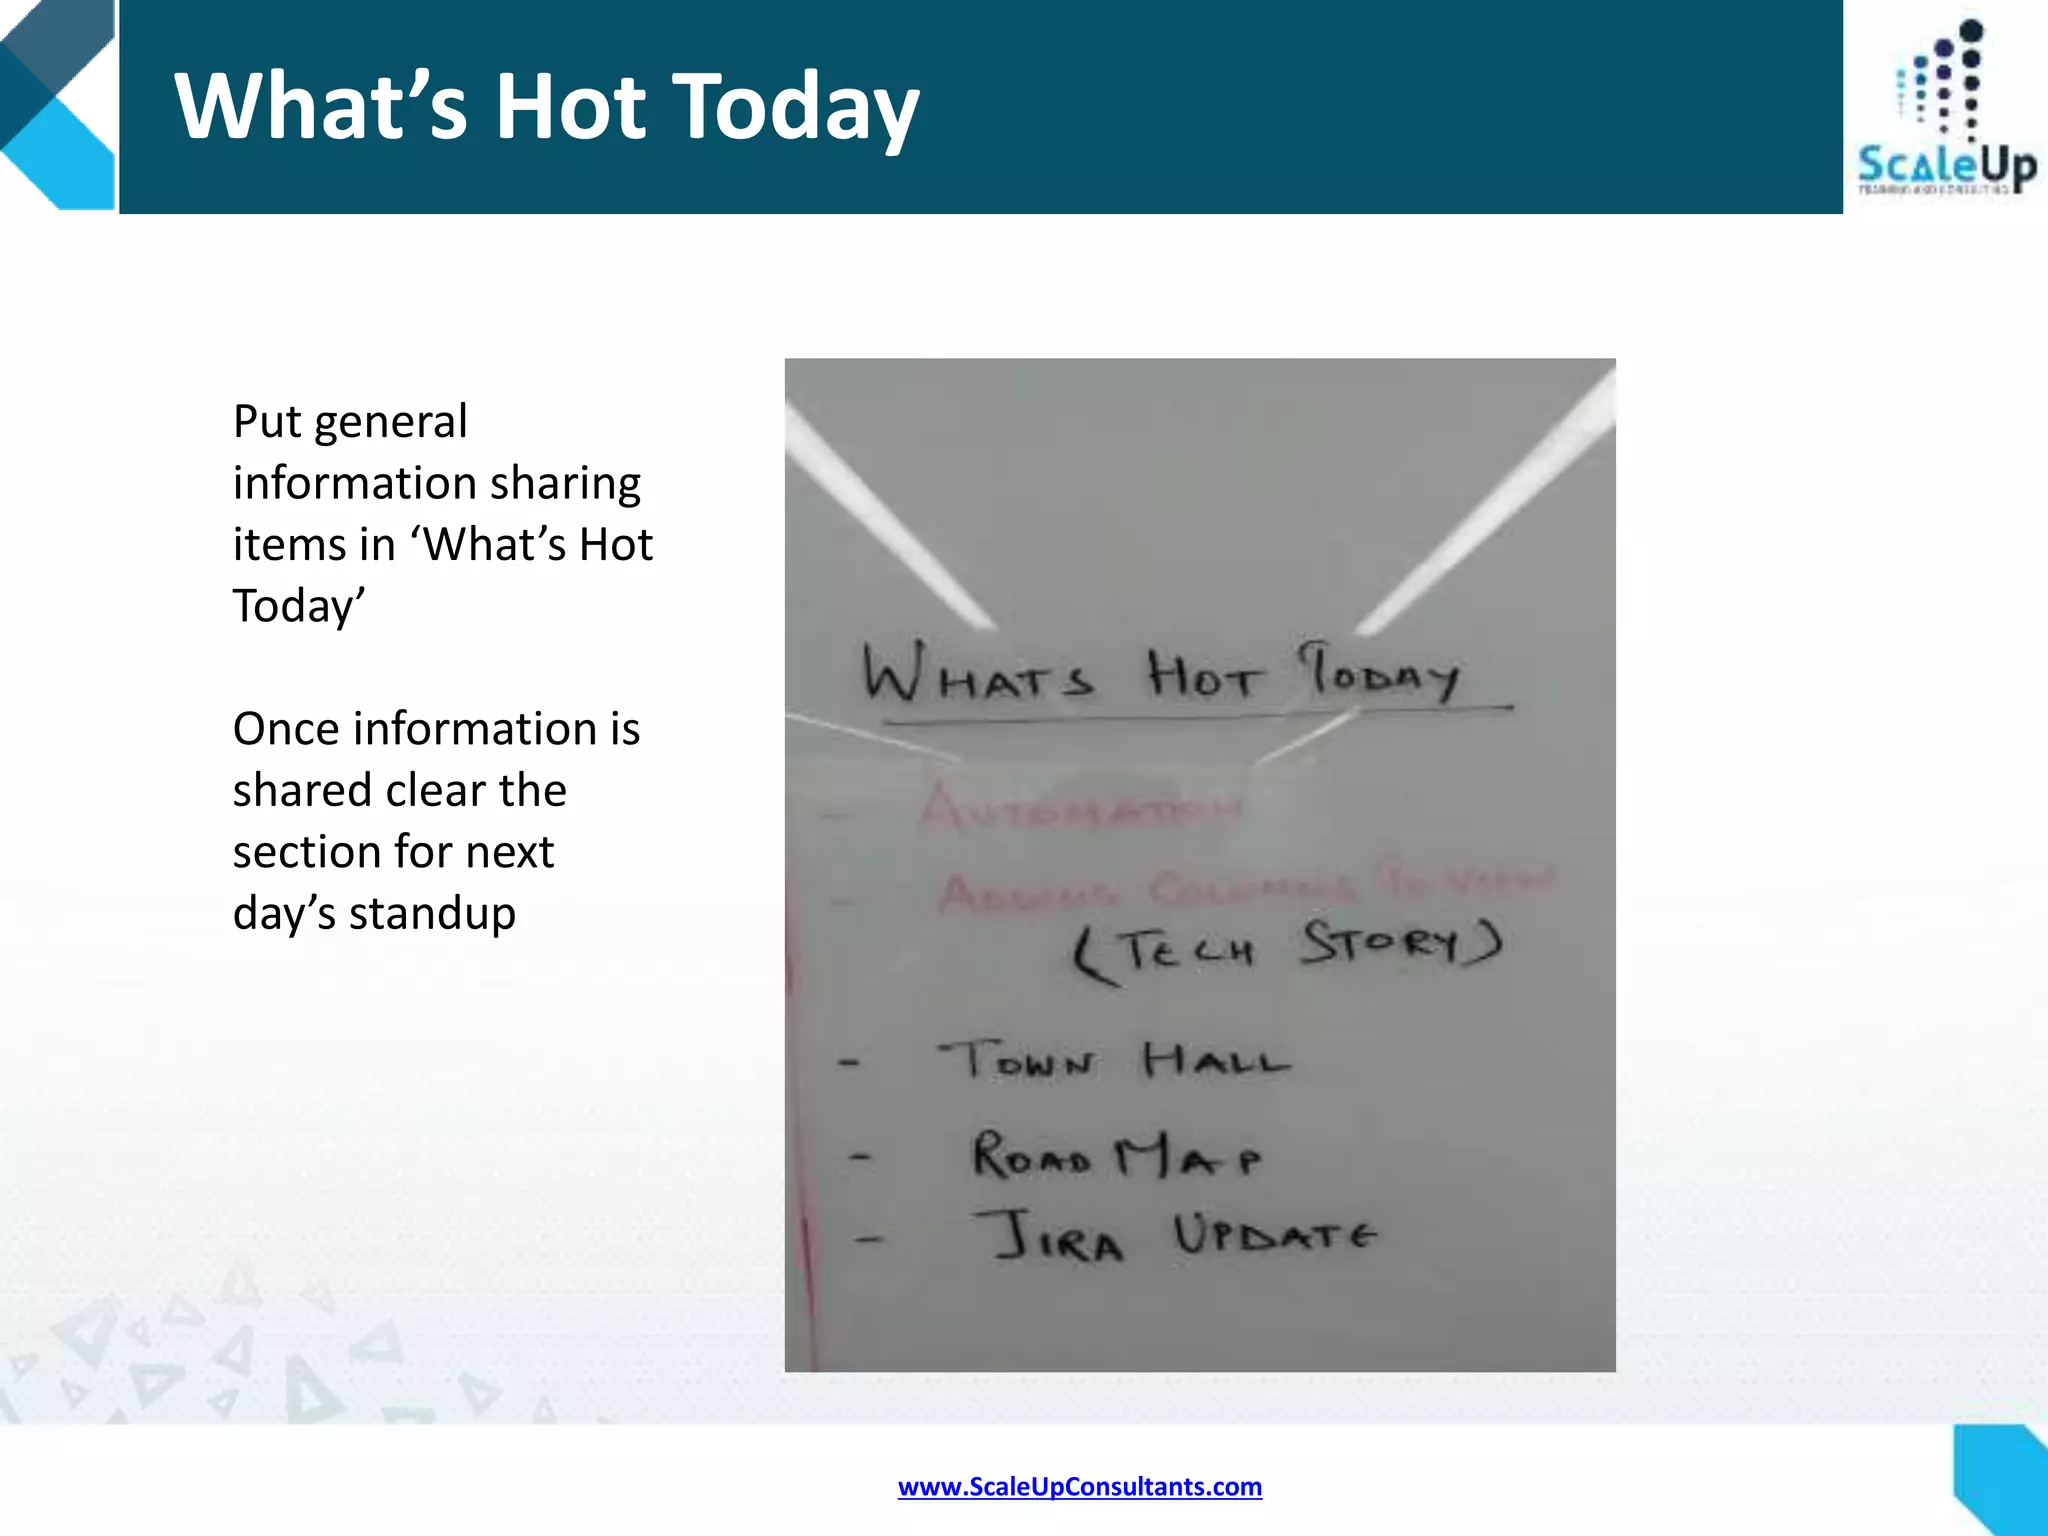
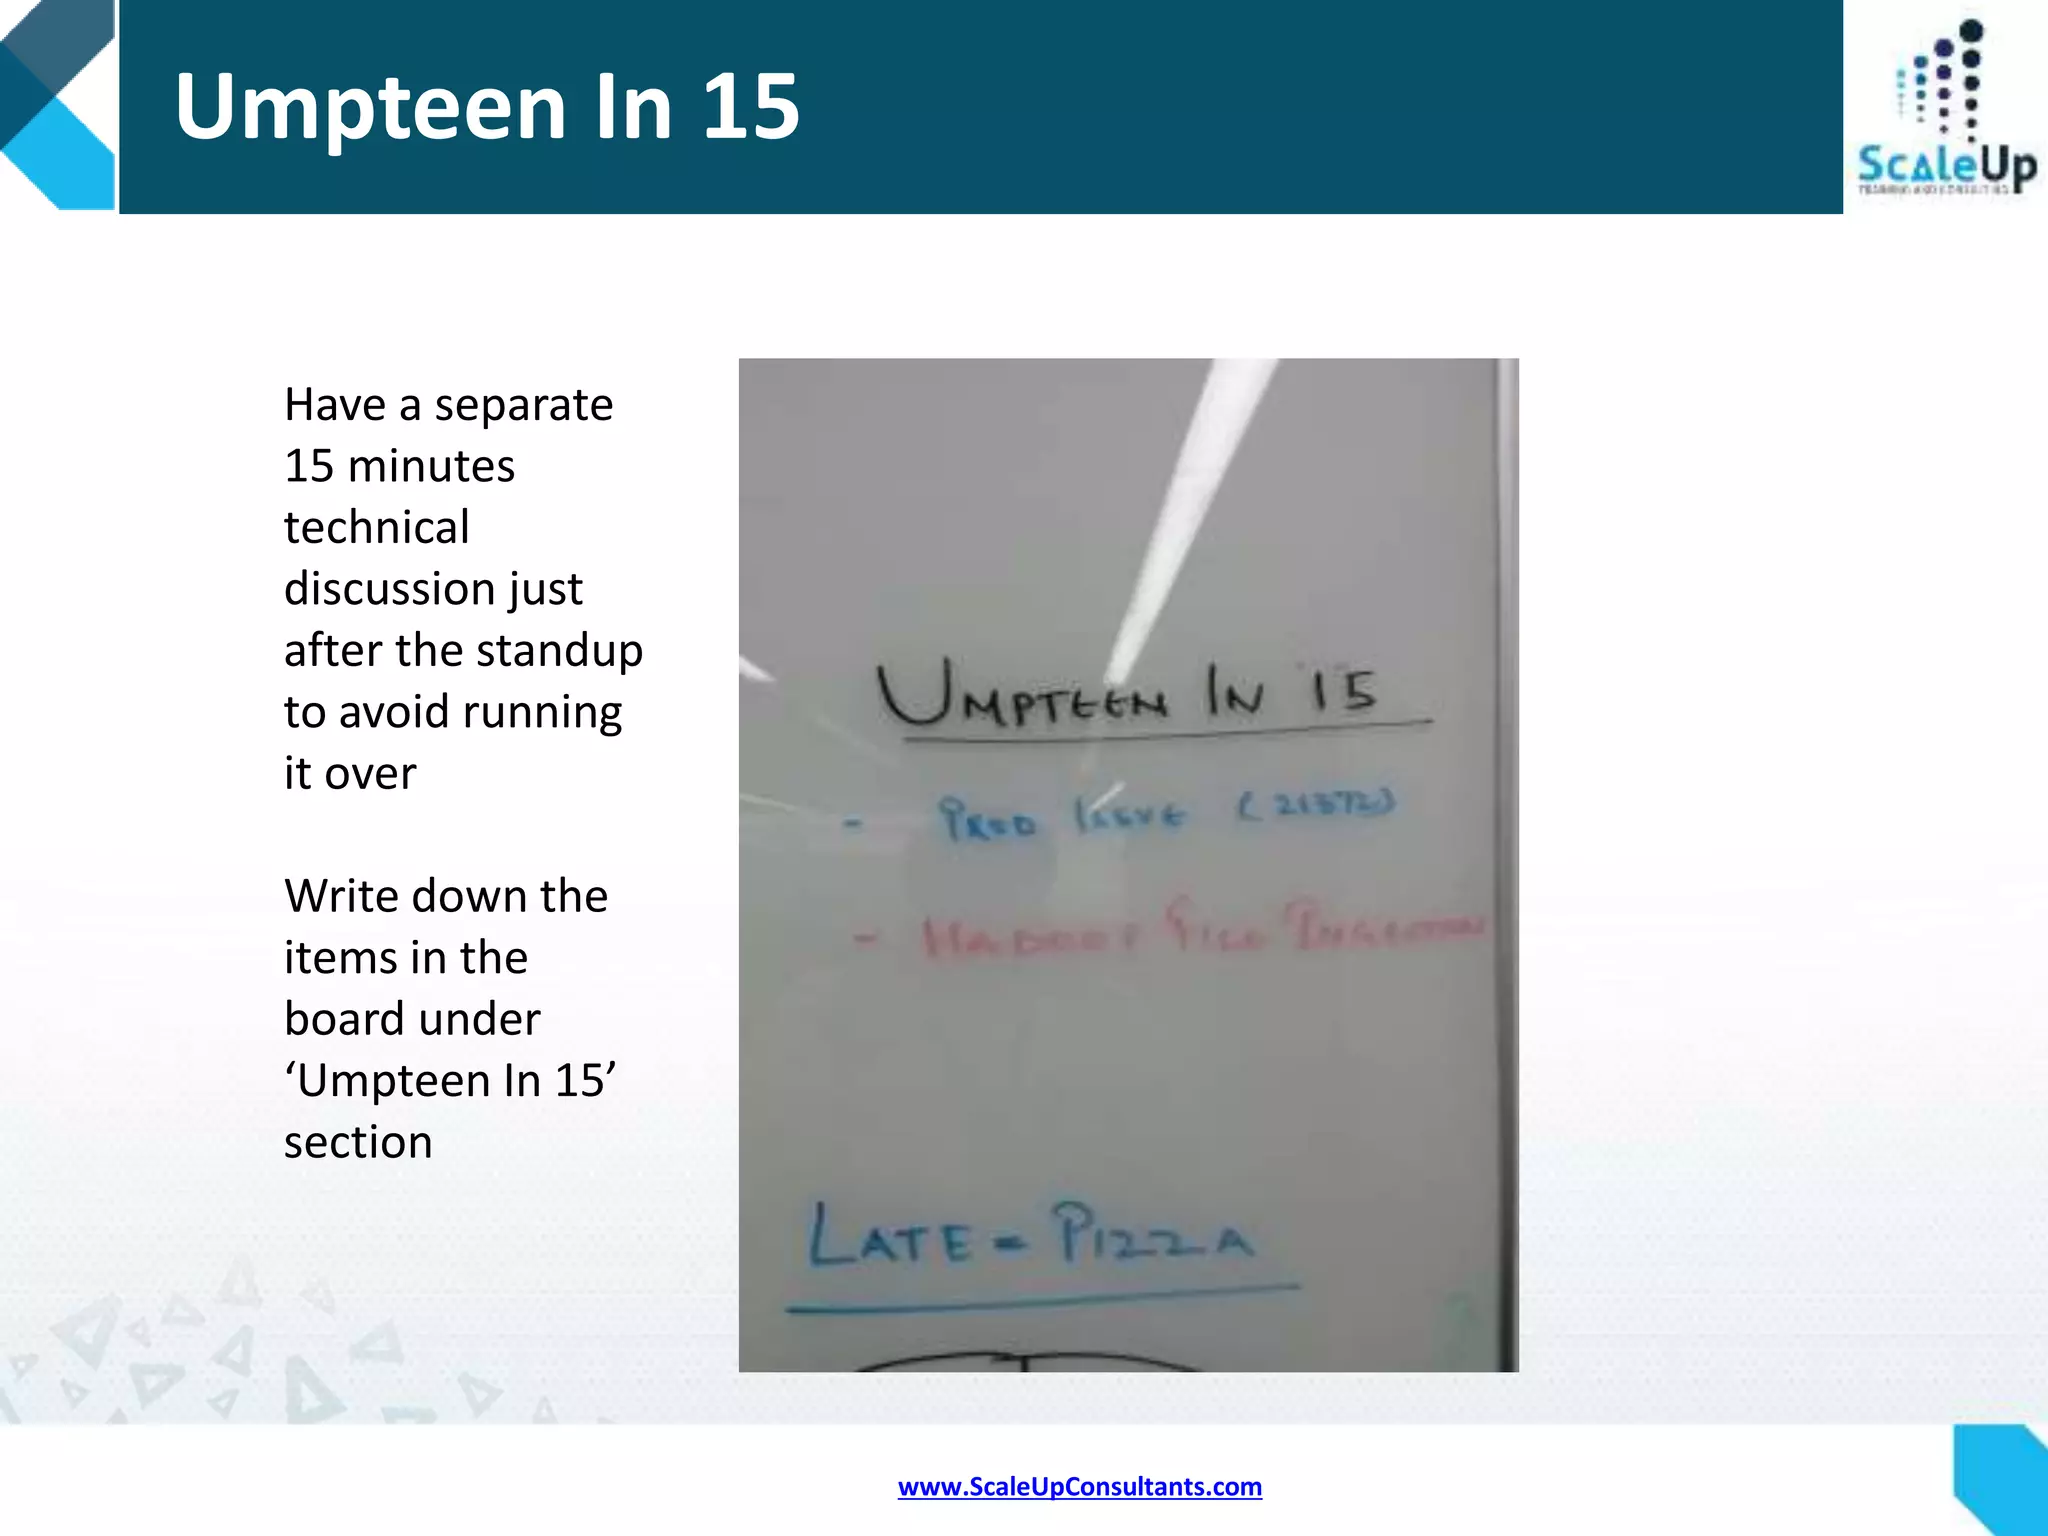
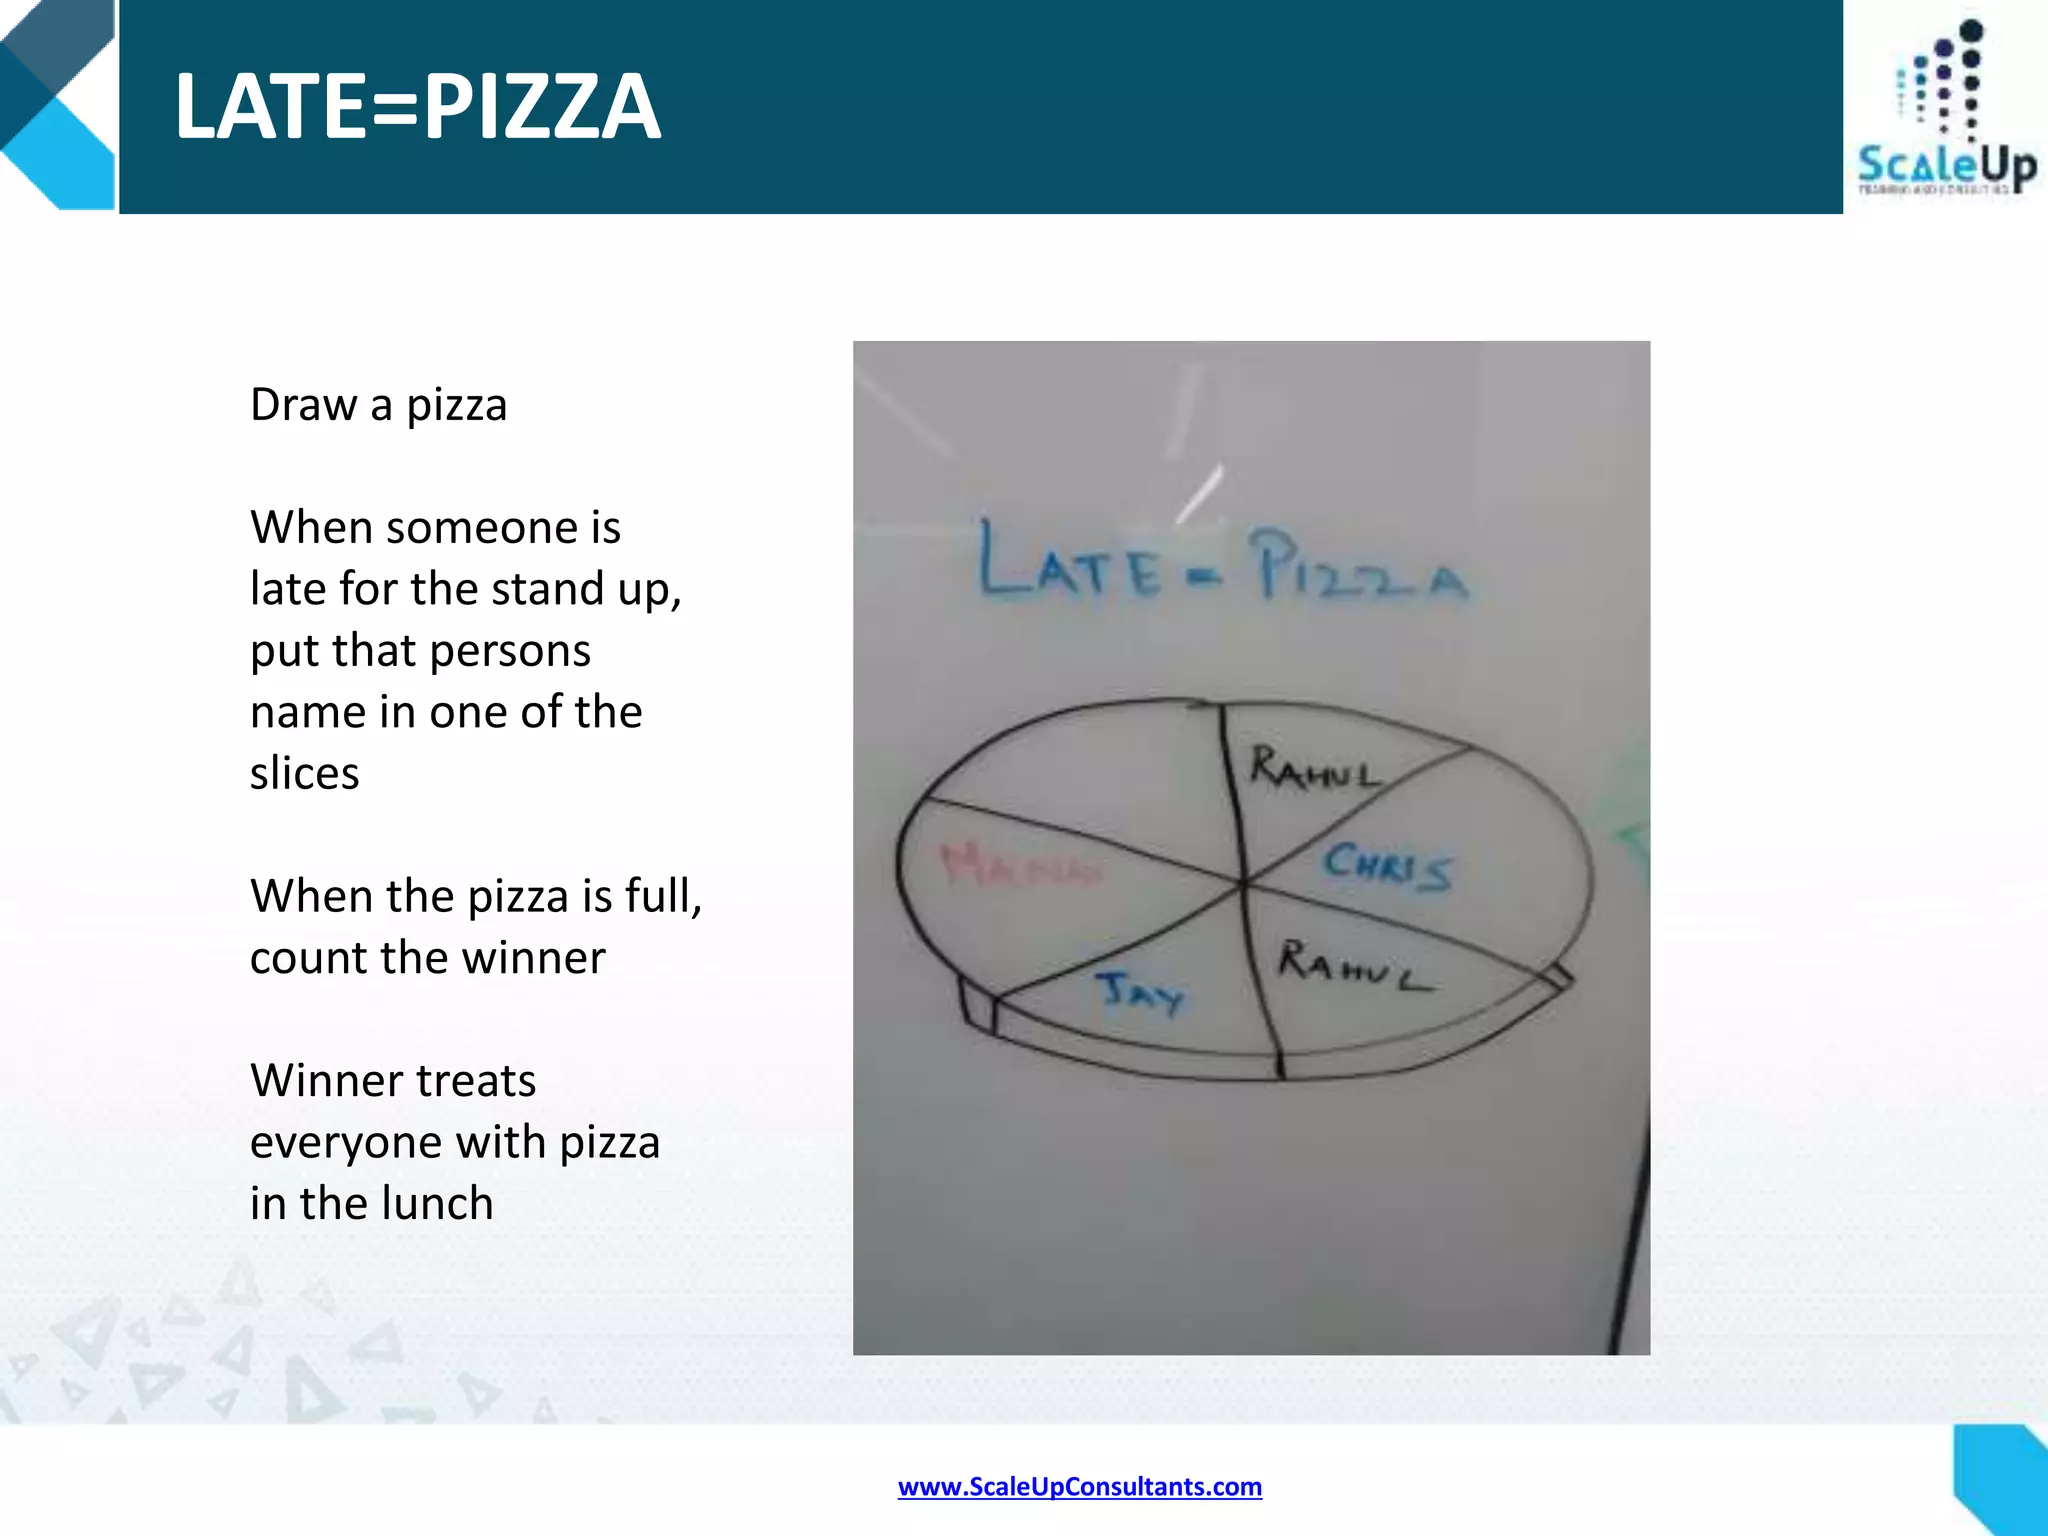
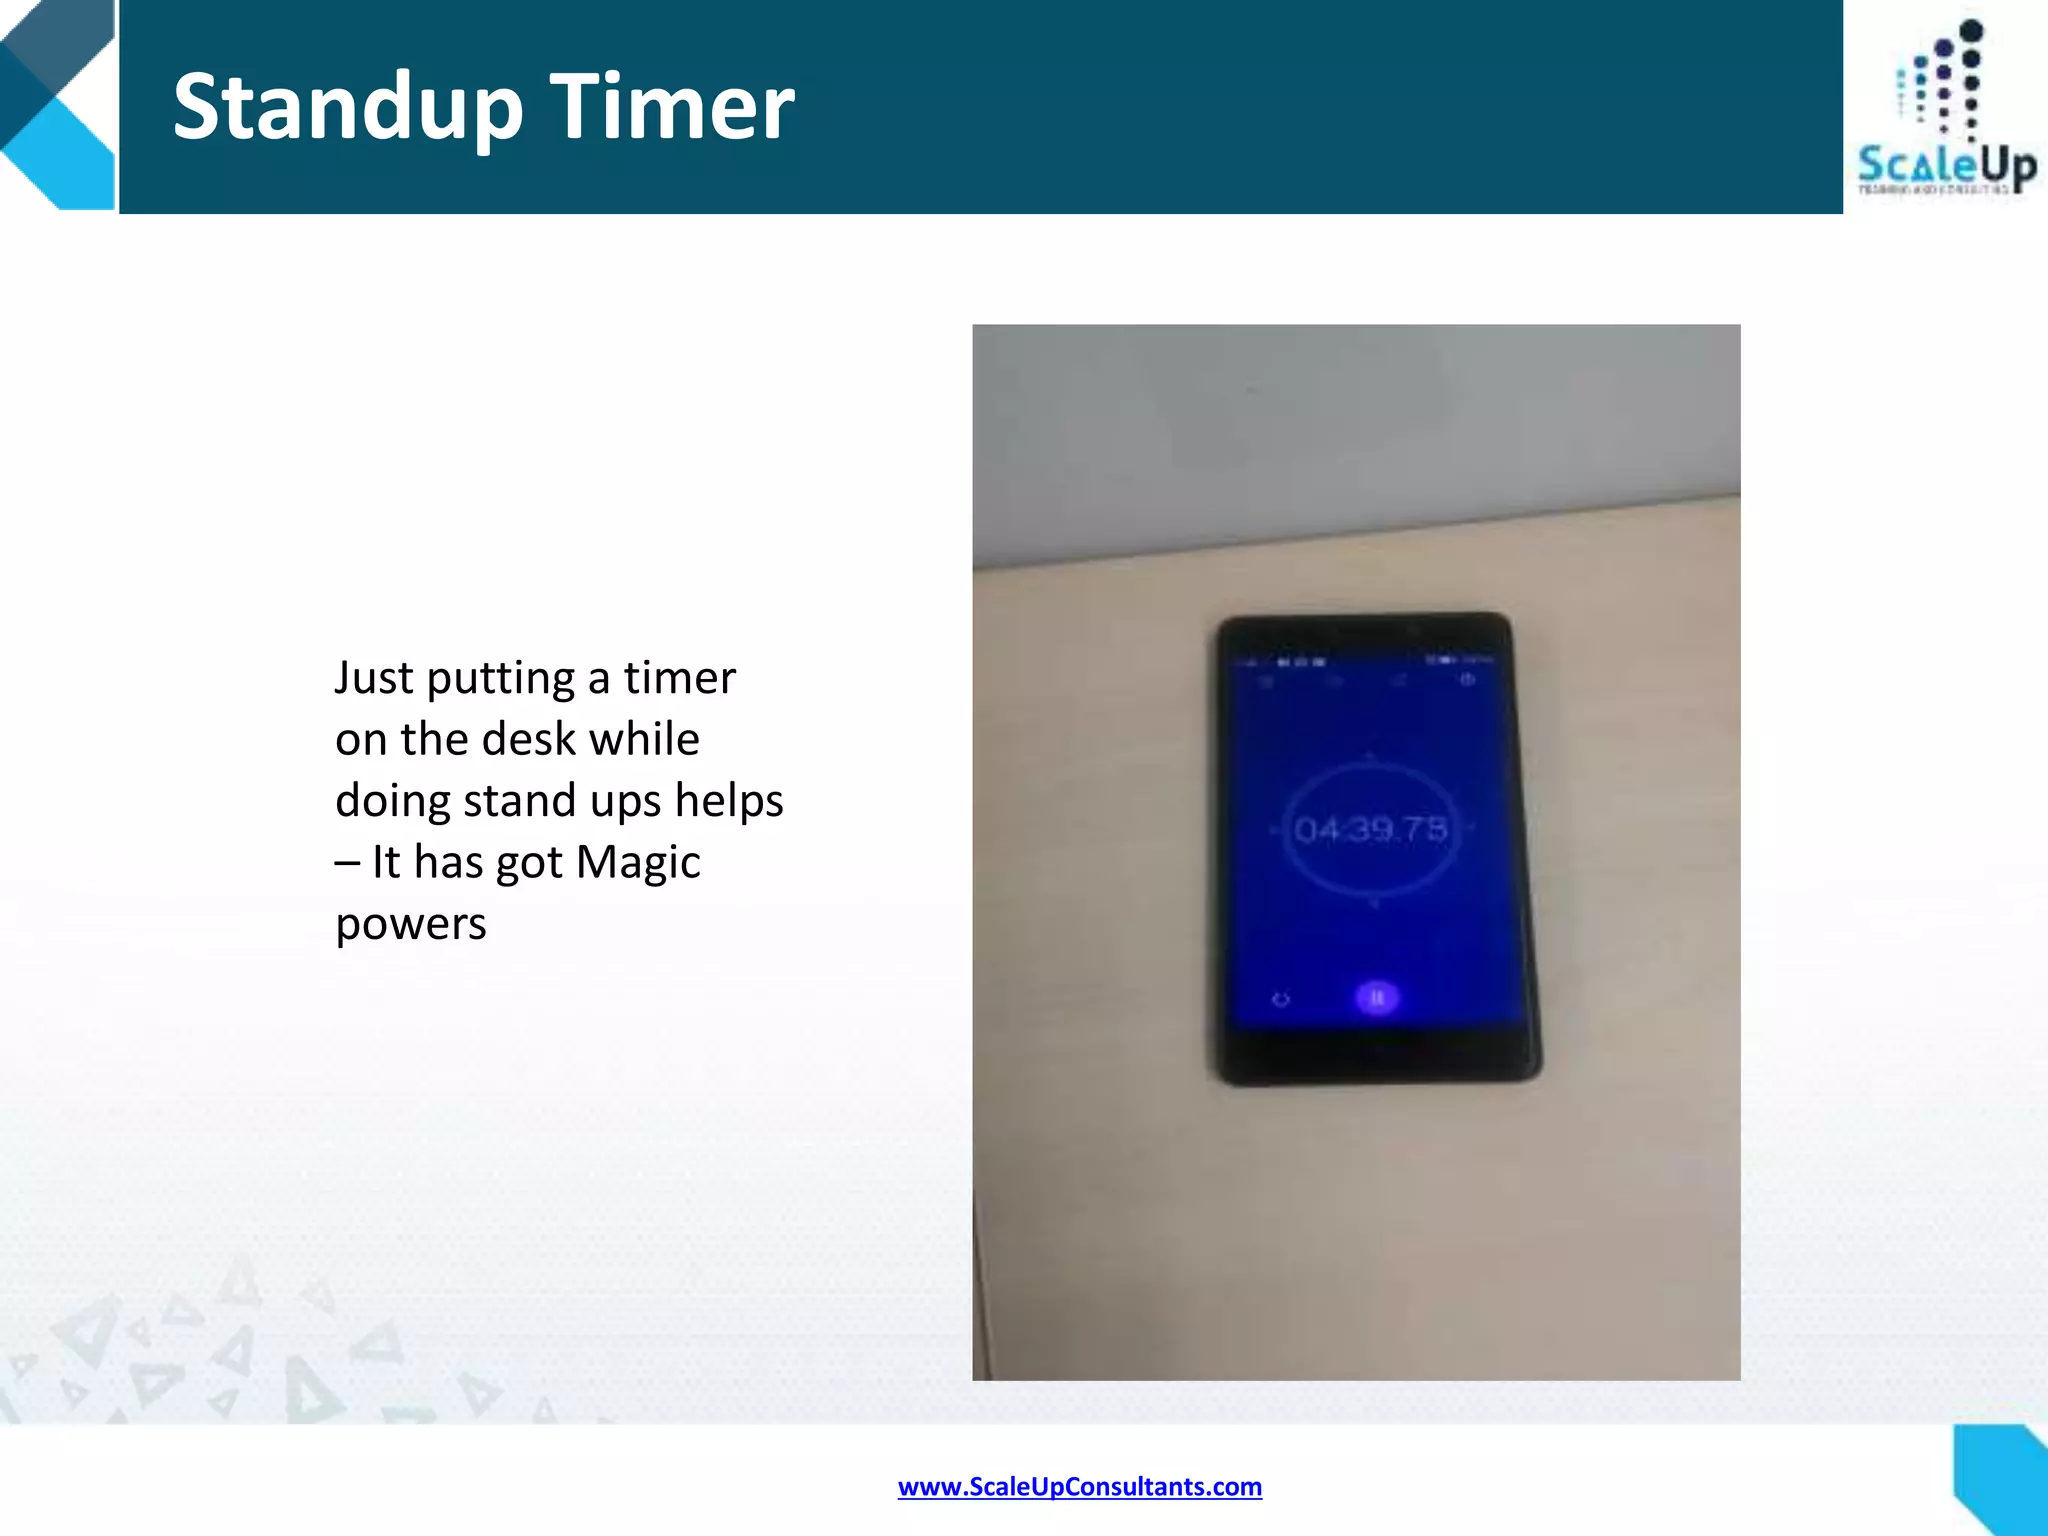
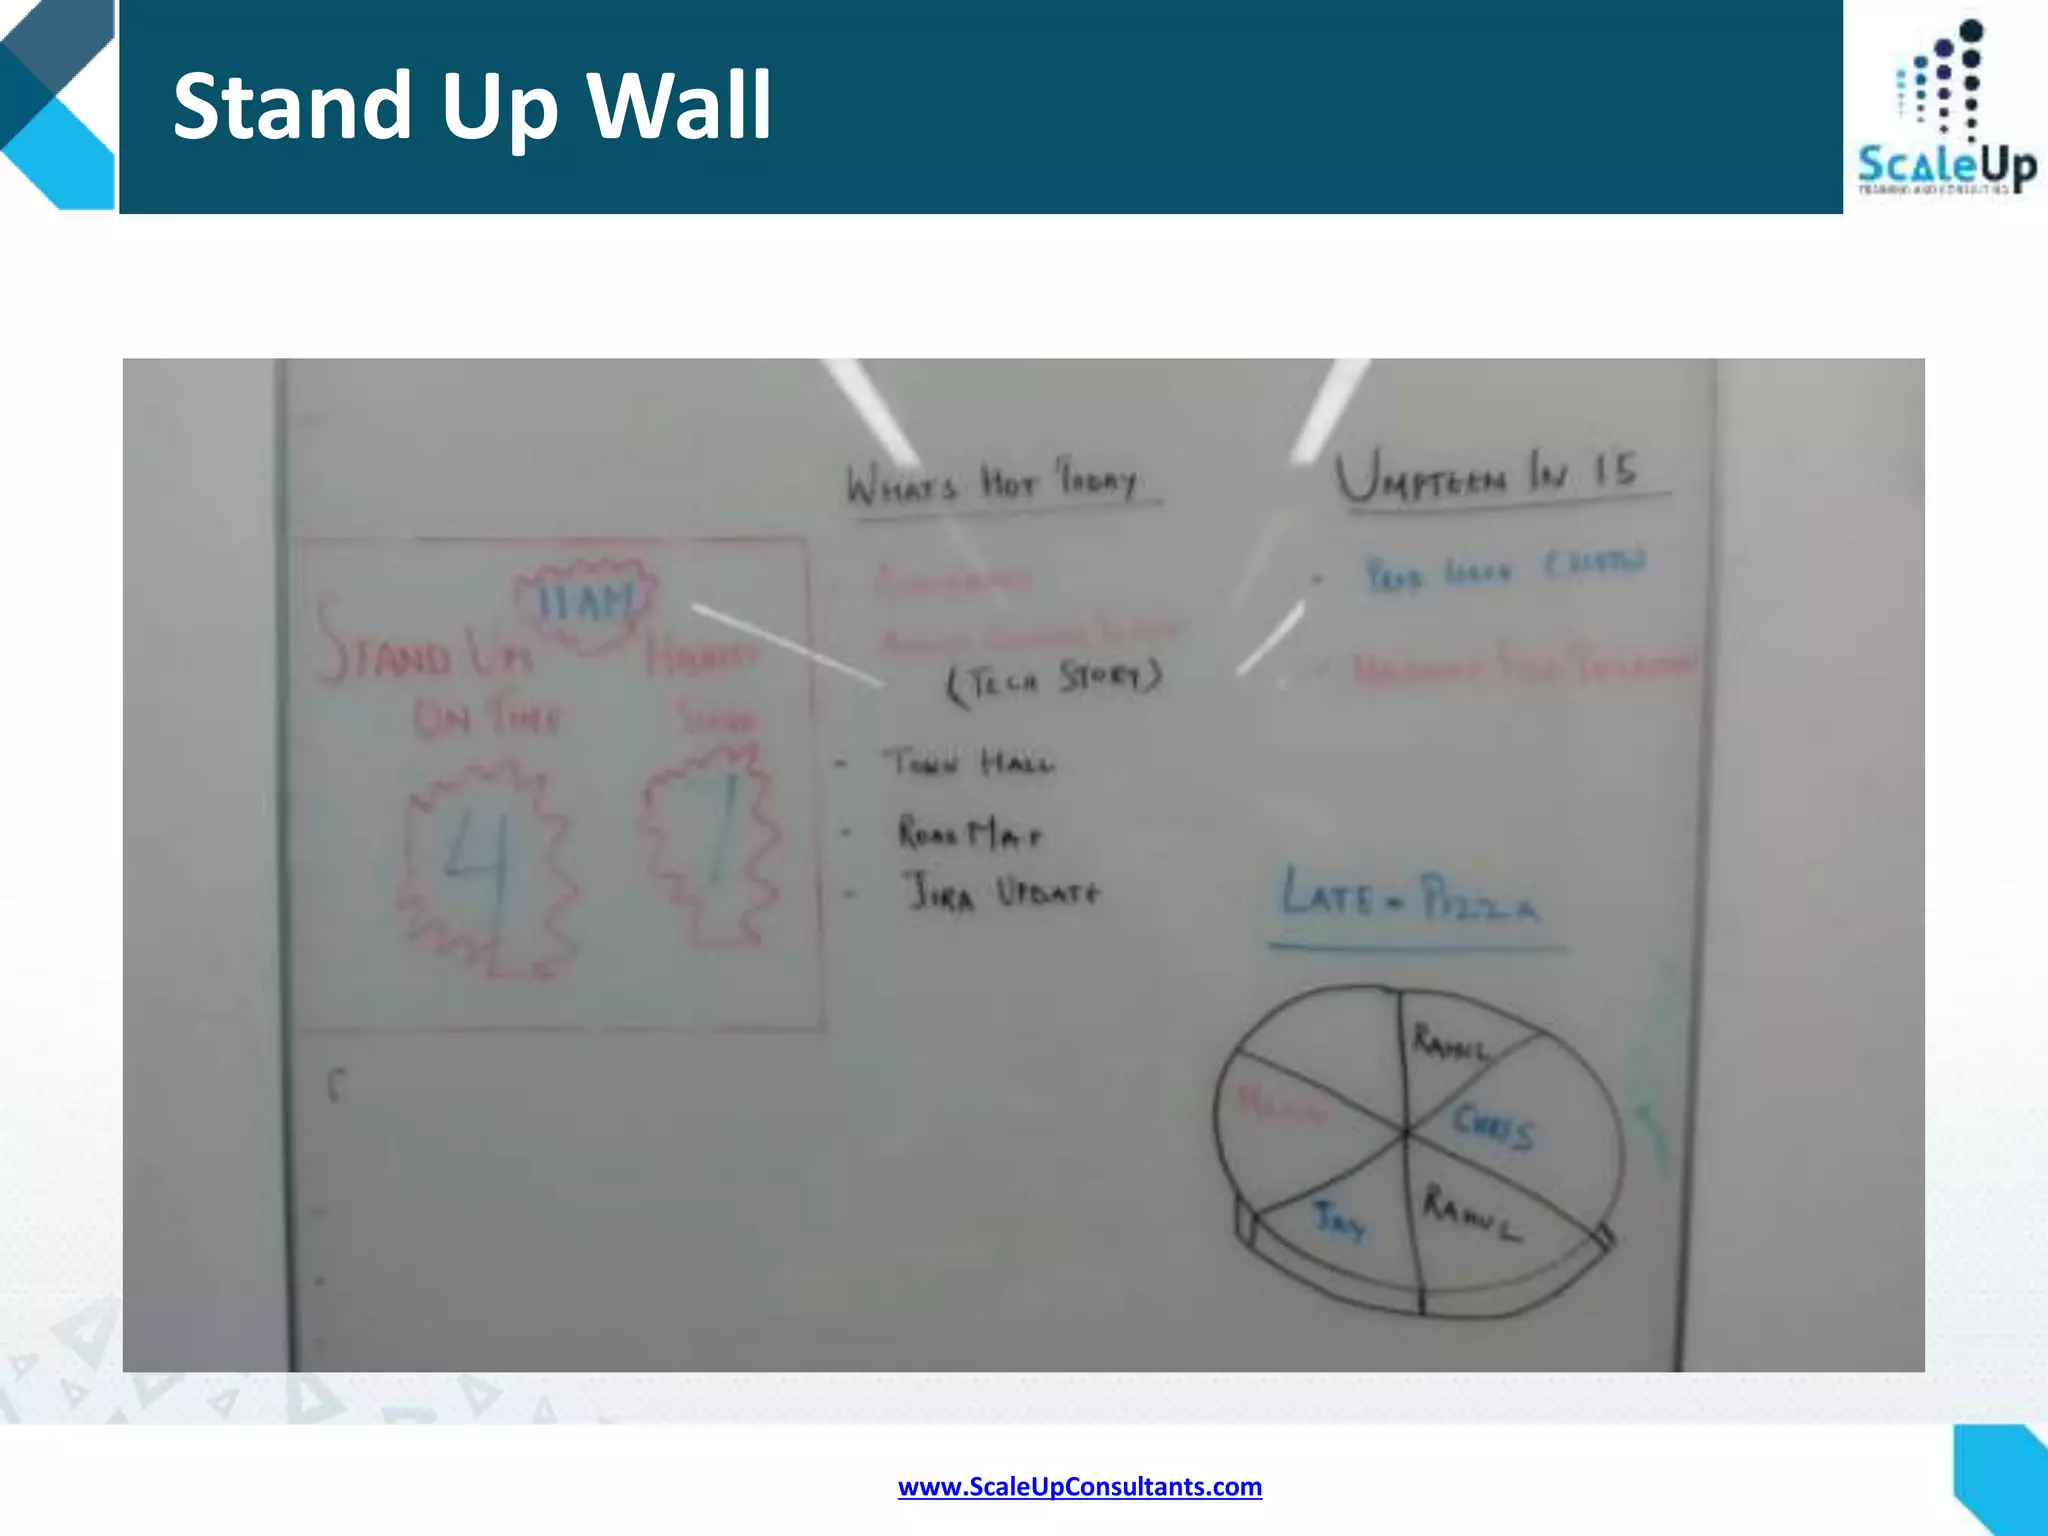
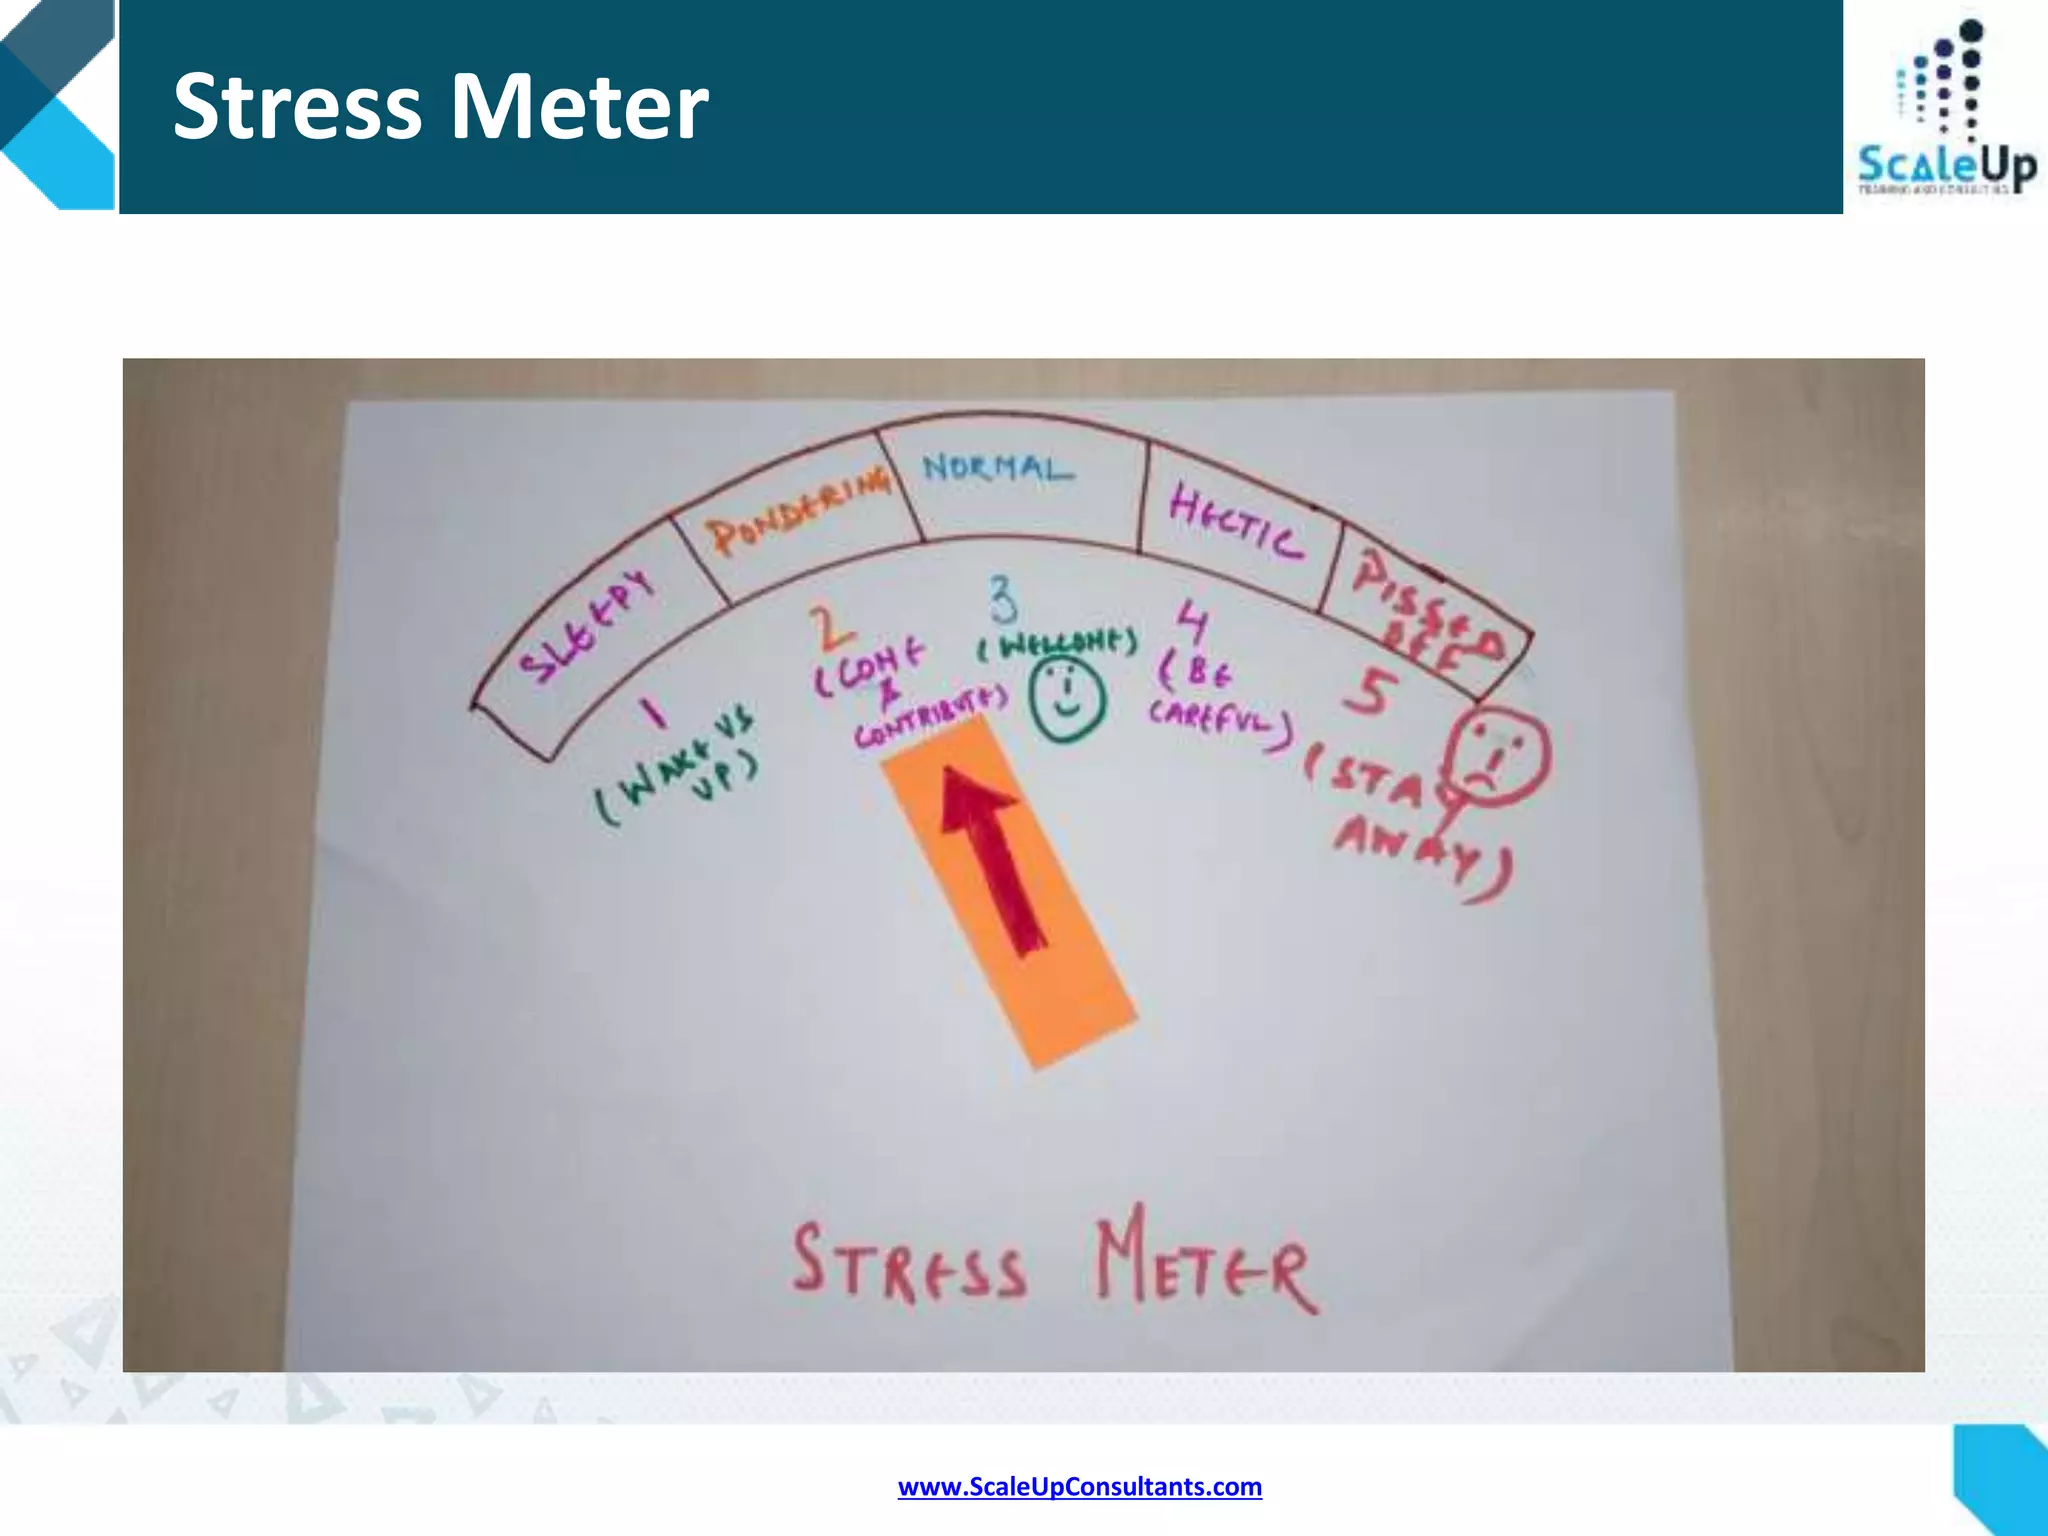
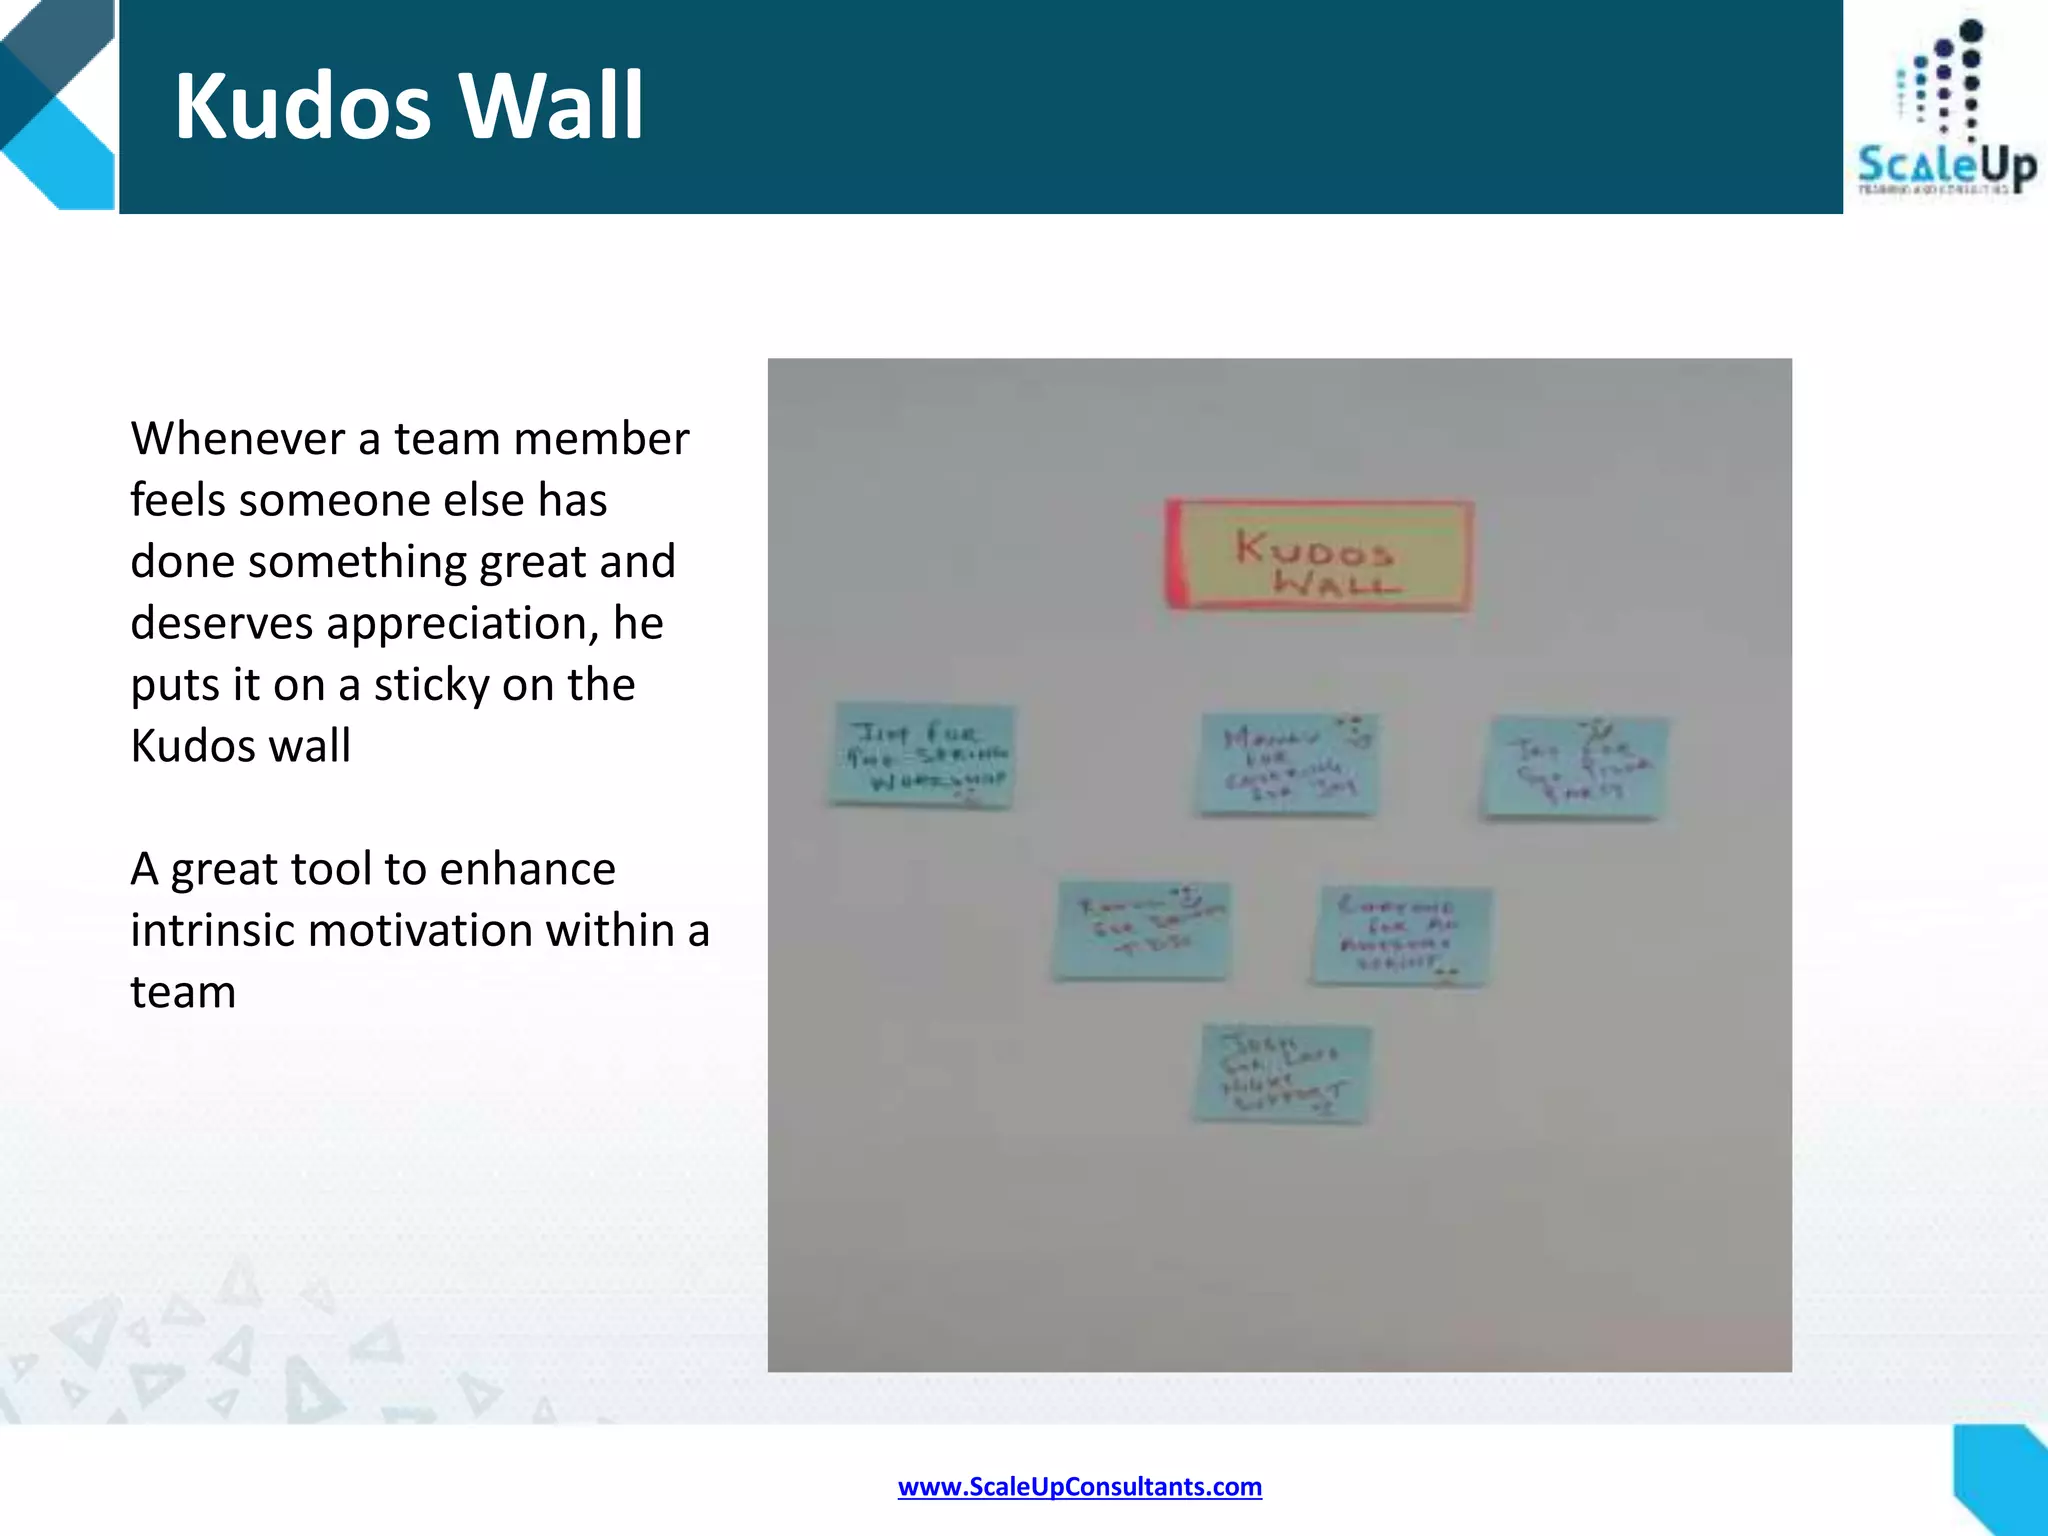
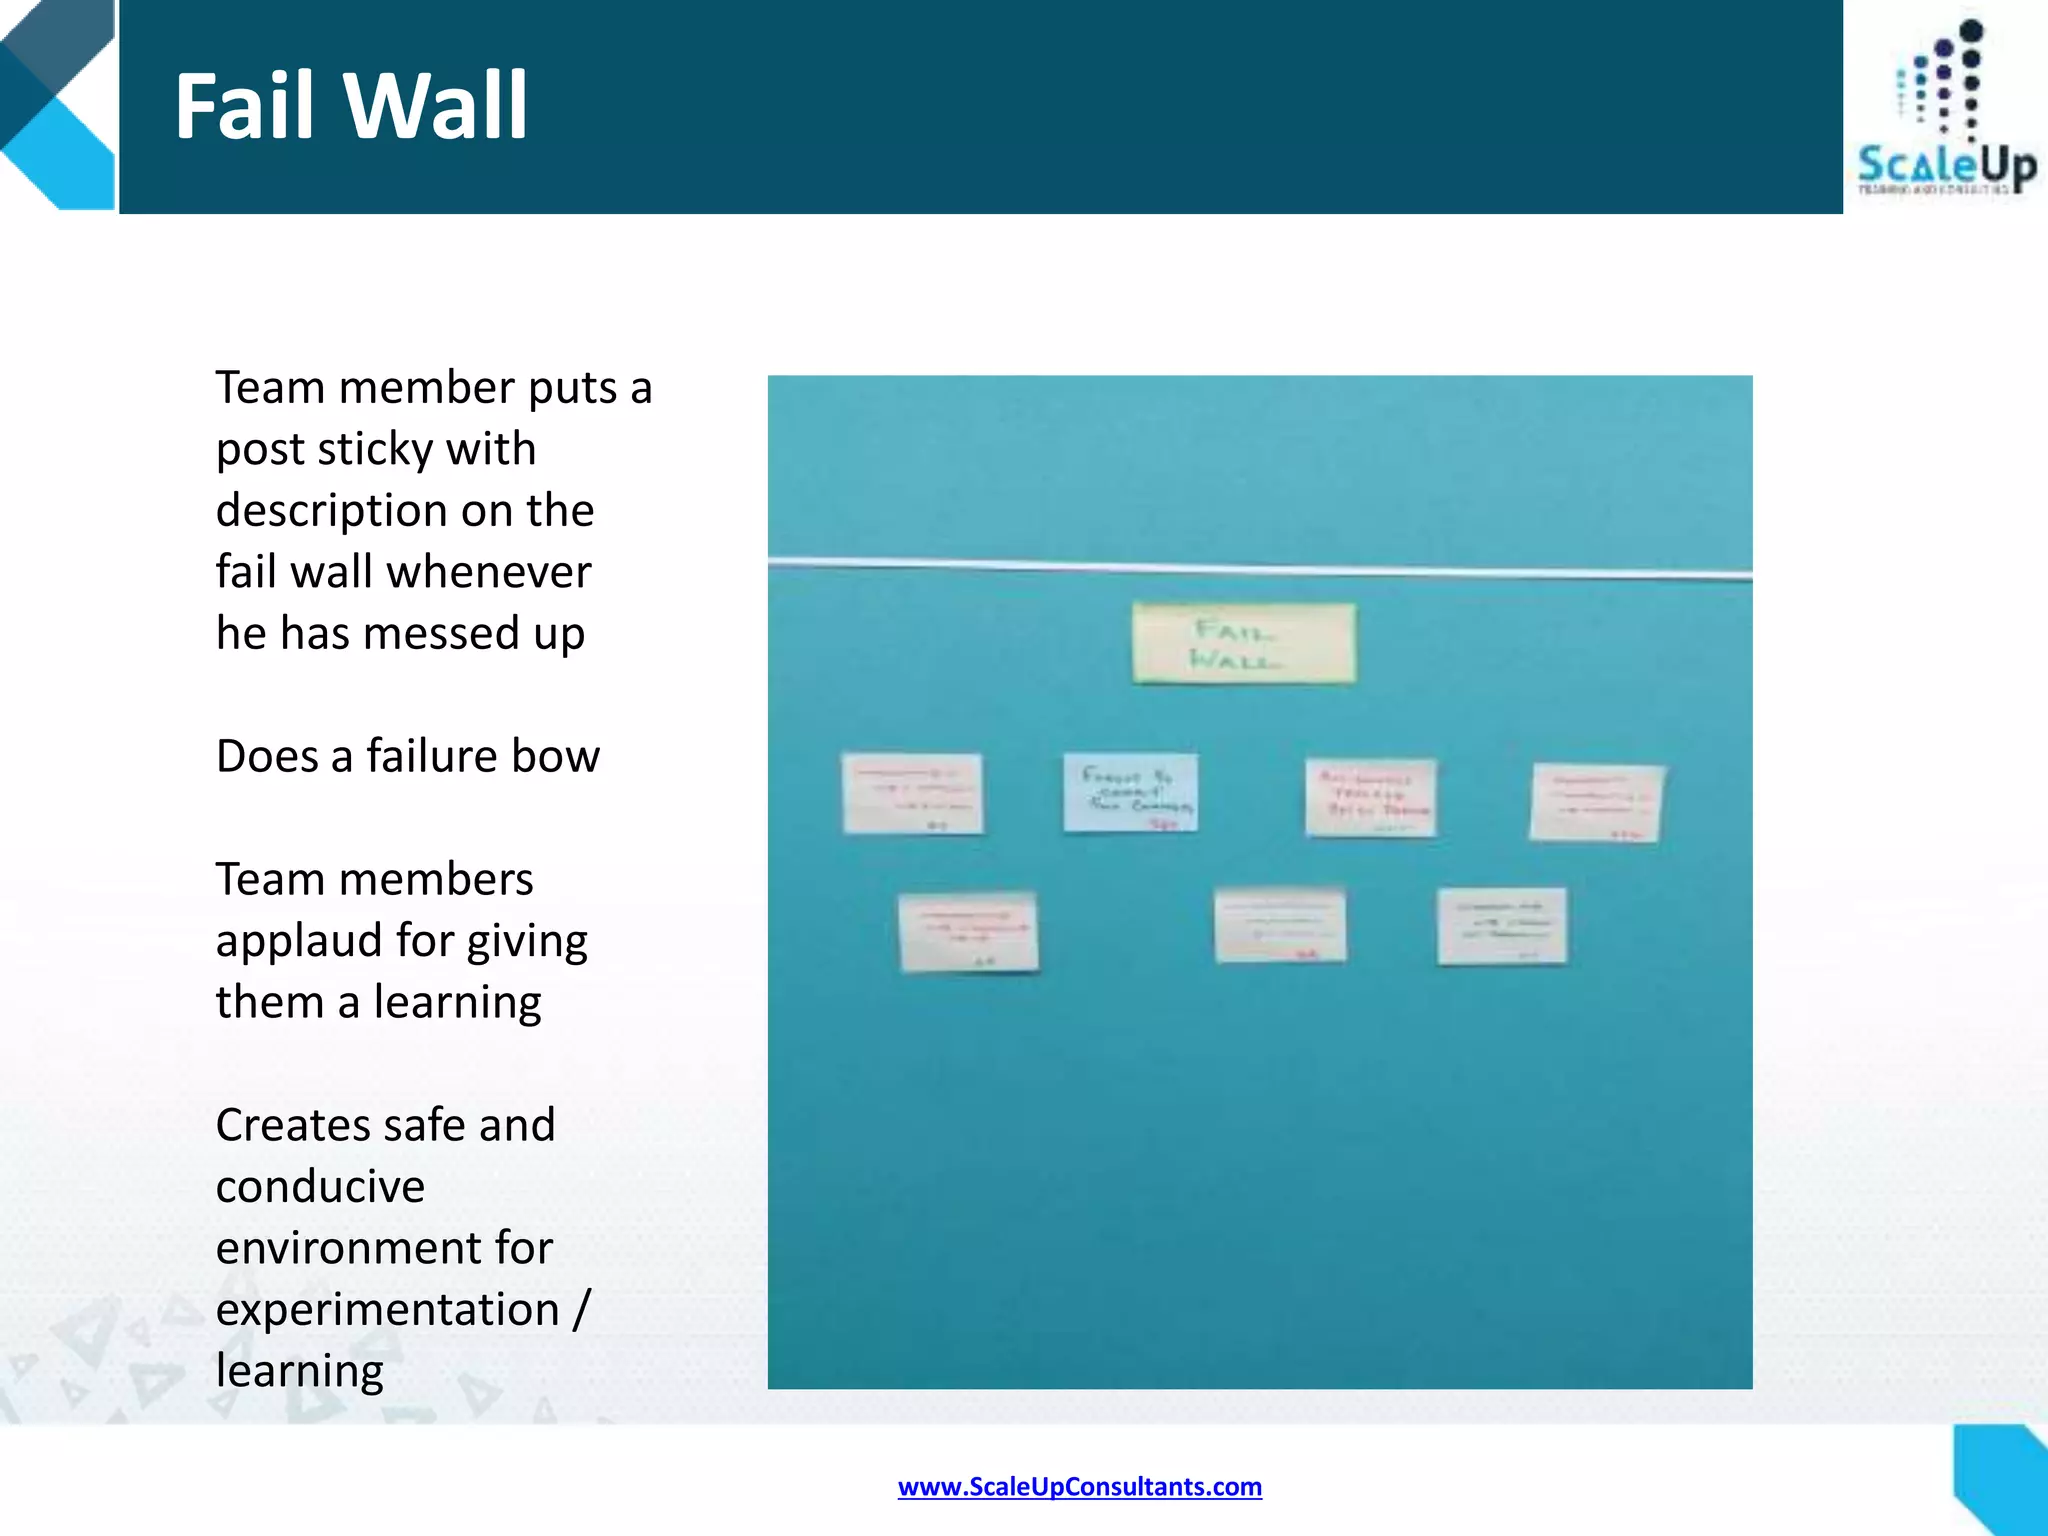
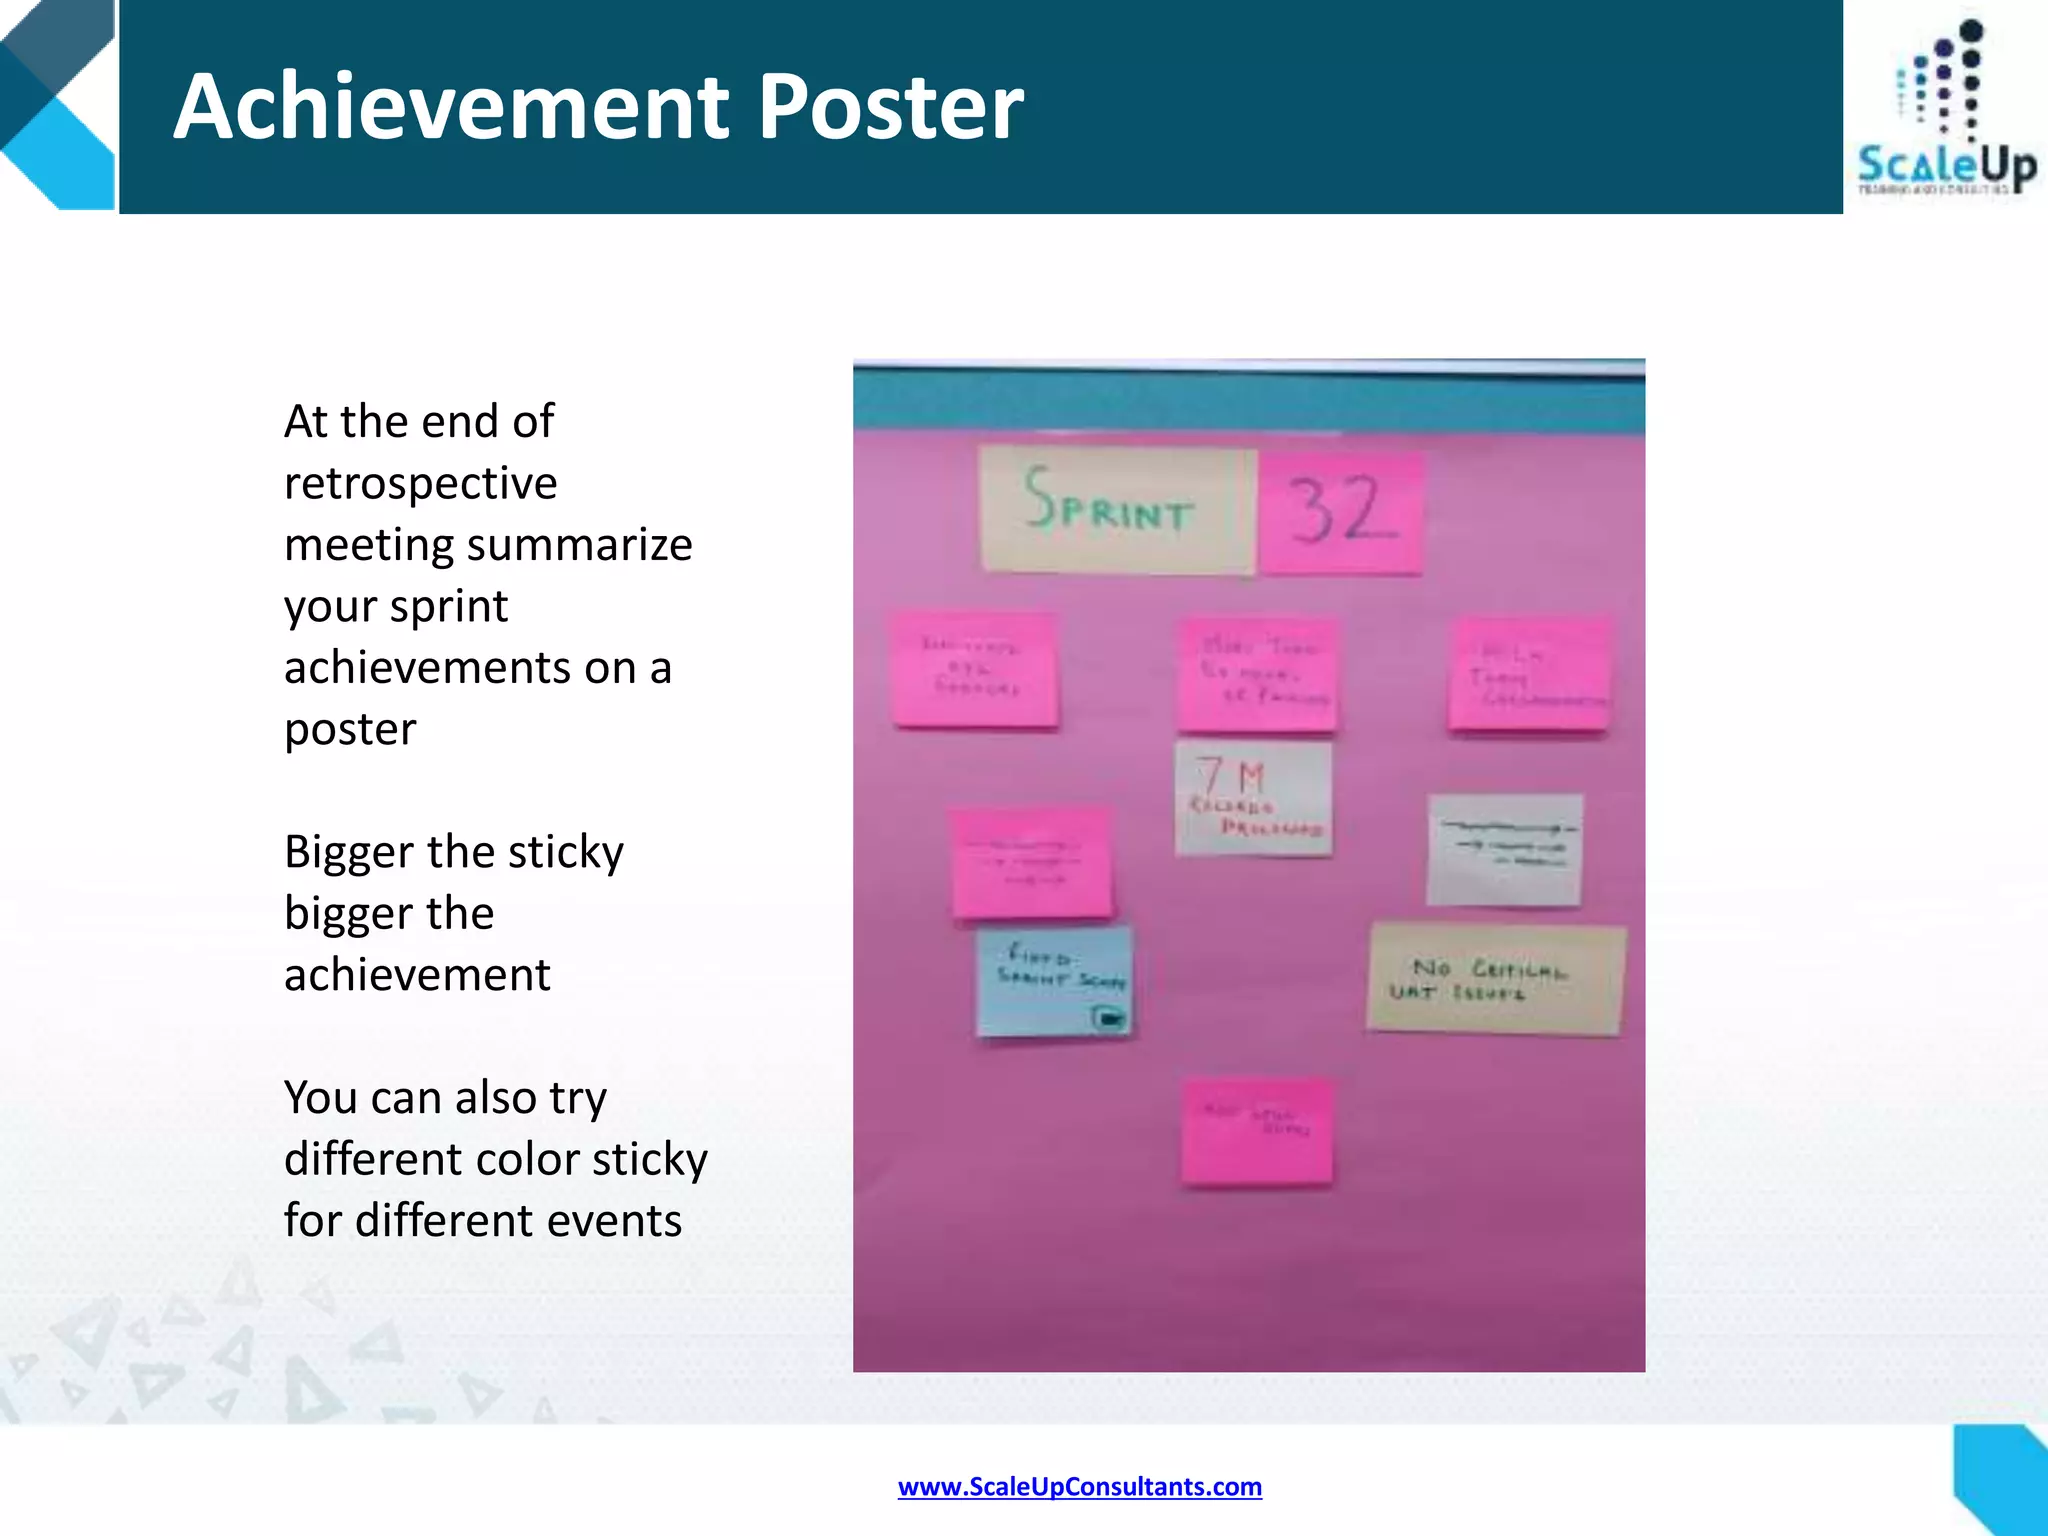
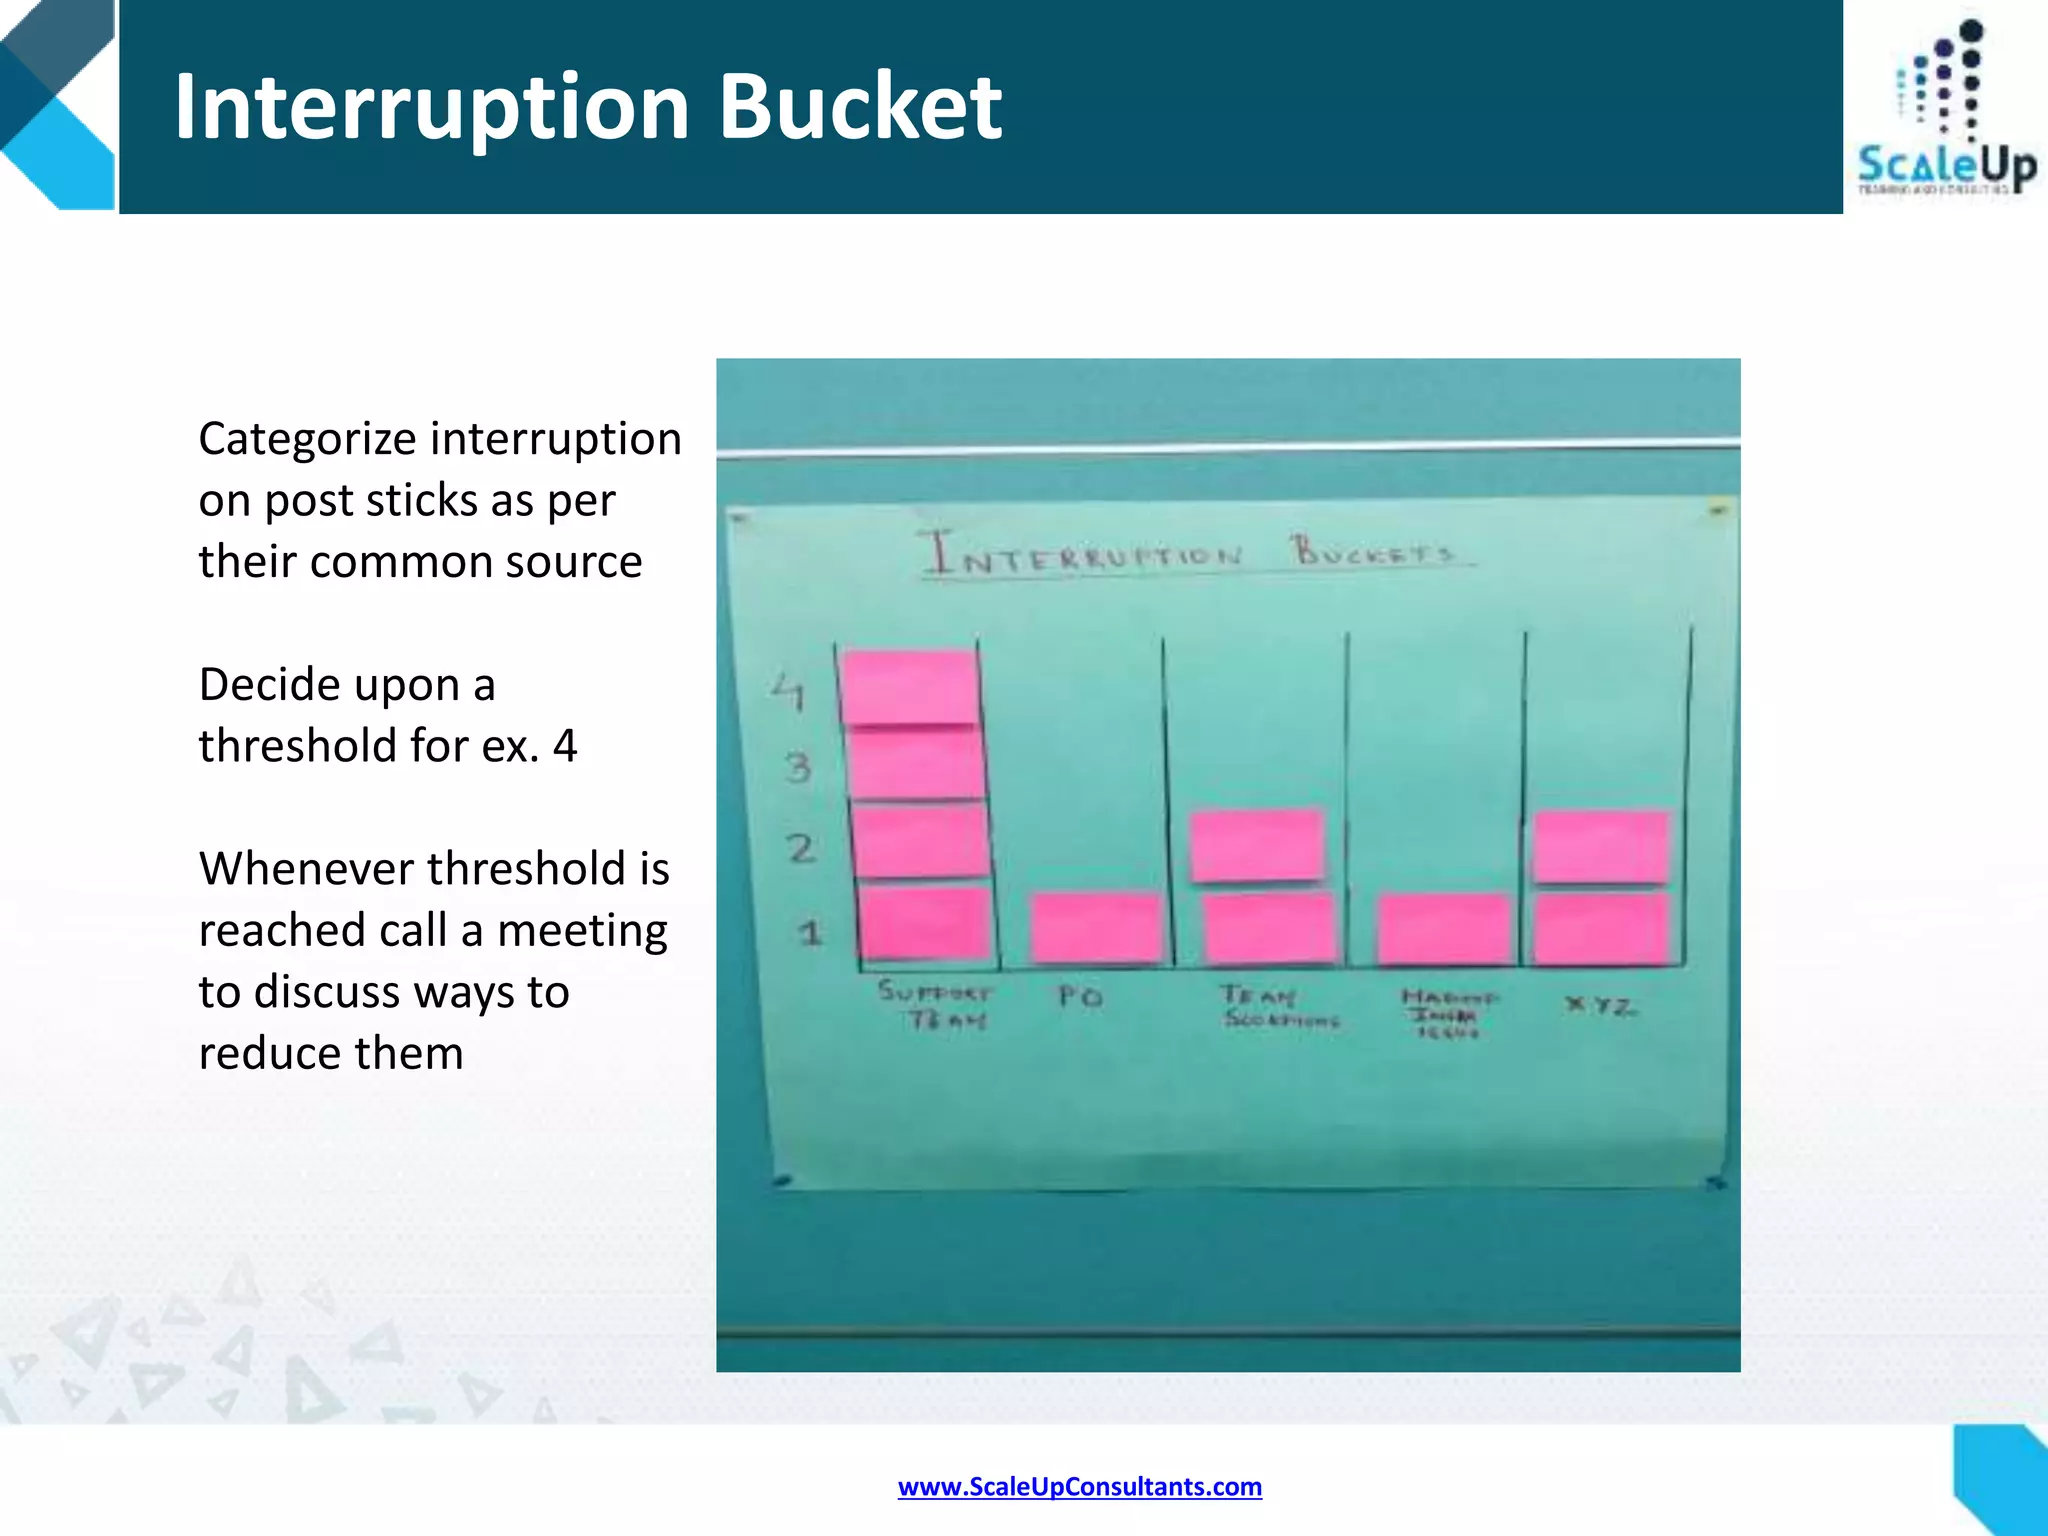
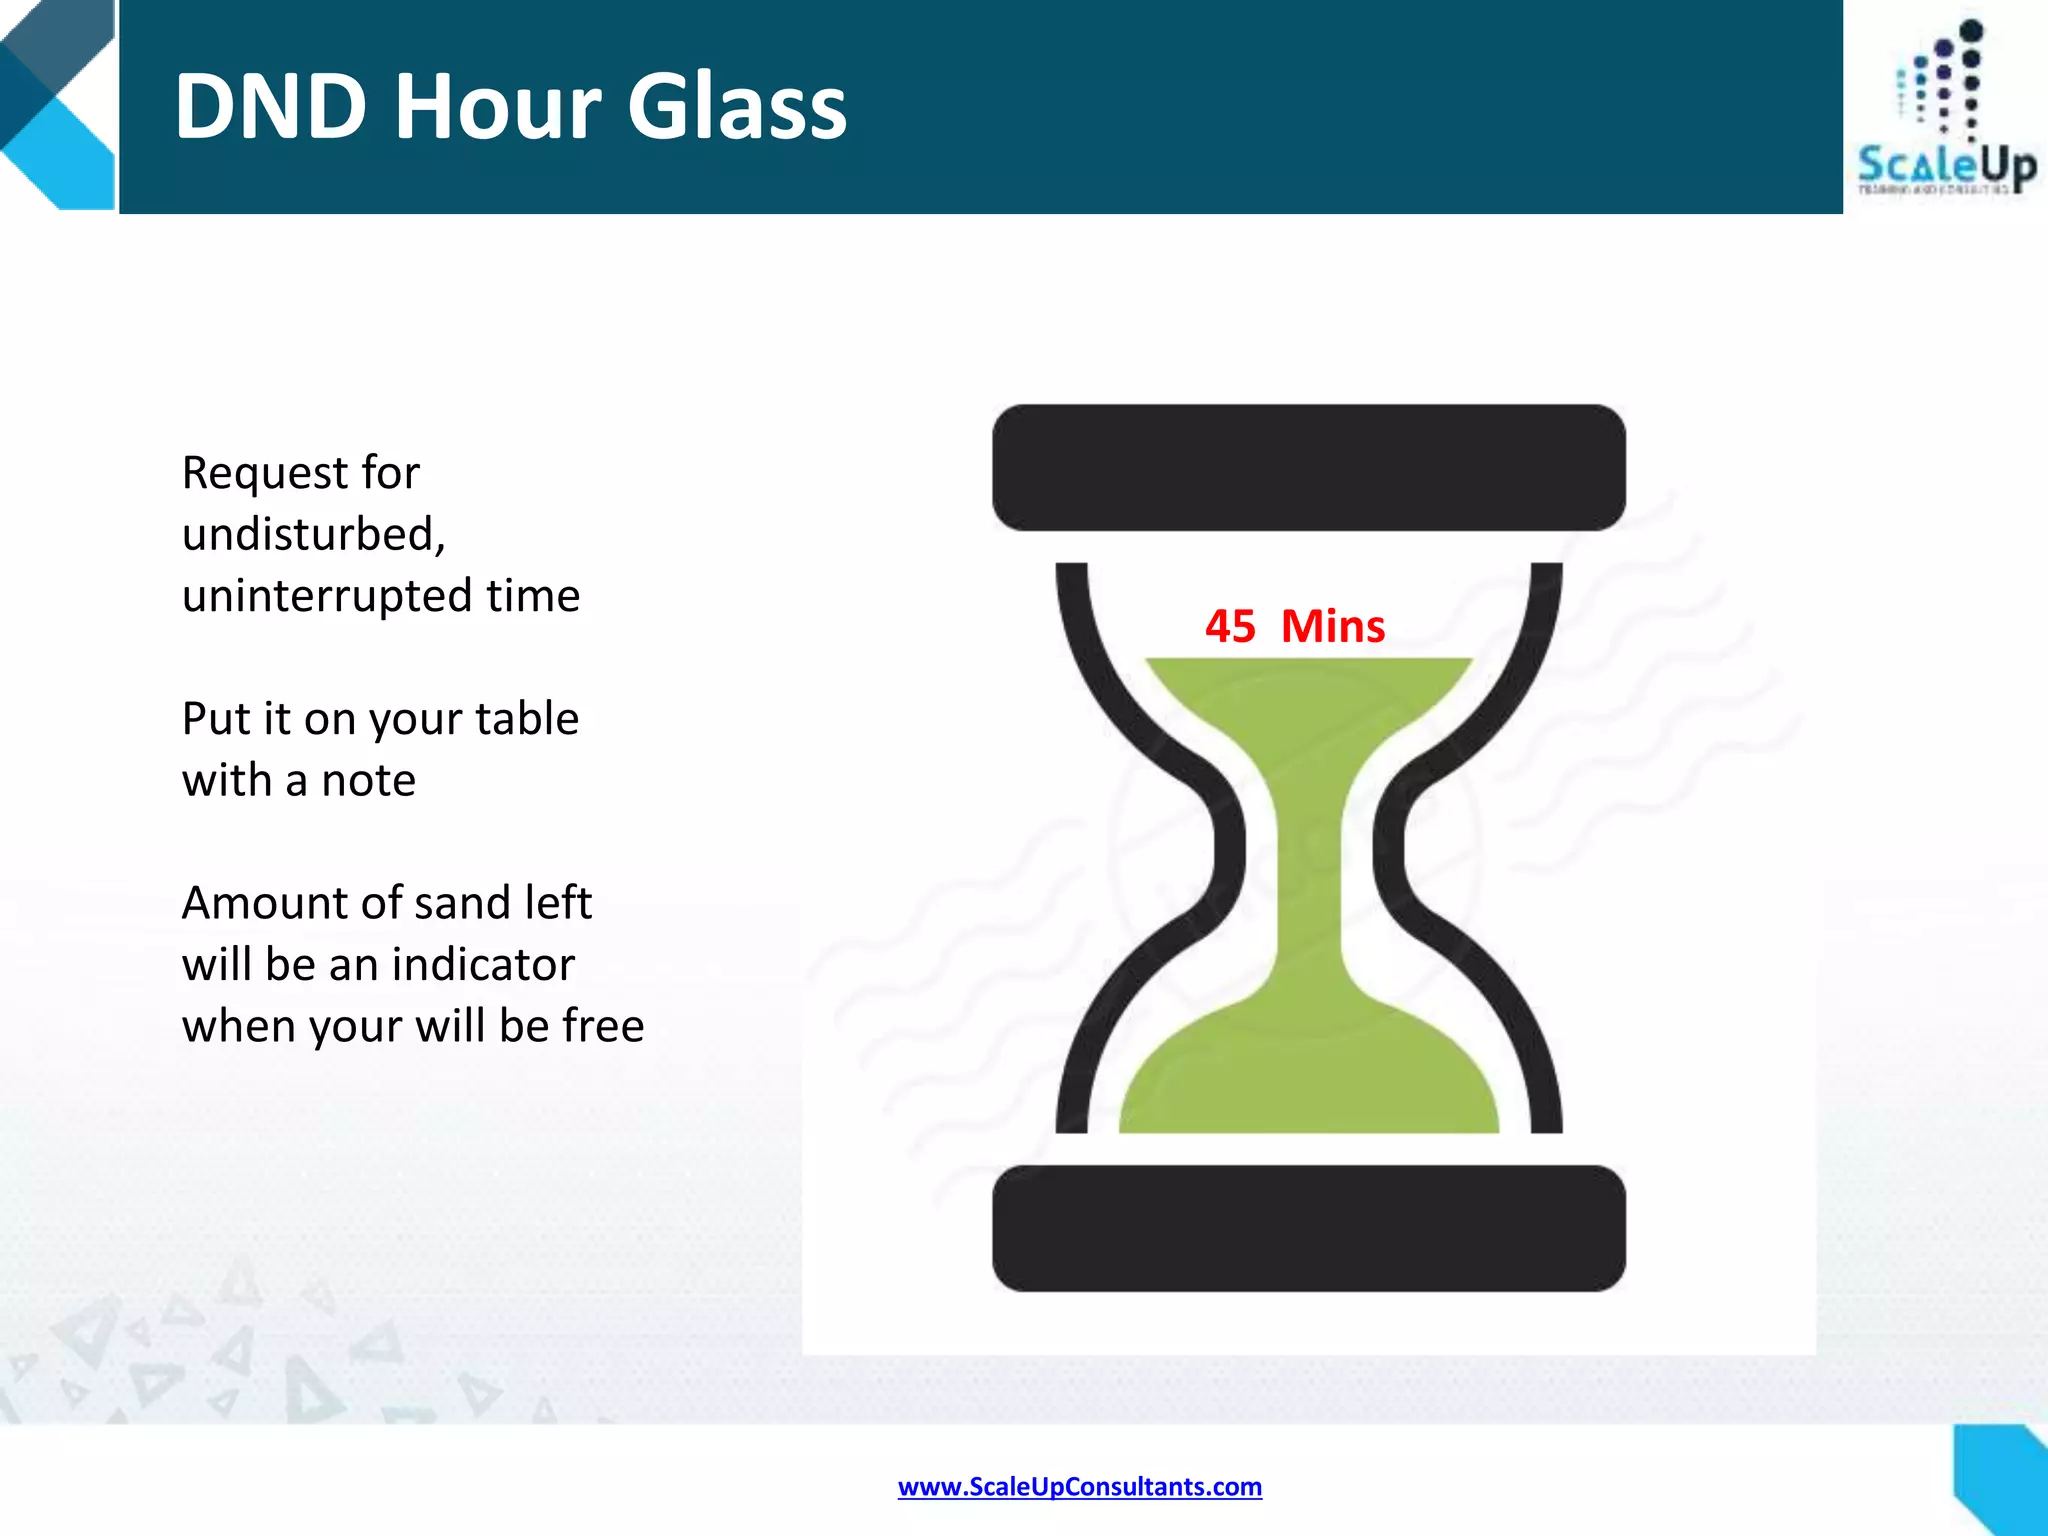
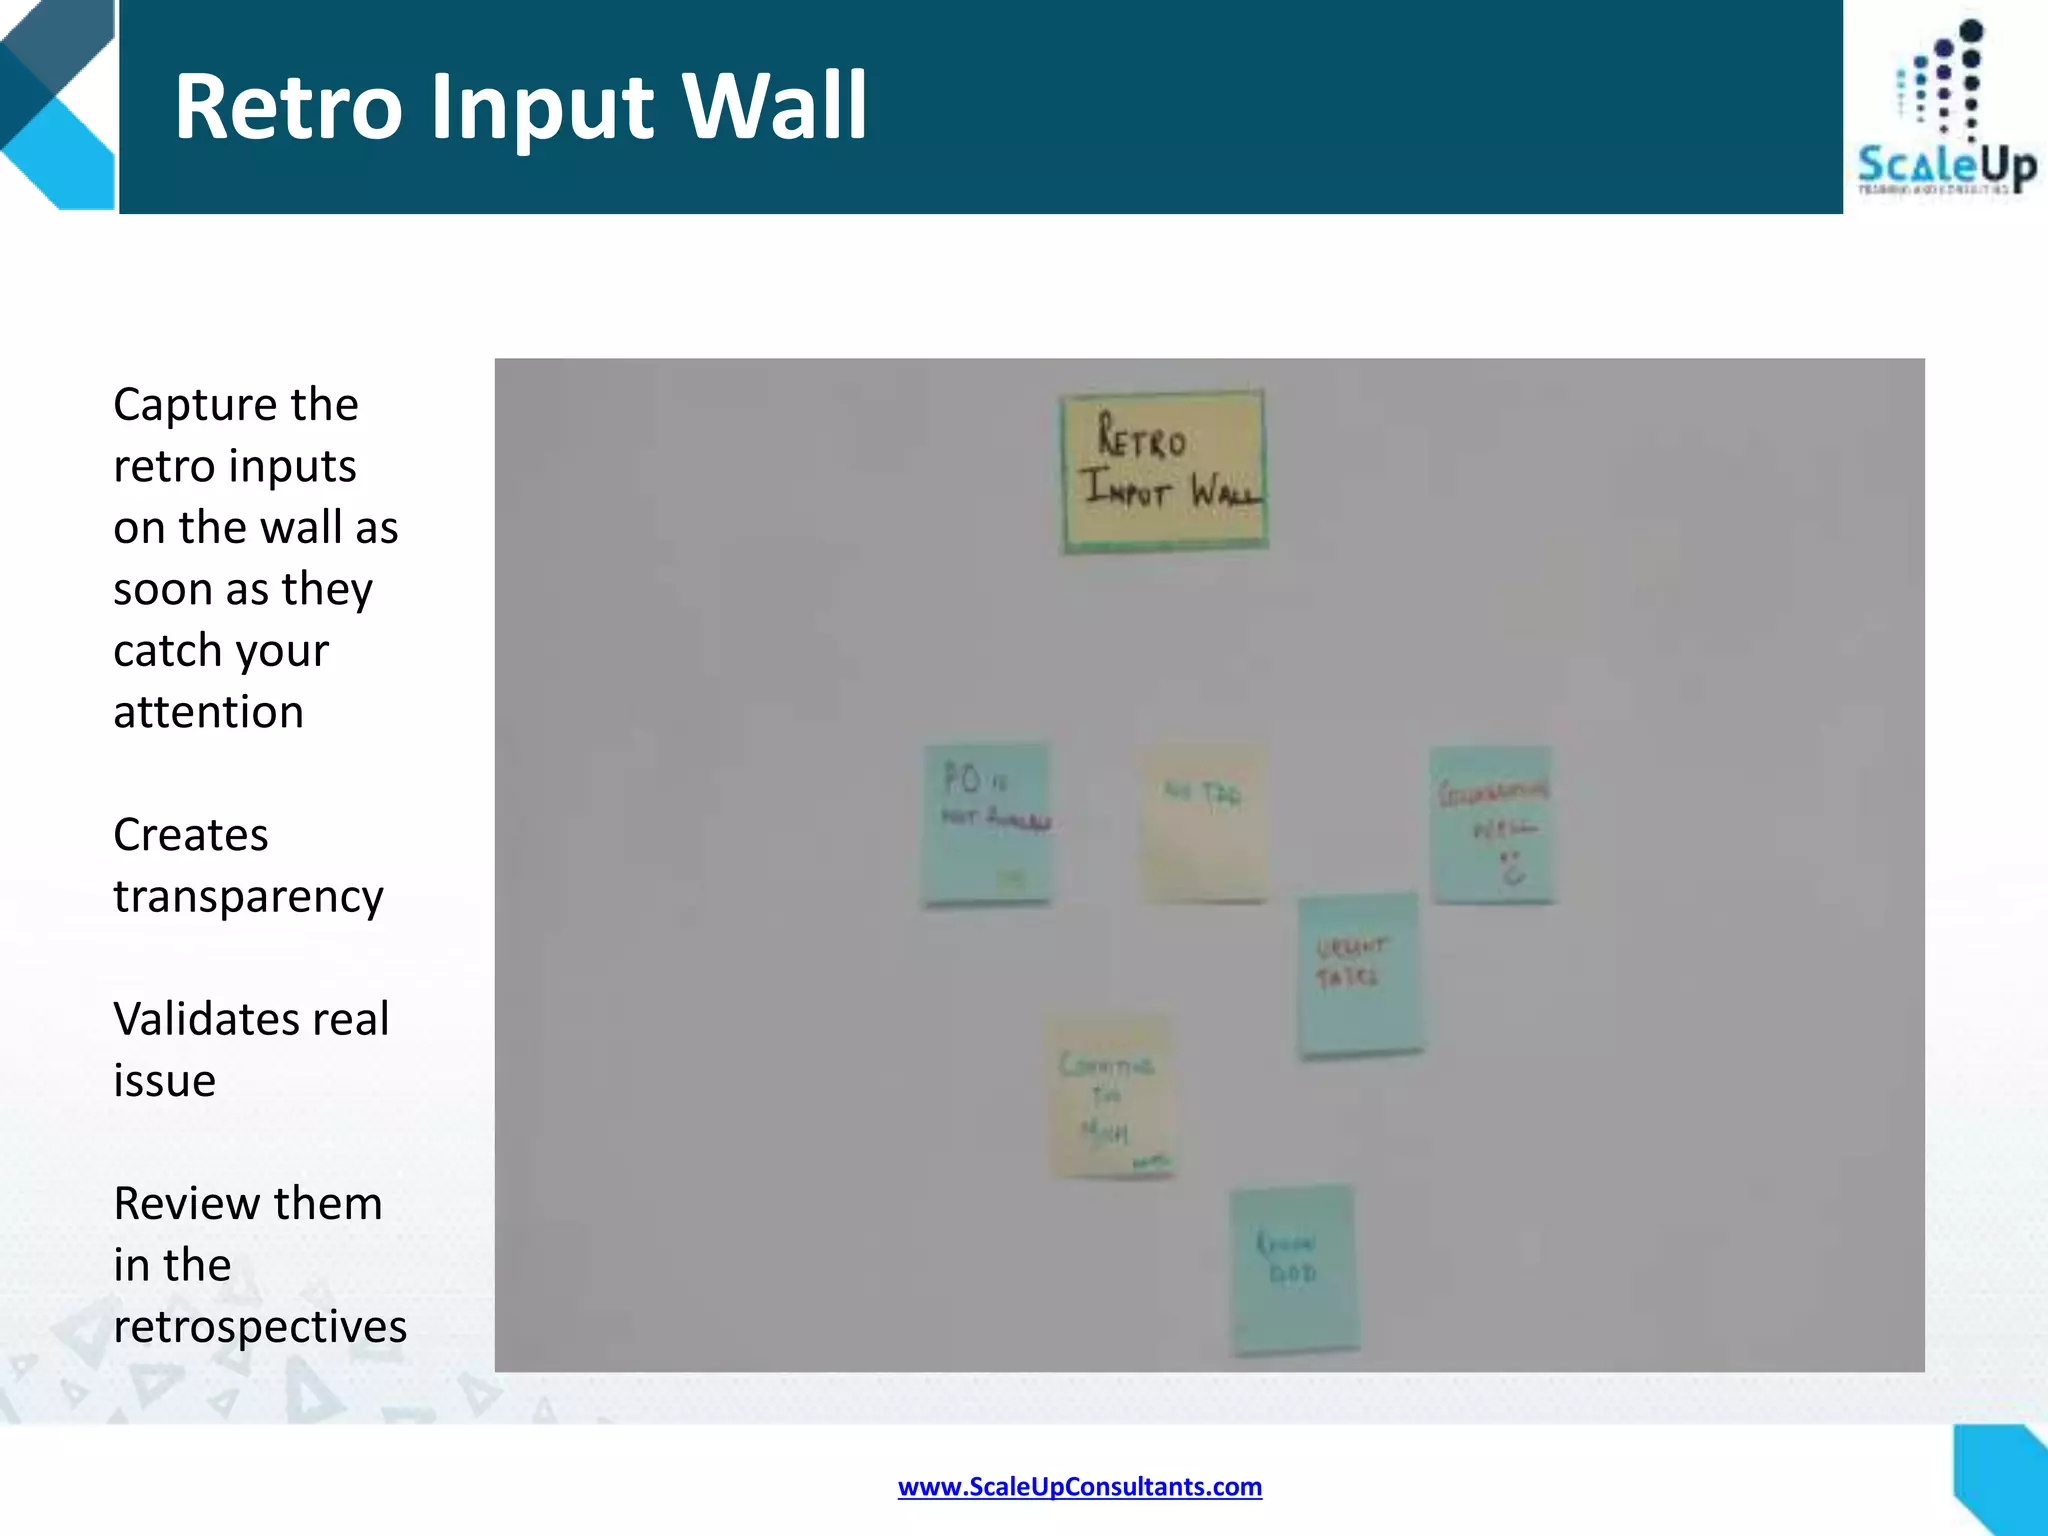
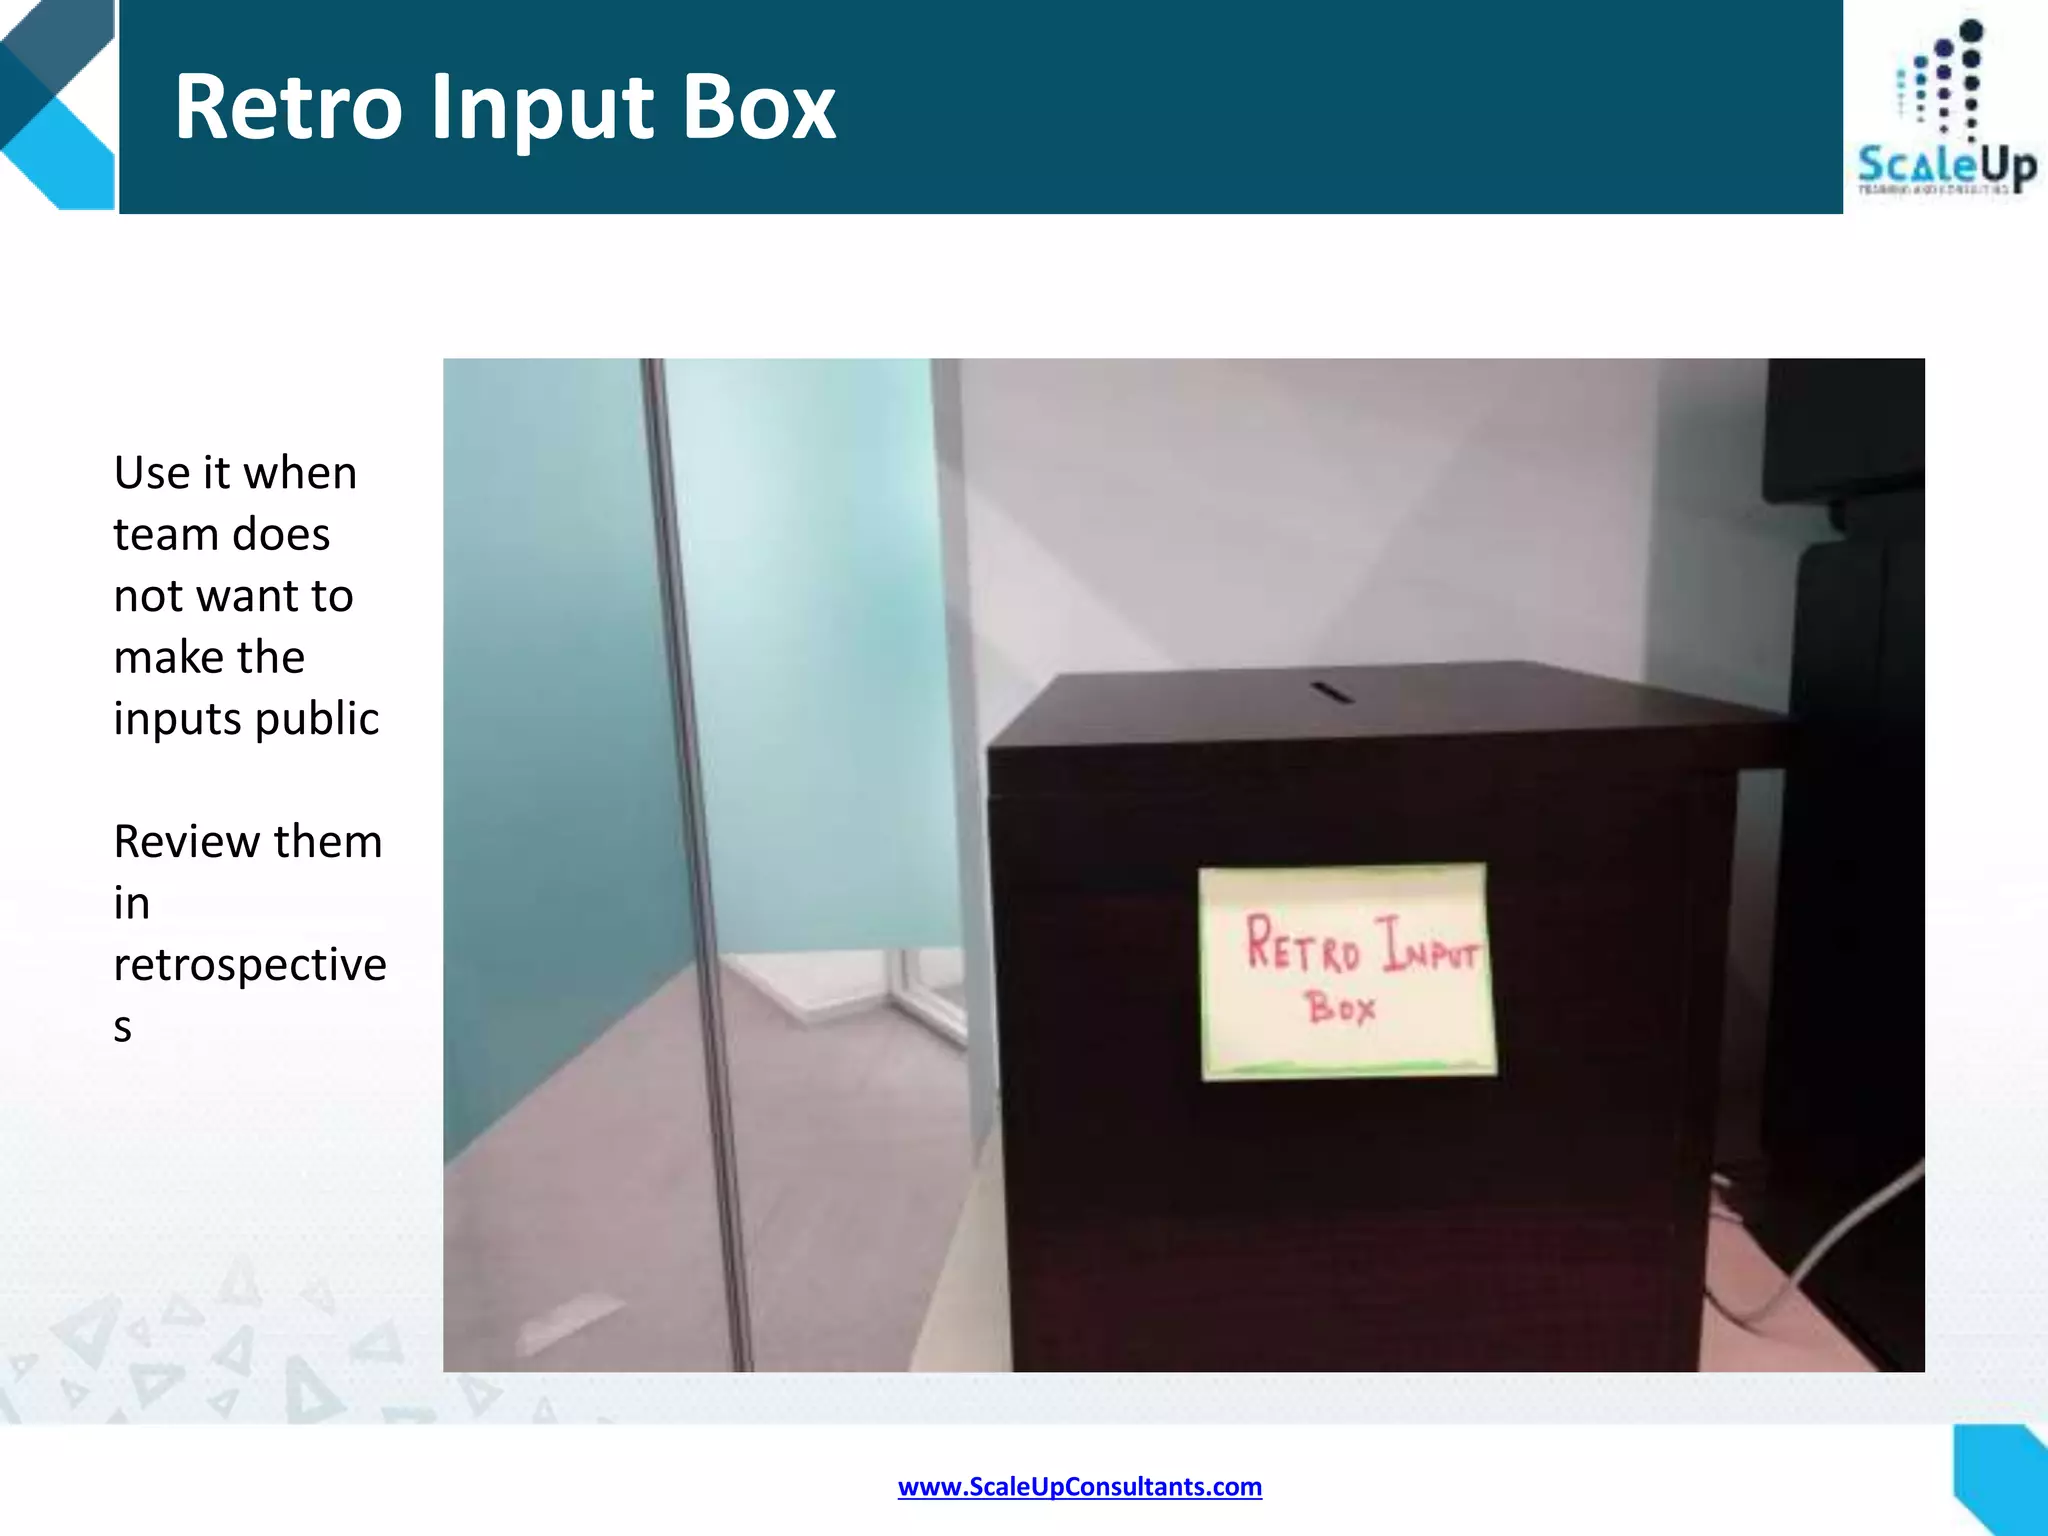
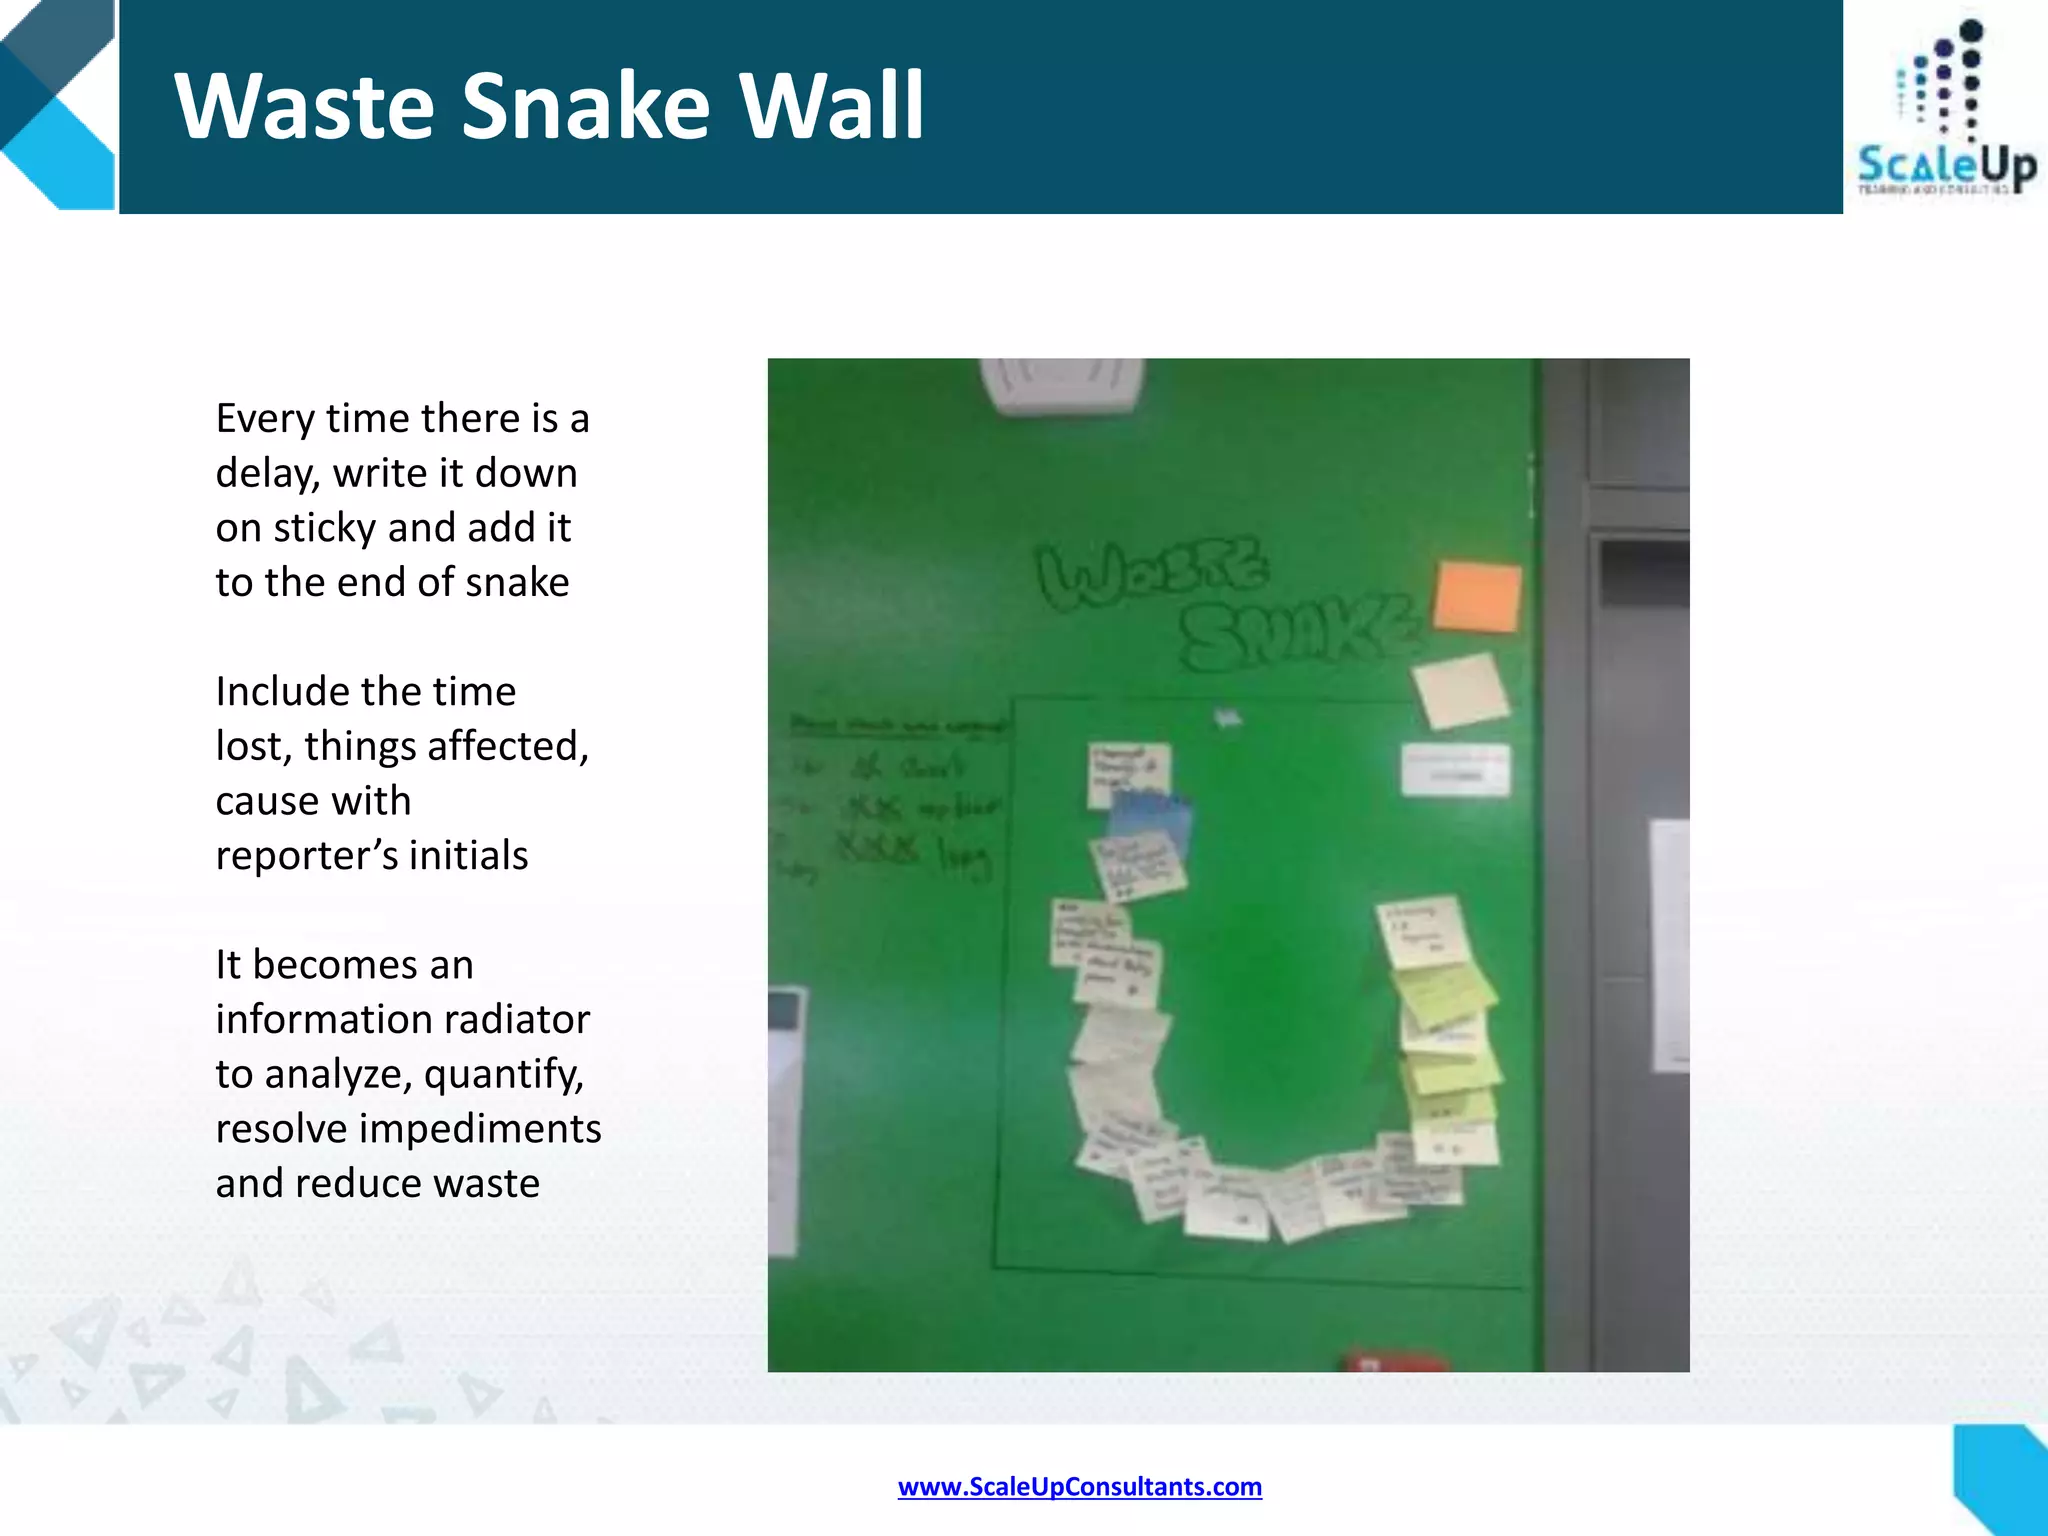
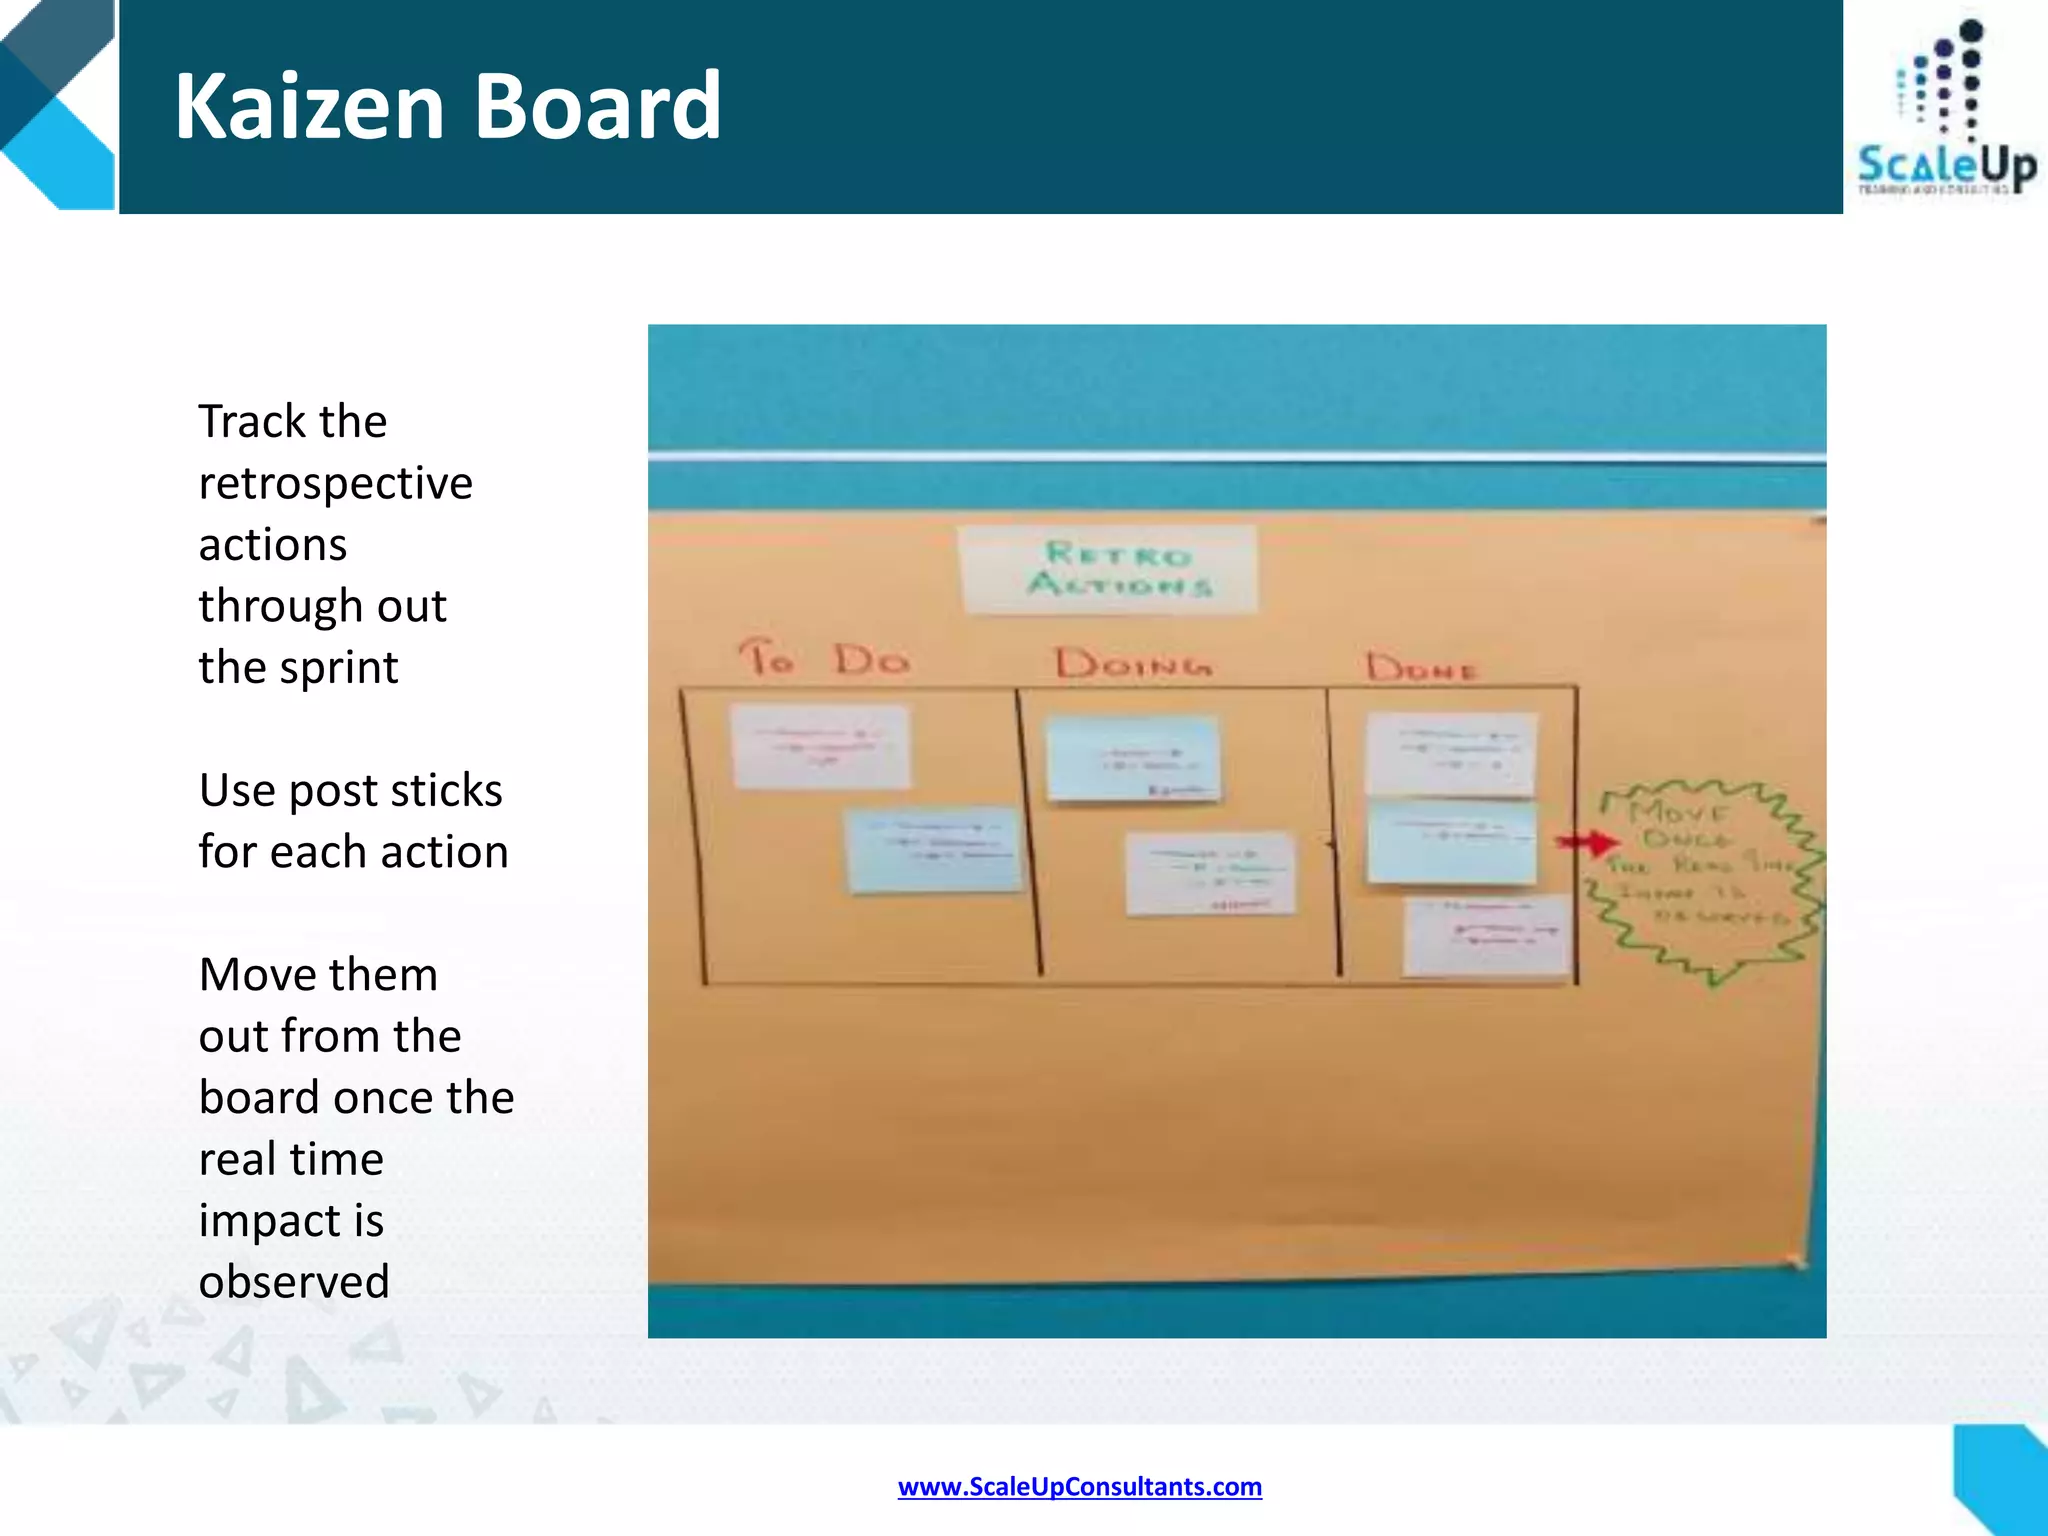
Various creative visualization techniques and tools like achievement posters, stress meters, and kaizen boards.
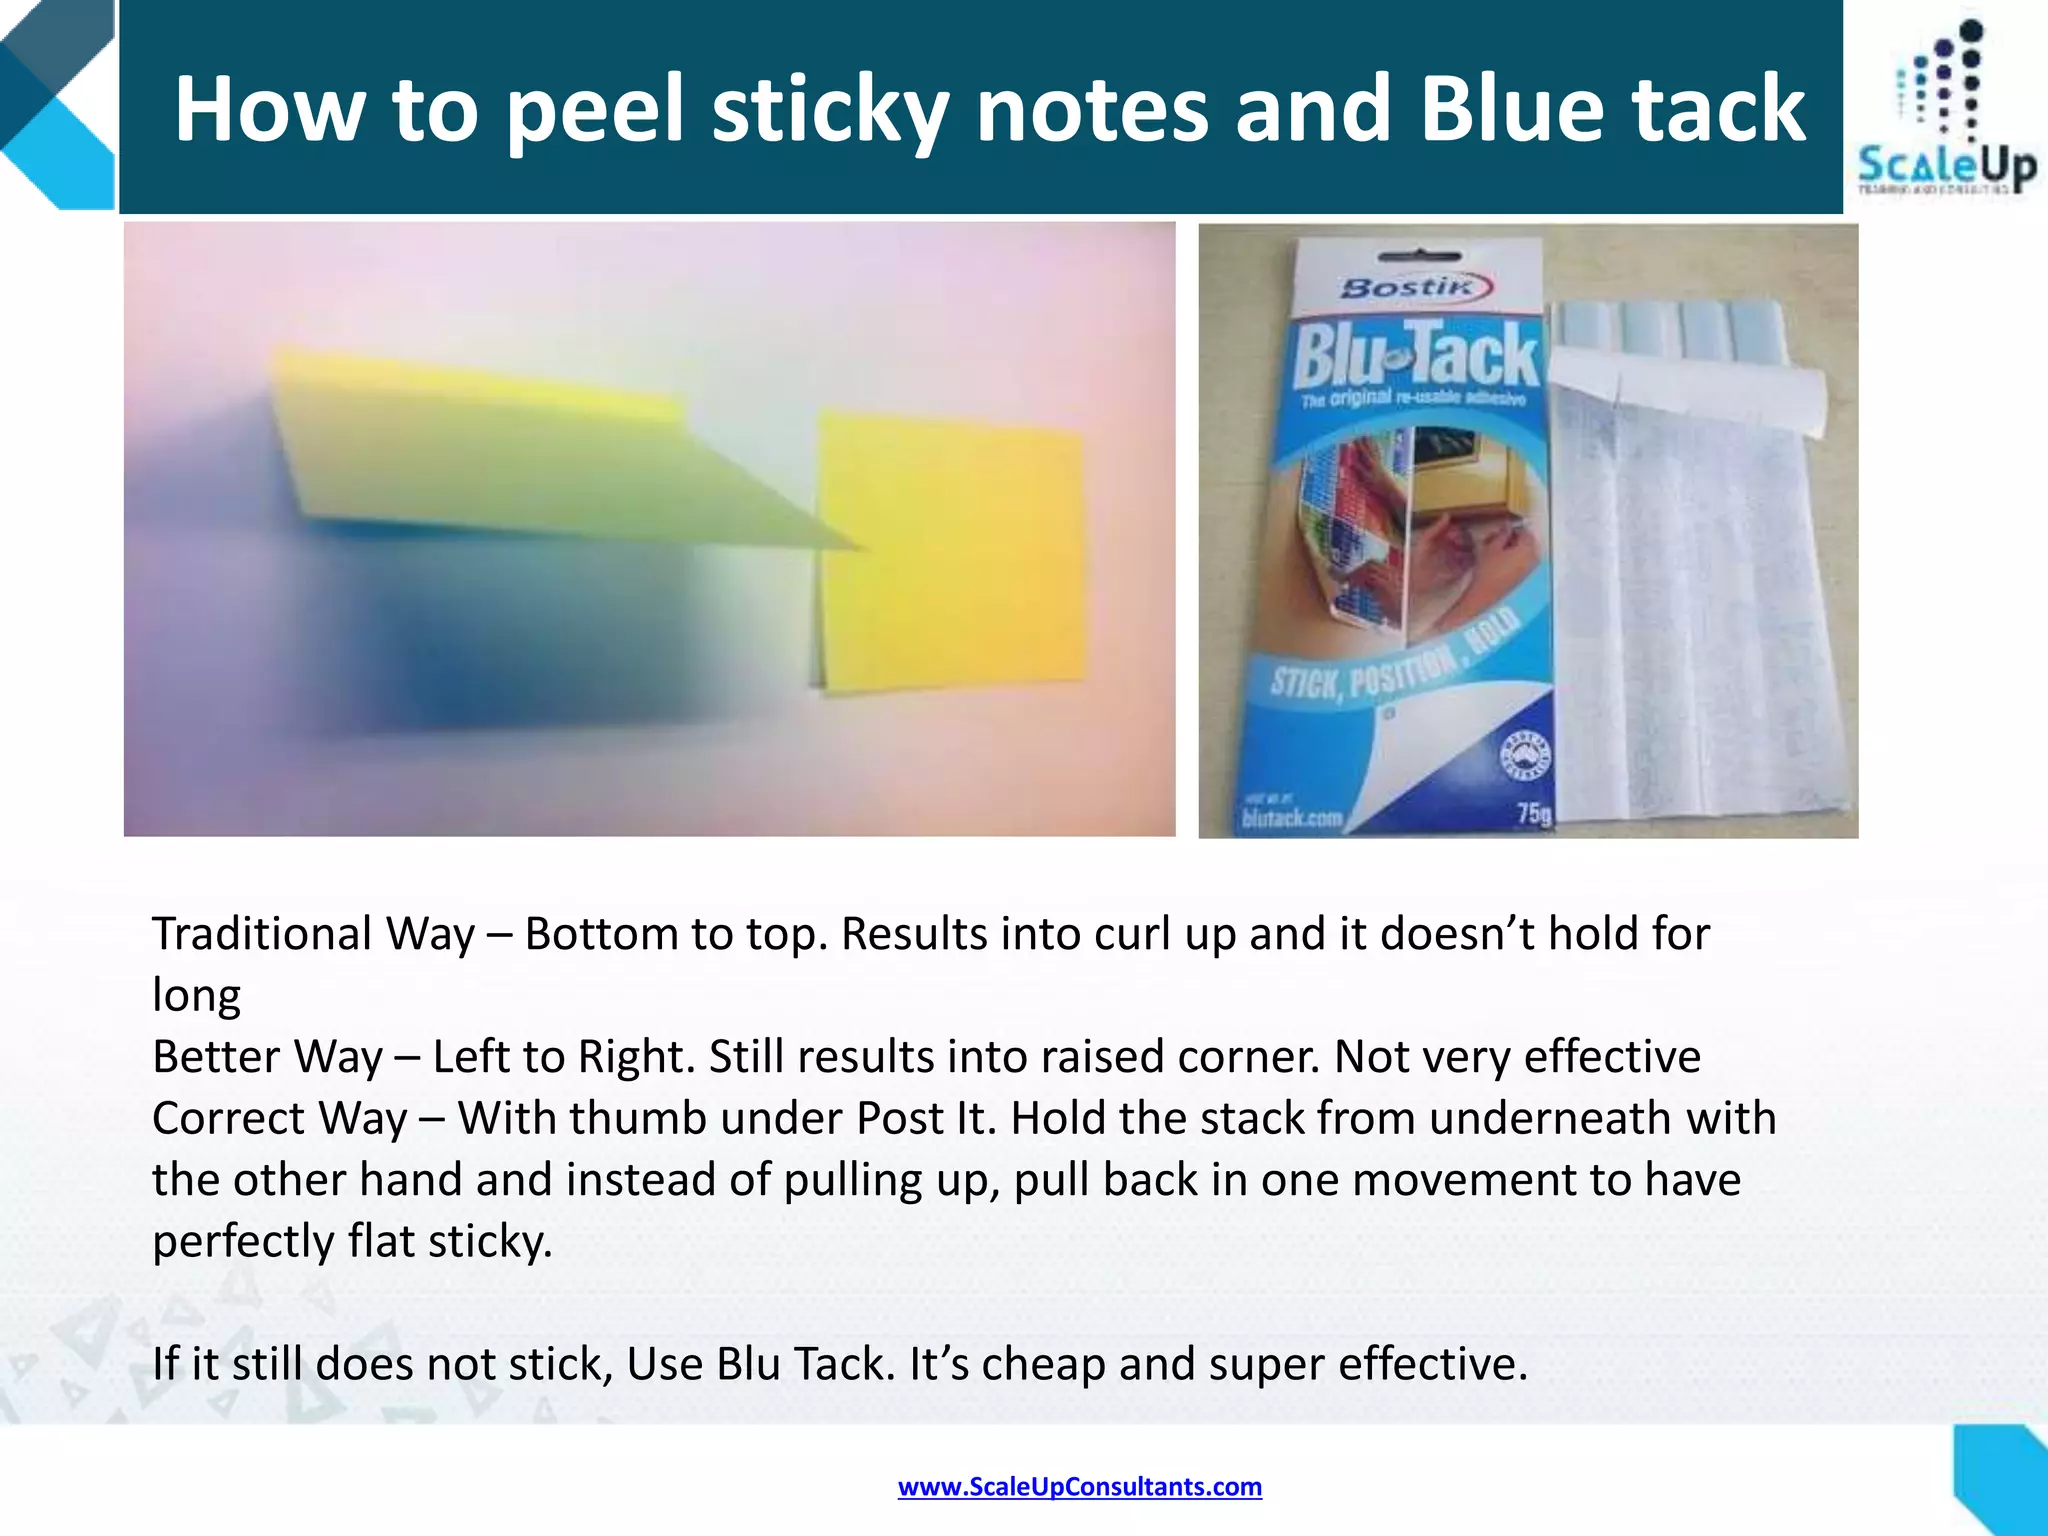
Guidelines on how to effectively use sticky notes for project tracking.
References for further reading and invitation for feedback on the presentation.


