Download as PDF, PPTX

![13
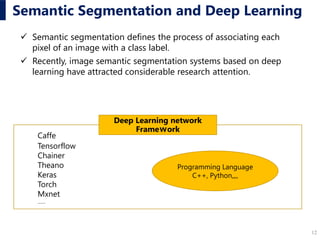
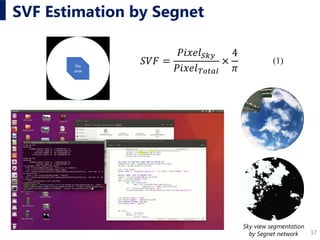
Proposed Method
A new SVF estimation system by training and constructing a deep
learning network for semantic segmentation of natural pixels in
landscape images
Segnet (Badrinarayanan et al. 2017) and U-Net (Olaf et al. 2015) are selected
as the basic network.
The focus of the entire system is how to build a deep learning
network to perform accurate semantic segmentation operations at
a high processing speed in real-time.
Badrinarayanan, V., Kendall, A. and Cipolla, R.: 2017, SegNet: A Deep Convolutional Encoder-Decoder Architecture for Image Segmentation,
IEEE Transactions on Pattern Analysis and Machine Intelligence, 39(12), 2481–2495.
Olaf R., Philipp F., Thomas B.: 2015, U-Net: Convolutional Networks for Biomedical Image Segmentation, arXiv:1505.04597 [cs.CV]](https://image.slidesharecdn.com/caadria2019caofukudayabuki-190803003337/85/Visual-Environment-by-Semantic-Segmentation-Using-Deep-Learning-A-Prototype-for-Sky-View-Factor-12-320.jpg)
![20
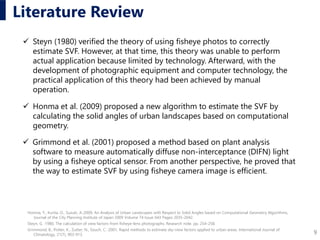
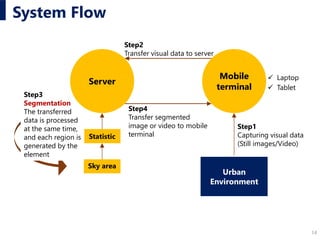
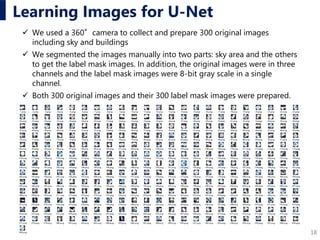
Verification method
Scene in HoloLens
Scene in real world
Semantic segmentation accuracy of our system to estimate SVF was verified
by the following method.
1. Create correct images
2. Calculate the red region in the
images that were outputted by
the proposed method
3. Combined for comprehensive
verification
(a)Original image (b)Correct image (by photoshop)
(c)Output by proposed method (d)Composite image
(a)Original image (b)Correct image (by photoshop)
(c)Output by proposed method (d)Composite image
(a) Original (b) Correct image (Photoshop)
(c) Output by
Proposed Method
(d) Composite Image
Definition
Yellow (Y) Accurate extracted pixel
Black (B) Accurate unextracted pixel
Red (R) Over-extracted pixel
Green (G) Unextracted area pixel
Calculation
formula
Extract accuracy
rate [%]
Y
X
× 100
Unextracted
accuracy rate [%]
B
X
× 100
Accuracy rate [%] (
Y
X
+
B
X
) × 100
Over extracted rate
[%]
R
X
× 100
Unextracted
inaccuracy rate [%]
G
X
× 100
Inaccuracy rate [%] (
R
X
+
G
X
) × 100
Formulas of accuracy rate and inaccuracy rate
Definition of each color in composite image](https://image.slidesharecdn.com/caadria2019caofukudayabuki-190803003337/85/Visual-Environment-by-Semantic-Segmentation-Using-Deep-Learning-A-Prototype-for-Sky-View-Factor-19-320.jpg)
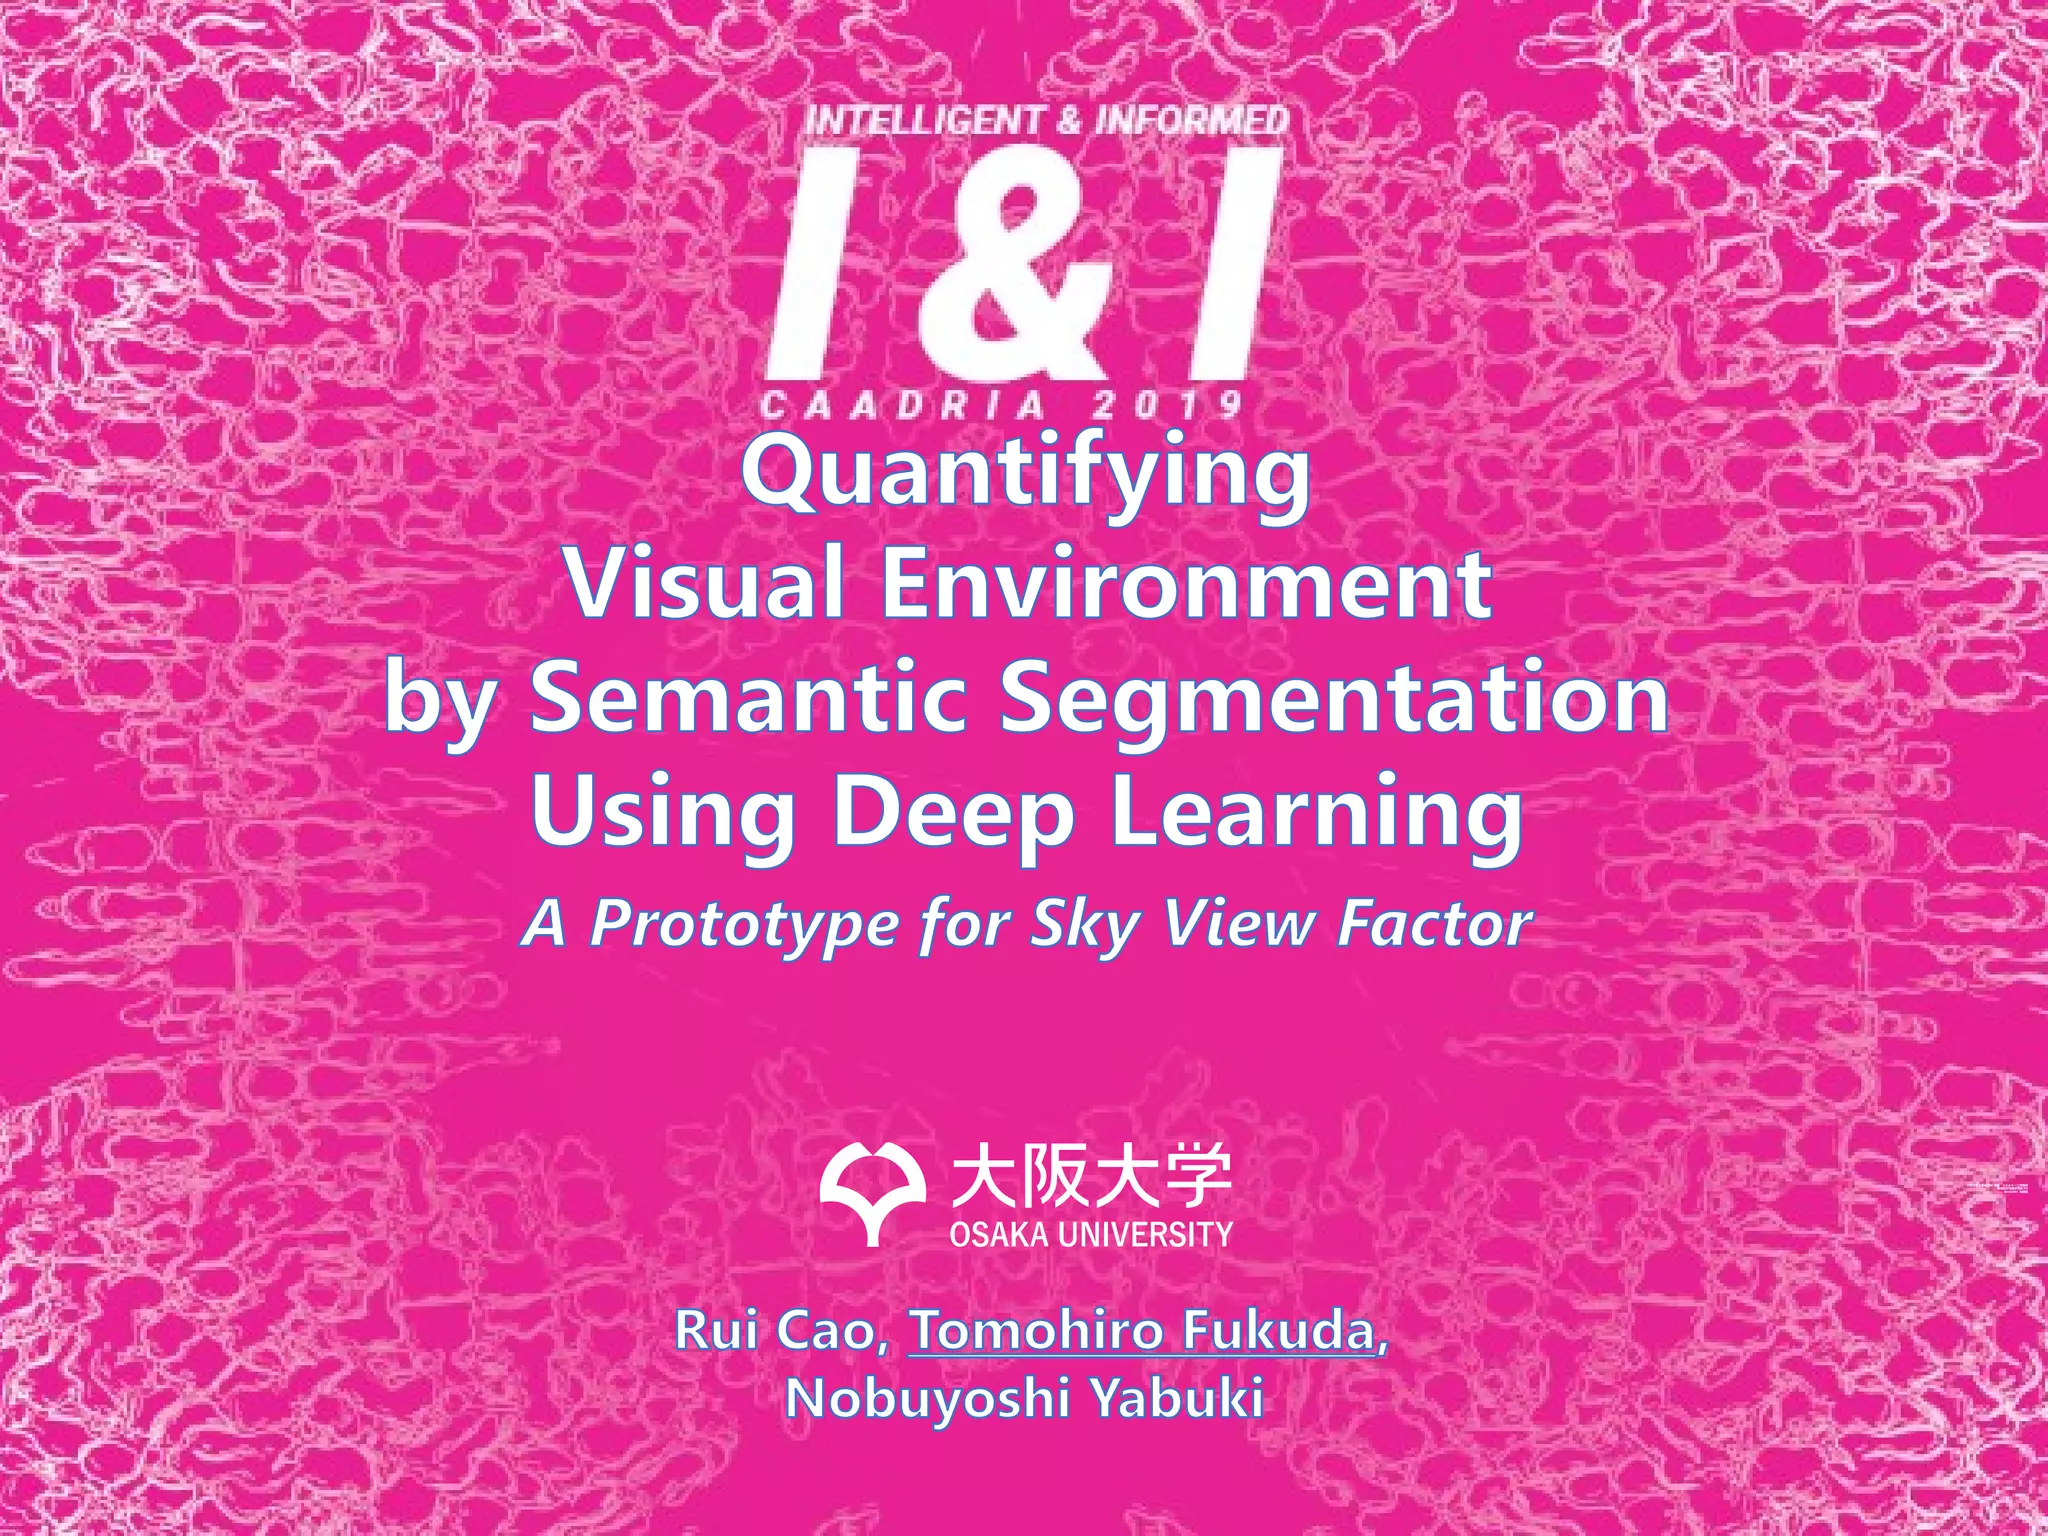
![22
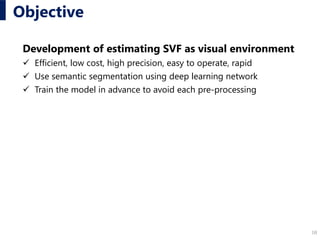
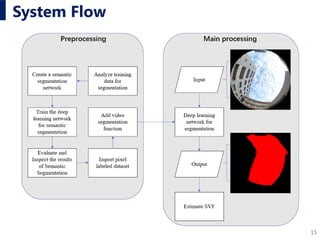
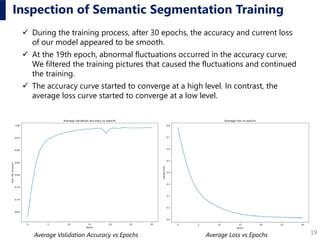
Results
Scene in HoloLensComparison between correct image and the output image generated using the proposed method
(A) Sunny weather (B) Rainy (C) Cloudy
(a) Original (b) Correct (Photoshop)
(c) Proposed Method (d) Composite Image
(a) Original (b) Correct (Photoshop) (a) Original (b) Correct (Photoshop)
(c) Proposed Method (d) Composite Image (c) Proposed Method (d) Composite Image
Extract accuracy rate [%] 45.7
Unextracted accuracy rate [%] 53.2
Accuracy rate [%] 98.9
Over extracted rate [%] 0.9
Unextracted inaccuracy rate [%] 0.2
Inaccuracy rate [%] 1.1
Accuracy and inaccuracy rate of SVF estimation](https://image.slidesharecdn.com/caadria2019caofukudayabuki-190803003337/85/Visual-Environment-by-Semantic-Segmentation-Using-Deep-Learning-A-Prototype-for-Sky-View-Factor-21-320.jpg)

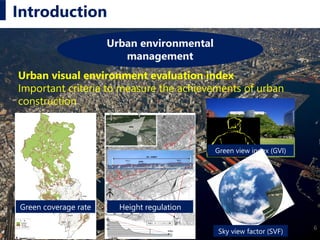
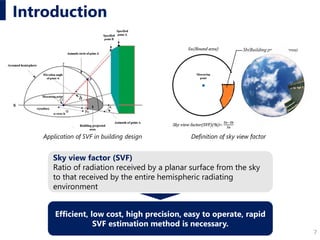
This document describes a proposed method for estimating sky view factor (SVF) using semantic segmentation with deep learning networks. Specifically: - It develops a system using SegNet and U-Net deep learning models to perform pixel-wise semantic segmentation of sky and non-sky areas from images to calculate SVF ratios. - The system was trained on 300 manually segmented images and tested on 100 fisheye photographs, achieving 98% accuracy in estimating SVF under different sky conditions. - Future work is needed to apply the system to live video streams rather than static images. The method provides an efficient, high-precision way to estimate important urban environmental metrics like SVF.