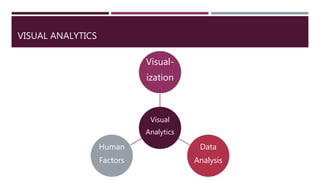
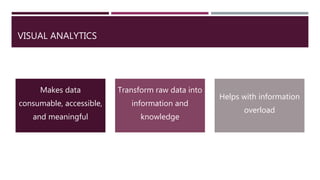
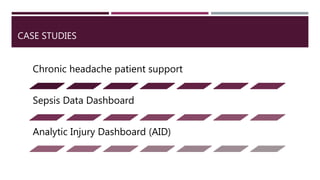
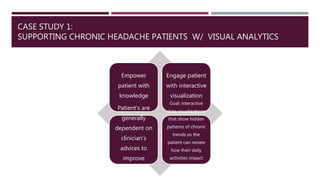
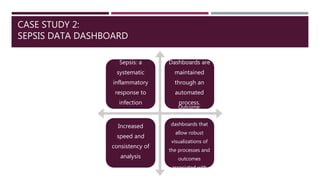
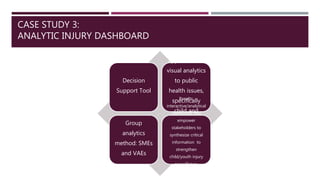
VISUAL ANALYTICS IN HEALTHCARE
PAYAL PATEL
VISUAL ANALYTICS
Visual
Analytics
Visual-
ization
Data
Analysis
Human
Factors
VISUAL ANALYTICS
Makes data
consumable, accessible,
and meaningful
Transform raw data into
information and
knowledge
Helps with information
overload
CASE STUDIES
Chronic headache patient support
Sepsis Data Dashboard
Analytic Injury Dashboard (AID)
CASE STUDY 1:
SUPPORTING CHRONIC HEADACHE PATIENTS W/ VISUAL ANALYTICS
Empower
patient with
knowledge
Engage patient
with interactive
visualization
Patient’s are
generally
dependent on
clinician’s
advices to
improve
condition
Goal: interactive
data visualizations
that show hidden
patterns of chronic
trends so the
patient can review
how their daily
activities impact
their chronic
conditions
CASE STUDY 2:
SEPSIS DATA DASHBOARD
Sepsis: a
systematic
inflammatory
response to
infection
Dashboards are
maintained
through an
automated
process.
Increased
speed and
consistency of
analysis
Outcome:
Creation of data
dashboards that
allow robust
visualizations of
the processes and
outcomes
associated with
sepsis
CASE STUDY 3:
ANALYTIC INJURY DASHBOARD
Decision
Support Tool
Focus:
application of
visual analytics
to public
health issues,
specifically
child and
youth injuryGroup
analytics
method: SMEs
and VAEs
Results:
interactive/analytical
dashboard that
empower
stakeholders to
synthesize critical
information to
strengthen
child/youth injury
surveillance,
prevention, and
future research
REFERENCES
 Kamal, Noreen. "Big Data and Visual Analytics in Health and Medicine: From Pipe Dream to Reality." Journal of Health &
Medical Informatics J Health Med Inform 05.05 (2014): n. pag. Web. <http://www.omicsonline.org/open-access/big-data-
and-visual-analytics-in-health-and-medicine-from-pipe-dream-2157-7420.1000e125.pdf>.
 Ledesma, Andres, Hannu Nieminen, Paivi Valve, Miikka Ermes, Holly Jimison, and Misha Pavel. "The Shape of Health: A
Comparison of Five Alternative Ways of Visualizing Personal Health and Wellbeing." 2015 37th Annual International
Conference of the IEEE Engineering in Medicine and Biology Society (EMBC) (2015): n. pag. Web.
<https://arxiv.org/pdf/1604.01797.pdf>.
 Shneiderman, Ben, Catherine Plaisant, and Bradford W. Hesse. "Improving Healthcare with Interactive
Visualization." Computer 46.5 (2013): 58-66. Web. <https://www.cs.umd.edu/~ben/Shneiderman2013Improving.pdf>.
 Stadler, Jennifer G., Kipp Donlon, Jordan D. Siewert, Tessa Franken, and Nathaniel E. Lewis. "Improving the Efficiency and Ease
of Healthcare Analysis Through Use of Data Visualization Dashboards." Big Data 4.2 (2016): 129-35. Web.
<http://online.liebertpub.com/doi/pdf/10.1089/big.2015.0059>.
 Rahman, S.M Waliur, Rahul Kamal Bhaskar, Frank Maurer, and Anthony Tang. "Supporting Chronic Headache Patients with
Visual Analytics." (2014): n. pag. Web. <http://hcitang.org/papers/2014-dis2014workshop-chronic-headaches.pdf>.

Visual Analytics in Healtcare

  • 1.
    VISUAL ANALYTICS INHEALTHCARE PAYAL PATEL
  • 2.
  • 3.
    VISUAL ANALYTICS Makes data consumable,accessible, and meaningful Transform raw data into information and knowledge Helps with information overload
  • 4.
    CASE STUDIES Chronic headachepatient support Sepsis Data Dashboard Analytic Injury Dashboard (AID)
  • 5.
    CASE STUDY 1: SUPPORTINGCHRONIC HEADACHE PATIENTS W/ VISUAL ANALYTICS Empower patient with knowledge Engage patient with interactive visualization Patient’s are generally dependent on clinician’s advices to improve condition Goal: interactive data visualizations that show hidden patterns of chronic trends so the patient can review how their daily activities impact their chronic conditions
  • 6.
    CASE STUDY 2: SEPSISDATA DASHBOARD Sepsis: a systematic inflammatory response to infection Dashboards are maintained through an automated process. Increased speed and consistency of analysis Outcome: Creation of data dashboards that allow robust visualizations of the processes and outcomes associated with sepsis
  • 7.
    CASE STUDY 3: ANALYTICINJURY DASHBOARD Decision Support Tool Focus: application of visual analytics to public health issues, specifically child and youth injuryGroup analytics method: SMEs and VAEs Results: interactive/analytical dashboard that empower stakeholders to synthesize critical information to strengthen child/youth injury surveillance, prevention, and future research
  • 8.
    REFERENCES  Kamal, Noreen."Big Data and Visual Analytics in Health and Medicine: From Pipe Dream to Reality." Journal of Health & Medical Informatics J Health Med Inform 05.05 (2014): n. pag. Web. <http://www.omicsonline.org/open-access/big-data- and-visual-analytics-in-health-and-medicine-from-pipe-dream-2157-7420.1000e125.pdf>.  Ledesma, Andres, Hannu Nieminen, Paivi Valve, Miikka Ermes, Holly Jimison, and Misha Pavel. "The Shape of Health: A Comparison of Five Alternative Ways of Visualizing Personal Health and Wellbeing." 2015 37th Annual International Conference of the IEEE Engineering in Medicine and Biology Society (EMBC) (2015): n. pag. Web. <https://arxiv.org/pdf/1604.01797.pdf>.  Shneiderman, Ben, Catherine Plaisant, and Bradford W. Hesse. "Improving Healthcare with Interactive Visualization." Computer 46.5 (2013): 58-66. Web. <https://www.cs.umd.edu/~ben/Shneiderman2013Improving.pdf>.  Stadler, Jennifer G., Kipp Donlon, Jordan D. Siewert, Tessa Franken, and Nathaniel E. Lewis. "Improving the Efficiency and Ease of Healthcare Analysis Through Use of Data Visualization Dashboards." Big Data 4.2 (2016): 129-35. Web. <http://online.liebertpub.com/doi/pdf/10.1089/big.2015.0059>.  Rahman, S.M Waliur, Rahul Kamal Bhaskar, Frank Maurer, and Anthony Tang. "Supporting Chronic Headache Patients with Visual Analytics." (2014): n. pag. Web. <http://hcitang.org/papers/2014-dis2014workshop-chronic-headaches.pdf>.