Download to read offline
![International Research Journal of Engineering and Technology (IRJET) e-ISSN: 2395-0056
Volume: 09 Issue: 04 | Apr 2022 www.irjet.net p-ISSN: 2395-0072
© 2022, IRJET | Impact Factor value: 7.529 | ISO 9001:2008 Certified Journal | Page 3329
Comparative Analysis of Natural Frequency of Transverse Vibration of
a Cantilever Beam by Analytical and Experimental Methods
Prof. S. V. Tawade1, Dr. R. J. Patil2, Prof. A. S. Kale3
1Asst. Professor, Dept. of Mechanical Engineering, Navsahyadri Engineering College, Pune, India
2Principal, Navsahyadri Engineering College, Pune, India
3Asst. Professor, Dept. of Electrical Engineering, Navsahyadri Engineering College, Pune, India
---------------------------------------------------------------------***---------------------------------------------------------------------
Abstract - Vibration analysis of any mechanical systems
is very important since excess vibrations leads to failure of
the mechanical systems. There are many methods and
instruments available in the engineering field for measuring
the mechanical vibrations in mechanical systems. In this
present work transverse vibrations of a cantilever beam are
analyzed analytically and experimentally. In our present
work FFT analyzer is used to measure the natural frequency
of vibration of a cantilever beam. Initially the natural
frequency of the cantilever beam is calculated analytically
and then natural frequency was found out by experimentally
by using FFT and the results were compared. Both
analytical and experimental results were found to be almost
the same. The present work shows a standard procedure for
the determination of natural frequency of vibration of a
cantilever beam by analytical and experimental methods by
using FFT analyzer.
Key Words: Cantilever beam, Natural frequency, FFT
1. INTRODUCTION
A straight, horizontal cantilever beam is deformed into
curve when it is subjected to a vertical load. After the
removal of Load, the beam regains its original shape as it
was prior before subjected to load, but due to inertia the
beam stays in motion. Which results in vibration of beam
at characteristic frequency [6]. In this paper a cantilever
beam with rectangular cross section for transverse
vibration is investigated. Device used are Accelerometer
and Fast Fourier Transform Analyzer. Most extensively
studied among structural elements are beam as it finds
many engineering applications. Structure like Long span
bridges, robot arm and tall buildings are modeled with
beam like element, beams as well as the presence of cracks
affects the dynamic response of the structure significantly.
It can result into failure of structure in a very extreme
way. To predict the failure, vibration monitoring can be
used to detect changes in the dynamic responses and/or
dynamic characteristics of the structure [7]. One of the
most important tasks in designing of mechanical system is
Vibration Analysis. Design engineer has to take into
consideration information like dynamic behaviour of
structure of machine tool, effect of vibration absorber on
rotating machineries. This information helps to design
system to control the excessive amplitude of the vibration
[2]. Before the advent of computers, seeking the analytical
solution was one of the most popular ways to solve an
engineering problem. In comparison with numerical
methods, the analytical solutions have the advantage of
elegance and are time-saving. However, for most practical
engineering problems no analytical solutions can be found,
unless they are significantly simplified. Because of this
drawback of the analytical method, it has gradually been
replaced by numerical methods after the invention of
computer, particularly in recent years. One of the greatest
shortcomings of the numerical approach is that it is time-
consuming, but because of its powerful ability for solving
the practical problems this drawback seems allowable [1].
An intelligent FFT analyser is capable of adapting its
operating parameters on the basis of the signal spectrum
set up and characters. The realised instrument is equipped
with auto configuration capability. The experimental tests
carried out on a large number of signals highlight the
instrument capability of correctly detecting a good
frequency resolution for any signal spectrum type [3]. In
this paper a straight horizontal cantilever beam is
subjected to free vibration due to which it will vibrate at
its natural frequency. The aim is to study the vibration of
thin film cantilever beam. The frequency equations are
solved to show the output frequencies and the mode
shapes related to each frequency [4]
2. THE CANTILEVER BEAM
Figure No. -1: The beam under free vibration
A Cantilever beam is a beam whose one end is fixed and
another end is free. When a beam is subjected to load it
withstands the load by resisting against bending. Bending
moment is the reaction of the beam, when a beam is
subjected to bending force due to its own weight, external
load, etc. When a straight horizontal cantilever beam is](https://image.slidesharecdn.com/irjet-v9i4465-220928070604-b32f116a/75/Comparative-Analysis-of-Natural-Frequency-of-Transverse-Vibration-of-a-Cantilever-Beam-by-Analytical-and-Experimental-Methods-1-2048.jpg)
![International Research Journal of Engineering and Technology (IRJET) e-ISSN: 2395-0056
Volume: 09 Issue: 04 | Apr 2022 www.irjet.net p-ISSN: 2395-0072
© 2022, IRJET | Impact Factor value: 7.529 | ISO 9001:2008 Certified Journal | Page 3330
exposed to vertical load, it will bend downwards and after
removal of load will regain its original shape but will
vibrate at natural frequency due to inertia. Most
fundamental structure of any structure from decades is
cantilever beam. The cantilever beam is much greater in
length as compared to width and depth. In addition,
cantilever beams may be straight or curved, with
rectangular or circular cross sections. Figure 1 shows a
cantilever beam with a rectangular cross section. The
design and shape of cantilever beam is application specific,
its weight, size, shape all parameters changes based on
application. For example, one of the most common
applications of a cantilever beam can be the “fixed wing” in
meters is designed as a beam for some preliminary
analysis to help lift the plane and make it fly. In Micro
Electrical Mechanical Systems (MEMS), micro cantilever
beams are used in radio frequency filters and resonator
[4].
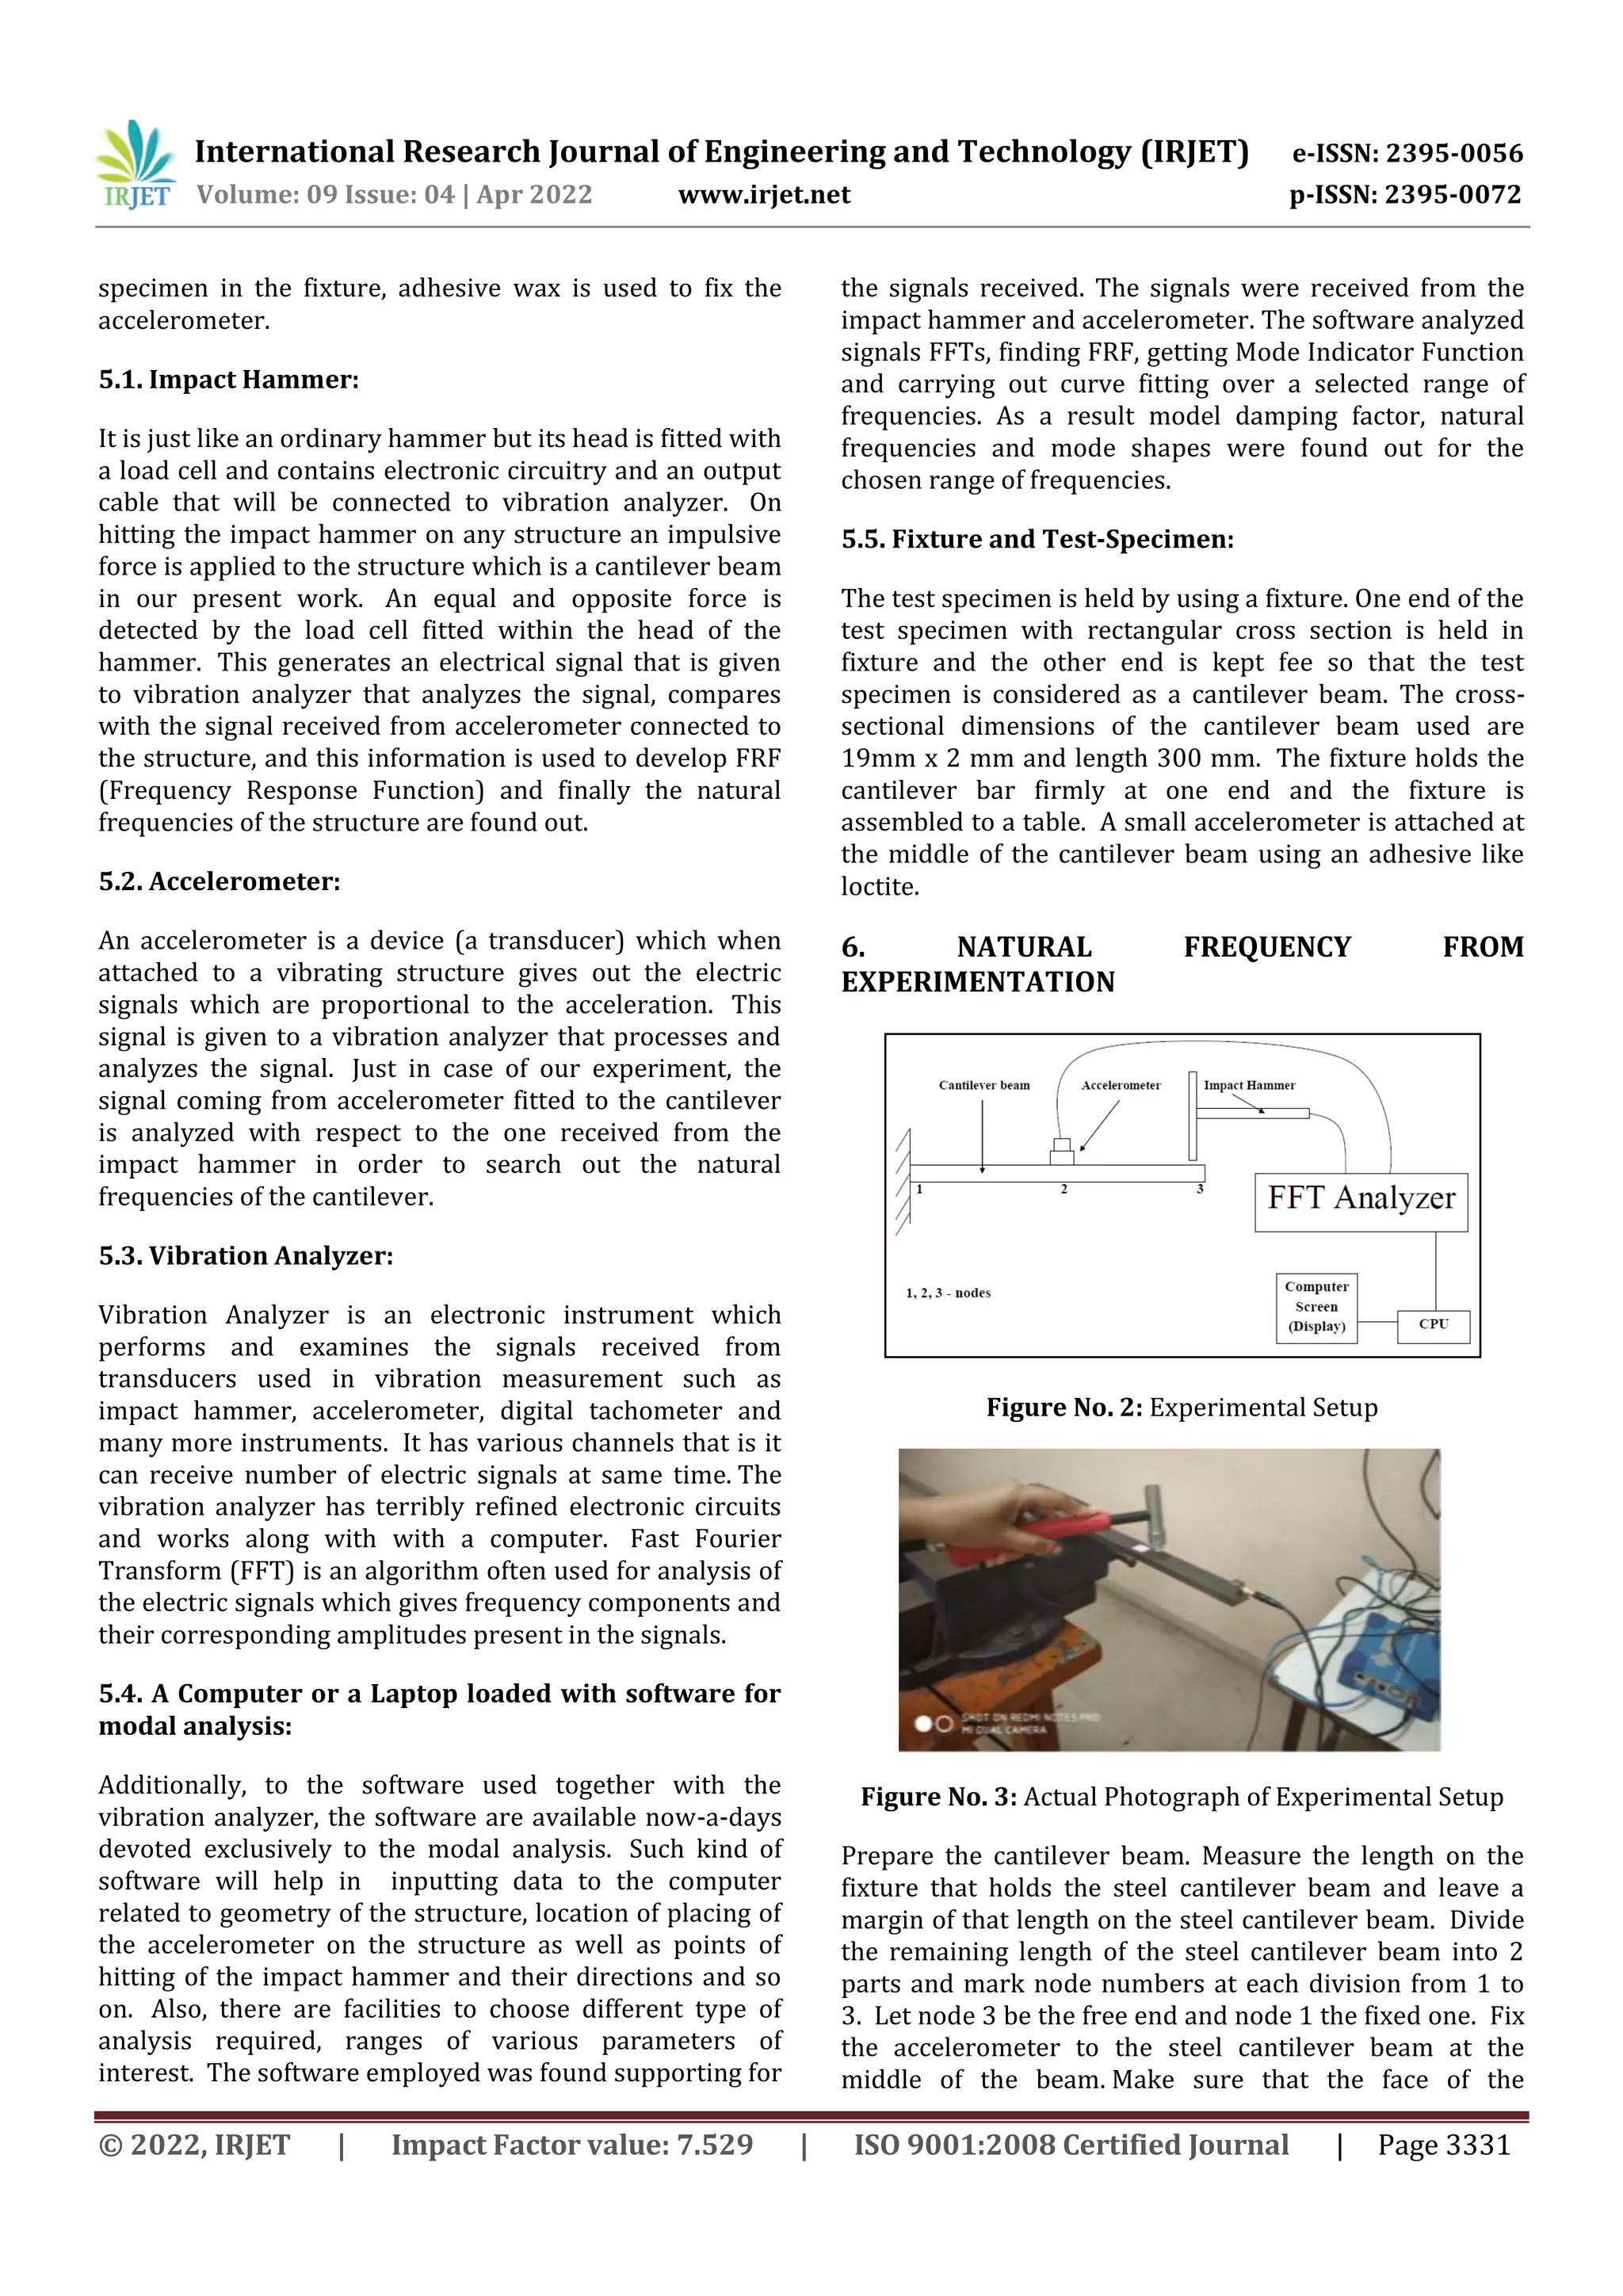
3. NATURAL FREQUENCY FROM ANALYTICAL
CALCULATION
Beam’s Specifications: L = 0.3 m, b = 0.019 m, t = 0.002 m
M. I. of cantilever beam (I) = (1/12)xbt3
= (1/12)x0.019 x (0.002)3 = 1.267 x 10⁻¹¹ m4
Area of cross section of cantilever beam (A)
= b x t = 0.019 x 0.002 = 3.8 x 10⁻⁵ m2
E = 210GPa (210x109 N/m2) ---For steel.
ρ = 7800 kg/m3 ----For steel.
For 1st mode
√ √
= 117.03rad/sec, & = 18.62Hz
For 2nd mode
√ √
=733.5rad/sec, & = 116.74 Hz
For 3rd mode
√ √
=2054.03rad/sec, & =326.9Hz
4. THE FFT ANALYZER
In FFT spectrum analyzer, the input signal is digitized and
that to at high sampling rate which is similar to
oscilloscope. The digital time record obtained as a result is
then transformed using a algorithm known as Fast Fourier
transform algorithm, into a Frequency Spectrum. The
signal analyzer measures the magnitude of an input signal
and compares with the maximum frequency range values
of instruments. The vibration amplitude is recorded on the
fact that its development versus the frequency at that the
signals were appeared. The original time domain signal is
converted into Frequency domain view. Single Channel
FFT and Multichannel type is specially used for
determining Single vibration parameter from one or more
sources.
4.1. Benefits of FFT analyzer:
4.1.1. Quick capture of waveform:
It is generally observed that the waveform is identified
digitally. The waveform can be identified in a remarkably
very short span of time and then the afterwards it is
analyzed. This short capture time has much benefit. It will
provide the capture of short-lived waveforms.
4.1.2. Able to capture non-repetitive events:
The short capture time indicate the truth that the FFT
analyzer will record non-repetitive waveforms giving
them a capability, which will not be possible with other
kinds of spectrum analyzers.
4.1.3. Able to analyze signal phase:
As part of the signal capture method, information is gained
which might be processed to reveal the phase of signals.
4.1.4. Waveforms can be stored using FFT technology:
It will be quite possible to record the waveform and
analyze it later and this will be required.
4.2. Disadvantages of the FFT analyzer:
4.2.1. Frequency limitations:
The important limitation of the frequency and bandwidth
of FFT spectrum analyzers is that the analogue to digital
converter, ADC that is used to convert the analogue signal
into a digital format. Whereas technology is raising this
component is still places a serious limitation on the higher
frequency limits or the bandwidth if a down-conversion
stage is employed.
4.2.2. Cost:
The high level of performance needed by the ADC implies
that, this item could be a terribly very high-cost item.
Additionally, to all the other processing and display
circuitry required, this leads to the prices rising for this
stuff.
5. EQUIPMENT USED FOR EXPERIMENTATION
Apparatus used to conduct the experimentation are, The
Impact Hammer, Accelerometer, Multi-channel Vibration
Analyzer (DEWESoft-DEWE-43), a laptop installed with
software for modal analysis. The cantilever beam is held in
a fixture, power supply is given to the laptop and the
vibration analyzer, connecting cables which in turn
connected to the impact hammer and the accelerometer.
Fasteners and spanner are used to assemble rigidly the](https://image.slidesharecdn.com/irjet-v9i4465-220928070604-b32f116a/75/Comparative-Analysis-of-Natural-Frequency-of-Transverse-Vibration-of-a-Cantilever-Beam-by-Analytical-and-Experimental-Methods-2-2048.jpg)
![International Research Journal of Engineering and Technology (IRJET) e-ISSN: 2395-0056
Volume: 09 Issue: 04 | Apr 2022 www.irjet.net p-ISSN: 2395-0072
© 2022, IRJET | Impact Factor value: 7.529 | ISO 9001:2008 Certified Journal | Page 3333
Figure No. 7: Analytical and experimental results
9. CONCLUSIONS
Vibration analysis is one of the most important processes
in the field of mechanical engineering. Vibration study of a
cantilever beam is very important. This study will helps to
determine the durability concerns. The observations from
this work can be is used to decrease the discomforts and
the excessive stresses in different applications where
beams are important components. Beams will have
different dynamic loads in different applications. When a
cantilever beam is subjected to a dynamic load, the beam
will vibrate at its natural frequencies. The natural
frequency of vibration of cantilever beam is analyzed by
both analytical and experimental methods and both the
results were compared. From result table it can be
concluded that Natural frequency obtained by FFT
Analyzer i.e., by experimental method is matching with
natural frequency by analytical calculation. The
dimensions of the cantilever beam are length L = 0.3 m,
breadth b = 0.019 m and thickness t = 0.002 m. Natural
frequency obtained by analytical calculation for 1st mode,
2nd mode and 3rd mode of vibrations are 18.62 Hz,
116.74Hz and 326.9Hz respectively. The natural frequency
obtained by experimental method by using FFT for 1st
mode, 2nd mode and 3rd mode of vibrations are 19.77Hz,
116.0 Hz and 324.0Hz.
REFERENCES
[1]. J.-S. WV, T.-L. LIN, “Free Vibration Analysis of a
Uniform Cantilever Beam with Point Masses by An
Analytical-And-Numerical Combined Method”, Journal
of Sound and Vibration (1990) 136(2), 201-213,1990
Academic Press Limited
[2]. J.P. Chopade, R.B. Barjibhe”Free Vibration Analysis of
Fixed Free Beam with Theoretical and Numerical
Approach Method”, International Journal of
Innovations in Engineering and Technology
(IJIET),Vol. 2 Issue 1 February 2013,ISSN: 2319 –
1058
[3]. Giovanni Betta,, Massimo D’Apuzzo, “An Intelligent
FFT-Analyzer”, IEEE Transactions on Instrumentation
and Measurement, VOL. 47, NO. 5, October 1998
[4]. Mohammad Zannon, “Free Vibration of Thin Film
Cantilever Beam”, International Journal of Engineering
and Technical Research (IJETR), ISSN: 2321-0869,
Volume-2, Issue-11, November 2014
[5]. Simarnjit Singh, Amandeep Singh, “Free Vibration
Analysis on Cantilever Beam- A Review”, International
Research Journal of Engineering and Technology
(IRJET) e-ISSN: 2395 -0056, p-ISSN: 2395-0072,
Volume: 04 Issue: 02 | Feb -2017
[6]. Mohammad Vaziri, Ali Vaziri, Prof. S.S. Kadam
“Vibration analysis of cantilever beam by using FFT
Analyzer”, International Journal of Advanced
Engineering Technology, E-ISSN 0976-3945,
IJAET/Vol. IV/ Issue II/April-June, 2013/112-115
[7]. GAWALI A.L. and SANJAY C. KUMAWAT, “Vibration
Analysis of Beams”, World Research Journal of Civil
Engineering, ISSN: 2277-5986 & E-ISSN: 2277-5994,
Volume 1, Issue 1, 2011, pp-15-29
[8]. Pooja Ghumai, Dr. L G Navale, “Cantilever Beam Crack
Detection using FEA and FFT Analyser”, International
Research Journal of Engineering and Technology
(IRJET), e-ISSN: 2395-0056, p-ISSN: 2395-0072,
Volume: 05 Issue: 10 | Oct 2018
[9]. Mihir H. Patel, Ankit J. Desai, “Development of FFT
Analyzer for measuring Vibration”, The International
journal of analytical and experimental modal analysis,
ISSN NO:0886-9367, Volume XII, Issue IV, April/2020
[10]. Suraj R. Karanjikar, Prof. D.S. Supekar, “Vibrational
Analysis of Four Stroke Diesel Engine using FFT
Analyzer”, International Journal of Engineering
Research & Technology (IJERT), ISSN: 2278-0181, Vol.
4 Issue 06, June-2015
0
100
200
300
400
1st MOV 3rd MOV
Analytical
Method
Experimental
Method](https://image.slidesharecdn.com/irjet-v9i4465-220928070604-b32f116a/75/Comparative-Analysis-of-Natural-Frequency-of-Transverse-Vibration-of-a-Cantilever-Beam-by-Analytical-and-Experimental-Methods-5-2048.jpg)

This document presents a comparative analysis of the natural frequency of transverse vibration of a cantilever beam using analytical and experimental methods. Analytical calculations are performed to determine the natural frequencies of the first three modes of vibration of the cantilever beam. Experimental testing is conducted using an impact hammer, accelerometer, and FFT analyzer. The natural frequencies measured experimentally are found to be close to those calculated analytically. The results demonstrate that analytical and experimental methods can both accurately determine the natural frequencies of a cantilever beam's vibration.


![[IJET-V1I6P14] Authors : M.S.Patil, J.G.Patil, R.R.Borase](https://cdn.slidesharecdn.com/ss_thumbnails/ijet-v1i6p14-160110010520-thumbnail.jpg?width=640&height=640&fit=bounds)


