Download to read offline


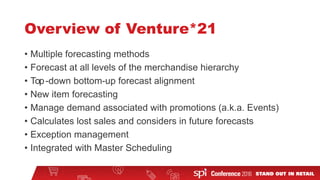

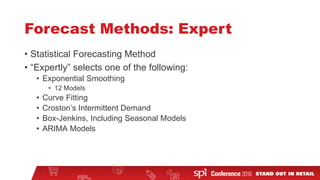
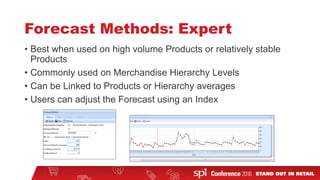
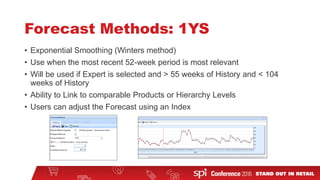
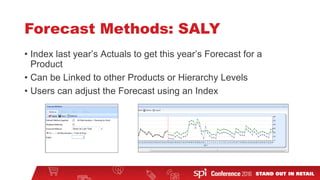
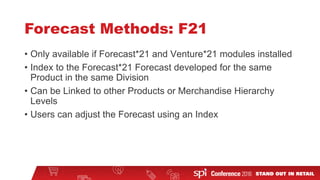

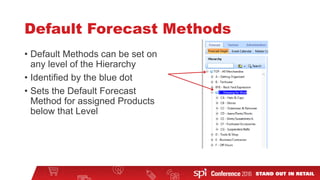
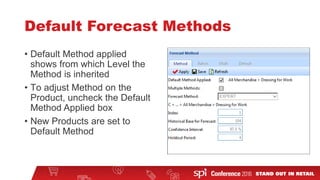

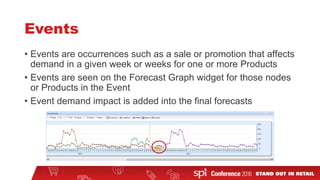
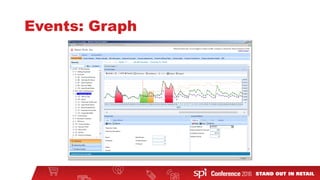
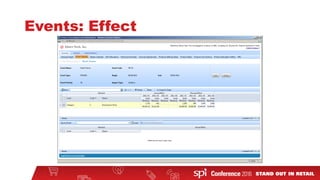
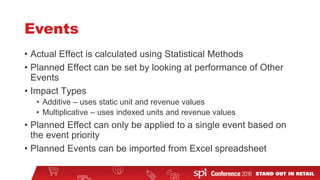

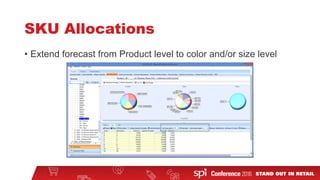
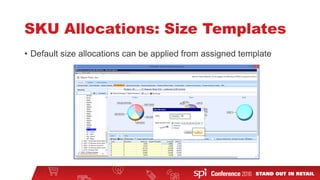


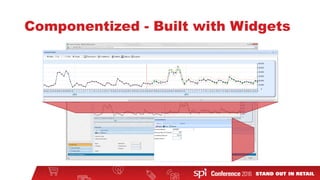
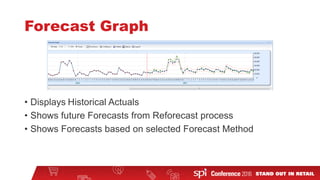
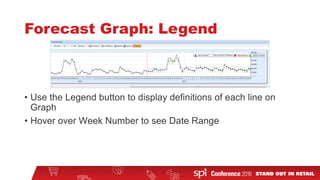
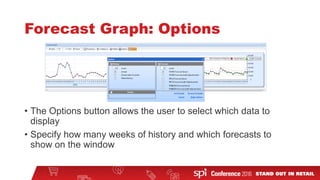


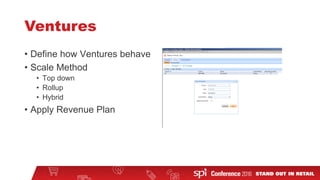

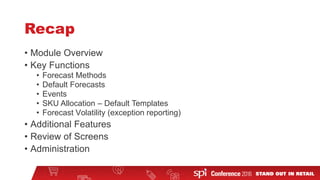


Venture*21 is a demand forecasting module that uses statistical methods to generate automated weekly forecasts. It features multiple forecasting techniques, top-down and bottom-up alignment of forecasts, new item forecasting, event management, exception reporting, and integration with master scheduling. The module allows forecasting at different product hierarchy levels and includes default forecasting methods, size templates, and administration tools for setup and maintenance.


