Download to read offline

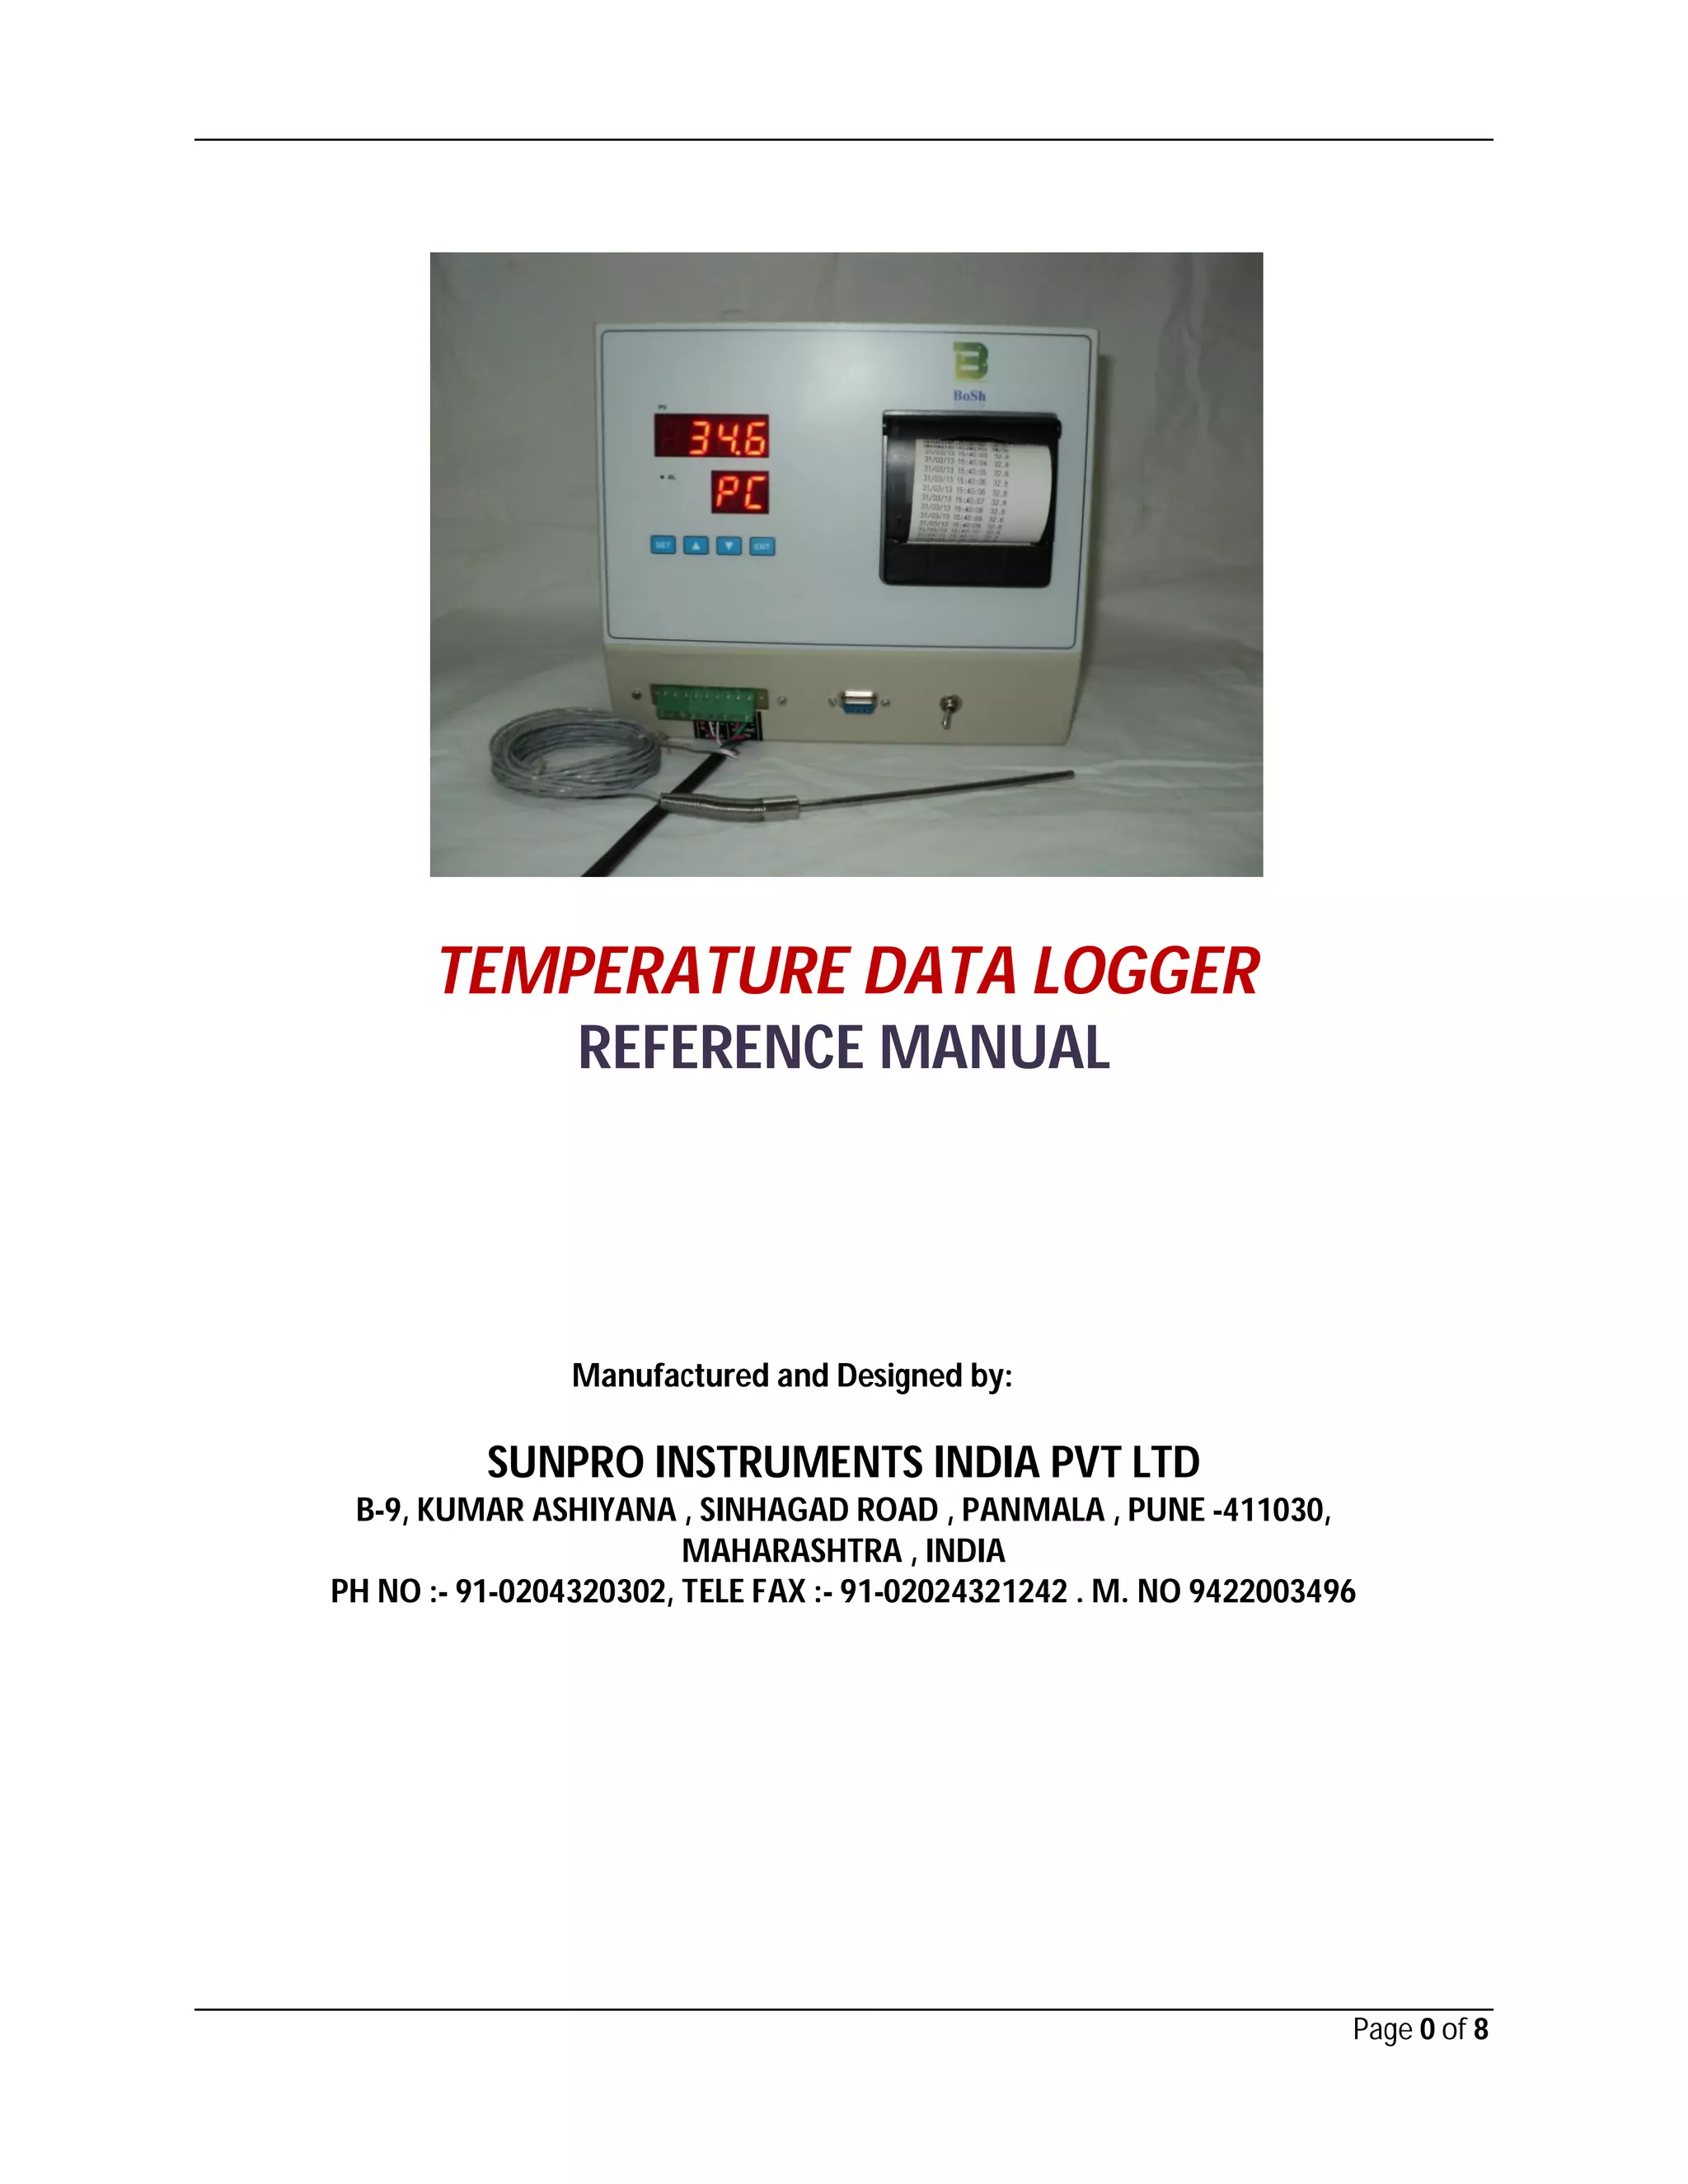

The temperature data logger by Sunpro Instruments is designed to monitor and record data from various environments, featuring high accuracy, a user-friendly software interface, and compatibility with thermal printers. It can log up to 32,000 records and allows data export to formats like Excel and WordPad for analysis. The document also includes sections on installation, hardware overview, and troubleshooting for effective usage.


