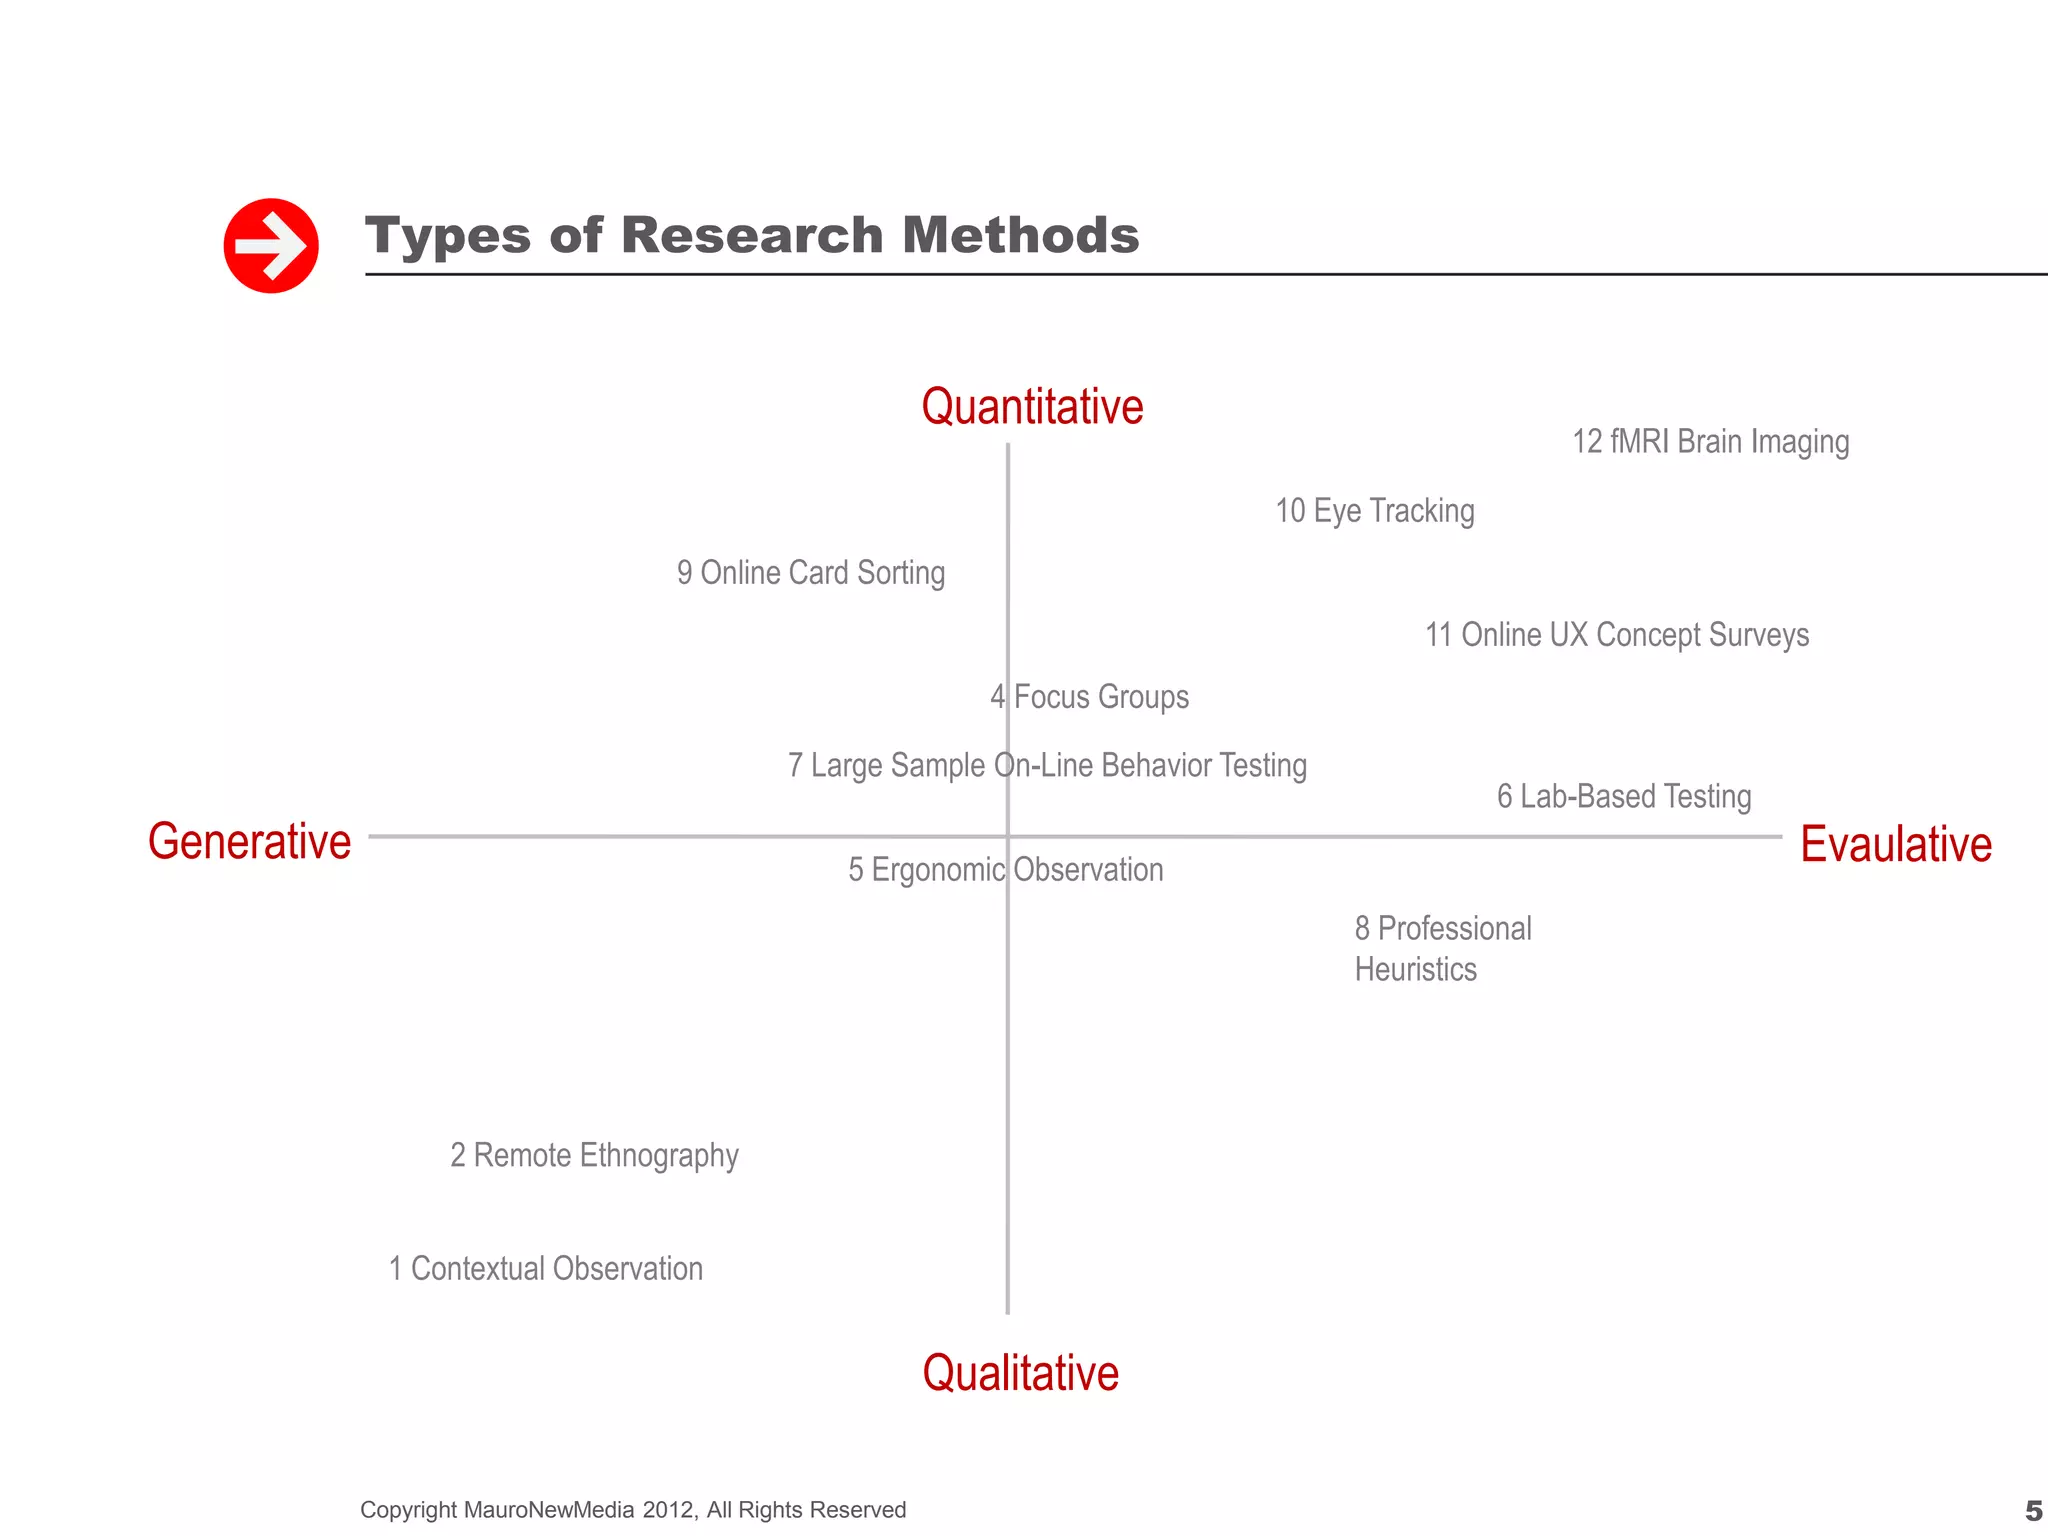
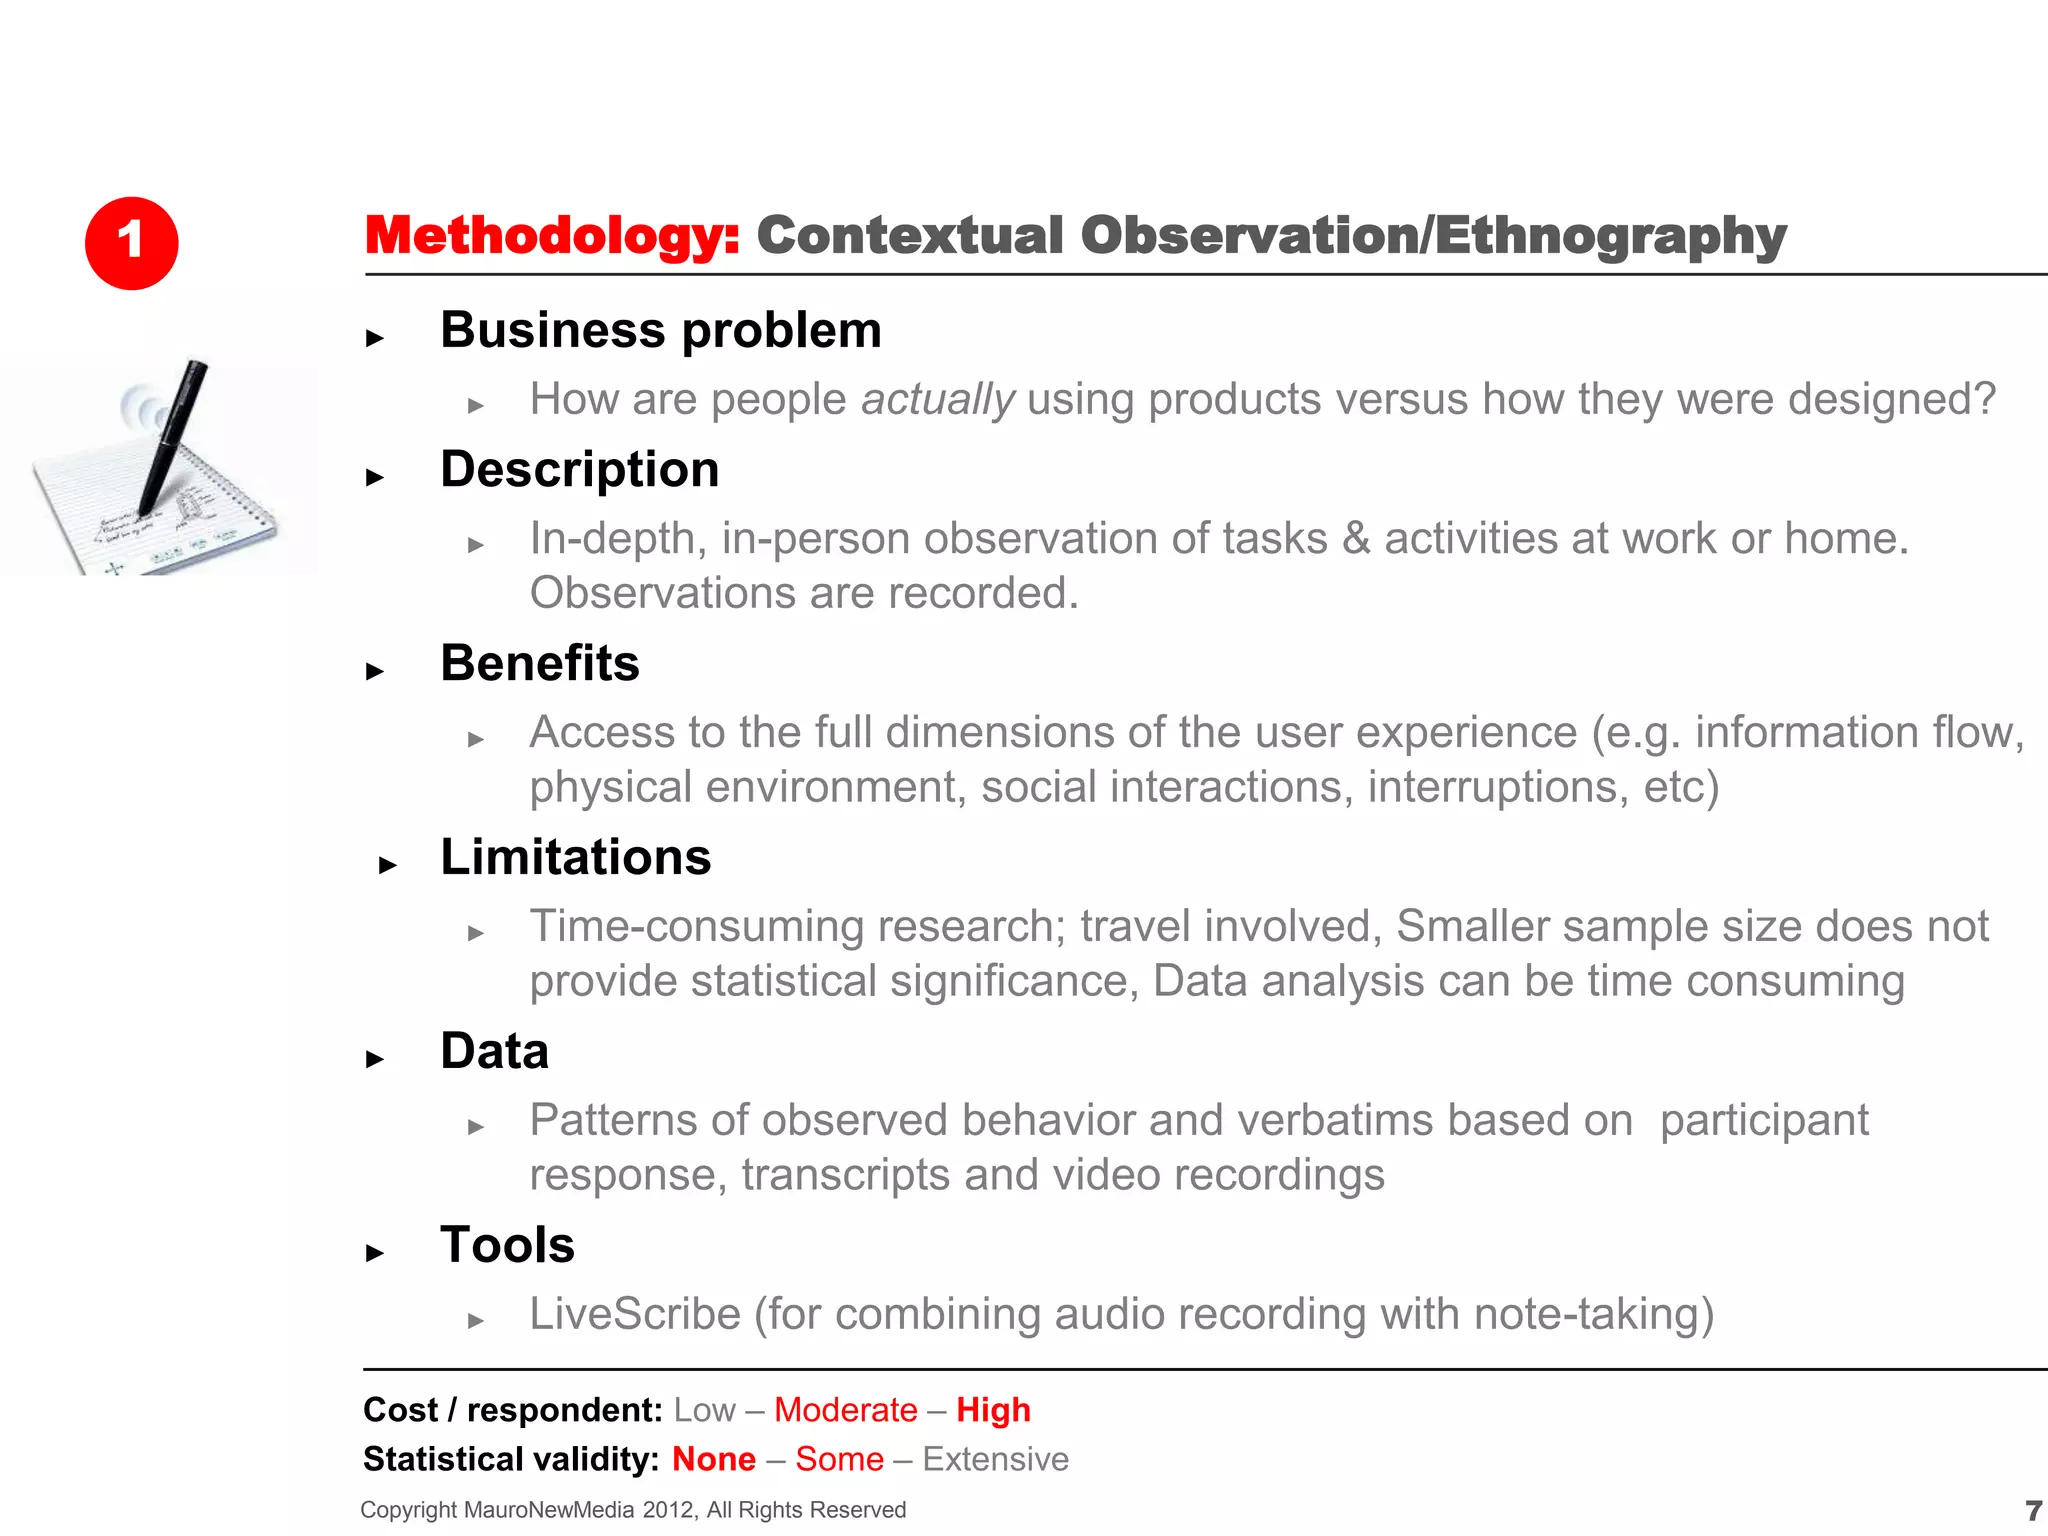
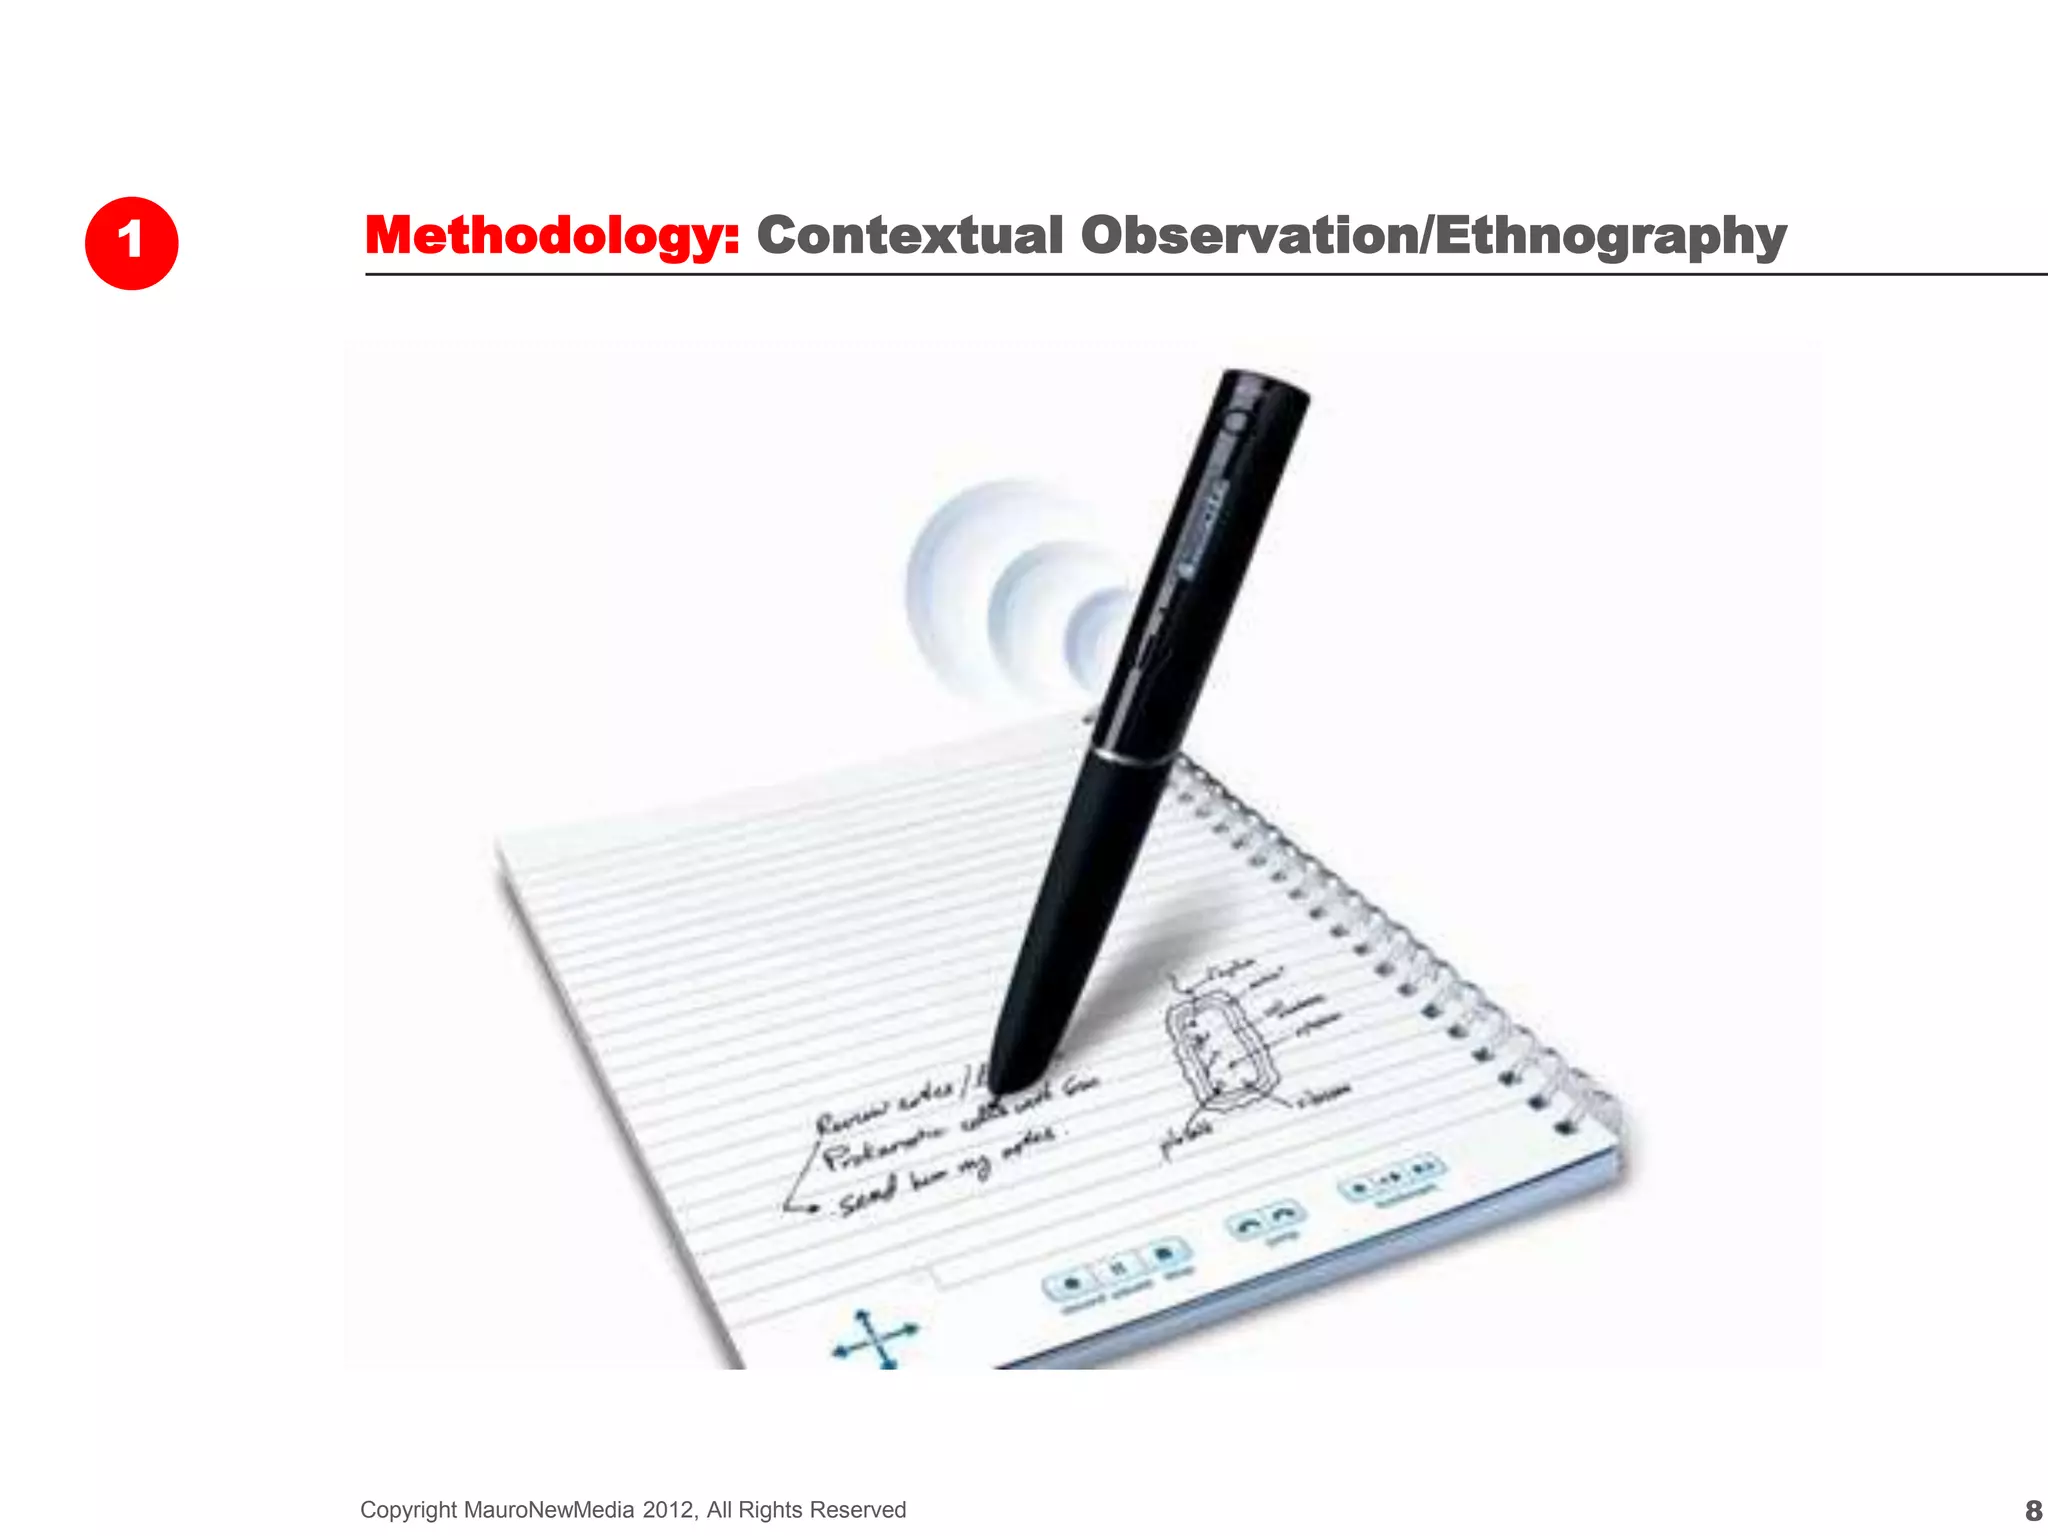
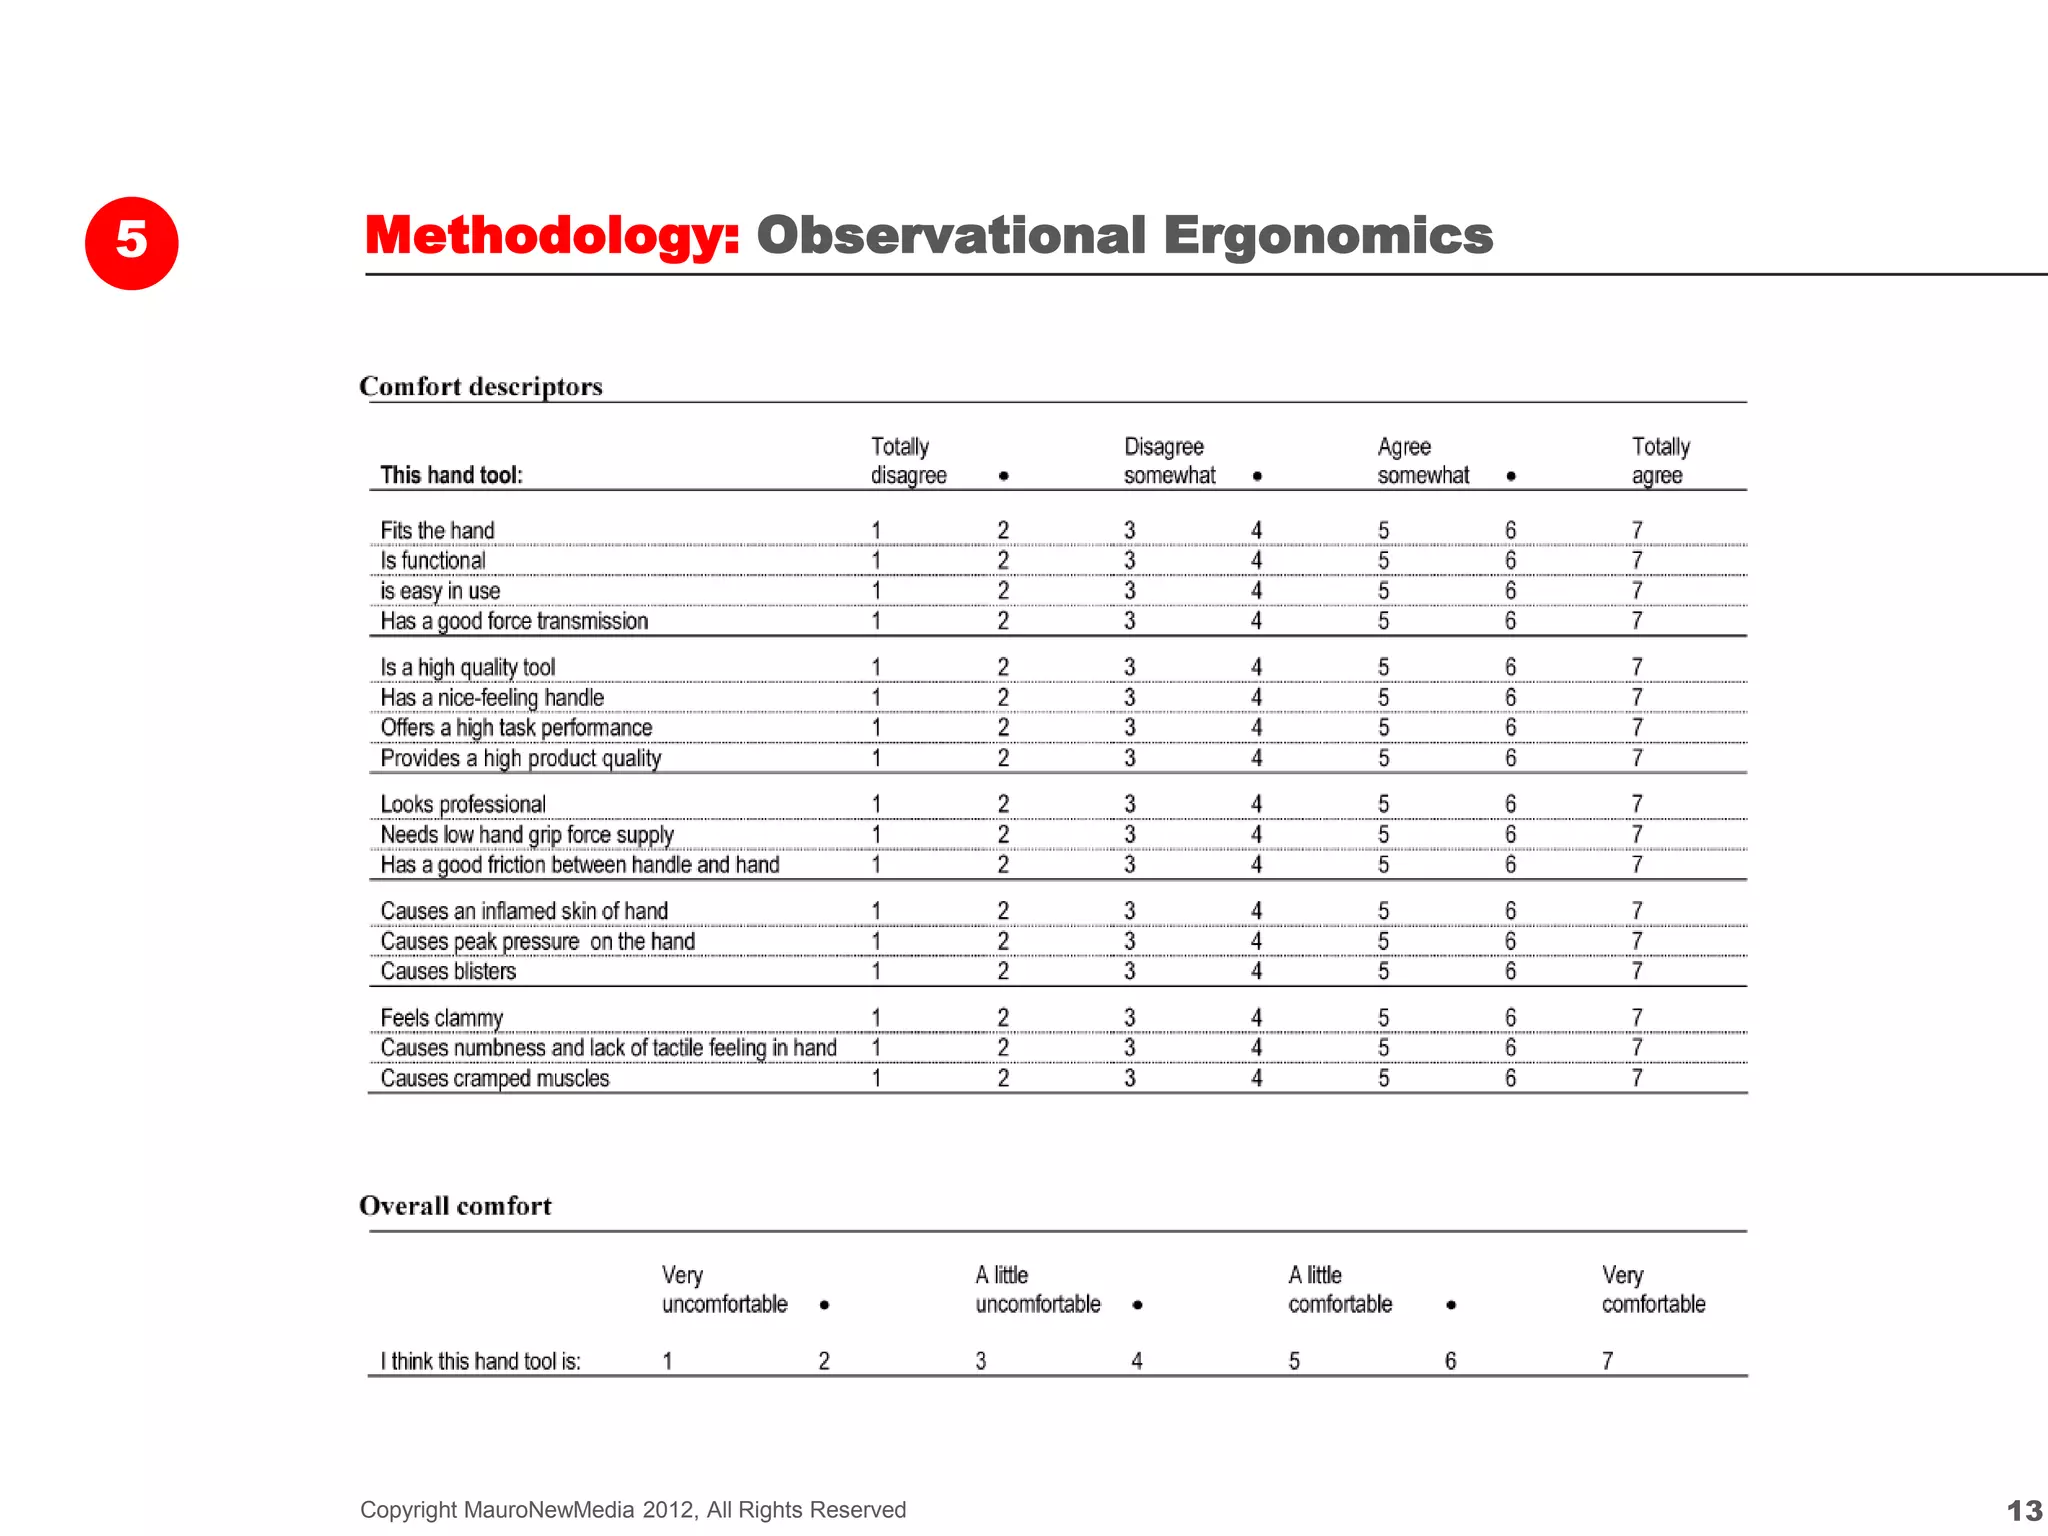
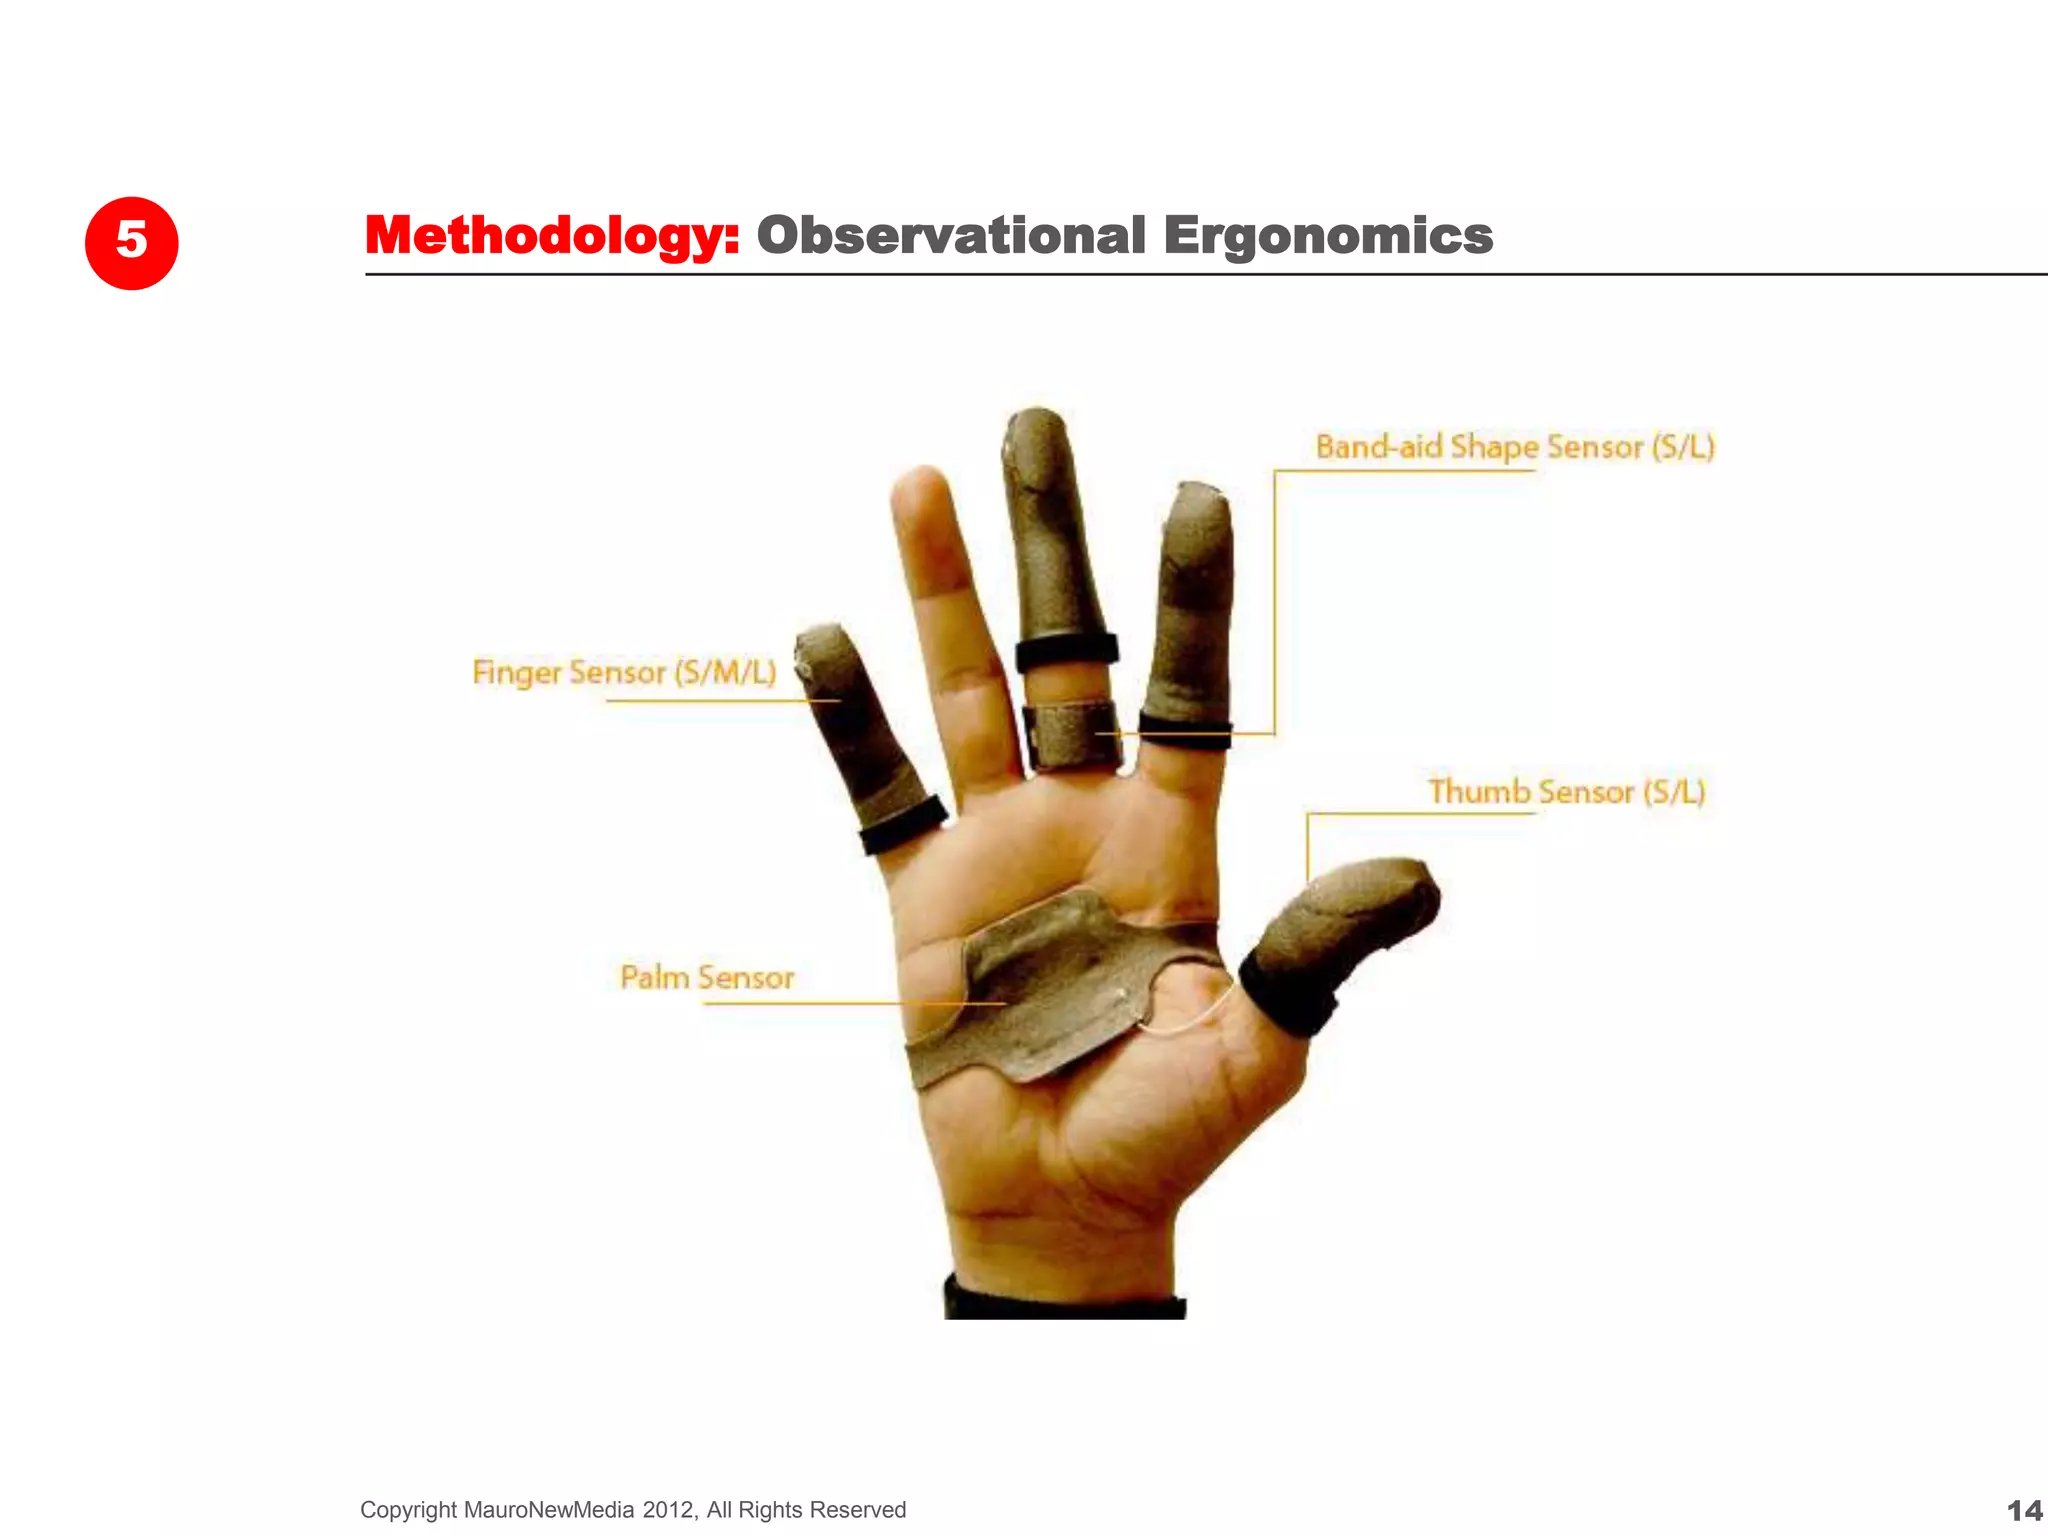
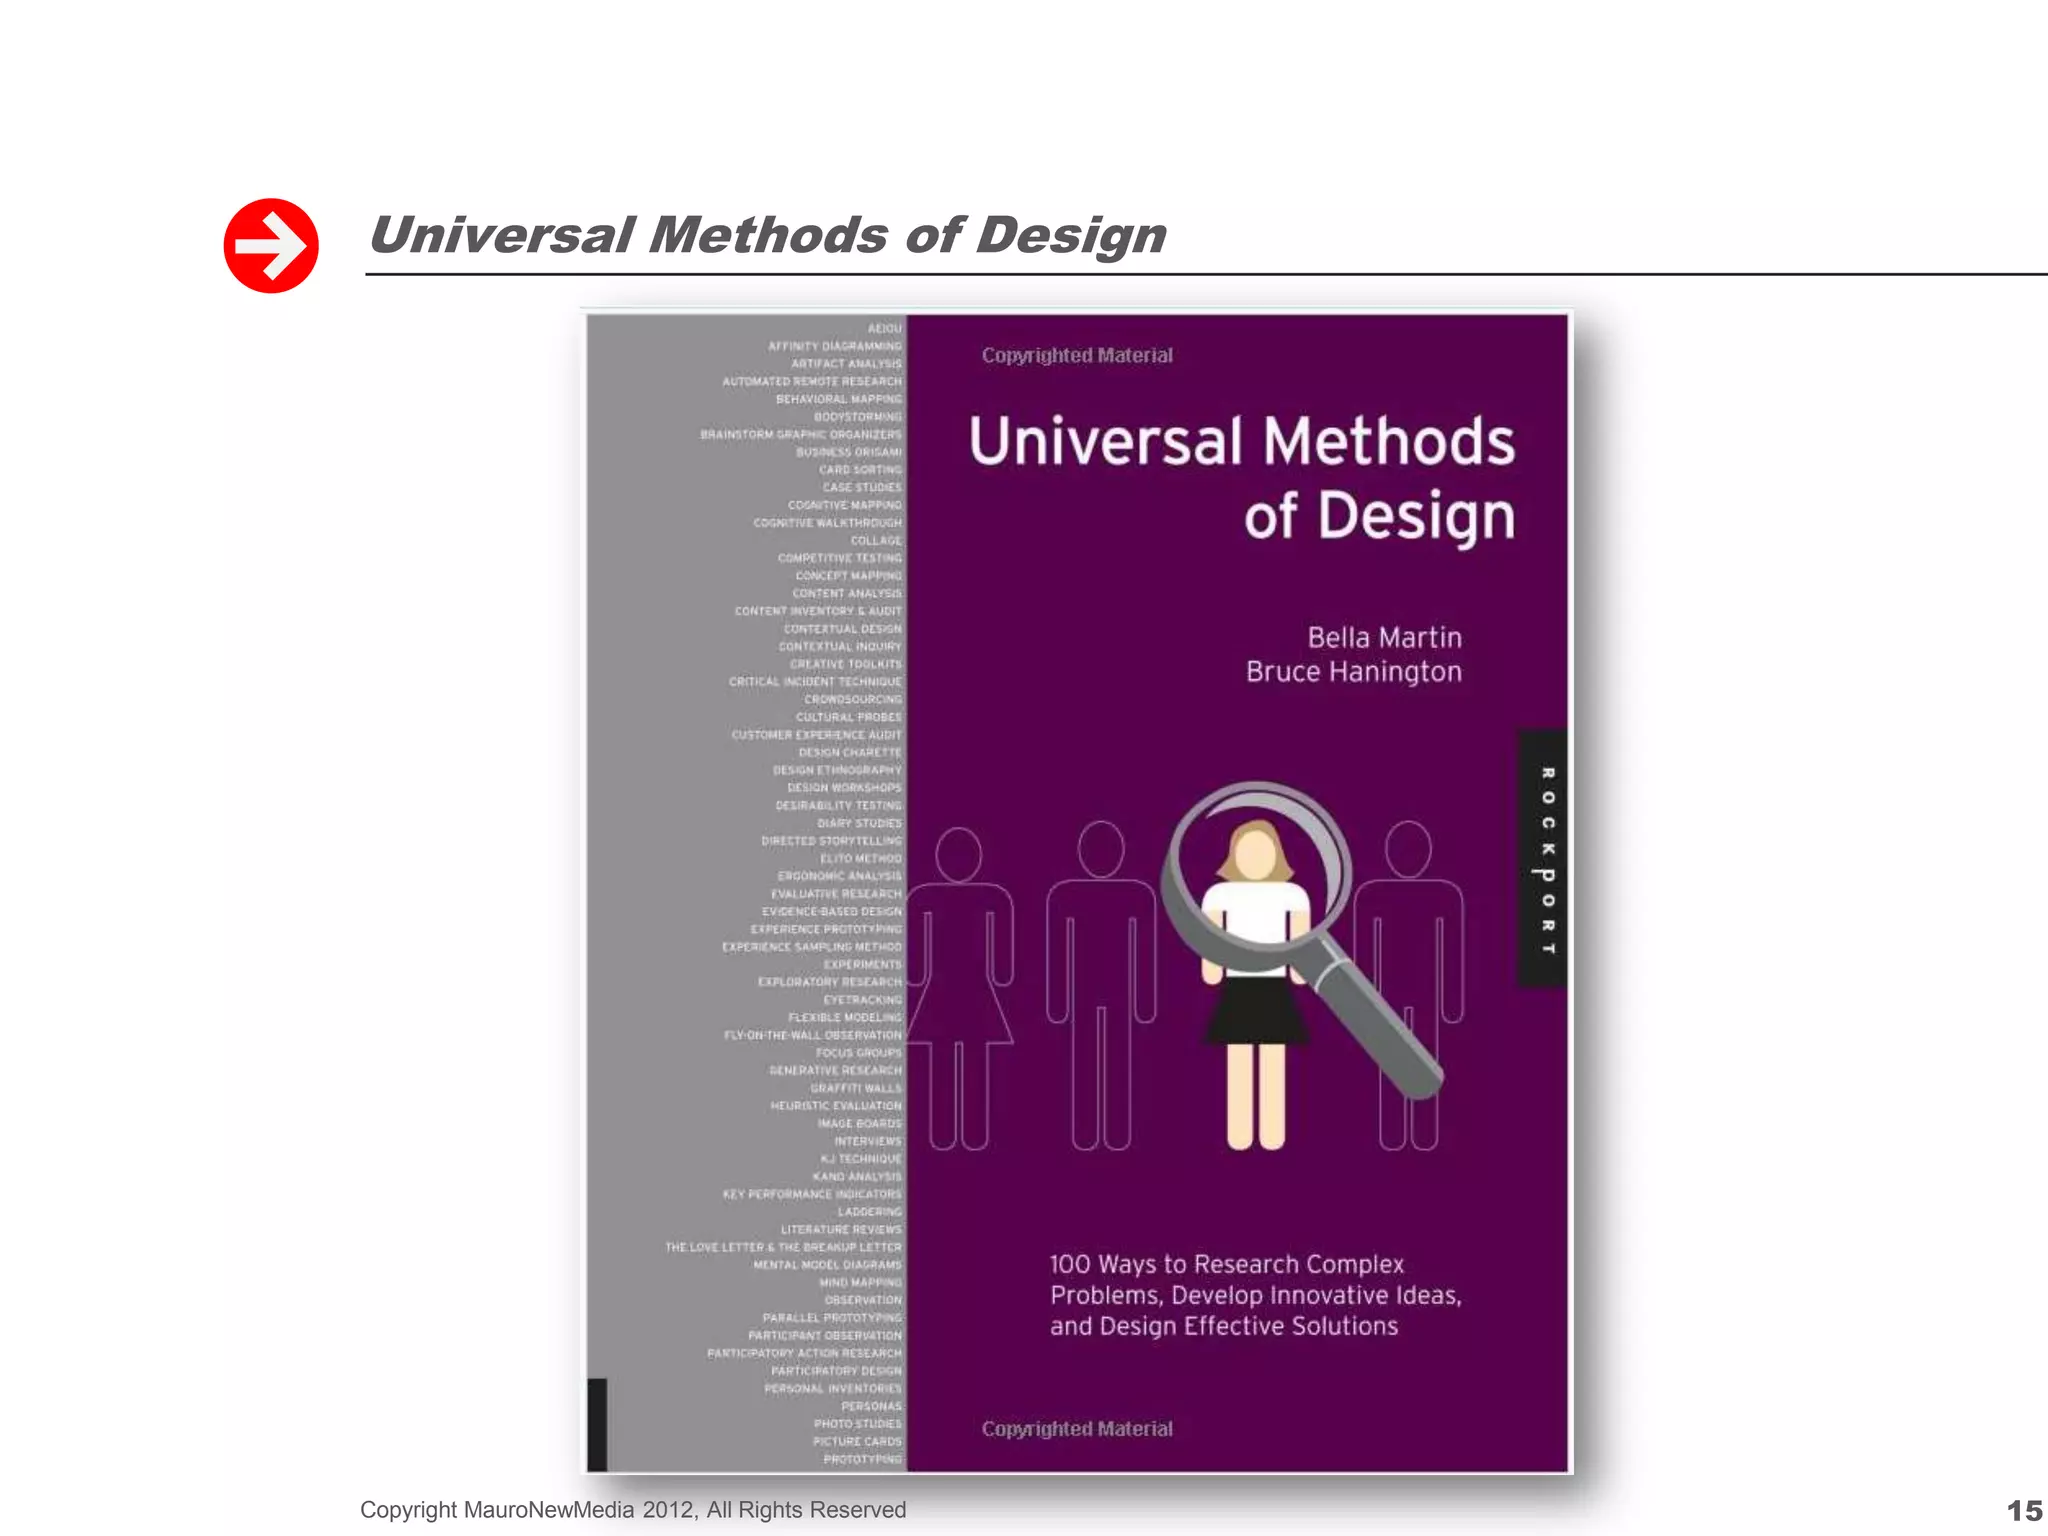
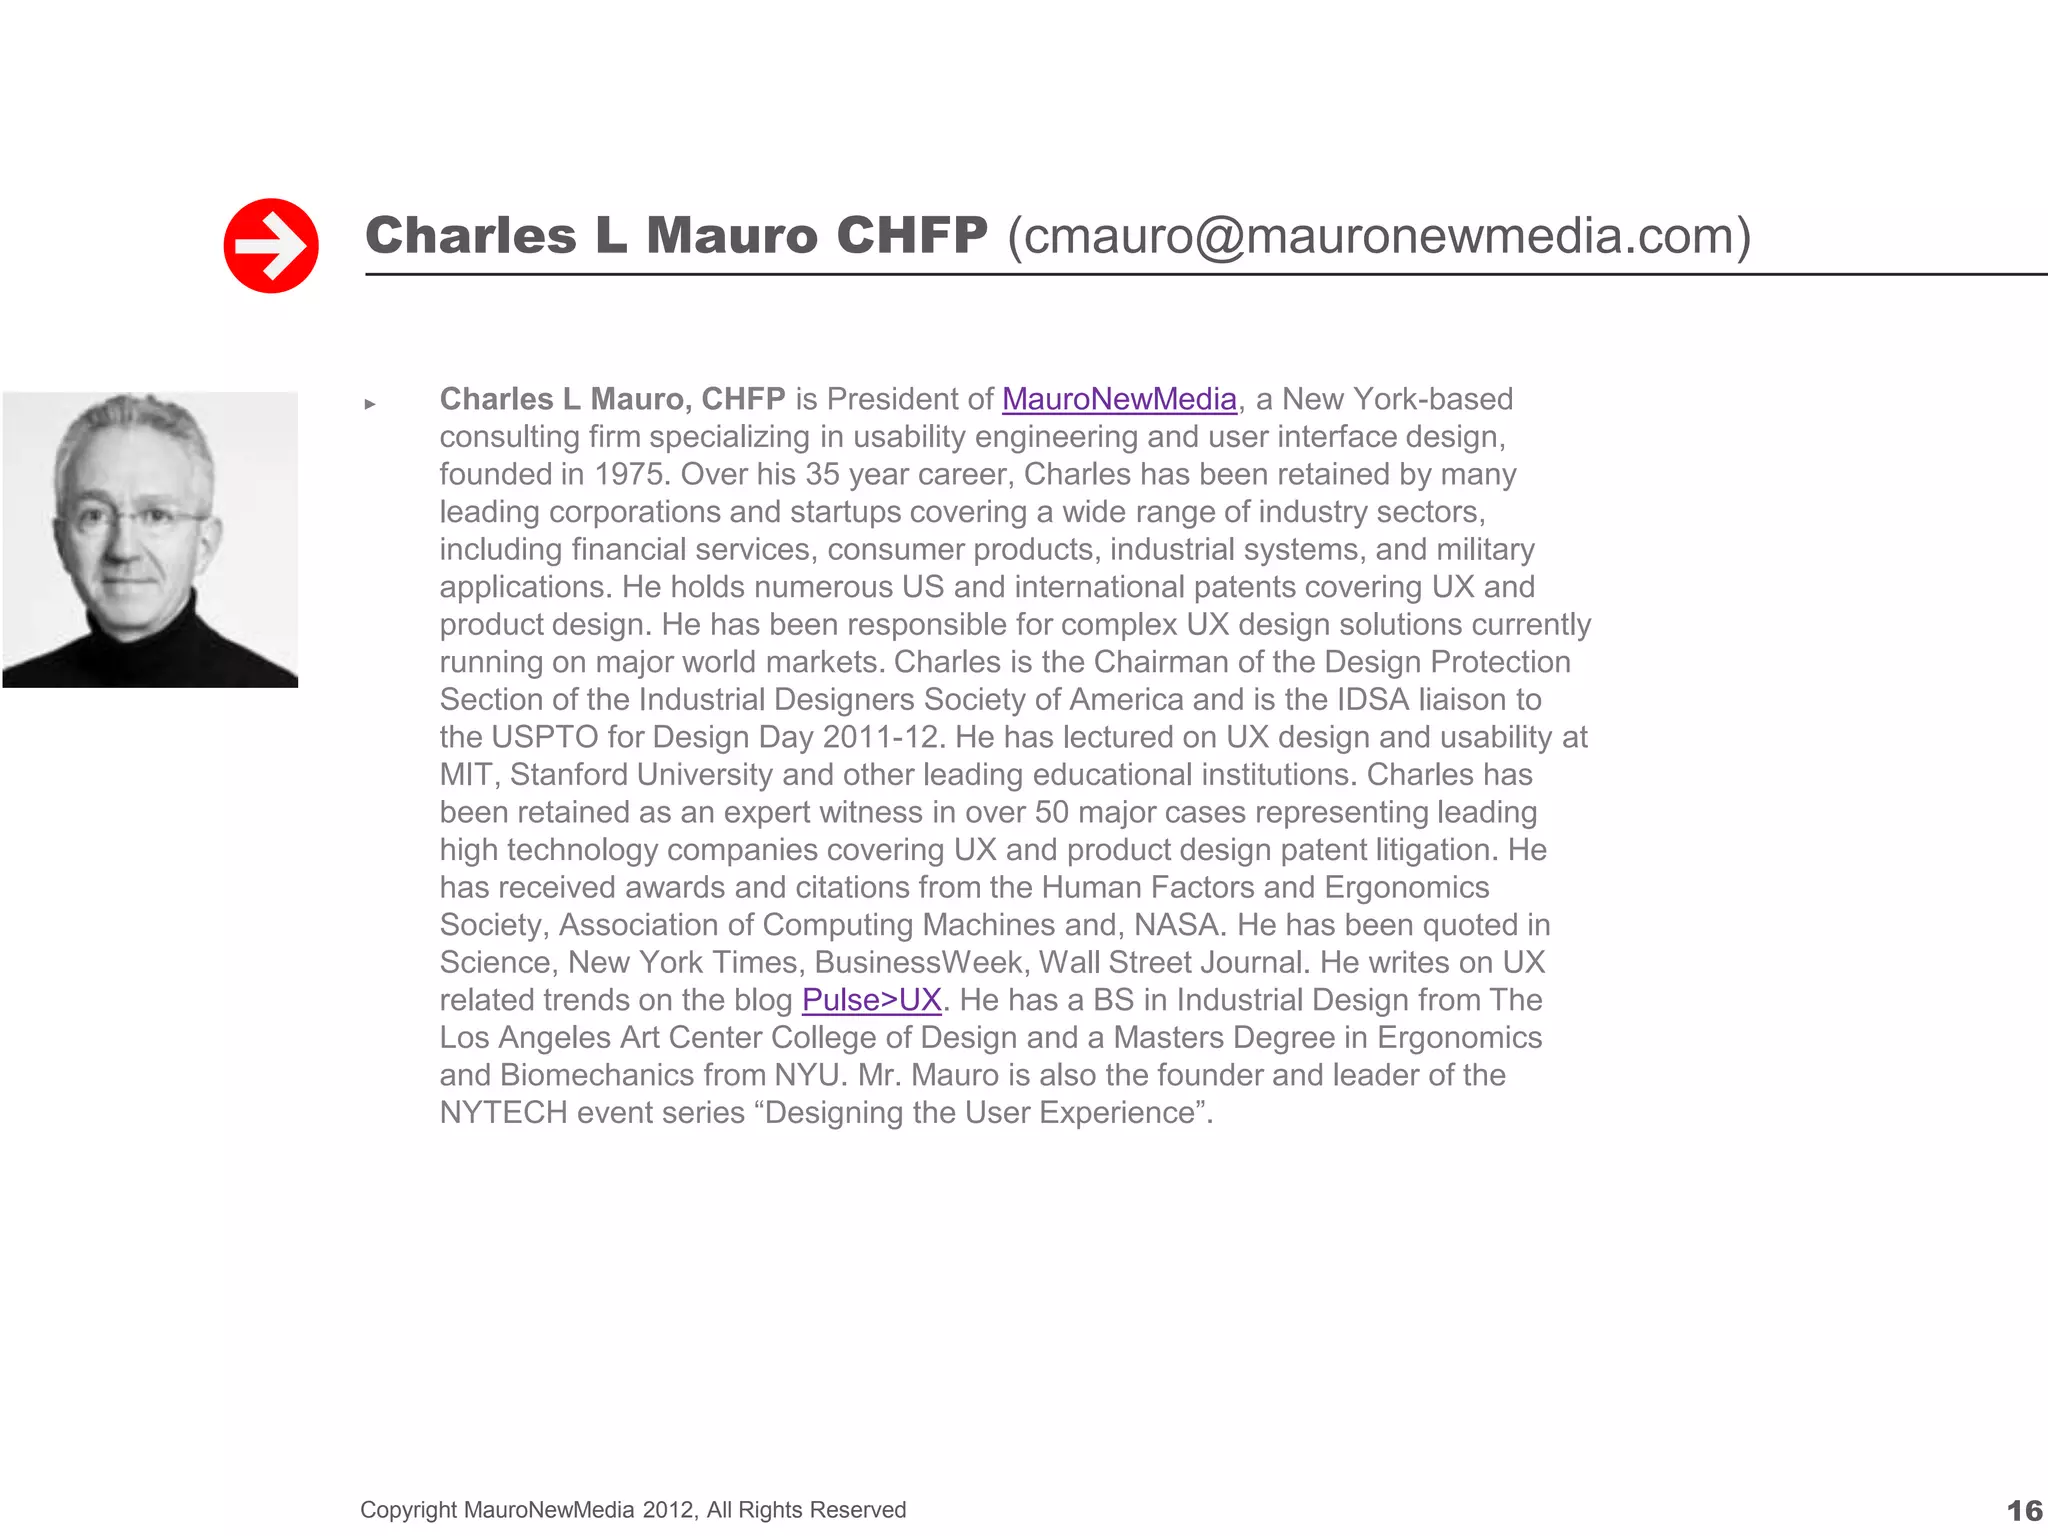
User Experience Group

Measuring Your User Experience Design
A dozen methods for ensuring user acceptance and
business success
Wednesday February 29, 2012, 6:00 PM
New York Institute of Technology
16 W. 61st St., 11th Floor Auditorium
New York, NY 10023


Organized by: Charles L Mauro CHFP
President/Founder
MauroNewMedia
23 East 73rd. Street Suite 5F
New York, NY 10021
V 212.249 3683 Ext. 101
Cmauro@MauroNewMedia.Com
Skype mauro.charles
Certified Human Factors Engineering Professional


Copyright MauroNewMedia 2012, All Rights Reserved   1
Business Objective For Measuring Your User Experience?


Earliest identification of the most critical
problems/opportunities at the least cost.


Copyright MauroNewMedia 2012, All Rights Reserved        2
Rob Tannen Ph.D. – rtannen@bresslergroup.com


►      Rob Tannen, PhD, Director of Research, Bresslergroup - Rob Tannen is an
       expert in designing products, interfaces, and systems that accommodate the
       complexities of human behavior and capabilities. He has researched cockpit
       interfaces for U.S. Air Force, designed trading floor order systems for the New York
       Stock Exchange, and created touch screen applications for consumer appliances.
       Rob is Director of Research and Interface Design at the product development firm
       Bresslergroup. He has a PhD in human factors and is a Certified Professional
       Ergonomist. He blogs on design and research trends for FastCompany.com.


Copyright MauroNewMedia 2012, All Rights Reserved                                             3
Researching the Researchers


Copyright MauroNewMedia 2012, All Rights Reserved   4
Types of Research Methods


                                                                 Quantitative
                                                                                                              12 fMRI Brain Imaging

                                                                                       10 Eye Tracking
                                         9 Online Card Sorting
                                                                                                  11 Online UX Concept Surveys
                                                                    4 Focus Groups

                                                   7 Large Sample On-Line Behavior Testing
                                                                                                         6 Lab-Based Testing
Generative                                              5 Ergonomic Observation
                                                                                                                               Evaulative
                                                                                             8 Professional
                                                                                             Heuristics


                     2 Remote Ethnography


               1 Contextual Observation


                                                                 Qualitative

             Copyright MauroNewMedia 2012, All Rights Reserved                                                                              5
Four Categories of User Research Methods


►      Document

►      Measure

►      Extension

►      Enhancement


Copyright MauroNewMedia 2012, All Rights Reserved   6
1   Methodology: Contextual Observation/Ethnography
    ►      Business problem
             ►     How are people actually using products versus how they were designed?
    ►      Description
             ►     In-depth, in-person observation of tasks & activities at work or home.
                   Observations are recorded.
    ►      Benefits
             ►     Access to the full dimensions of the user experience (e.g. information flow,
                   physical environment, social interactions, interruptions, etc)
     ►     Limitations
             ►     Time-consuming research; travel involved, Smaller sample size does not
                   provide statistical significance, Data analysis can be time consuming
    ►      Data
             ►     Patterns of observed behavior and verbatims based on participant
                   response, transcripts and video recordings
    ►      Tools
             ►     LiveScribe (for combining audio recording with note-taking)

    Cost / respondent: Low – Moderate – High
    Statistical validity: None – Some – Extensive
    Copyright MauroNewMedia 2012, All Rights Reserved                                         7
1   Methodology: Contextual Observation/Ethnography


    Copyright MauroNewMedia 2012, All Rights Reserved   8
2   Methodology: Remote Ethnography
    ►      Business problem
             ►     How are people actually using in their environment in real-time?
    ►      Description
             ►     Participants self-record activities over days or weeks with pocket video
                   cameras or mobile devices, based on tasks provided by researcher.
    ►      Benefits
             ►     Allows participants to capture activities as they happen and where they
                   happen (away from computer), without the presence of observers. Useful
                   for longitudinal research & geographically spread participants.
     ►     Limitations
             ►     Dependence on participant ability to articulate and record activities,
                   Relatively high data analysis to small sample size ratio
    ►      Data
             ►     Patterns based on participant response, transcripts and video recordings
    ►      Tools
             ►     Qualvu.com

    Cost / respondent: Low – Moderate – High
    Statistical validity: None – Some – Extensive
    Copyright MauroNewMedia 2012, All Rights Reserved                                         9
3   Methodology: Qualitative Data Analysis
    ►      Business problem
             ►     What is the meaning of subjective/unstructured data and feedback provided
                   by users?
    ►      Description
             ►     Tools for capturing and reviewing unstructured data such as interviews,
                   feedback and observed behaviors.
    ►      Benefits
             ►     Provides framework for inputting and organizing data during the research
                   activities and then to review and visualize following data gathering
     ►     Limitations
             ►     Does not define analysis method; only provides framework; Dependent on
                   quality and content of metadata inputs and tagging
    ►      Data
             ►     Tagging or grouping of text/content information into meaningful categories
    ►      Tools
             ►     ManyEyes.com, ReFramer.com,

    Cost / respondent: Low – Moderate – High
    Statistical validity: None – Some – Extensive
    Copyright MauroNewMedia 2012, All Rights Reserved                                         10
4   Methodology: Focus Groups
    ►      Business problem
             ►     What are perceptions and ideas around products/concepts?
    ►      Description
             ►     Moderated discussion group to gain concept/product feedback and inputs;
                   can include screens, physical models and other artifacts
    ►      Benefits
             ►     Efficient method for understanding end-user preferences and for getting
                   early feedback on concepts , particularly for physical or complex products
                   that benefit from hands-on exposure and explanation
     ►     Limitations
             ►     Lacks realistic context of use; Influence of participants on each other
    ►      Data
             ►     Combination of qualitative observations (like ethnographic research) with
                   quantitative data (e.g. ratings, surveys)
    ►      Tools
             ►     See qualitative data analysis

    Cost / respondent: Low – Moderate – High
    Statistical validity: None – Some – Extensive
    Copyright MauroNewMedia 2012, All Rights Reserved                                           11
5   Methodology: Observational Ergonomics
    ►      Business problem
             ►     What are the physical implications of a product design?
    ►      Description
             ►     Technique for identifying and documenting physical usability issues that
                   can include product, gestural and touch screen interactions
    ►      Benefits
             ►     Technique for identifying and documenting physical usability issues that
                   can include product, gestural and touch screen interactions
     ►     Limitations
             ►     Technique for identifying and documenting physical usability issues that
                   can include product, gestural and touch screen interactions
    ►      Data
             ►     Ergonomic issues list (frequency, priority); Visualization of ergonomic
                   issues on images or videos
    ►      Tools
             ►     RCPS (Reach/Clearance/Posture/Strength) Protocol, Comfort
                   Questionnaire, Measurement Tools (TPS)
    Cost / respondent: Low – Moderate – High
    Statistical validity: None – Some – Extensive
    Copyright MauroNewMedia 2012, All Rights Reserved                                         12
5   Methodology: Observational Ergonomics


    Copyright MauroNewMedia 2012, All Rights Reserved   13
5   Methodology: Observational Ergonomics


    Copyright MauroNewMedia 2012, All Rights Reserved   14
Universal Methods of Design


Copyright MauroNewMedia 2012, All Rights Reserved   15
Charles L Mauro CHFP (cmauro@mauronewmedia.com)


►      Charles L Mauro, CHFP is President of MauroNewMedia, a New York-based
       consulting firm specializing in usability engineering and user interface design,
       founded in 1975. Over his 35 year career, Charles has been retained by many
       leading corporations and startups covering a wide range of industry sectors,
       including financial services, consumer products, industrial systems, and military
       applications. He holds numerous US and international patents covering UX and
       product design. He has been responsible for complex UX design solutions currently
       running on major world markets. Charles is the Chairman of the Design Protection
       Section of the Industrial Designers Society of America and is the IDSA liaison to
       the USPTO for Design Day 2011-12. He has lectured on UX design and usability at
       MIT, Stanford University and other leading educational institutions. Charles has
       been retained as an expert witness in over 50 major cases representing leading
       high technology companies covering UX and product design patent litigation. He
       has received awards and citations from the Human Factors and Ergonomics
       Society, Association of Computing Machines and, NASA. He has been quoted in
       Science, New York Times, BusinessWeek, Wall Street Journal. He writes on UX
       related trends on the blog Pulse>UX. He has a BS in Industrial Design from The
       Los Angeles Art Center College of Design and a Masters Degree in Ergonomics
       and Biomechanics from NYU. Mr. Mauro is also the founder and leader of the
       NYTECH event series “Designing the User Experience”.


Copyright MauroNewMedia 2012, All Rights Reserved                                          16
How To Think About UX Performance (Engagement Pyramid)


                                 No Engagement
UX Testing
                User cannot find critical features and cannot determine how to
                                  use them if they find them.


                                Low Engagement
UX Testing
                 User can find critical features and understands how to use
                            them but has no interest in doing so.


                            Moderate Engagement
UX Testing
                 User can find critical features and understands how to use
                         them and has some interest in doing so.


                              Deep Engagement
UX Testing
                 User can find critical features and understands how to use
                              them and cannot stop doing so.


                                                                                 17
10   Methodology: Eye-Tracking


     Business Problem
          Do users see critical content and in what order?
     Description
          Respondents view content on a specialized workstation or glasses.
     Benefits
          Very accurate tracking of eye fixations and pathways.
     Limitations
          Relatively high cost, analysis is complex, data can be deceiving.
     Data
          Live eye fixations, heat maps…etc.
     Tools of Choice
          Tobii - SMI


     Cost / respondent: Low – Moderate – High
     Statistical validity: None – Some – Extensive


                                                                              18
6   Methodology: Large-Sample Online Behavior Tracking


    ►      Business problem
             ►     Major redesign of a large complex site that is business-critical?
    ►      Description
             ►     200-10,000+ respondents do tasks using online tracking / survey tools
    ►      Benefits:
             ►     Large sample size, low cost per respondent, extensive data possible
    ►      Limitations
             ►     No direct observation of users, survey design complex…other issues
    ►      Data
             ►     You name it (data exports to professional analysis tools).
    ►      Tools of Choice
             ►     Keynote WebEffective, UserZoom,


    Cost / respondent: Low – Moderate – High
    Statistical validity: None – Some – Extensive


    Copyright MauroNewMedia 2012, All Rights Reserved                                      19
Recommended Reading: Albert and Tullis


Copyright MauroNewMedia 2012, All Rights Reserved   20
7   Methodology: Lab-based UX Testing


    ►      Business problem
             ►     Are there show-stopper (CI) usability problems with your user experience?
    ►      Description
             ►     12-24 Respondents undertake structured tasks in controlled setting (Lab)
    ►      Benefits
             ►     Relatively fast, moderate cost, very graphic display of major issues
     ►     Limitations
             ►     Small sample, study design, recruiting good respondents
    ►      Data
             ►     Summary data in tabular and chart format PLUS video out-takes
    ►      Tools
             ►     Leased testing room, recruiting service and Morae (Industry Standard)

    Cost / respondent: Low – Moderate – High
    Statistical validity: None – Some – Extensive


    Copyright MauroNewMedia 2012, All Rights Reserved                                         21
Recommended Reading: Tullis and Albert


Copyright MauroNewMedia 2012, All Rights Reserved   22
8   Methodology: Professional Heuristics


    ►      Business problem
             ►     Rapid feedback on UX design based on best practices or opinions
    ►      Definition
             ►     “Heuristic is a simple procedure that helps find adequate, though often
                   imperfect, answers to difficult questions (same root as: eureka)”
    ►      Benefits
             ►     Fast, low cost, can be very effective in some applications
    ►      Limitations
             ►     No actual user data, analysis only as good as expert doing audit
    ►      Data
             ►     Ranging from verbal direction to highly detailed recommendations
    ►      Tools of Choice
             ►     Written or verbal descriptions and custom tools by each experts.
    Cost / respondent: NA
    Statistical validity: None – Some – Extensive


    Copyright MauroNewMedia 2012, All Rights Reserved                                        23
9   Methodology: Automated Online Card Sorting


    ►      Business problem
            ►    User’s cannot understand where content they want is located?
    ►      Description
             ►     Online card sorting based on terms you provide (or users create)
    ►      Benefits
             ►     Large sample size, low cost, easy to field
    ►      Limitations
             ►     Use of sorting tools confuse users, data hard to understand
    ►      Data
             ►     Standard cluster analysis charts and more
    ►      Tools of Choice
             ►      WebSort…and others


    Cost / respondent: Low – Moderate – High
    Statistical validity: None – Some – Extensive


    Copyright MauroNewMedia 2012, All Rights Reserved                                 24
10   Methodology: fMRI (Brain Imaging)


     ►      Business Problem?
              ►     What areas of the brain are being activated by UX design
     ►      Description
              ►     Respondents given visual stimulus while in FMRI scanner
     ►      Benefits
              ►     Maps design variables to core functions of the human brain
     ►      Limitations
              ►     Expensive and data can be highly misleading
     ►      Data
              ►     Brain scans
      ►     Tools
              ►     Major medical centers and research services (some consultants)


     Cost / respondent: Low – Moderate – High
     Statistical validity: None – Some – Extensive


     Copyright MauroNewMedia 2012, All Rights Reserved                               25
Always Remember


When Testing Your User Experience
Relevance + Reliability = Success


Copyright MauroNewMedia 2012, All Rights Reserved   26

NYTECH "Measuring Your User Experience Design"

  • 1.
    User Experience Group MeasuringYour User Experience Design A dozen methods for ensuring user acceptance and business success Wednesday February 29, 2012, 6:00 PM New York Institute of Technology 16 W. 61st St., 11th Floor Auditorium New York, NY 10023 Organized by: Charles L Mauro CHFP President/Founder MauroNewMedia 23 East 73rd. Street Suite 5F New York, NY 10021 V 212.249 3683 Ext. 101 Cmauro@MauroNewMedia.Com Skype mauro.charles Certified Human Factors Engineering Professional Copyright MauroNewMedia 2012, All Rights Reserved 1
  • 2.
    Business Objective ForMeasuring Your User Experience? Earliest identification of the most critical problems/opportunities at the least cost. Copyright MauroNewMedia 2012, All Rights Reserved 2
  • 3.
    Rob Tannen Ph.D.– rtannen@bresslergroup.com ► Rob Tannen, PhD, Director of Research, Bresslergroup - Rob Tannen is an expert in designing products, interfaces, and systems that accommodate the complexities of human behavior and capabilities. He has researched cockpit interfaces for U.S. Air Force, designed trading floor order systems for the New York Stock Exchange, and created touch screen applications for consumer appliances. Rob is Director of Research and Interface Design at the product development firm Bresslergroup. He has a PhD in human factors and is a Certified Professional Ergonomist. He blogs on design and research trends for FastCompany.com. Copyright MauroNewMedia 2012, All Rights Reserved 3
  • 4.
    Researching the Researchers CopyrightMauroNewMedia 2012, All Rights Reserved 4
  • 5.
    Types of ResearchMethods Quantitative 12 fMRI Brain Imaging 10 Eye Tracking 9 Online Card Sorting 11 Online UX Concept Surveys 4 Focus Groups 7 Large Sample On-Line Behavior Testing 6 Lab-Based Testing Generative 5 Ergonomic Observation Evaulative 8 Professional Heuristics 2 Remote Ethnography 1 Contextual Observation Qualitative Copyright MauroNewMedia 2012, All Rights Reserved 5
  • 6.
    Four Categories ofUser Research Methods ► Document ► Measure ► Extension ► Enhancement Copyright MauroNewMedia 2012, All Rights Reserved 6
  • 7.
    1 Methodology: Contextual Observation/Ethnography ► Business problem ► How are people actually using products versus how they were designed? ► Description ► In-depth, in-person observation of tasks & activities at work or home. Observations are recorded. ► Benefits ► Access to the full dimensions of the user experience (e.g. information flow, physical environment, social interactions, interruptions, etc) ► Limitations ► Time-consuming research; travel involved, Smaller sample size does not provide statistical significance, Data analysis can be time consuming ► Data ► Patterns of observed behavior and verbatims based on participant response, transcripts and video recordings ► Tools ► LiveScribe (for combining audio recording with note-taking) Cost / respondent: Low – Moderate – High Statistical validity: None – Some – Extensive Copyright MauroNewMedia 2012, All Rights Reserved 7
  • 8.
    1 Methodology: Contextual Observation/Ethnography Copyright MauroNewMedia 2012, All Rights Reserved 8
  • 9.
    2 Methodology: Remote Ethnography ► Business problem ► How are people actually using in their environment in real-time? ► Description ► Participants self-record activities over days or weeks with pocket video cameras or mobile devices, based on tasks provided by researcher. ► Benefits ► Allows participants to capture activities as they happen and where they happen (away from computer), without the presence of observers. Useful for longitudinal research & geographically spread participants. ► Limitations ► Dependence on participant ability to articulate and record activities, Relatively high data analysis to small sample size ratio ► Data ► Patterns based on participant response, transcripts and video recordings ► Tools ► Qualvu.com Cost / respondent: Low – Moderate – High Statistical validity: None – Some – Extensive Copyright MauroNewMedia 2012, All Rights Reserved 9
  • 10.
    3 Methodology: Qualitative Data Analysis ► Business problem ► What is the meaning of subjective/unstructured data and feedback provided by users? ► Description ► Tools for capturing and reviewing unstructured data such as interviews, feedback and observed behaviors. ► Benefits ► Provides framework for inputting and organizing data during the research activities and then to review and visualize following data gathering ► Limitations ► Does not define analysis method; only provides framework; Dependent on quality and content of metadata inputs and tagging ► Data ► Tagging or grouping of text/content information into meaningful categories ► Tools ► ManyEyes.com, ReFramer.com, Cost / respondent: Low – Moderate – High Statistical validity: None – Some – Extensive Copyright MauroNewMedia 2012, All Rights Reserved 10
  • 11.
    4 Methodology: Focus Groups ► Business problem ► What are perceptions and ideas around products/concepts? ► Description ► Moderated discussion group to gain concept/product feedback and inputs; can include screens, physical models and other artifacts ► Benefits ► Efficient method for understanding end-user preferences and for getting early feedback on concepts , particularly for physical or complex products that benefit from hands-on exposure and explanation ► Limitations ► Lacks realistic context of use; Influence of participants on each other ► Data ► Combination of qualitative observations (like ethnographic research) with quantitative data (e.g. ratings, surveys) ► Tools ► See qualitative data analysis Cost / respondent: Low – Moderate – High Statistical validity: None – Some – Extensive Copyright MauroNewMedia 2012, All Rights Reserved 11
  • 12.
    5 Methodology: Observational Ergonomics ► Business problem ► What are the physical implications of a product design? ► Description ► Technique for identifying and documenting physical usability issues that can include product, gestural and touch screen interactions ► Benefits ► Technique for identifying and documenting physical usability issues that can include product, gestural and touch screen interactions ► Limitations ► Technique for identifying and documenting physical usability issues that can include product, gestural and touch screen interactions ► Data ► Ergonomic issues list (frequency, priority); Visualization of ergonomic issues on images or videos ► Tools ► RCPS (Reach/Clearance/Posture/Strength) Protocol, Comfort Questionnaire, Measurement Tools (TPS) Cost / respondent: Low – Moderate – High Statistical validity: None – Some – Extensive Copyright MauroNewMedia 2012, All Rights Reserved 12
  • 13.
    5 Methodology: Observational Ergonomics Copyright MauroNewMedia 2012, All Rights Reserved 13
  • 14.
    5 Methodology: Observational Ergonomics Copyright MauroNewMedia 2012, All Rights Reserved 14
  • 15.
    Universal Methods ofDesign Copyright MauroNewMedia 2012, All Rights Reserved 15
  • 16.
    Charles L MauroCHFP (cmauro@mauronewmedia.com) ► Charles L Mauro, CHFP is President of MauroNewMedia, a New York-based consulting firm specializing in usability engineering and user interface design, founded in 1975. Over his 35 year career, Charles has been retained by many leading corporations and startups covering a wide range of industry sectors, including financial services, consumer products, industrial systems, and military applications. He holds numerous US and international patents covering UX and product design. He has been responsible for complex UX design solutions currently running on major world markets. Charles is the Chairman of the Design Protection Section of the Industrial Designers Society of America and is the IDSA liaison to the USPTO for Design Day 2011-12. He has lectured on UX design and usability at MIT, Stanford University and other leading educational institutions. Charles has been retained as an expert witness in over 50 major cases representing leading high technology companies covering UX and product design patent litigation. He has received awards and citations from the Human Factors and Ergonomics Society, Association of Computing Machines and, NASA. He has been quoted in Science, New York Times, BusinessWeek, Wall Street Journal. He writes on UX related trends on the blog Pulse>UX. He has a BS in Industrial Design from The Los Angeles Art Center College of Design and a Masters Degree in Ergonomics and Biomechanics from NYU. Mr. Mauro is also the founder and leader of the NYTECH event series “Designing the User Experience”. Copyright MauroNewMedia 2012, All Rights Reserved 16
  • 17.
    How To ThinkAbout UX Performance (Engagement Pyramid) No Engagement UX Testing User cannot find critical features and cannot determine how to use them if they find them. Low Engagement UX Testing User can find critical features and understands how to use them but has no interest in doing so. Moderate Engagement UX Testing User can find critical features and understands how to use them and has some interest in doing so. Deep Engagement UX Testing User can find critical features and understands how to use them and cannot stop doing so. 17
  • 18.
    10 Methodology: Eye-Tracking Business Problem Do users see critical content and in what order? Description Respondents view content on a specialized workstation or glasses. Benefits Very accurate tracking of eye fixations and pathways. Limitations Relatively high cost, analysis is complex, data can be deceiving. Data Live eye fixations, heat maps…etc. Tools of Choice Tobii - SMI Cost / respondent: Low – Moderate – High Statistical validity: None – Some – Extensive 18
  • 19.
    6 Methodology: Large-Sample Online Behavior Tracking ► Business problem ► Major redesign of a large complex site that is business-critical? ► Description ► 200-10,000+ respondents do tasks using online tracking / survey tools ► Benefits: ► Large sample size, low cost per respondent, extensive data possible ► Limitations ► No direct observation of users, survey design complex…other issues ► Data ► You name it (data exports to professional analysis tools). ► Tools of Choice ► Keynote WebEffective, UserZoom, Cost / respondent: Low – Moderate – High Statistical validity: None – Some – Extensive Copyright MauroNewMedia 2012, All Rights Reserved 19
  • 20.
    Recommended Reading: Albertand Tullis Copyright MauroNewMedia 2012, All Rights Reserved 20
  • 21.
    7 Methodology: Lab-based UX Testing ► Business problem ► Are there show-stopper (CI) usability problems with your user experience? ► Description ► 12-24 Respondents undertake structured tasks in controlled setting (Lab) ► Benefits ► Relatively fast, moderate cost, very graphic display of major issues ► Limitations ► Small sample, study design, recruiting good respondents ► Data ► Summary data in tabular and chart format PLUS video out-takes ► Tools ► Leased testing room, recruiting service and Morae (Industry Standard) Cost / respondent: Low – Moderate – High Statistical validity: None – Some – Extensive Copyright MauroNewMedia 2012, All Rights Reserved 21
  • 22.
    Recommended Reading: Tullisand Albert Copyright MauroNewMedia 2012, All Rights Reserved 22
  • 23.
    8 Methodology: Professional Heuristics ► Business problem ► Rapid feedback on UX design based on best practices or opinions ► Definition ► “Heuristic is a simple procedure that helps find adequate, though often imperfect, answers to difficult questions (same root as: eureka)” ► Benefits ► Fast, low cost, can be very effective in some applications ► Limitations ► No actual user data, analysis only as good as expert doing audit ► Data ► Ranging from verbal direction to highly detailed recommendations ► Tools of Choice ► Written or verbal descriptions and custom tools by each experts. Cost / respondent: NA Statistical validity: None – Some – Extensive Copyright MauroNewMedia 2012, All Rights Reserved 23
  • 24.
    9 Methodology: Automated Online Card Sorting ► Business problem ► User’s cannot understand where content they want is located? ► Description ► Online card sorting based on terms you provide (or users create) ► Benefits ► Large sample size, low cost, easy to field ► Limitations ► Use of sorting tools confuse users, data hard to understand ► Data ► Standard cluster analysis charts and more ► Tools of Choice ► WebSort…and others Cost / respondent: Low – Moderate – High Statistical validity: None – Some – Extensive Copyright MauroNewMedia 2012, All Rights Reserved 24
  • 25.
    10 Methodology: fMRI (Brain Imaging) ► Business Problem? ► What areas of the brain are being activated by UX design ► Description ► Respondents given visual stimulus while in FMRI scanner ► Benefits ► Maps design variables to core functions of the human brain ► Limitations ► Expensive and data can be highly misleading ► Data ► Brain scans ► Tools ► Major medical centers and research services (some consultants) Cost / respondent: Low – Moderate – High Statistical validity: None – Some – Extensive Copyright MauroNewMedia 2012, All Rights Reserved 25
  • 26.
    Always Remember When TestingYour User Experience Relevance + Reliability = Success Copyright MauroNewMedia 2012, All Rights Reserved 26

Editor's Notes

  • #9 Livescribe
  • #19 Business question: How are users actually viewing your content (in what order, for how long and in what specific pattern or pathways)?Audience question: Have you wondered if critical links, buttons or content messaging is being viewed on a critical page?Description: this methodology is very useful when trying to determine why certain homepage metrics from analytics programs are of concern (not clicking on value proposition element…etc.)The respondent sits at a specialized computer screen and undergoes a simple calibration sequence. Respondent is given a stimulus question or task (active or passive) (show homepage for set period of time 15 seconds)System tracks eye pathways and fixations and produces a data file from that task.Important things to know about eye-tracking Tobii not designed for web sites or changing visual stimulus)This makes actual testing of web navigation (changing from page to page) very complex to actually analyze and not accurateVery effective for single stimulus presentations of fixed durationsExcellent for detailed analysis of home pages or critical landing pages and forms Very insightful for assessing impact of advertizing on homepage visual scanning.
  • #20 Business question: Is anyone working on a major (large-scale) site launch or redesign that your company depends on for survival?
  • #22 Audience question: “How many of you have a project at the point where it is ready for major commitment? (round A, new release, major new upgrade) I have a web site, software or product and I am about to commit major funding or resources to next phase of developmentDo I have usability problems with the user experience that are basically show stoppers Users cannot download the application Users cannot log in Users cannot set up a profile pageUsers cannot navigate to critical content 1-3 critical tasks in 60 min.
  • #24 Business question: Do any of you have new development team that has minimal UX / Usability experience? Is your team employing best practices and are they aware of the key UX and Usability performance issues that an effective solution must meet.Description: A highly experienced usability / UI design expert conducts a structured audit of your system or product and rates the system on best practices and estimated performanceInterview and select an expert who has direct experience in your product category and sectorExpert gathers information from your development team and conducts structured audit based on predetermined best practices. Expert presents findings to your team (sometimes not a happy experience for UX design teams without knowledge of formal UCD methods.Very effective early in development and can be repeated with updates at less cost.
  • #25 Business problem: How do I organize information like content, navigation, overall IA so that users understand it?Description: this is an automated version of the classic card sorting studies where you give users a pile of index cards with your content descriptions on them and ask them to sort the cards into groups according to how they relate to the content. Example: If I have a bunch of content categories how do I determine what the groupings are and the high level navigation labels? Lets say you have a site selling women’s underwear and you what to create a navigation structure that matches the users mental model. So do you organize the site by type of underwear on top level and styles, colors, or do you organize the site navigation by life style like (athletic, everyday, intimate) and they by type of article color, and price. Respondents are invited to an online study via email.When they agree they encounter a screen with a list of labels or terms in one column and are asked to sort the terms into groups they find organizationally relevant. When they are finished you can give them another card sort of just finish the study. When the required number of respondents are finished with the card sort you can view the dataCard sorting data is analyzed through the application of cluster analysis (not that easy to understand but very useful)