Introduction
Spectroscopy is thebranch of science that deals
with the measurement and interpretation of
ELECTROMAGNETIC RADIATION (EMR) absorbed
or emitted when the molecules or the atoms or
ions of the sample move from one energy state to
another.
At ground state, the energy of the molecule is the
sum total of rotational, vibrational and electronic
energies.
3.
EMR is mostmade up of discrete particles called photons. EMR
possess both wave and particle characteristics, i.e. it can travel in
vacuum also.
The different types of EMR are Visible, Infra Red, Microwaves,
Radio waves, X-rays, Gamma rays or Cosmic rays.
The energy of the radiation depends upon the frequency and the
wavelength of the radiation.
ENERGY OF EMR:
E = hv
Where; E = Energy of radiation
h = Plank’s constant (6.625 x 10⁻³⁴ J/sec)
v = Frequency of radiation
4.
Absorption and theemission of energy in the
electromagnetic spectrum take place in distinct separate
pockets or photons
Energy of a photon and the frequency matching its
propagation are related as E = hν
where, E = Energy (ergs), ν = Frequency (cycles sec– 1),
h = Universal constant termed as Planck’s constant
(6.6256 × 10– 27 erg sec)
Wavelength and frequency are related as
ν = c/λ ...where, λ = Wavelength (cms), c = velocity of
propagation of radiant energy in vacuum (which is
nothing but the speed of light in vacuum ; and is
equivalent to 2.9979 × 1010 cm sec– 1).
5.
The radiant powerof a beam is directly proportional to
the number of photons per second that are
propagated in the beam.
Monochromatic Beam : A beam that carries radiation
of only one distinctly separate wave length is known as
monochromatic.
Polychromatic or Heterochromatic : A beam that
carries radiation of several wavelengths is termed as
polychromatic or heterochromatic.
6.
Most organic moleculesand functional groups are
transparent in the portions of the electromagnetic
spectrum- ultraviolet (UV) and visible (VIS) regions
Wavelengths range from 190 nm to 800 nm
The electromagnetic spectrum consists of a span of all
electromagnetic radiation which further contains many
subranges
These can be further classified as radio waves,
microwaves, infrared radiation, visible light, ultra-violet
radiation, X-rays, gamma rays and cosmic rays in the
increasing order of frequency and decreasing order of
wavelength.
9.
Principles of spectroscopy
Theprinciple is based on the measurement of
spectrum of a sample containing atoms/ molecules.
Spectrum is a graph of intensity of absorbed or
emitted radiation by sample verses frequency (ν) or
wavelength (λ).
Spectrometer is an instrument design to measure
the spectrum of a compound.
10.
Principles of spectroscopy
1.Absorption Spectroscopy:
An analytical technique which concerns with the measurement
of absorption of electromagnetic radiation.
Example:
UV (185 - 400 nm) / Visible (400 - 800 nm) Spectroscopy,
IR Spectroscopy (0.76 - 15 μm)
11.
Principles of spectroscopy
2.Emission Spectroscopy:
An analytical technique in which emission (of a particle or
radiation) is dispersed according to some property of the
emission & the amount of dispersion is measured.
Example:
Mass Spectroscopy
12.
Ultra violet Spectroscopy-Principle
This is the earliest method of molecular spectroscopy.
It is concerned with the study of absorption of UV radiation
which ranges from 200 nm to 400 nm.
Near UV Region: 200 nm to 400 nm
Far UV Region: below 200 nm
The colored compounds absorb radiations from 400 nm to
800 nm, but colorless compounds absorb in the UV region.
The valence electrons absorb energy, thereby molecule
undergoes electronic transition from ground state to
excited state.
13.
The absorption efficiencyof an analyte is affected
by:
The nature of the analyte
The number of available microstates
The solvent
The absorption efficiency of an analyte generally not affected by:
Other (low conc.) solutes
Temperature (within reason)
Concentration
This makes absorption spectroscopy one of the few bioanalytical
methods where the signal intensity is directly proportional to
the concentration.
14.
When continuous radiationpasses through a
transparent material, a portion of the radiation may be
absorbed.
The residual radiation, when it is passed through a
prism, yields a spectrum with gaps in it, called an
absorption spectrum.
Hence atoms or molecules pass from a state of low
energy (the initial, or ground state) to a state of higher
energy (the excited state).
The Principle of UV-Visible Spectroscopy is based
on the absorption of ultraviolet light or visible
light by chemical compounds, which results in
the production of distinct spectra.
15.
• Light Absorbance:
LightTransmission
where
I0: Light Intensity entering a sample
I1: Light Intensity exiting a sample
C: The concentration of analyte in sample
L: The length of the light path in glass sample cuvette
: a constant for a particular solution and wave length
Ɛ
cl
I
I
A
)
/
log( 0
1
cl
I
I
T
10
)
/
( 0
1
Beer Lambert Law
16.
Ground State :Here, both π electrons are in the π orbital.
This configuration is designated as π² , where the
superscript represents the number of electrons in that
orbital.
Excited State : Here, an electron is in the π orbital while
the other in the π* orbital (having an opposite spin). Thus,
the resulting configuration ππ* is obviously less stable
due to the fact that : (i) only one electron helps to hold
the atom together, and (ii) the other electron tends to
force them apart
The electromagnetic radiation that is absorbed has
energy exactly equal to the energy difference between
the excited and ground states.
σ → σ* transition
The energy required is highest for this transition than others.
Saturated compounds usually show this type of transition.
These peaks appear in vacuum UV or far UV region i.e. 125-135
nm.
Example:
Methane (CH4) has C-H bond only and can undergo σ → σ*
transition and shows absorbance maxima at 125 nm.
20.
n → π*transition
• An electron from non-bonding orbital is promoted to
anti-bonding π* orbital.
• Compounds containing double bond involving hetero
atoms (C=O, C≡N, N=O) undergo such transitions.
• n → π* transitions require minimum energy and show
absorption at longer wavelength around 300 nm.
21.
π → π*transition
• π electron in a bonding orbital is excited to
corresponding anti-bonding orbital π*.
• Compounds containing multiple bonds like alkenes,
alkynes, carbonyl, nitriles, aromatic compounds, etc
undergo π → π* transitions.
Example:
Alkenes generally absorb in the region 170 to 205
nm.
22.
n → σ* transition
• Saturated compounds containing atoms with lone
pair of electrons like O, N, S and halogens are
capable of n → σ* transition.
• These transitions usually requires less energy than σ
→ σ* transitions.
• The number of organic functional groups with n →
σ* peaks in UV region is small (150 – 250 nm).
23.
Beer-Lambert Law
The greaterthe number of molecules capable of absorbing light of a given
wavelength, the greater the extent of light absorption
According to the Beer-Lambert Law the absorbance is proportional to the
concentration of the substance in solution
Hence UV-visible spectroscopy can also be used to measure the concentration of
a sample.
A = log(I○/I ) = ɛcl for a given wavelength
A = absorbance
I○ = intensity of light incident upon sample cell
I = intensity of light leaving sample cell
c = molar concentration of solute
l = length of sample cell (cm)
ɛ = molar absorptivity; s constant for a particular substance at a particular
wavelength (dm3 mol-1 cm-1)
24.
Spectrum
If the absorbanceof a series of sample solutions of
known concentrations are measured and plotted
against their corresponding concentrations, the plot
of absorbance versus concentration should be linear if
the Beer-Lambert Law is obeyed. This graph is known
as a calibration graph.
A calibration graph can be used to determine the
concentration of unknown sample solution by
measuring its absorbance, as illustrated beside.
26.
LAWOFLIGHTABSORPTION-BEERLAMBERT`SLAW
There are thetwo empirical laws, which govern the
absorption of light by molecules.
Beer’s law relates the absorption to the
concentration of absorbing solute and Lambert’s
law relates the total absorption of optical path
length. They are most conveniently used as the
Beer-Lambert’s Law.
According to the Beer-Lambert’s Law: “The
intensity of the absorption is directly proportional to
the concentration of the sample and the path length
of the sample.”
27.
Mathematical equation forBeer-Lambert’s Law:
A = ℮CT
Where;
A = Absorbance or Optical Density
℮ = Molecular Extinction Coefficient
C = Concentration of the drug (m mol/lit)
T = Path length (usually 10mm or 1cm)
28.
DEVIATIONS FROM BEER`S
LAW
DILUTESOLUTIONS (TRUE DEVIATIONS):
Applicable for dilute solutions only. The index of refraction for the
absorbed radiation is changed at high concentration and hence,
Beer’s law is not obeyed.
INSTRUMENTAL DEVIATIONS:
Instrumental deviations are due to:
Stray radiation reaching the detector
Sensitivity changes in the detector employed
Fluctuation of radiation source
Defect in detector amplification system
29.
CHEMICAL DEVIATIONS:
The absorbingspecies in the solution may undergo ionization,
dissociation or even may react with the solvent. These
processes may produce two or more species in the solution
with varying absorptivity values.
It can be corrected by the use of buffers, choosing suitable
solvent and by selecting appropriate narrow band of
wavelength for measurements.
30.
Limitations of Beer-Lambertlaw
Beer law and Lambert law is capable of describing absorption
behavior of solutions containing relatively low amounts of solutes
dissolved in it (<10mM). When the concentration of the analyte in
the solution is high (>10mM), the analyte begins to behave
differently due to interactions with the solvent and other solute
molecules and at times even due to hydrogen bonding interactions
At high concentrations, solute molecules can cause different
charge distribution on their neighboring species in the solution.
Since UV-visible absorption is an electronic phenomenon, high
concentrations would possibly result in a shift in the absorption
wavelength of the analyte.
31.
Due to theanalyte molecules association, dissociation and
interaction with the solvent a product with different absorption
characteristics are observed
For example, phenol red undergoes a resonance transformation
when moving from the acidic form (yellow) to the basic form (red).
Due to this resonance, the electron distribution of the bonds of
molecule changes with the pH of the solvent in which it is dissolved.
Since UV-visible spectroscopy is an electron-related phenomenon,
the absorption spectrum of the sample changes with the change in
pH of the solvent.
It is observed that the deviations in absorbance over wavelengths is
minimal when the wavelength observed is at the λmax. Due to this
reason absorption measurements are taken at wavelengths.
Lambda max (λmax): The wavelength at which a substance has its
strongest photon absorption (highest point along the spectrum's y-
axis). This ultraviolet-visible spectrum for lycopene has λmax = 471 nm.
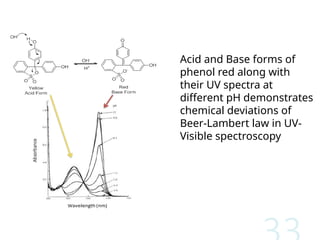
33.
Acid and Baseforms of
phenol red along with
their UV spectra at
different pH demonstrates
chemical deviations of
Beer-Lambert law in UV-
Visible spectroscopy
34.
Due to MismatchedCells or Cuvettes
If the cells holding the analyte and the blank solutions are
having different path-lengths, or unequal optical
characteristics, it is obvious that there would be a
deviation observed in Beer-Lambert law. In such cases
when a plot of absorbance versus concentration is made,
the curve will have an intercept k and the equation will be
defined as:
A = εbc + k
In today’s instrument this problem is generally not
observed, however if it is present, appropriate linear
regression to quantify this deviation must be made.
35.
Spectrum
Absorption spectra maybe
presented in a number of
fashions
A) Wavelength Vs Absorbance
B) Wavelength Vs Molar
Absorptivity
C) Wavelength Vs
Transmittance
36.
SOLVENTS
• The choiceof the solvent to be used in ultraviolet spectroscopy is
quite important.
• The first criterion for a good solvent is that it should not absorb
ultraviolet radiation in the same region as the substance whose
spectrum is being determined.
• Usually, solvents that do not contain conjugated systems are most
suitable for this purpose.
• Some common ultraviolet spectroscopy solvents and their cutoff
points or minimum regions of transparency are listed here.
• Water, 95% ethanol, and hexane are most commonly used
3
6
37.
A second criterionfor a
good solvent is its effect on
the fine structure of an
absorption band
Below figure illustrates the
effects of polar and
nonpolar solvents on an
absorption band.
A nonpolar solvent does not hydrogen bond with the solute,
and the spectrum of the solute closely approximates the
spectrum that would be produced in the gaseous state, in
which fine structure is often observed.
In a polar solvent, the hydrogen bonding forms a solute–
solvent complex, and the fine structure may disappear.
38.
A third criterionfor a good solvent is its ability to influence the
wavelength of ultraviolet light that will be absorbed via
stabilization of either the ground or the excited state.
Polar solvents do not form hydrogen bonds as readily with the
excited states of polar molecules as with their ground states, and
these polar solvents increase the energies of electronic
transitions in the molecules.
Polar solvents shift transitions to shorter wavelengths.
On the other hand, in some cases the excited states may form
stronger hydrogen bonds than the corresponding ground states.
In such a case, a polar solvent shifts an absorption to longer
wavelength since the energy of the electronic transition is
decreased.
39.
Chromophore
The part ofa molecule responsible for imparting color, are
called as chromophores.
OR
The functional groups containing multiple bonds capable of
absorbing radiations above 200 nm due to n → π* & π → π*
transitions.
e.g. NO2, N=O, C=O, C=N, C≡N, C=C, C=S, etc
40.
Chromophore
To interpret UV– visible spectrum following points
should be noted:
1. Non-conjugated alkenes show an intense absorption
below 200 nm & are therefore inaccessible to UV
spectrophotometer.
2. Non-conjugated carbonyl group compound give a
weak absorption band in the 200 - 300 nm region.
Example:
Acetone has λmax = 279 nm
Cyclohexane has λmax = 291 nm.
41.
Chromophore
When double bondsare conjugated in a compound λmax is shifted to
longer wavelength.
Example:
1,5 - hexadiene has λmax = 178 nm
2,4 - hexadiene has λmax = 227 nm
3. Conjugation of C=C and carbonyl group shifts the λmax of both
groups to longer wavelength.
Example:
Ethylene has λmax = 171 nm
Acetone has λmax = 279 nm
42.
Auxochrome
The functional groupsattached to a chromophore which modifies
the ability of the chromophore to absorb light , altering the
wavelength or intensity of absorption.
OR
The functional group with non-bonding electrons that does not
absorb radiation in near UV region but when attached to a
chromophore alters the wavelength & intensity of absorption.
Examples:
Benzene λmax = 255 nm Phenol λmax = 270 nm Aniline λmax = 280 nm
OH NH2
The typical ultraviolet–visiblespectrophotometer consists of
a light source
a monochromator and
a detector.
Light source: It is usually a deuterium lamp, which emits
electromagnetic radiation in the ultraviolet region of the spectrum.
A second light source, a tungsten lamp, is used for wavelengths in the
visible region of the spectrum.
Monochromator: It is a diffraction grating; its role is to spread the beam
of light into its component wavelengths.
A system of slits focuses the desired wavelength on the sample cell. The
light that passes through the sample cell reaches the detector, which
records the intensity of the transmitted (I).
Detector It isgenerally a photomultiplier tube, although in modern
instruments photodiodes are also used.
In a typical double-beam instrument, the light emanating from the light
source is split into two beams, the sample beam and the reference
beam. When there is no sample cell in the reference beam, the detected
light is taken to be equal to the intensity of light entering the sample (Io)
The sample cell must be constructed of a material that is transparent to
the electromagnetic radiation being used in the experiment.
For spectra in the visible range of the spectrum, cells composed of glass
or plastic are generally suitable.
For measurements in the ultraviolet region of the spectrum, however,
glass and plastic cannot be used because they absorb ultraviolet
radiation. Instead, cells made of quartz must be used since quartz does
not absorb radiation in this region.
51.
A modern improvementon the traditional spectrophotometer is
the diode-array spectrophotometer.
A diode array consists of a series of photodiode detectors
positioned side by side on a silicon crystal.
Each diode is designed to record a narrow band of the spectrum.
The diodes are connected so that the entire spectrum is
recorded at once. This type of detector has no moving parts and
can record spectra very quickly.
Furthermore, its output can be passed to a computer, which can
process the information and provide a variety of useful output
formats. Since the number of photodiodes is limited, the speed
and convenience described here are obtained at some small cost
in resolution. For many applications, however, the advantages of
this type of instrument outweigh the loss of resolution.
Recorders
Display devices: Thedata from a detector are displayed by a
readout device, such as an analog meter, a light beam reflected
on a scale, or a digital display , or LCD .
The output can also be transmitted to a computer or printer.
THE WOODWARD–FIESER RULES
Conjugateddienes/trienes
In general, conjugated dienes exhibit an intense band in the
region from 217 to 245 nm, owing to a pi-pi * transition
Repulsion between terminal lobes of Ψ2 increases energy of
HOMO (Ψ2) in s-cis form.
Hence, less energy (ie. Higher wavelength) is required for Ψ2 è
Ψ3 * transition.
57.
• Alkyl substitutionproduces bathochromic shifts and hyperchromic effects
• However, with certain patterns of alkyl substitution, the wavelength increases but the intensity
decreases.
• The 1,3-dialkylbutadienes possess too much crowding between alkyl groups to permit them to
exist in the s-trans conformation
• They convert, by rotation around the single bond which absorbs at longer wavelengths but with
lower intensity
• By studying a vast number of dienes of each type, Woodward and Fieser devised an empirical
correlation of structural variations that enables us to predict the wavelength at which a
conjugated diene will absorb
59.
Calculation of λmax
Eachtype of diene or triene system is having a
certain fixed value at which absorption takes place;
this constitutes the Base value or Parent value.
The contribution made by various alkyl substituents or
ring residue, double bond extending conjugation and
polar groups such as –Cl, -Br etc are added to the
basic value to obtain λmax for a particular compound
Homoannular Diene:- Cyclic diene having
conjugated double bonds in same rings
Heteroannular Diene:- Cyclic diene having
conjugated double bonds in different rings
60.
Exocyclic Double Bonds
Thesetypes of bonds are covalent chemical bonds
which contain two carbon atoms bonded to each
other via a sigma (σ) bond and a pi bond.
This type of double bonds has one of the two carbon
atoms in the ring structure.
The name exocyclic refers to the presence of the
double bond external to the cyclic structure.
But this double bond is still connected to the cyclic
structure via one of the two double-bonded carbon
atoms.
61.
Endocyclic Double Bonds
Thesetypes of double bonds are covalent chemical
bonds that contain two carbon atoms bonded to each
other via a sigma (σ) bond and a pi bond
These covalent chemical bonds have both carbon
atoms of the double bond in the ring structure.
In other words, both carbon atoms of the endocyclic
double bond are members of the cyclic structure
62.
Identification of Exocyclicbond
Any double bond which is outside the ring A but is
directly attached to the ring
63.
Increment values
Ring residues:Attachment of the rings: When chemical bonds
are opened ring will be opened
Shouldn't break the ring in between chromophore
Extended conjugation: Extra double bond
• Conjugated Trienesystem
• Both homoannular and heteroannular
are there
• Since base value is more for
homoannular than heteroannular ring
system we have to consider
homoannular base value
• Acyclic/Open chain system
• No extended conjugation
• No exocyclic bonds since not a cyclic
system
69.
THE WOODWARD–FIESER RULES
Enones
heconjugation of a double bond with a carbonyl group leads to
intense absorption due to a pi-pi * transition of the carbonyl
group
The absorption is found between 220 and 250 nm in simple
enones
The n-p * transition is much less intense and appears at 310 to
330 nm
7
4
a,b-Unsaturated aldehydes generallyfollow the same rules as enones except
that their absorptions are displaced by about 5 to 8 nm toward shorter
wavelength than those of the corresponding ketones
Benzoyl derivatives:
76.
Applications
1. Concentration measurement
Preparesamples
Make series of standard solutions of known concentrations
− Set spectrophotometer to the λ of maximum light absorption
− Measure the absorption of the unknown, and from the standard plot, read
the related concentration
77.
2. Detection ofImpurities
UV absorption spectroscopy is one of the best methods for determination of
impurities in organic molecules.
Additional peaks can be observed due to impurities in the sample and it can
be compared with that of standard raw material.
Applications
78.
3. Structure elucidationof organic compounds.
From the location of peaks and combination of peaks,
UV spectroscopy elucidate structure of organic molecules:
the presence or absence of unsaturation,
the presence of hetero atoms.
4. Chemical kinetics
Kinetics of reaction can also be studied using UV spectroscopy.
The UV radiation is passed through the reaction cell and the
absorbance changes can be observed.
Applications
79.
Applications
5. Detection ofFunctional Groups
Absence of a band at particular wavelength regarded as an
evidence for absence of particular group.
80.
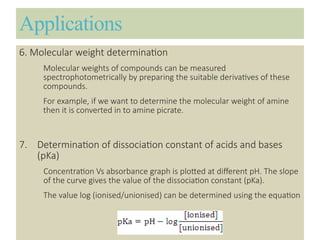
Applications
6. Molecular weightdetermination
Molecular weights of compounds can be measured
spectrophotometrically by preparing the suitable derivatives of these
compounds.
For example, if we want to determine the molecular weight of amine
then it is converted in to amine picrate.
7. Determination of dissociation constant of acids and bases
(pKa)
Concentration Vs absorbance graph is plotted at different pH. The slope
of the curve gives the value of the dissociation constant (pKa).
The value log (ionised/unionised) can be determined using the equation
81.
Applications
8. Quantitative analysisof pharmaceutical substances
Drug Solvent λ (nm) E (1%,1cm)
Acetazolamide 0.1 N HCl 265 474
Cyanocobalamin Water 361 207
Griseofulvin Alcohol 291 686
Riboflavin Acetate buffer 444 323
Verapamil tablets Water 378 118