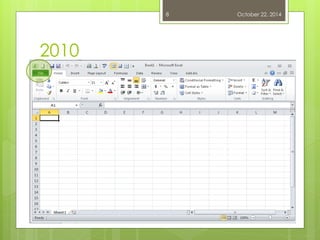
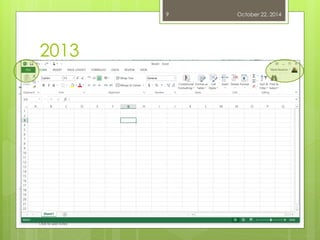
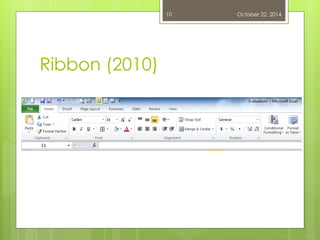
This document summarizes a presentation about using Excel for decision making. It discusses collecting and interpreting data, the basics of Excel including versions and navigation, linking data between worksheets and workbooks using 3D references, using logic functions to ask questions of the data and limit results, conditional formatting to visualize key elements in the data, and graphing to visualize select data. The goal is to provide tips and tricks to make data more useful, readable, and able to support decision making.


![3D references
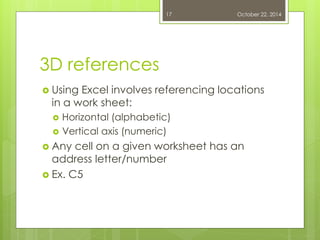
A 3D reference adds another location to the cell reference
Another worksheet
Another workbook
New cell address includes
Location
Vertical axis
Horizontal axis
Example 1 Sheet2!B2
Example 2 '[WorkbookName.xlsx]Worksheet'!$C$2
October 22, 2014
18](https://image.slidesharecdn.com/edfdahpjr16taeuid9mz-signature-f406c9532cc4da25c055967e194f5df058e918d031aa8054d26e9d77317a27d0-poli-141212122845-conversion-gate01/85/PROCEDE-2014-Using-excel-for-decision-making-18-320.jpg)