SlideShare a Scribd company logo
1 of 2
Applications of Math’s
Graph
Definition:
In math, a graph can be defined as a
pictorial representation or a diagram
that represents data or values in an
organized manner. The points on the
graph often represents the relationship
between two or more things. We then
represent the data using a bar graph.
Types of Graph:
There are 4 common types of graphs given as:
 Line graph
 Bar graph
 Histogram
 Pie chart
Daily uses of graph:
Graph is the main component of math that may be use
in different aspects everywhere. Following are the common uses of
graphs.
 used extensively in Sales and
marketing economics, Business,
psychology, Science and medicine.
 clarify trends better than do tables.
 estimate key values at a glance.
 to see if there is variation in the data.
 permit a visual check of the accuracy
and reasonableness of calculations.
 show each data category in a frequency
distribution.
 The spread of diseases and epidemics
can be modelled using a network.
 Used to compare things between
different groups or to track changes
over time
 Graphs are used from the local
newspaper to the magazine stand.
 in a computer field, as in networking,
use of graphs can be very useful to
measure trafficking to a site.
 use to present data in a quick way
measured data like temperature,
time, and weight
 are used to show the sales of a
company, year wise.
 used in statistics and business for
explaining data and work results,
 used to compare changes over the
same period of time for more than
one group.
 They can show patterns, help scientists
identify correlations, and get the point
of the experiment across quickly.
 to easily see the distribution of
the data.
 in mass media for comparison i.e. to
visualize the percentage for the parts
of one total
 used to show percentage or proportional data

More Related Content

What's hot (20)

Data handling class 8th
Data handling class 8thData handling class 8th
Data handling class 8th
 
Classification of data
Classification of dataClassification of data
Classification of data
 
Graphical presentation of data
Graphical presentation of dataGraphical presentation of data
Graphical presentation of data
 
Data handling
Data handlingData handling
Data handling
 
Bar chart
Bar chartBar chart
Bar chart
 
seminar.pptx
seminar.pptxseminar.pptx
seminar.pptx
 
Types of Charts
Types of ChartsTypes of Charts
Types of Charts
 
Use of Statistics in real life
Use of Statistics in real lifeUse of Statistics in real life
Use of Statistics in real life
 
Frequency Polygon
Frequency PolygonFrequency Polygon
Frequency Polygon
 
Types Of Charts
Types Of ChartsTypes Of Charts
Types Of Charts
 
Histogram
HistogramHistogram
Histogram
 
Area, perimeter and volume
Area, perimeter and volumeArea, perimeter and volume
Area, perimeter and volume
 
frequency distribution & graphs
frequency distribution & graphsfrequency distribution & graphs
frequency distribution & graphs
 
Histogram
HistogramHistogram
Histogram
 
algebraic expression class VIII
algebraic expression class VIIIalgebraic expression class VIII
algebraic expression class VIII
 
Introduction to graph class 8
Introduction to graph class 8Introduction to graph class 8
Introduction to graph class 8
 
Statistics: Chapter One
Statistics: Chapter OneStatistics: Chapter One
Statistics: Chapter One
 
PIE CHART
PIE CHARTPIE CHART
PIE CHART
 
Histograms and polygons
Histograms and polygonsHistograms and polygons
Histograms and polygons
 
Data handling ppt for class 7th
Data handling ppt for class 7thData handling ppt for class 7th
Data handling ppt for class 7th
 

Similar to Uses of graph

The use of data visualization to tell effective
The use of data visualization to tell effectiveThe use of data visualization to tell effective
The use of data visualization to tell effectivegentlemoro
 
Data Analysis, Presentation and Interpretation of Data
Data Analysis, Presentation and Interpretation of DataData Analysis, Presentation and Interpretation of Data
Data Analysis, Presentation and Interpretation of DataRoqui Malijan
 
Top 7 types of Statistics Graphs for Data Representation
Top 7 types of Statistics Graphs for Data RepresentationTop 7 types of Statistics Graphs for Data Representation
Top 7 types of Statistics Graphs for Data RepresentationStat Analytica
 
Types of graphs and charts and their uses with examples and pics
Types of graphs and charts and their uses  with examples and picsTypes of graphs and charts and their uses  with examples and pics
Types of graphs and charts and their uses with examples and picsMakati Science High School
 
Diagramatic and graphical representation of data Notes on Statistics.ppt
Diagramatic and graphical representation of data Notes on Statistics.pptDiagramatic and graphical representation of data Notes on Statistics.ppt
Diagramatic and graphical representation of data Notes on Statistics.pptaigil2
 
Data analysis & presentation
Data analysis & presentationData analysis & presentation
Data analysis & presentationIram Aziz
 
Graphs and chars
Graphs and charsGraphs and chars
Graphs and charssalemhusin
 
Understanding on graph in bpo
Understanding on graph in bpoUnderstanding on graph in bpo
Understanding on graph in bpoAjit Kumar
 
Graphs represent data in an engaging manner and make c.docx
Graphs represent data in an engaging manner and make c.docxGraphs represent data in an engaging manner and make c.docx
Graphs represent data in an engaging manner and make c.docxshericehewat
 
Use-of-ICT-in-presentation.pdf
Use-of-ICT-in-presentation.pdfUse-of-ICT-in-presentation.pdf
Use-of-ICT-in-presentation.pdfPratibha Sagar
 
Graphicalrepresntationofdatausingstatisticaltools2019_210902_105156.pdf
Graphicalrepresntationofdatausingstatisticaltools2019_210902_105156.pdfGraphicalrepresntationofdatausingstatisticaltools2019_210902_105156.pdf
Graphicalrepresntationofdatausingstatisticaltools2019_210902_105156.pdfHimakshi7
 
BUSINESS INTELLIGENCE AND DATA ANALYTICS presentation
BUSINESS INTELLIGENCE AND DATA ANALYTICS  presentationBUSINESS INTELLIGENCE AND DATA ANALYTICS  presentation
BUSINESS INTELLIGENCE AND DATA ANALYTICS presentationMohit Negi
 
Quantitative techniques in business
Quantitative techniques in businessQuantitative techniques in business
Quantitative techniques in businesssameer sheikh
 
Macromolecules
MacromoleculesMacromolecules
Macromoleculesganctil
 
Introduction-to-Data-Analysis_Final Content.pptx
Introduction-to-Data-Analysis_Final Content.pptxIntroduction-to-Data-Analysis_Final Content.pptx
Introduction-to-Data-Analysis_Final Content.pptxItismeItisnotme
 
Top 8 Different Types Of Charts In Statistics And Their Uses
Top 8 Different Types Of Charts In Statistics And Their UsesTop 8 Different Types Of Charts In Statistics And Their Uses
Top 8 Different Types Of Charts In Statistics And Their UsesStat Analytica
 
Statistics Class 10 CBSE
Statistics Class 10 CBSE Statistics Class 10 CBSE
Statistics Class 10 CBSE Smitha Sumod
 
Unit 2_ Descriptive Analytics for MBA .pptx
Unit 2_ Descriptive Analytics for MBA .pptxUnit 2_ Descriptive Analytics for MBA .pptx
Unit 2_ Descriptive Analytics for MBA .pptxJANNU VINAY
 

Similar to Uses of graph (20)

The use of data visualization to tell effective
The use of data visualization to tell effectiveThe use of data visualization to tell effective
The use of data visualization to tell effective
 
Data Analysis, Presentation and Interpretation of Data
Data Analysis, Presentation and Interpretation of DataData Analysis, Presentation and Interpretation of Data
Data Analysis, Presentation and Interpretation of Data
 
Bigdata
BigdataBigdata
Bigdata
 
Top 7 types of Statistics Graphs for Data Representation
Top 7 types of Statistics Graphs for Data RepresentationTop 7 types of Statistics Graphs for Data Representation
Top 7 types of Statistics Graphs for Data Representation
 
Types of graphs and charts and their uses with examples and pics
Types of graphs and charts and their uses  with examples and picsTypes of graphs and charts and their uses  with examples and pics
Types of graphs and charts and their uses with examples and pics
 
Diagramatic and graphical representation of data Notes on Statistics.ppt
Diagramatic and graphical representation of data Notes on Statistics.pptDiagramatic and graphical representation of data Notes on Statistics.ppt
Diagramatic and graphical representation of data Notes on Statistics.ppt
 
Data analysis & presentation
Data analysis & presentationData analysis & presentation
Data analysis & presentation
 
Graphs and chars
Graphs and charsGraphs and chars
Graphs and chars
 
Understanding on graph in bpo
Understanding on graph in bpoUnderstanding on graph in bpo
Understanding on graph in bpo
 
Graphs represent data in an engaging manner and make c.docx
Graphs represent data in an engaging manner and make c.docxGraphs represent data in an engaging manner and make c.docx
Graphs represent data in an engaging manner and make c.docx
 
Use-of-ICT-in-presentation.pdf
Use-of-ICT-in-presentation.pdfUse-of-ICT-in-presentation.pdf
Use-of-ICT-in-presentation.pdf
 
Graphicalrepresntationofdatausingstatisticaltools2019_210902_105156.pdf
Graphicalrepresntationofdatausingstatisticaltools2019_210902_105156.pdfGraphicalrepresntationofdatausingstatisticaltools2019_210902_105156.pdf
Graphicalrepresntationofdatausingstatisticaltools2019_210902_105156.pdf
 
BUSINESS INTELLIGENCE AND DATA ANALYTICS presentation
BUSINESS INTELLIGENCE AND DATA ANALYTICS  presentationBUSINESS INTELLIGENCE AND DATA ANALYTICS  presentation
BUSINESS INTELLIGENCE AND DATA ANALYTICS presentation
 
Quantitative techniques in business
Quantitative techniques in businessQuantitative techniques in business
Quantitative techniques in business
 
Macromolecules
MacromoleculesMacromolecules
Macromolecules
 
Introduction-to-Data-Analysis_Final Content.pptx
Introduction-to-Data-Analysis_Final Content.pptxIntroduction-to-Data-Analysis_Final Content.pptx
Introduction-to-Data-Analysis_Final Content.pptx
 
Top 8 Different Types Of Charts In Statistics And Their Uses
Top 8 Different Types Of Charts In Statistics And Their UsesTop 8 Different Types Of Charts In Statistics And Their Uses
Top 8 Different Types Of Charts In Statistics And Their Uses
 
Statistics Class 10 CBSE
Statistics Class 10 CBSE Statistics Class 10 CBSE
Statistics Class 10 CBSE
 
Unit 2_ Descriptive Analytics for MBA .pptx
Unit 2_ Descriptive Analytics for MBA .pptxUnit 2_ Descriptive Analytics for MBA .pptx
Unit 2_ Descriptive Analytics for MBA .pptx
 
Data Visualization
Data VisualizationData Visualization
Data Visualization
 

More from NimraKhan91

Price policy ,income tax manufacturing and primary goods
Price policy ,income tax manufacturing and primary goodsPrice policy ,income tax manufacturing and primary goods
Price policy ,income tax manufacturing and primary goodsNimraKhan91
 
Research problem
Research problemResearch problem
Research problemNimraKhan91
 
Minerals sodium potassium magnesium chloride, calcium, selenium
Minerals sodium potassium magnesium chloride, calcium, seleniumMinerals sodium potassium magnesium chloride, calcium, selenium
Minerals sodium potassium magnesium chloride, calcium, seleniumNimraKhan91
 

More from NimraKhan91 (9)

Price policy ,income tax manufacturing and primary goods
Price policy ,income tax manufacturing and primary goodsPrice policy ,income tax manufacturing and primary goods
Price policy ,income tax manufacturing and primary goods
 
HPLC
HPLCHPLC
HPLC
 
HPLC
HPLCHPLC
HPLC
 
Research problem
Research problemResearch problem
Research problem
 
Glycolipids
GlycolipidsGlycolipids
Glycolipids
 
Minerals sodium potassium magnesium chloride, calcium, selenium
Minerals sodium potassium magnesium chloride, calcium, seleniumMinerals sodium potassium magnesium chloride, calcium, selenium
Minerals sodium potassium magnesium chloride, calcium, selenium
 
Prokaryotes
ProkaryotesProkaryotes
Prokaryotes
 
Cell cycle
Cell cycleCell cycle
Cell cycle
 
Enzymes ppt
Enzymes ppt Enzymes ppt
Enzymes ppt
 

Recently uploaded

Grafana in space: Monitoring Japan's SLIM moon lander in real time
Grafana in space: Monitoring Japan's SLIM moon lander  in real timeGrafana in space: Monitoring Japan's SLIM moon lander  in real time
Grafana in space: Monitoring Japan's SLIM moon lander in real timeSatoshi NAKAHIRA
 
STERILITY TESTING OF PHARMACEUTICALS ppt by DR.C.P.PRINCE
STERILITY TESTING OF PHARMACEUTICALS ppt by DR.C.P.PRINCESTERILITY TESTING OF PHARMACEUTICALS ppt by DR.C.P.PRINCE
STERILITY TESTING OF PHARMACEUTICALS ppt by DR.C.P.PRINCEPRINCE C P
 
Unlocking the Potential: Deep dive into ocean of Ceramic Magnets.pptx
Unlocking  the Potential: Deep dive into ocean of Ceramic Magnets.pptxUnlocking  the Potential: Deep dive into ocean of Ceramic Magnets.pptx
Unlocking the Potential: Deep dive into ocean of Ceramic Magnets.pptxanandsmhk
 
Work, Energy and Power for class 10 ICSE Physics
Work, Energy and Power for class 10 ICSE PhysicsWork, Energy and Power for class 10 ICSE Physics
Work, Energy and Power for class 10 ICSE Physicsvishikhakeshava1
 
Botany 4th semester file By Sumit Kumar yadav.pdf
Botany 4th semester file By Sumit Kumar yadav.pdfBotany 4th semester file By Sumit Kumar yadav.pdf
Botany 4th semester file By Sumit Kumar yadav.pdfSumit Kumar yadav
 
Is RISC-V ready for HPC workload? Maybe?
Is RISC-V ready for HPC workload? Maybe?Is RISC-V ready for HPC workload? Maybe?
Is RISC-V ready for HPC workload? Maybe?Patrick Diehl
 
Artificial Intelligence In Microbiology by Dr. Prince C P
Artificial Intelligence In Microbiology by Dr. Prince C PArtificial Intelligence In Microbiology by Dr. Prince C P
Artificial Intelligence In Microbiology by Dr. Prince C PPRINCE C P
 
PossibleEoarcheanRecordsoftheGeomagneticFieldPreservedintheIsuaSupracrustalBe...
PossibleEoarcheanRecordsoftheGeomagneticFieldPreservedintheIsuaSupracrustalBe...PossibleEoarcheanRecordsoftheGeomagneticFieldPreservedintheIsuaSupracrustalBe...
PossibleEoarcheanRecordsoftheGeomagneticFieldPreservedintheIsuaSupracrustalBe...Sérgio Sacani
 
All-domain Anomaly Resolution Office U.S. Department of Defense (U) Case: “Eg...
All-domain Anomaly Resolution Office U.S. Department of Defense (U) Case: “Eg...All-domain Anomaly Resolution Office U.S. Department of Defense (U) Case: “Eg...
All-domain Anomaly Resolution Office U.S. Department of Defense (U) Case: “Eg...Sérgio Sacani
 
A relative description on Sonoporation.pdf
A relative description on Sonoporation.pdfA relative description on Sonoporation.pdf
A relative description on Sonoporation.pdfnehabiju2046
 
Recombinant DNA technology (Immunological screening)
Recombinant DNA technology (Immunological screening)Recombinant DNA technology (Immunological screening)
Recombinant DNA technology (Immunological screening)PraveenaKalaiselvan1
 
Cultivation of KODO MILLET . made by Ghanshyam pptx
Cultivation of KODO MILLET . made by Ghanshyam pptxCultivation of KODO MILLET . made by Ghanshyam pptx
Cultivation of KODO MILLET . made by Ghanshyam pptxpradhanghanshyam7136
 
Physiochemical properties of nanomaterials and its nanotoxicity.pptx
Physiochemical properties of nanomaterials and its nanotoxicity.pptxPhysiochemical properties of nanomaterials and its nanotoxicity.pptx
Physiochemical properties of nanomaterials and its nanotoxicity.pptxAArockiyaNisha
 
GFP in rDNA Technology (Biotechnology).pptx
GFP in rDNA Technology (Biotechnology).pptxGFP in rDNA Technology (Biotechnology).pptx
GFP in rDNA Technology (Biotechnology).pptxAleenaTreesaSaji
 
Analytical Profile of Coleus Forskohlii | Forskolin .pdf
Analytical Profile of Coleus Forskohlii | Forskolin .pdfAnalytical Profile of Coleus Forskohlii | Forskolin .pdf
Analytical Profile of Coleus Forskohlii | Forskolin .pdfSwapnil Therkar
 
Labelling Requirements and Label Claims for Dietary Supplements and Recommend...
Labelling Requirements and Label Claims for Dietary Supplements and Recommend...Labelling Requirements and Label Claims for Dietary Supplements and Recommend...
Labelling Requirements and Label Claims for Dietary Supplements and Recommend...Lokesh Kothari
 
Biopesticide (2).pptx .This slides helps to know the different types of biop...
Biopesticide (2).pptx  .This slides helps to know the different types of biop...Biopesticide (2).pptx  .This slides helps to know the different types of biop...
Biopesticide (2).pptx .This slides helps to know the different types of biop...RohitNehra6
 
G9 Science Q4- Week 1-2 Projectile Motion.ppt
G9 Science Q4- Week 1-2 Projectile Motion.pptG9 Science Q4- Week 1-2 Projectile Motion.ppt
G9 Science Q4- Week 1-2 Projectile Motion.pptMAESTRELLAMesa2
 

Recently uploaded (20)

Grafana in space: Monitoring Japan's SLIM moon lander in real time
Grafana in space: Monitoring Japan's SLIM moon lander  in real timeGrafana in space: Monitoring Japan's SLIM moon lander  in real time
Grafana in space: Monitoring Japan's SLIM moon lander in real time
 
STERILITY TESTING OF PHARMACEUTICALS ppt by DR.C.P.PRINCE
STERILITY TESTING OF PHARMACEUTICALS ppt by DR.C.P.PRINCESTERILITY TESTING OF PHARMACEUTICALS ppt by DR.C.P.PRINCE
STERILITY TESTING OF PHARMACEUTICALS ppt by DR.C.P.PRINCE
 
Unlocking the Potential: Deep dive into ocean of Ceramic Magnets.pptx
Unlocking  the Potential: Deep dive into ocean of Ceramic Magnets.pptxUnlocking  the Potential: Deep dive into ocean of Ceramic Magnets.pptx
Unlocking the Potential: Deep dive into ocean of Ceramic Magnets.pptx
 
Work, Energy and Power for class 10 ICSE Physics
Work, Energy and Power for class 10 ICSE PhysicsWork, Energy and Power for class 10 ICSE Physics
Work, Energy and Power for class 10 ICSE Physics
 
Botany 4th semester file By Sumit Kumar yadav.pdf
Botany 4th semester file By Sumit Kumar yadav.pdfBotany 4th semester file By Sumit Kumar yadav.pdf
Botany 4th semester file By Sumit Kumar yadav.pdf
 
Is RISC-V ready for HPC workload? Maybe?
Is RISC-V ready for HPC workload? Maybe?Is RISC-V ready for HPC workload? Maybe?
Is RISC-V ready for HPC workload? Maybe?
 
Artificial Intelligence In Microbiology by Dr. Prince C P
Artificial Intelligence In Microbiology by Dr. Prince C PArtificial Intelligence In Microbiology by Dr. Prince C P
Artificial Intelligence In Microbiology by Dr. Prince C P
 
Engler and Prantl system of classification in plant taxonomy
Engler and Prantl system of classification in plant taxonomyEngler and Prantl system of classification in plant taxonomy
Engler and Prantl system of classification in plant taxonomy
 
PossibleEoarcheanRecordsoftheGeomagneticFieldPreservedintheIsuaSupracrustalBe...
PossibleEoarcheanRecordsoftheGeomagneticFieldPreservedintheIsuaSupracrustalBe...PossibleEoarcheanRecordsoftheGeomagneticFieldPreservedintheIsuaSupracrustalBe...
PossibleEoarcheanRecordsoftheGeomagneticFieldPreservedintheIsuaSupracrustalBe...
 
All-domain Anomaly Resolution Office U.S. Department of Defense (U) Case: “Eg...
All-domain Anomaly Resolution Office U.S. Department of Defense (U) Case: “Eg...All-domain Anomaly Resolution Office U.S. Department of Defense (U) Case: “Eg...
All-domain Anomaly Resolution Office U.S. Department of Defense (U) Case: “Eg...
 
A relative description on Sonoporation.pdf
A relative description on Sonoporation.pdfA relative description on Sonoporation.pdf
A relative description on Sonoporation.pdf
 
9953056974 Young Call Girls In Mahavir enclave Indian Quality Escort service
9953056974 Young Call Girls In Mahavir enclave Indian Quality Escort service9953056974 Young Call Girls In Mahavir enclave Indian Quality Escort service
9953056974 Young Call Girls In Mahavir enclave Indian Quality Escort service
 
Recombinant DNA technology (Immunological screening)
Recombinant DNA technology (Immunological screening)Recombinant DNA technology (Immunological screening)
Recombinant DNA technology (Immunological screening)
 
Cultivation of KODO MILLET . made by Ghanshyam pptx
Cultivation of KODO MILLET . made by Ghanshyam pptxCultivation of KODO MILLET . made by Ghanshyam pptx
Cultivation of KODO MILLET . made by Ghanshyam pptx
 
Physiochemical properties of nanomaterials and its nanotoxicity.pptx
Physiochemical properties of nanomaterials and its nanotoxicity.pptxPhysiochemical properties of nanomaterials and its nanotoxicity.pptx
Physiochemical properties of nanomaterials and its nanotoxicity.pptx
 
GFP in rDNA Technology (Biotechnology).pptx
GFP in rDNA Technology (Biotechnology).pptxGFP in rDNA Technology (Biotechnology).pptx
GFP in rDNA Technology (Biotechnology).pptx
 
Analytical Profile of Coleus Forskohlii | Forskolin .pdf
Analytical Profile of Coleus Forskohlii | Forskolin .pdfAnalytical Profile of Coleus Forskohlii | Forskolin .pdf
Analytical Profile of Coleus Forskohlii | Forskolin .pdf
 
Labelling Requirements and Label Claims for Dietary Supplements and Recommend...
Labelling Requirements and Label Claims for Dietary Supplements and Recommend...Labelling Requirements and Label Claims for Dietary Supplements and Recommend...
Labelling Requirements and Label Claims for Dietary Supplements and Recommend...
 
Biopesticide (2).pptx .This slides helps to know the different types of biop...
Biopesticide (2).pptx  .This slides helps to know the different types of biop...Biopesticide (2).pptx  .This slides helps to know the different types of biop...
Biopesticide (2).pptx .This slides helps to know the different types of biop...
 
G9 Science Q4- Week 1-2 Projectile Motion.ppt
G9 Science Q4- Week 1-2 Projectile Motion.pptG9 Science Q4- Week 1-2 Projectile Motion.ppt
G9 Science Q4- Week 1-2 Projectile Motion.ppt
 

Uses of graph

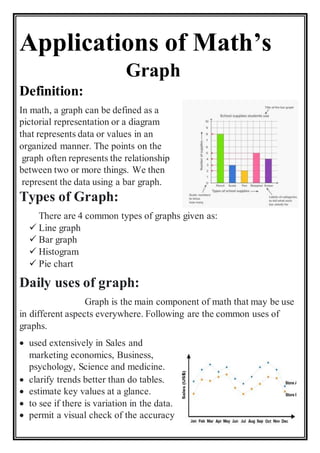
  • 1. Applications of Math’s Graph Definition: In math, a graph can be defined as a pictorial representation or a diagram that represents data or values in an organized manner. The points on the graph often represents the relationship between two or more things. We then represent the data using a bar graph. Types of Graph: There are 4 common types of graphs given as:  Line graph  Bar graph  Histogram  Pie chart Daily uses of graph: Graph is the main component of math that may be use in different aspects everywhere. Following are the common uses of graphs.  used extensively in Sales and marketing economics, Business, psychology, Science and medicine.  clarify trends better than do tables.  estimate key values at a glance.  to see if there is variation in the data.  permit a visual check of the accuracy
  • 2. and reasonableness of calculations.  show each data category in a frequency distribution.  The spread of diseases and epidemics can be modelled using a network.  Used to compare things between different groups or to track changes over time  Graphs are used from the local newspaper to the magazine stand.  in a computer field, as in networking, use of graphs can be very useful to measure trafficking to a site.  use to present data in a quick way measured data like temperature, time, and weight  are used to show the sales of a company, year wise.  used in statistics and business for explaining data and work results,  used to compare changes over the same period of time for more than one group.  They can show patterns, help scientists identify correlations, and get the point of the experiment across quickly.  to easily see the distribution of the data.  in mass media for comparison i.e. to visualize the percentage for the parts of one total  used to show percentage or proportional data