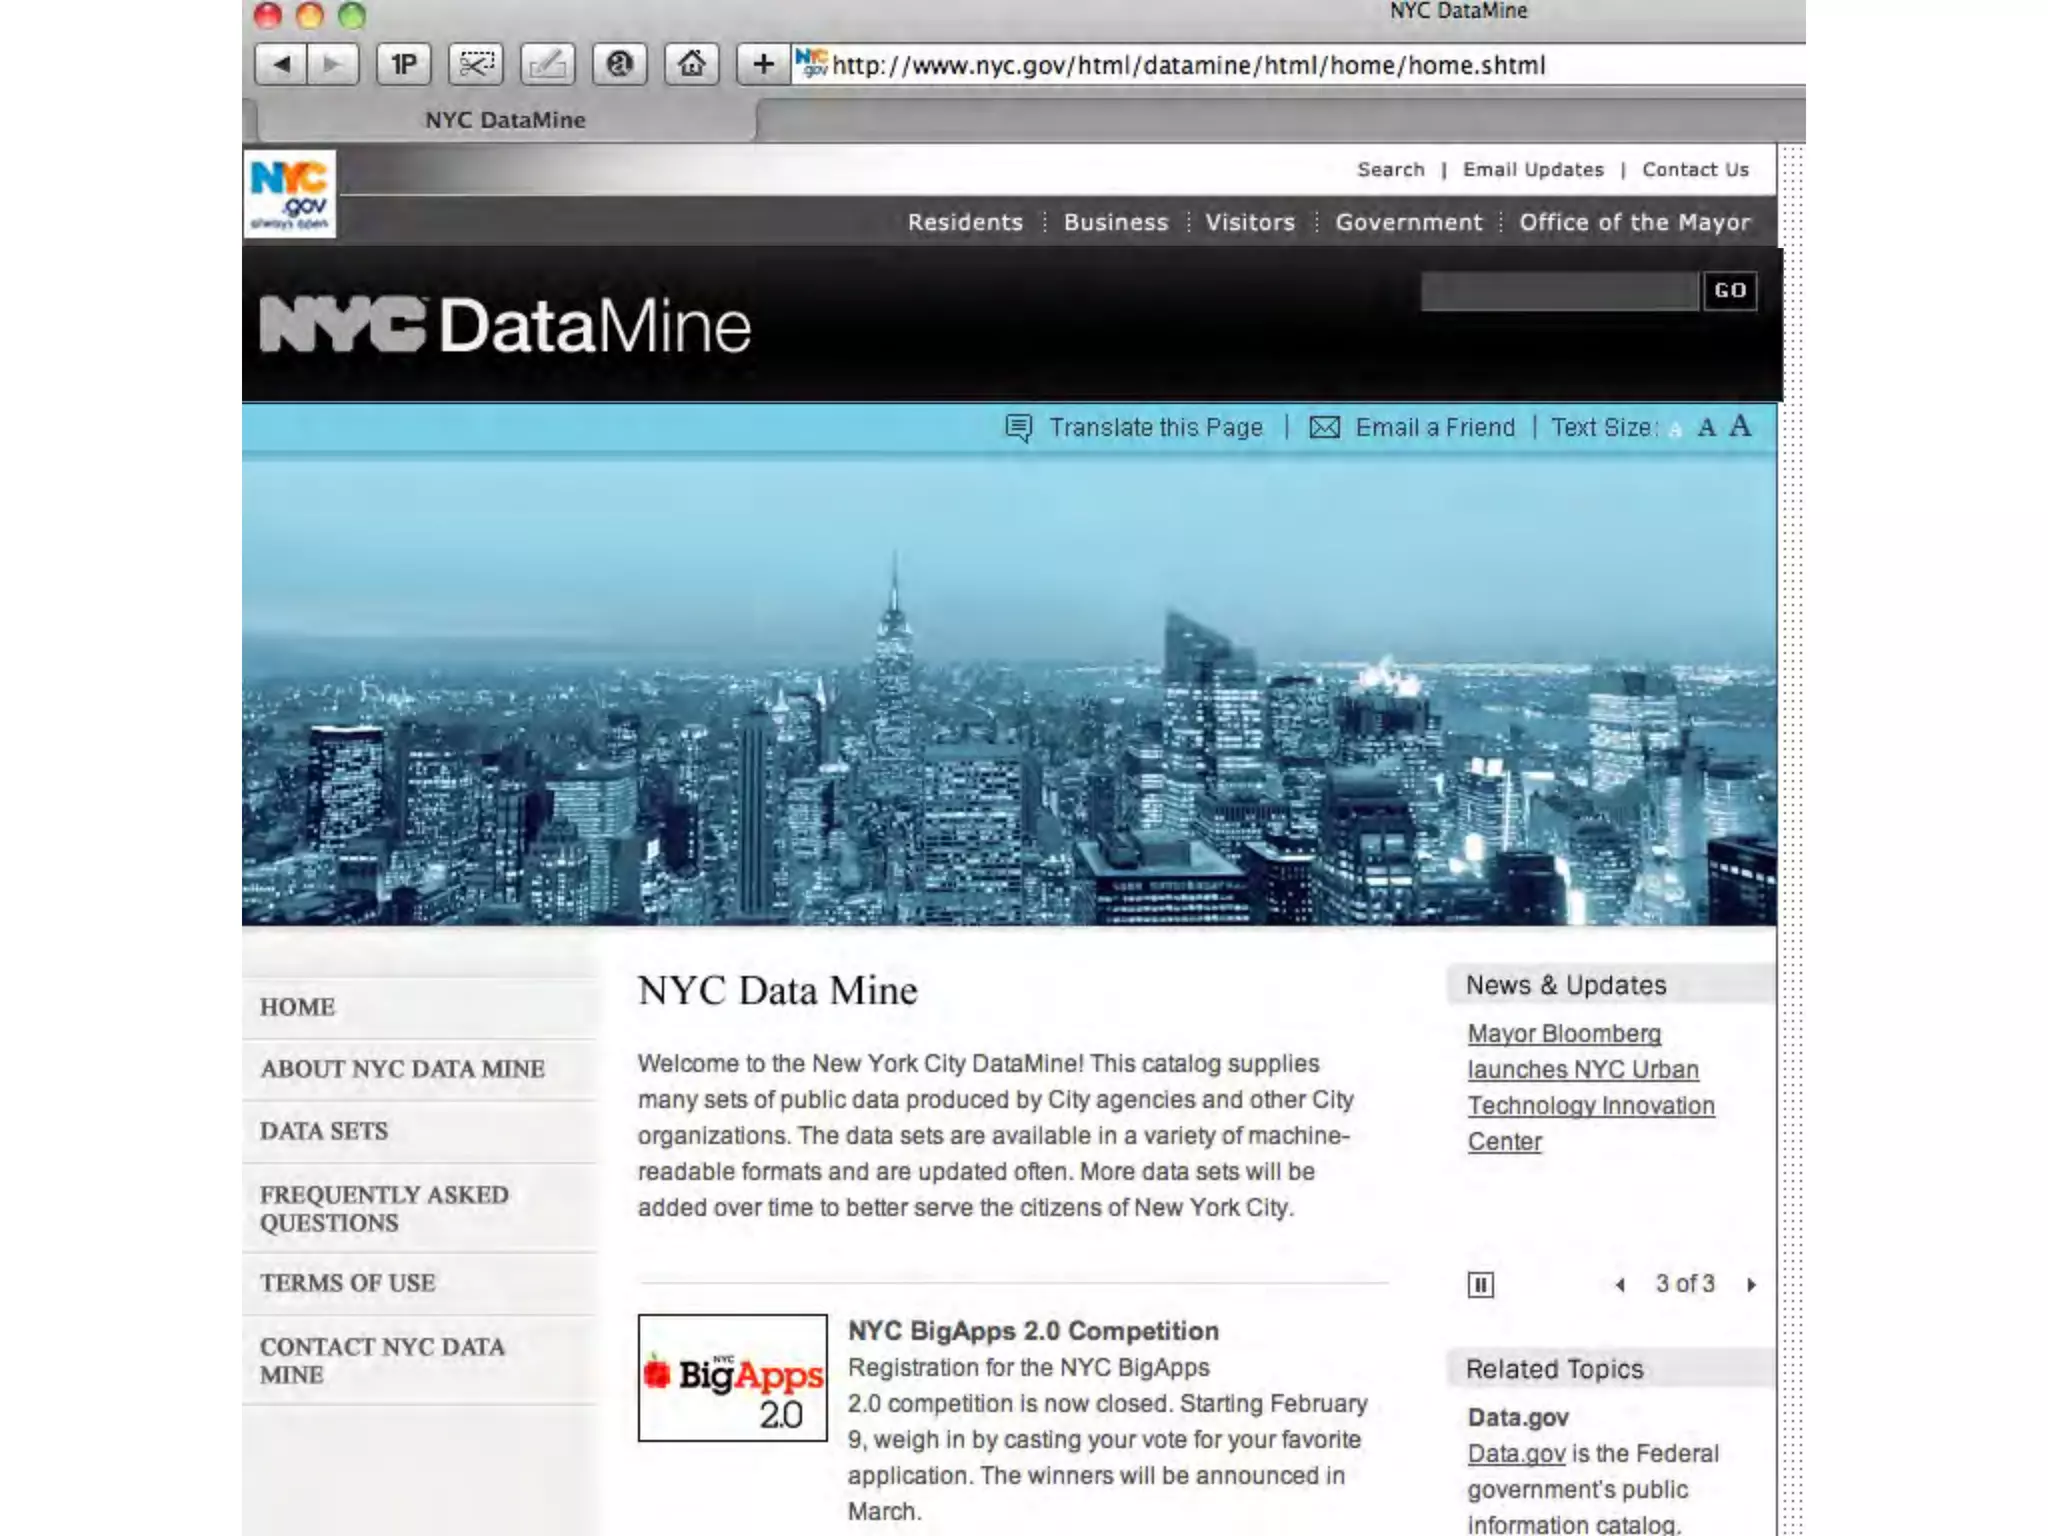
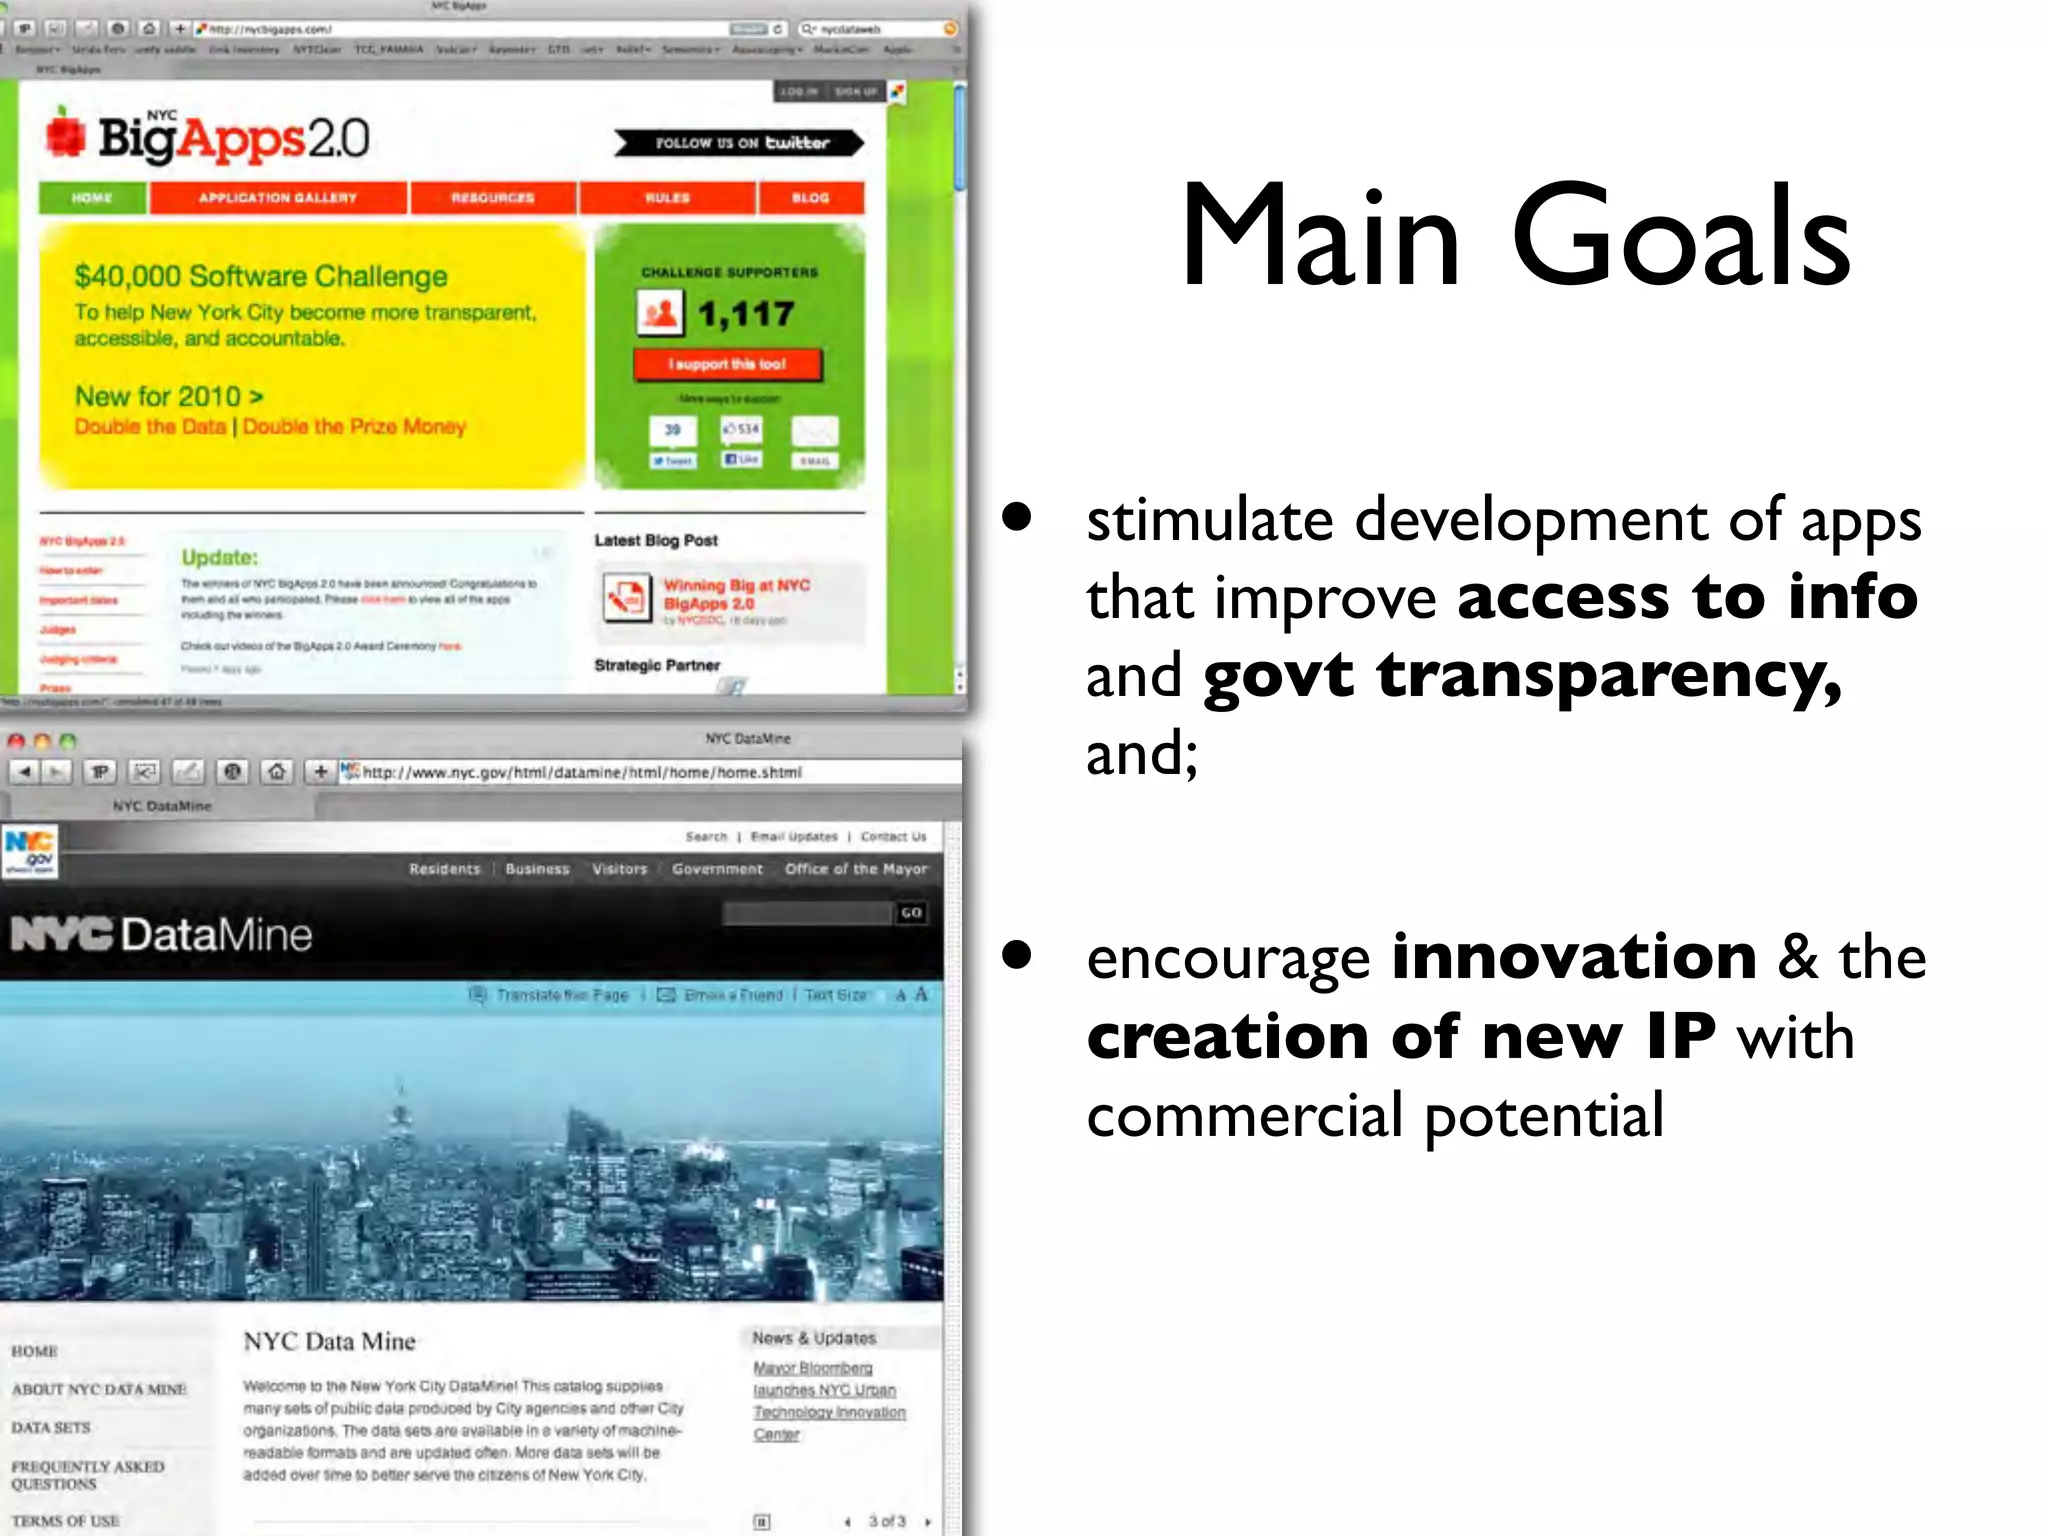
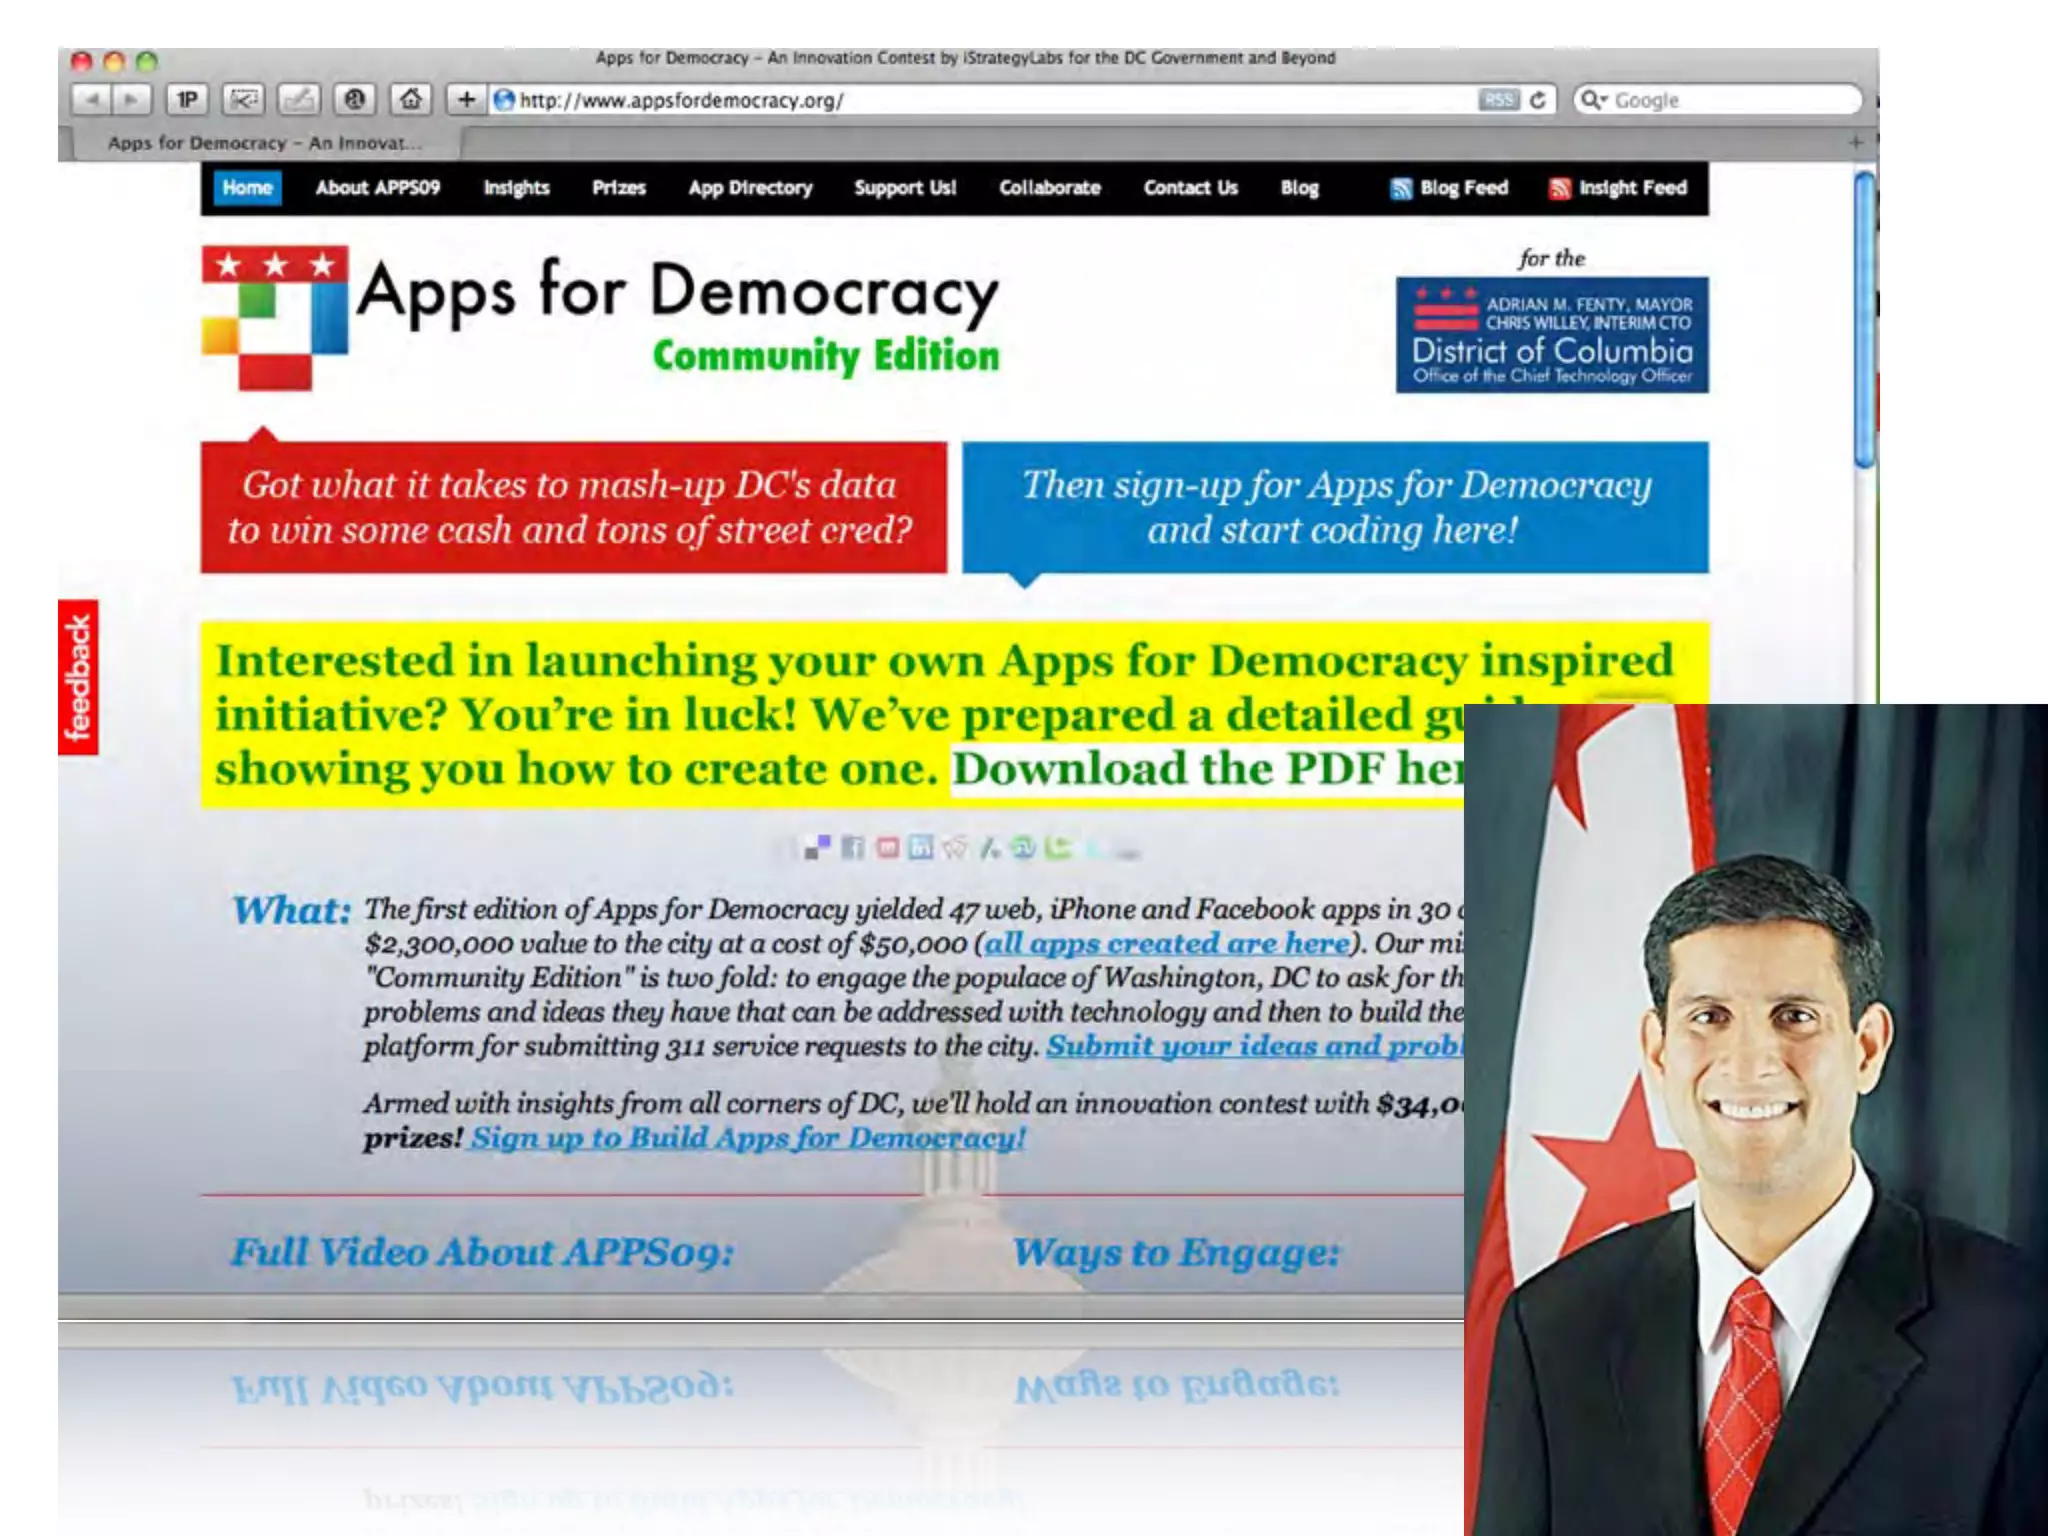
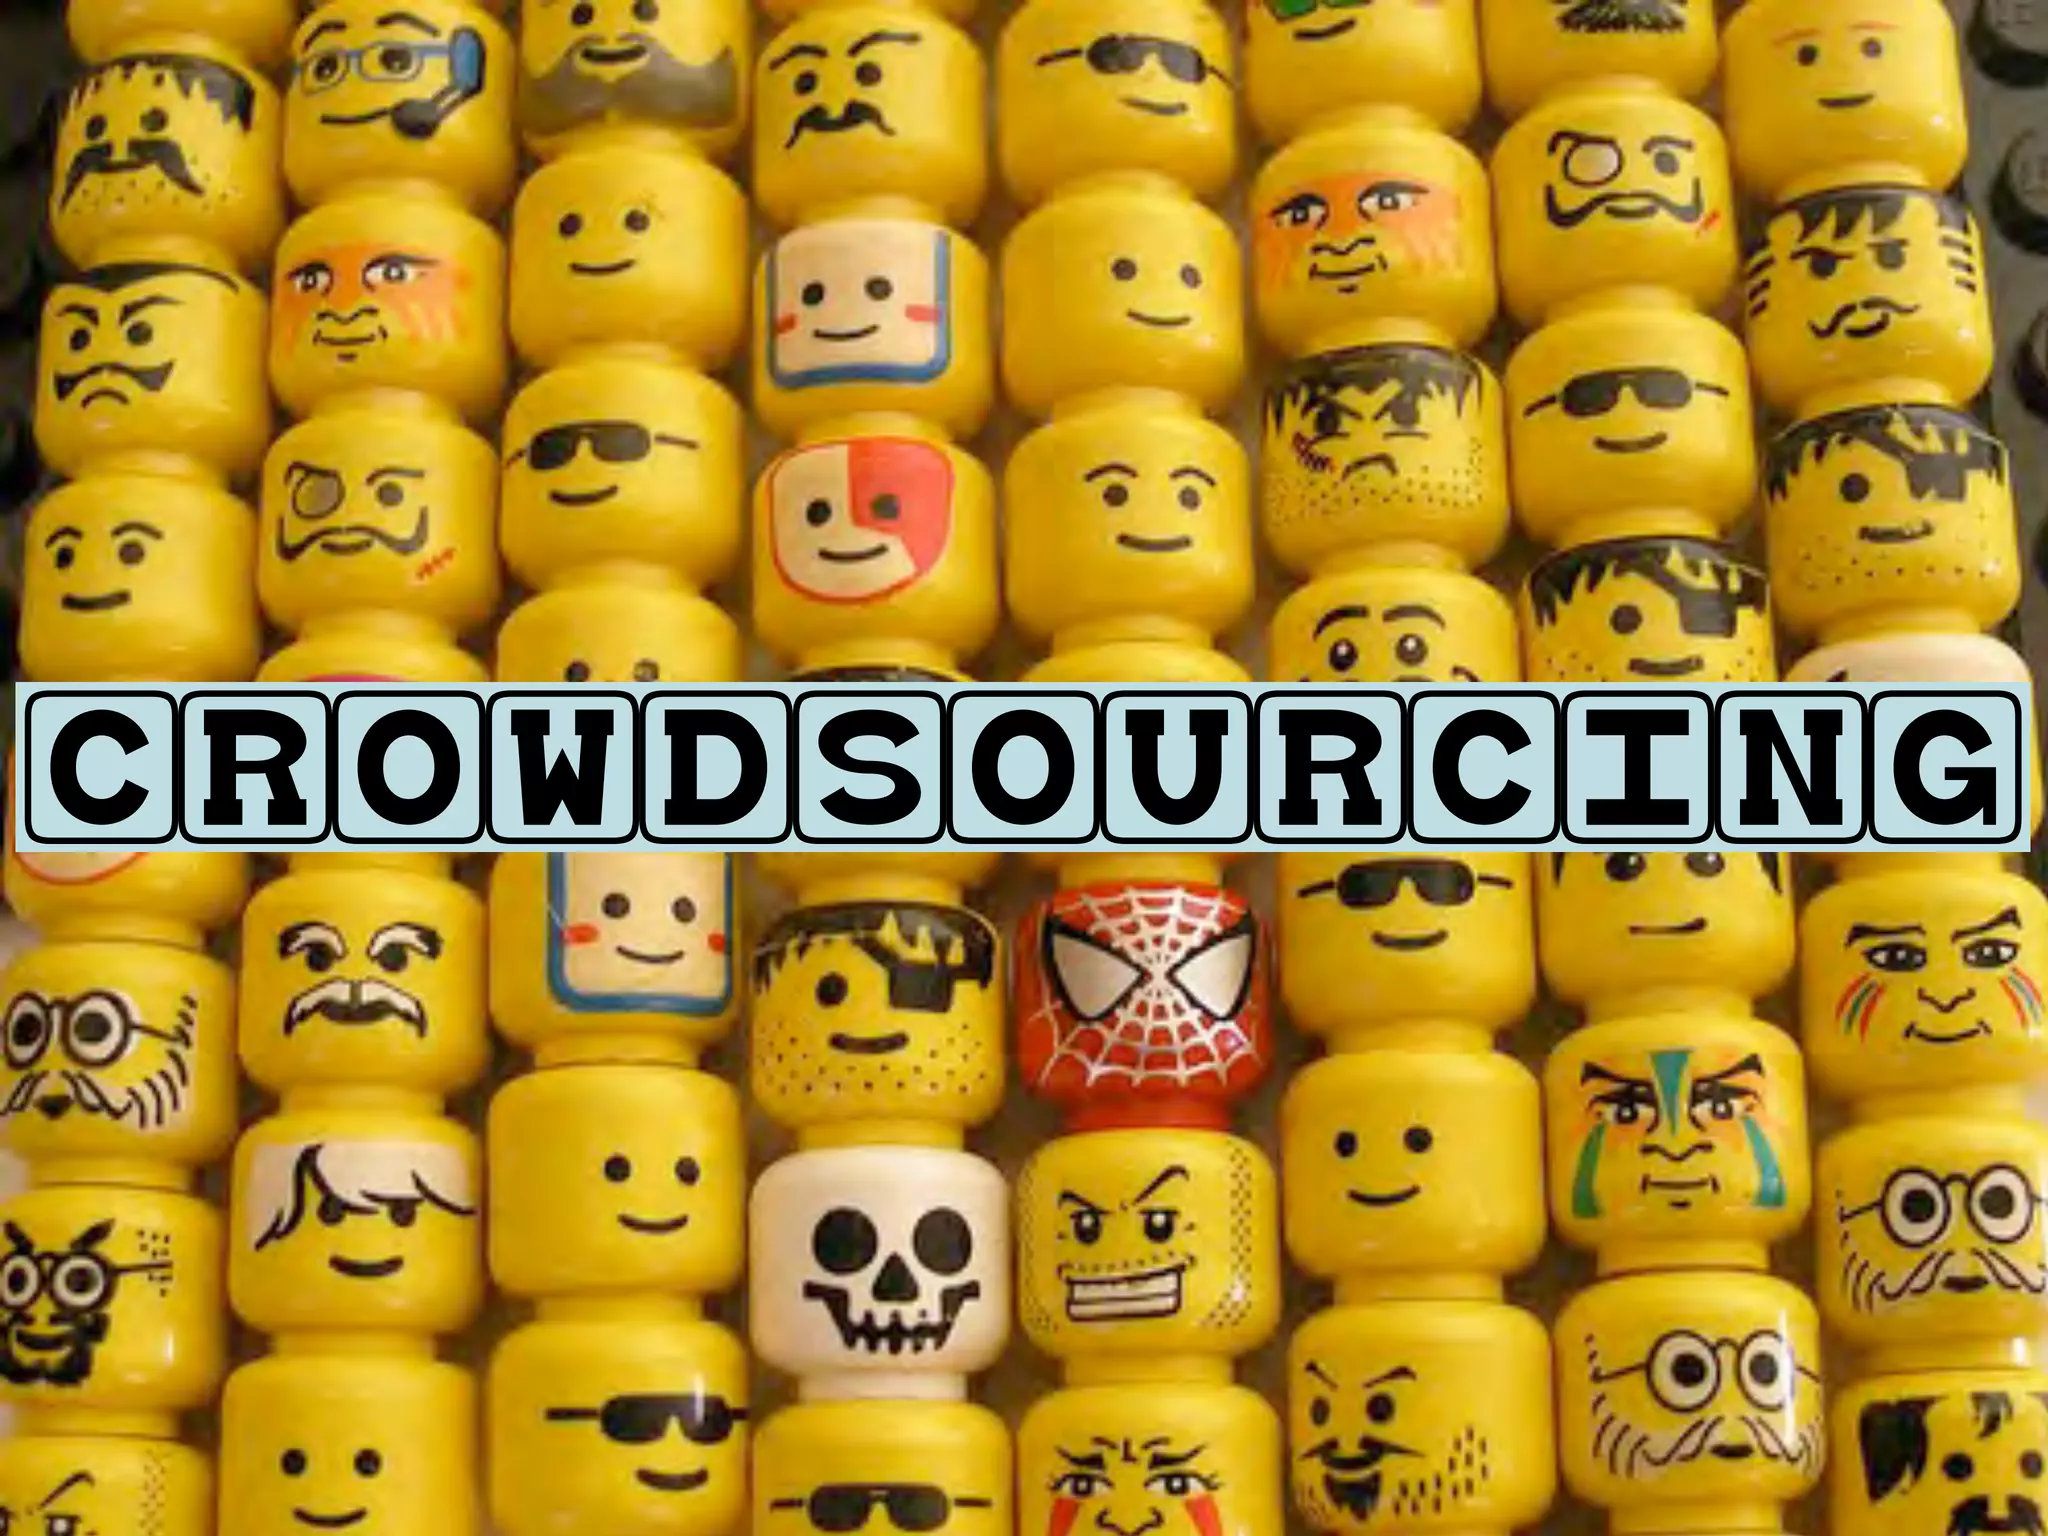
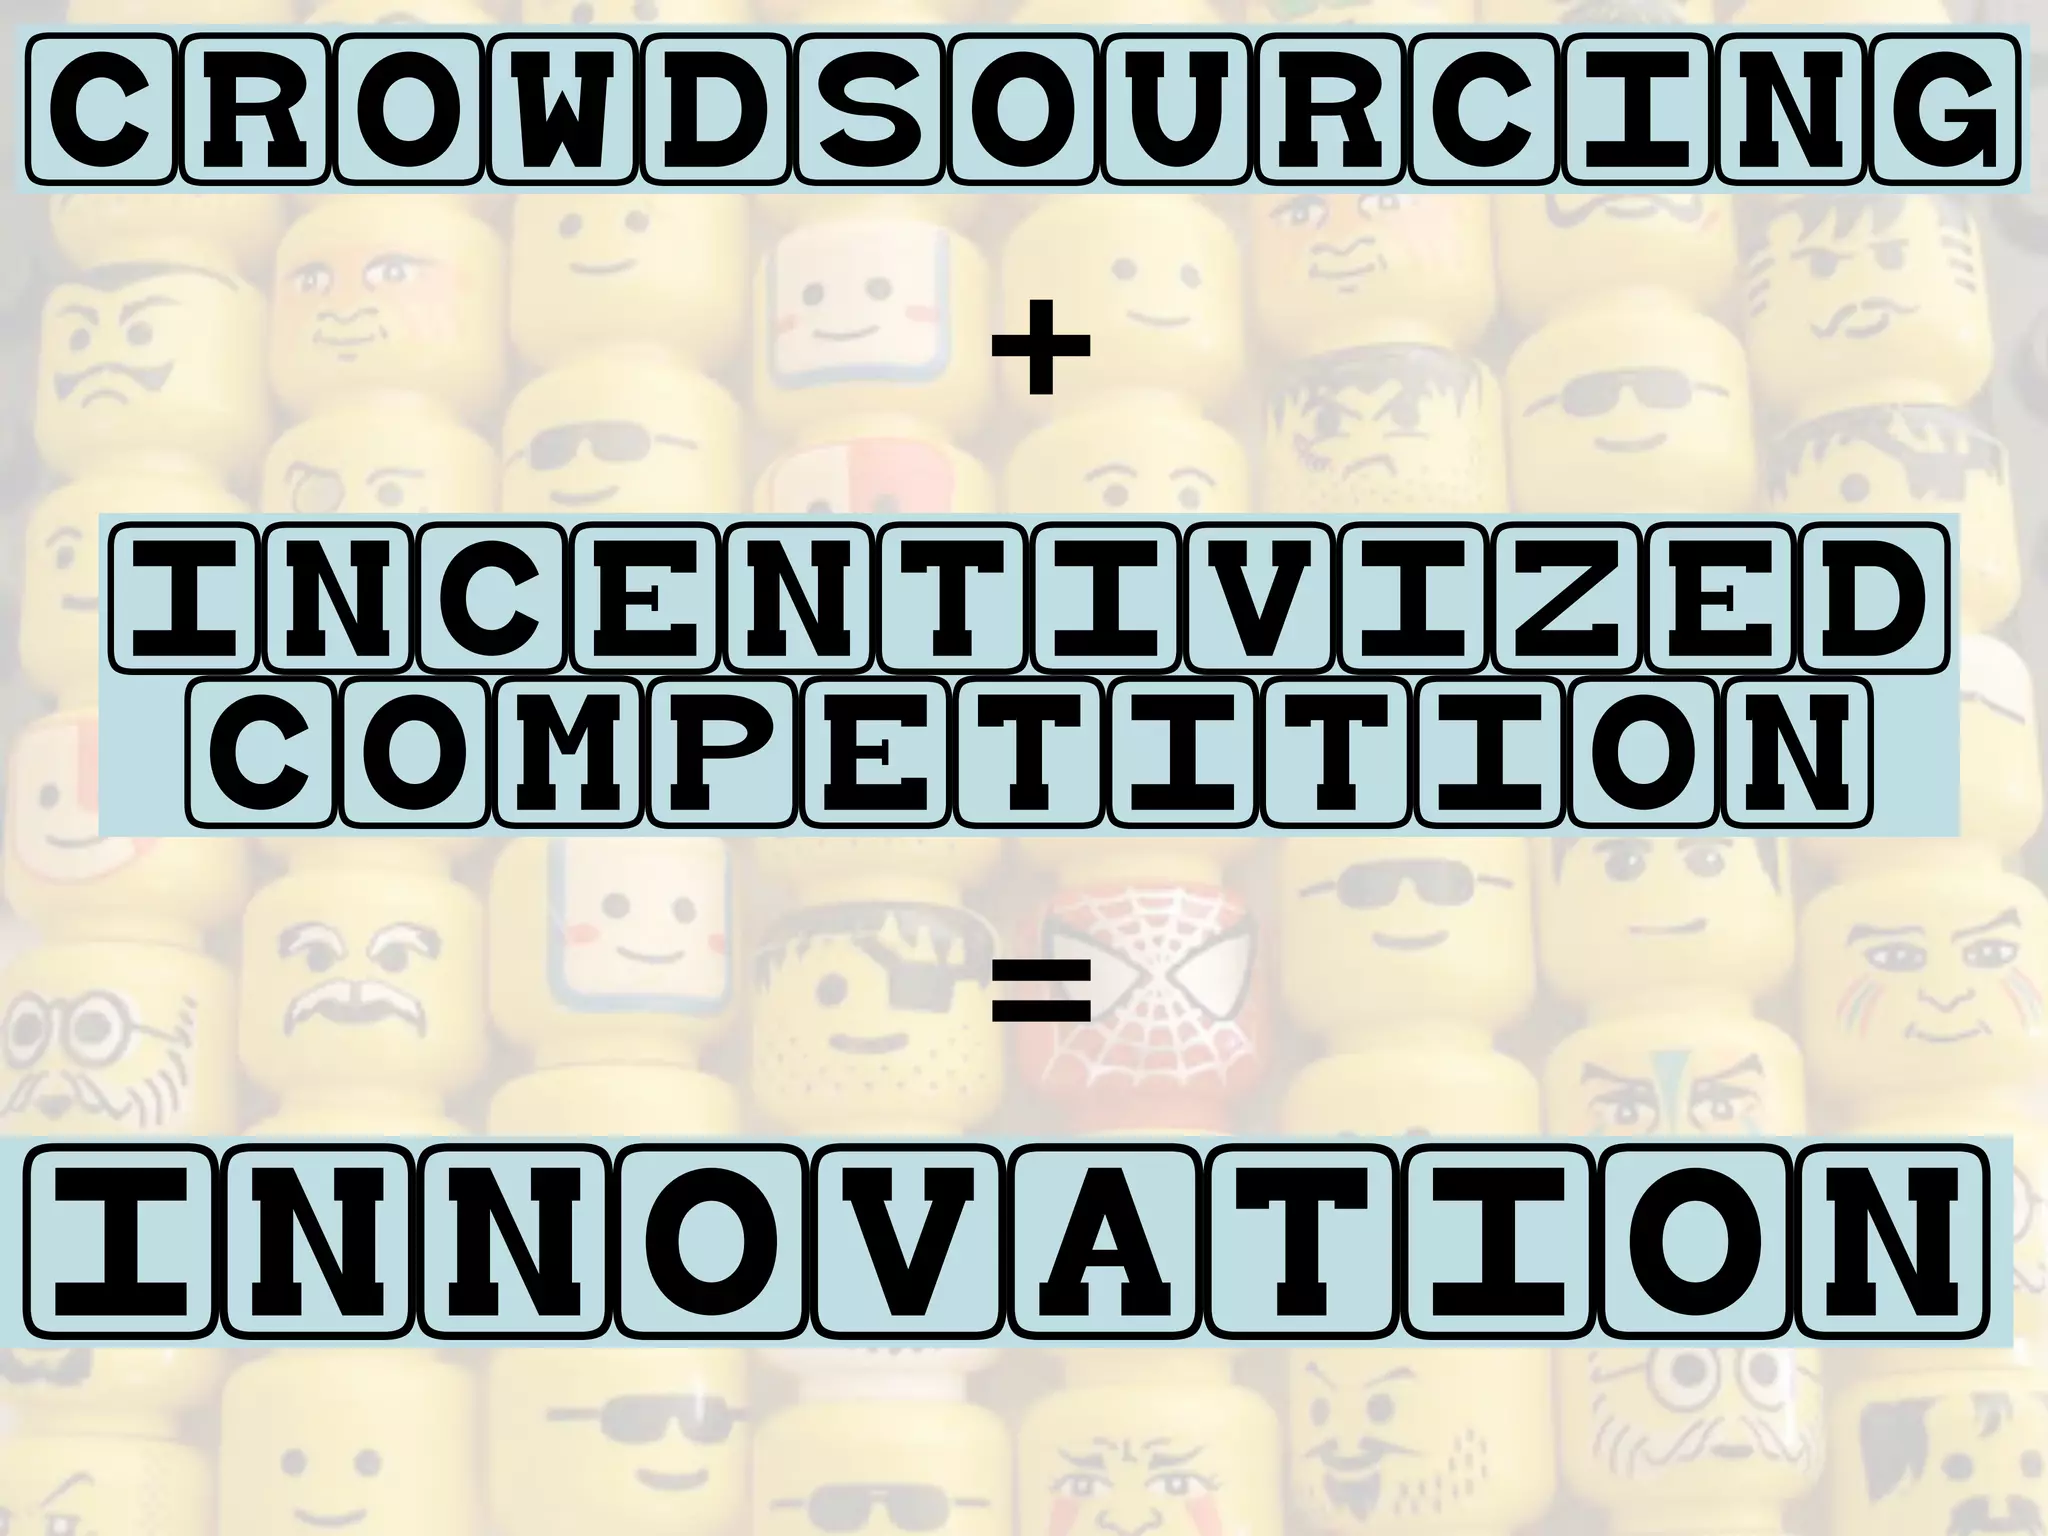
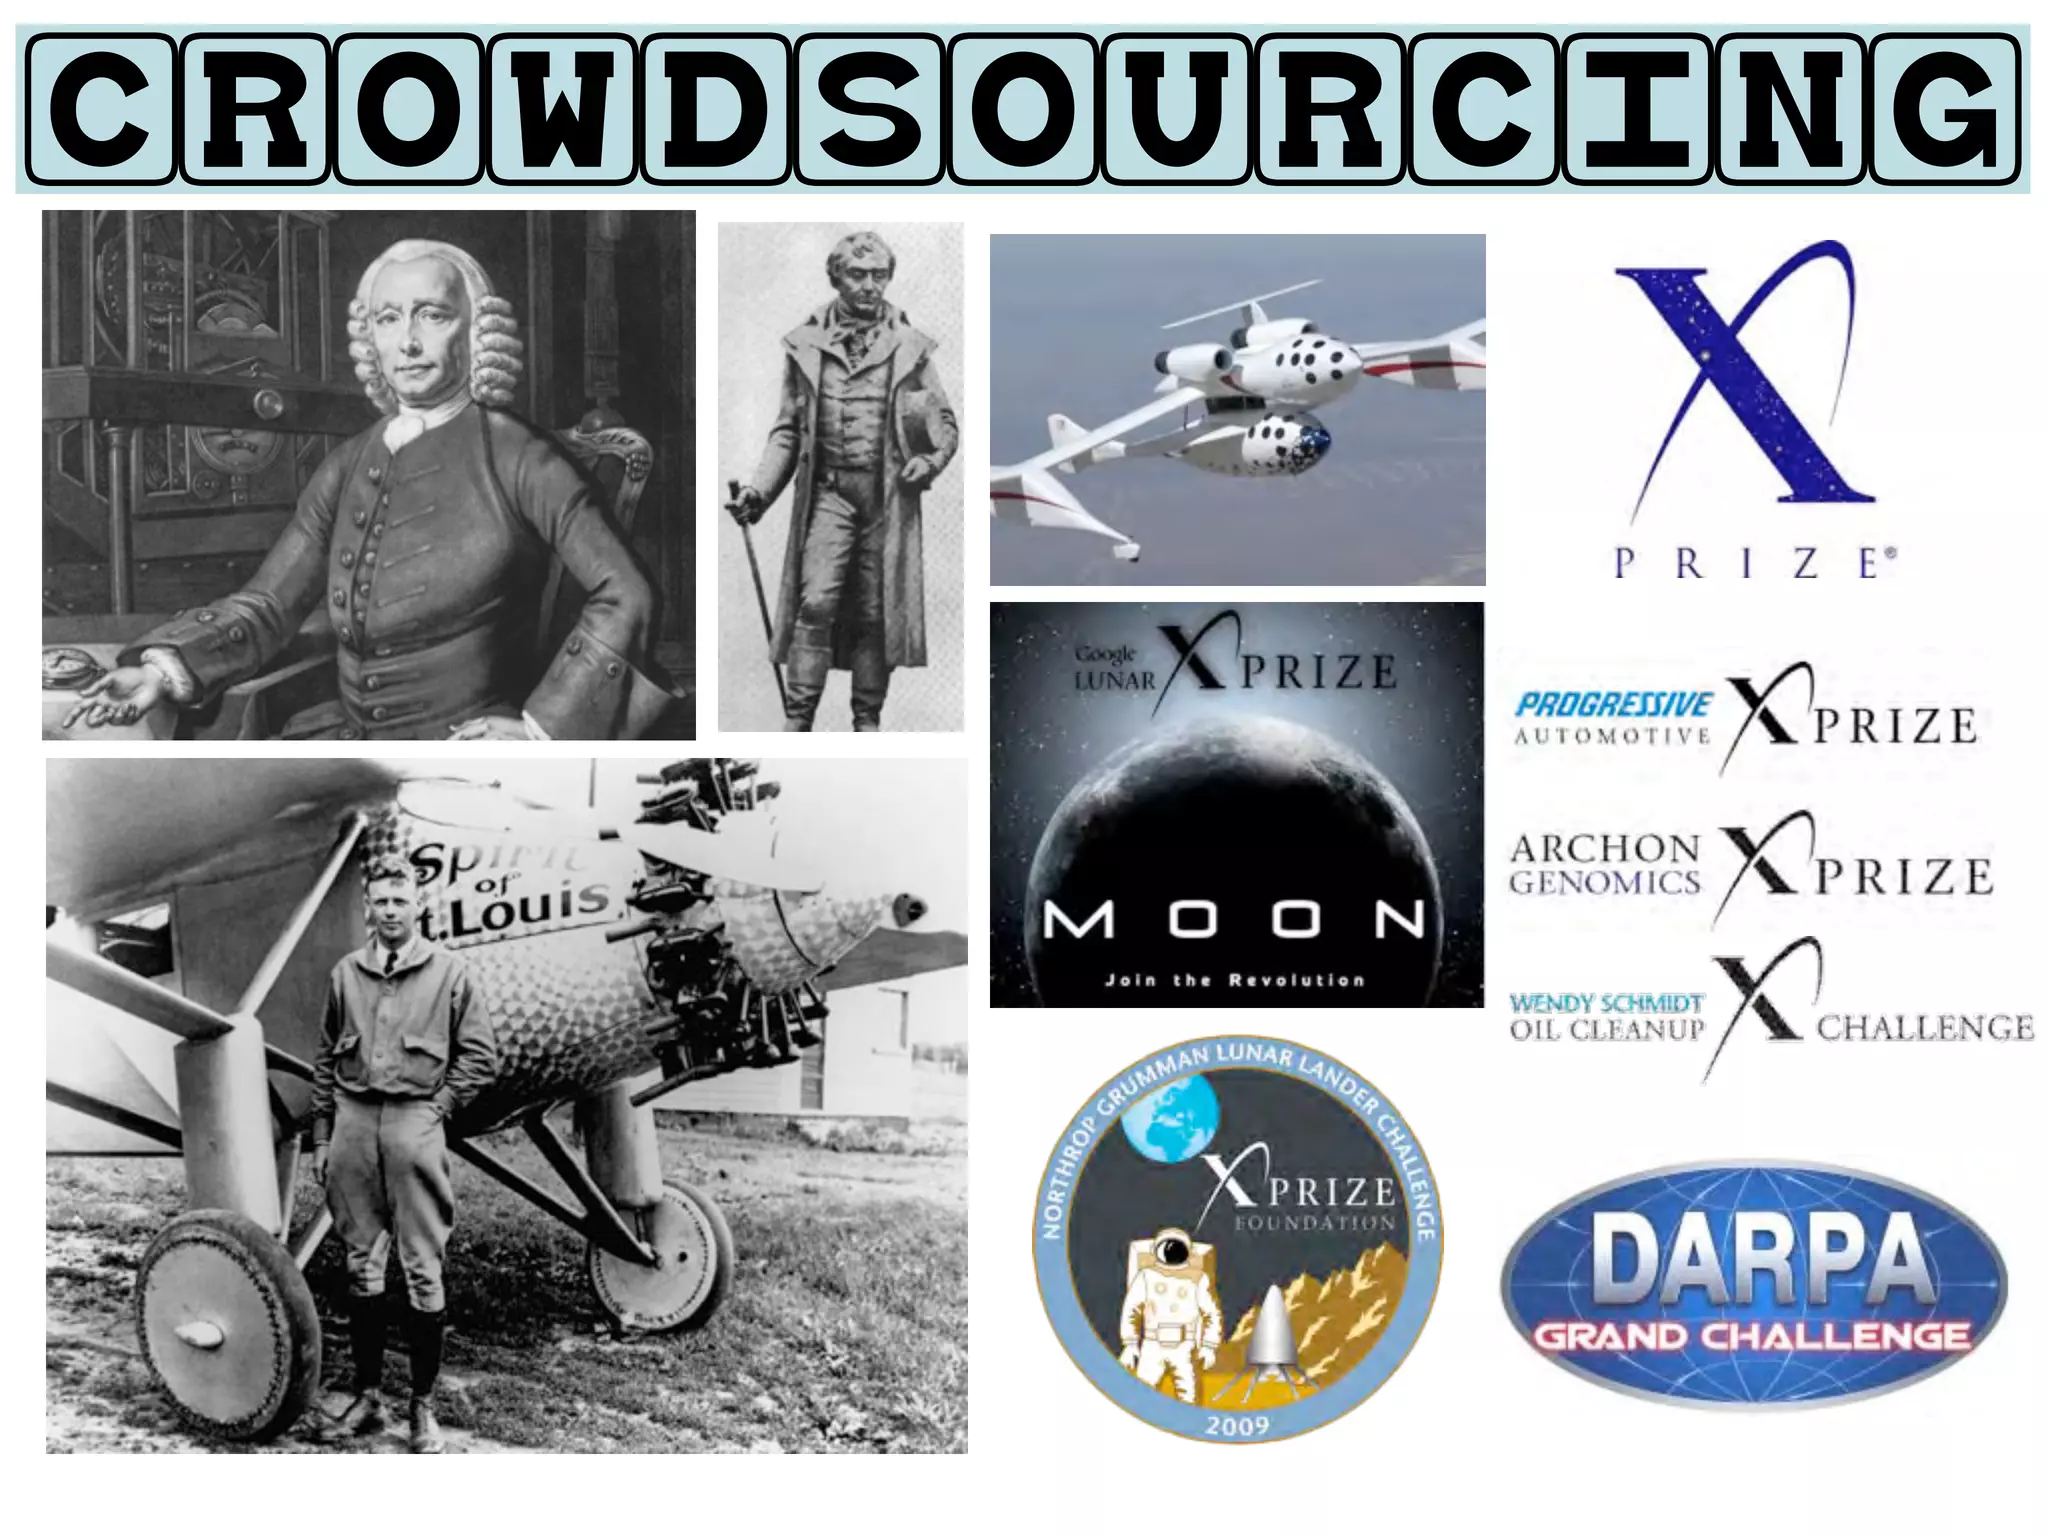
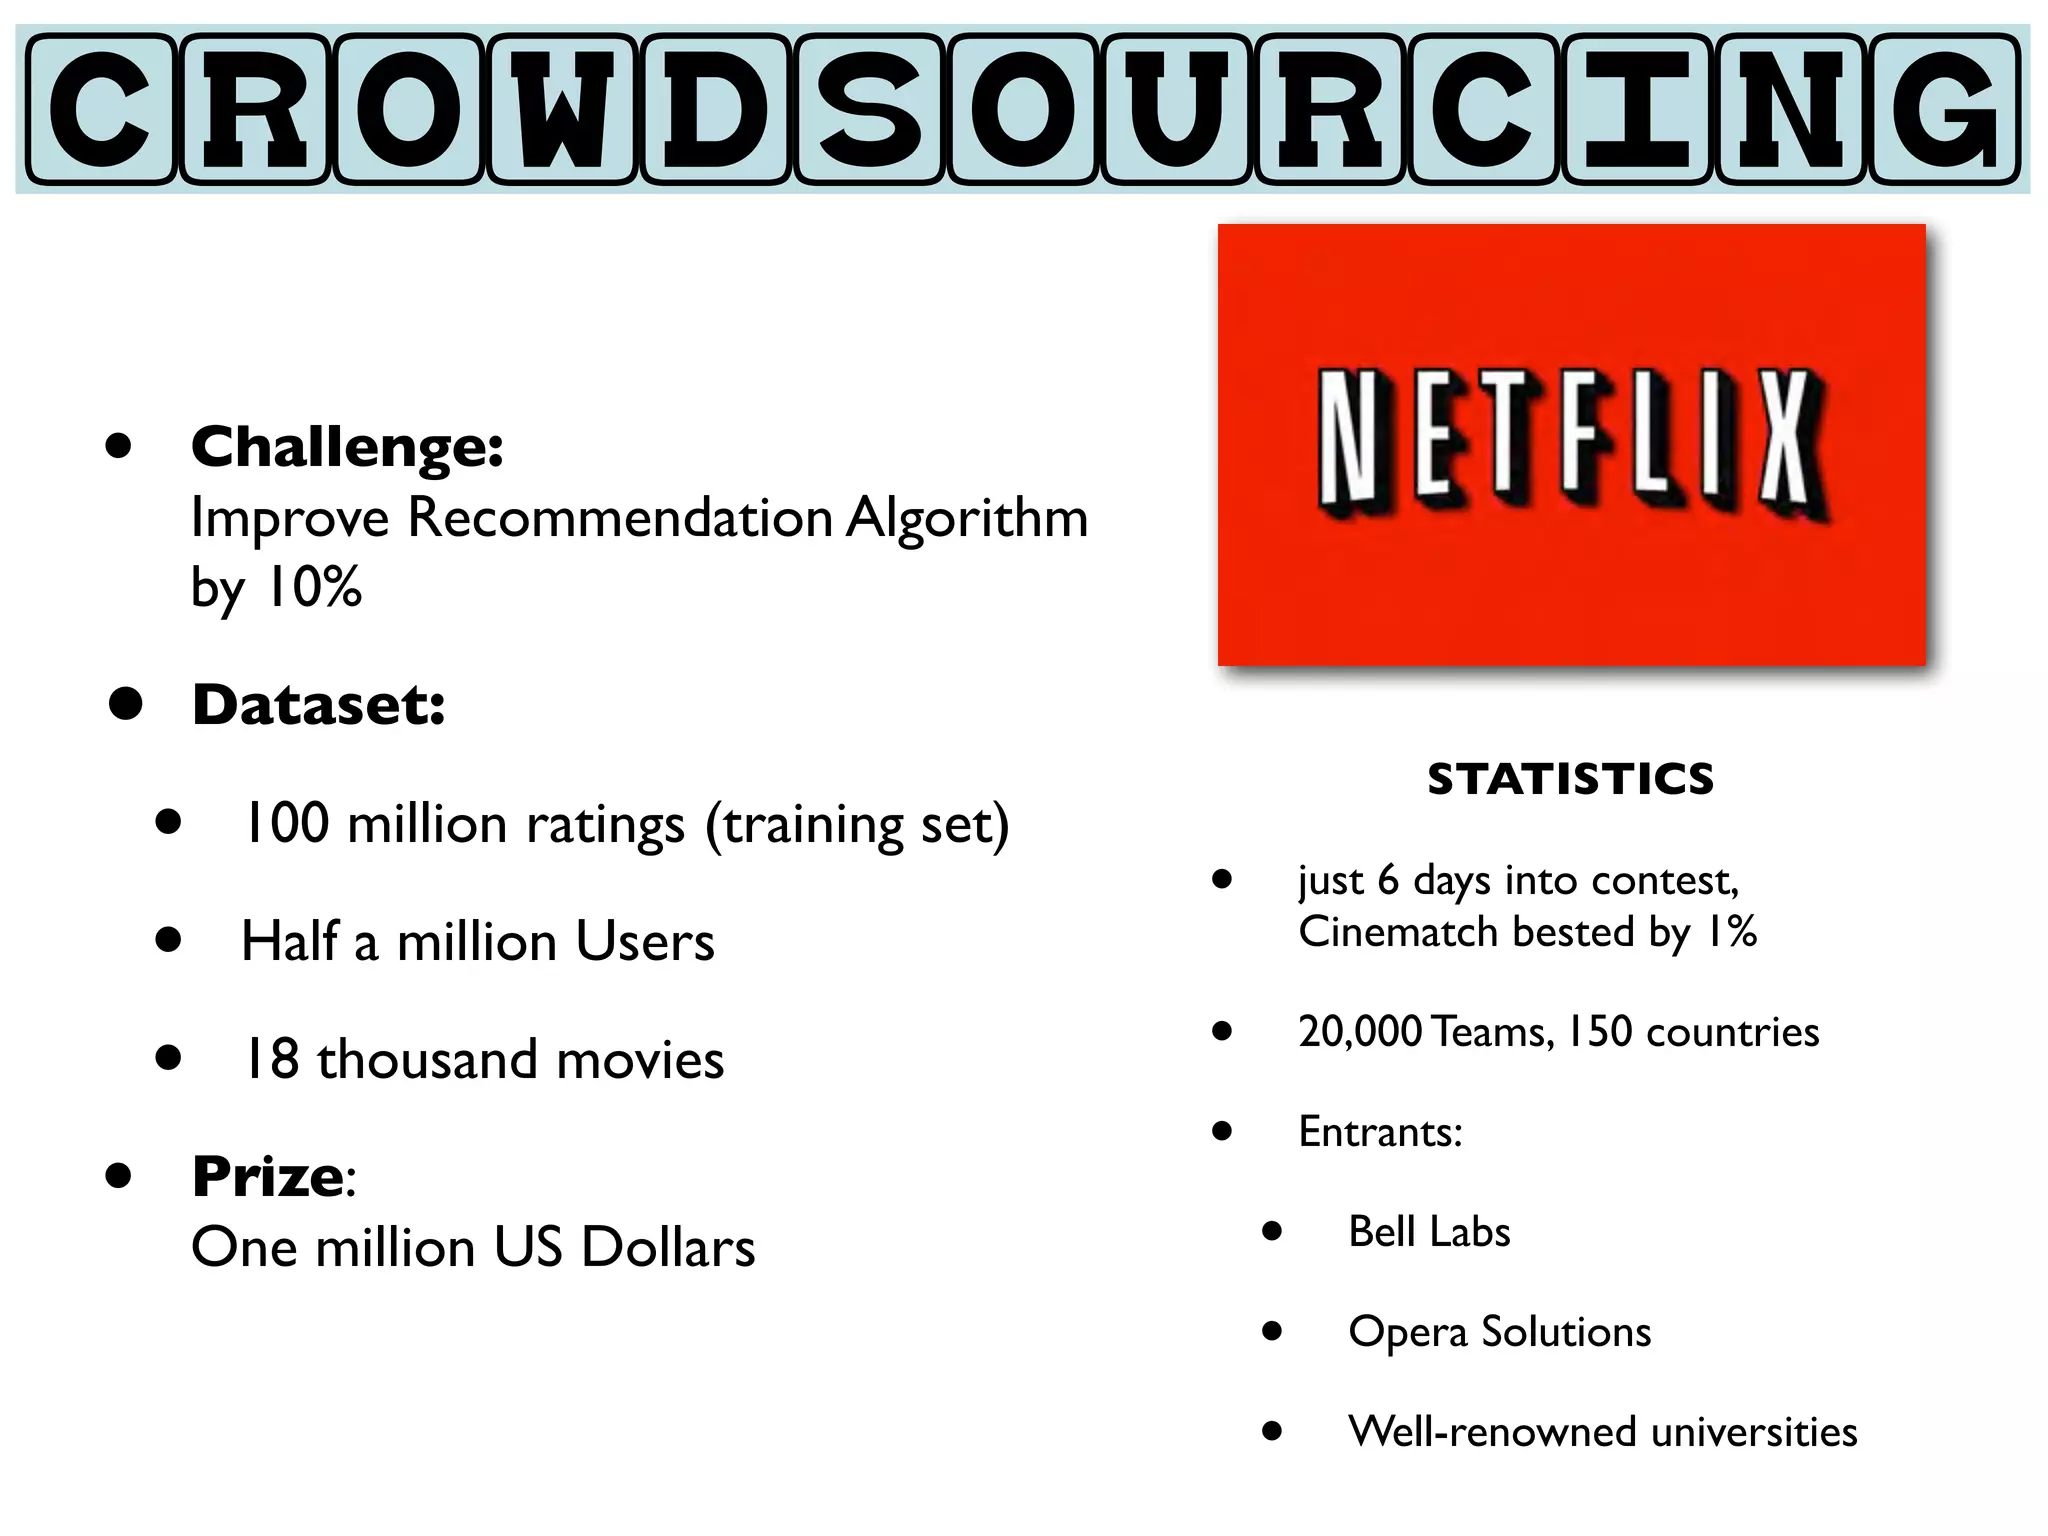
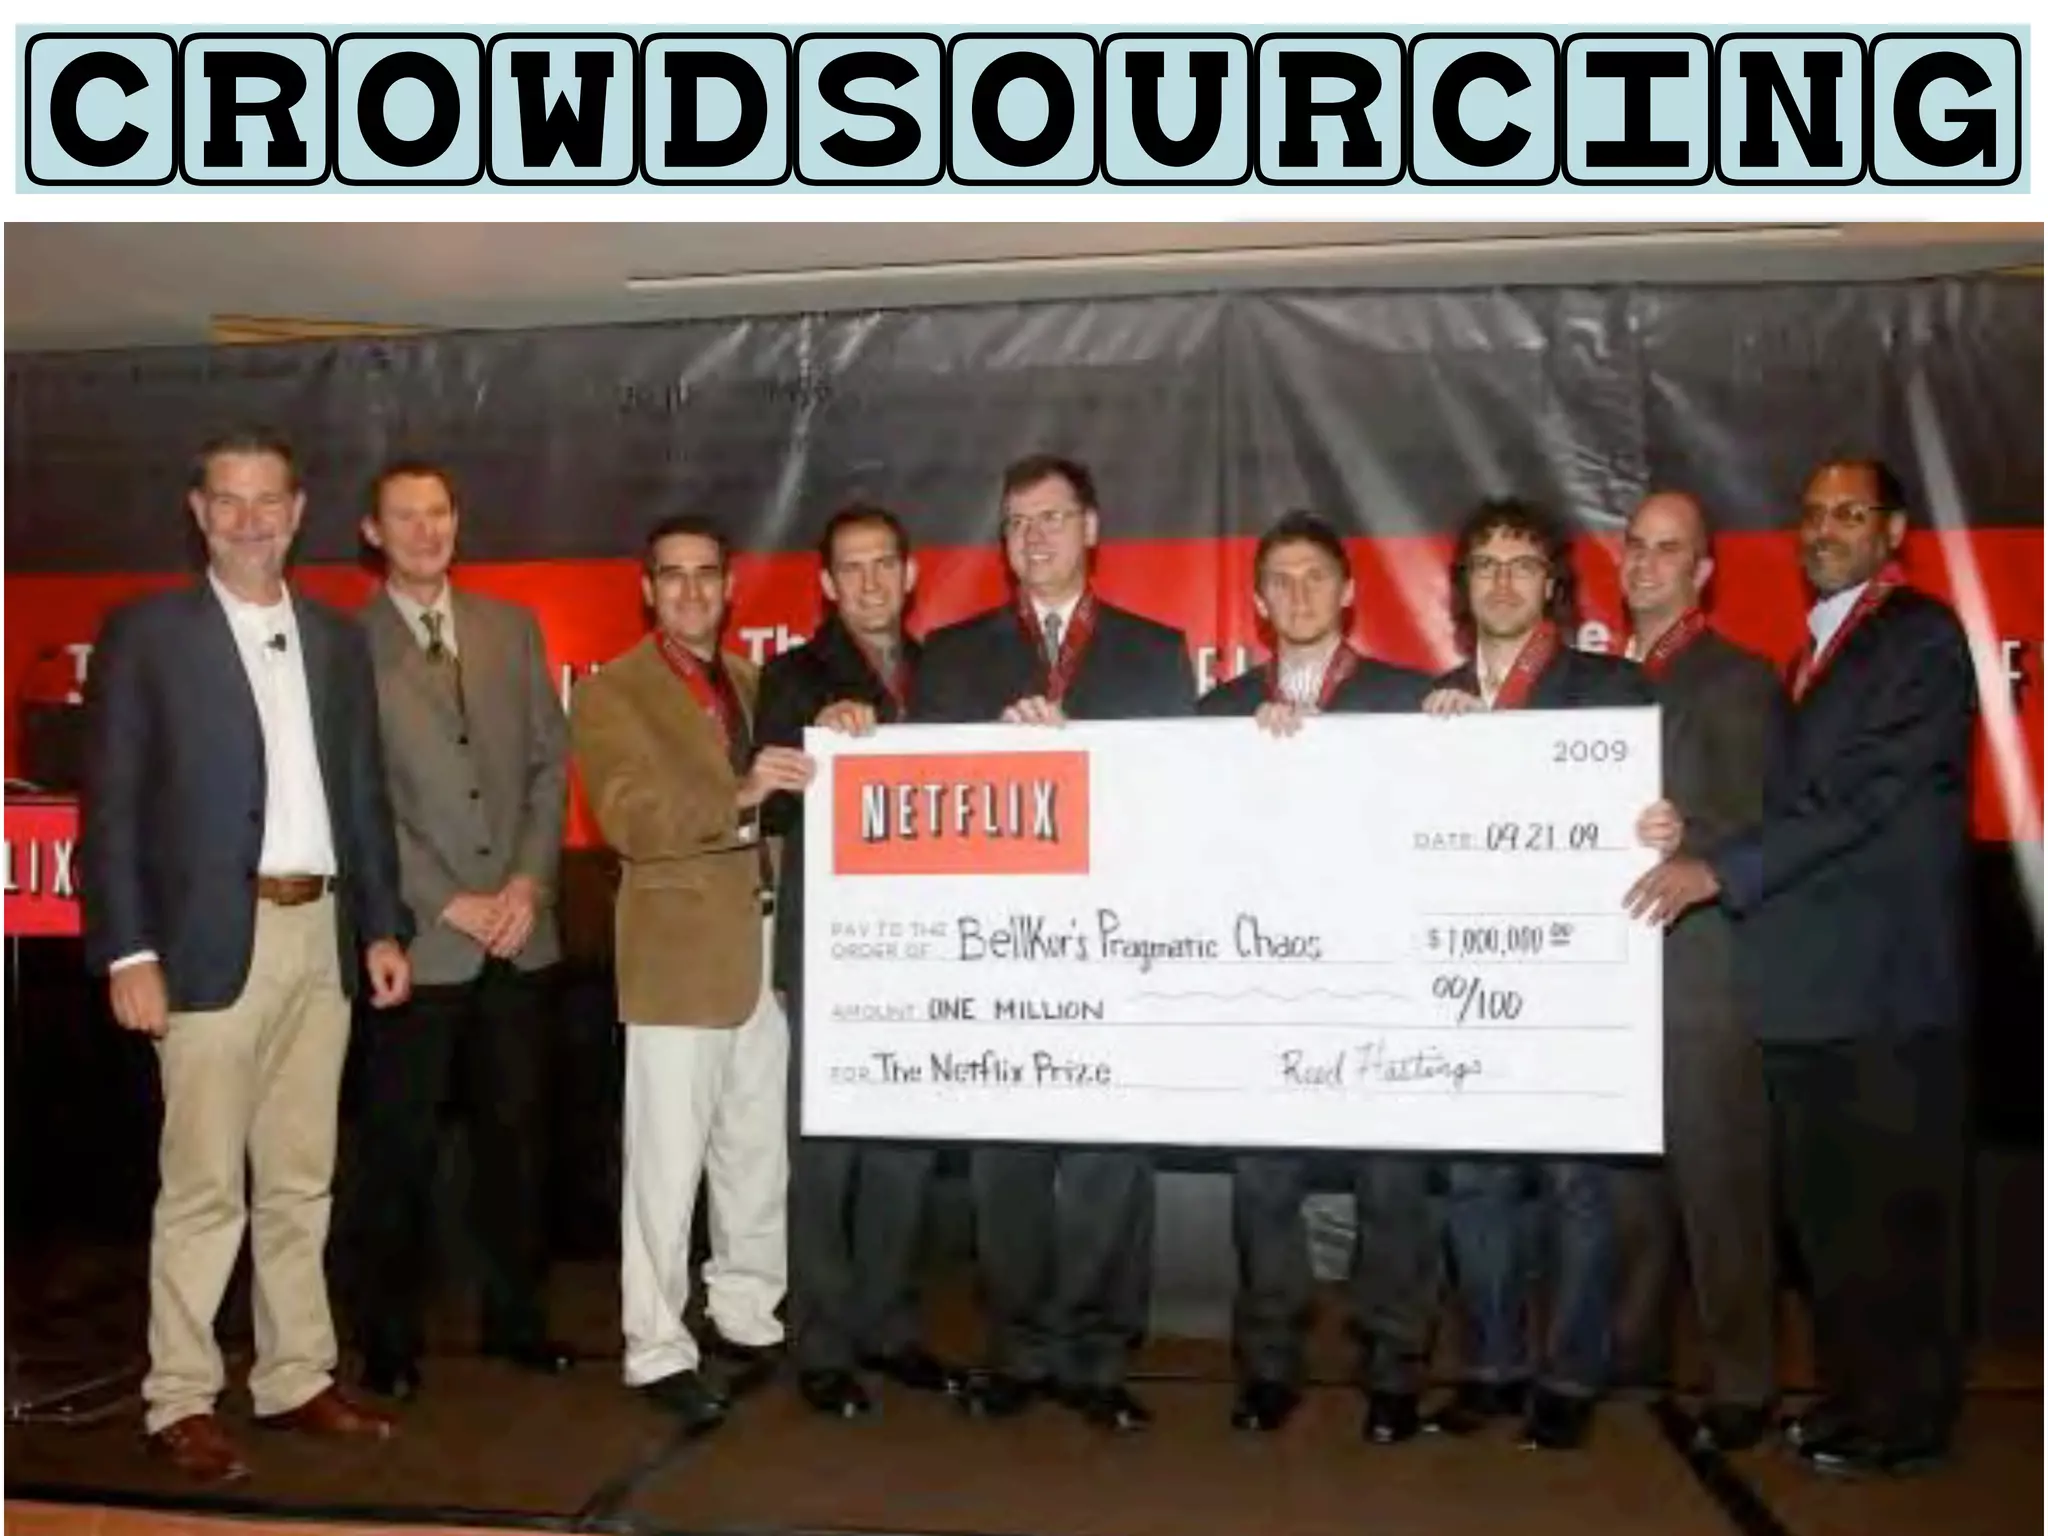
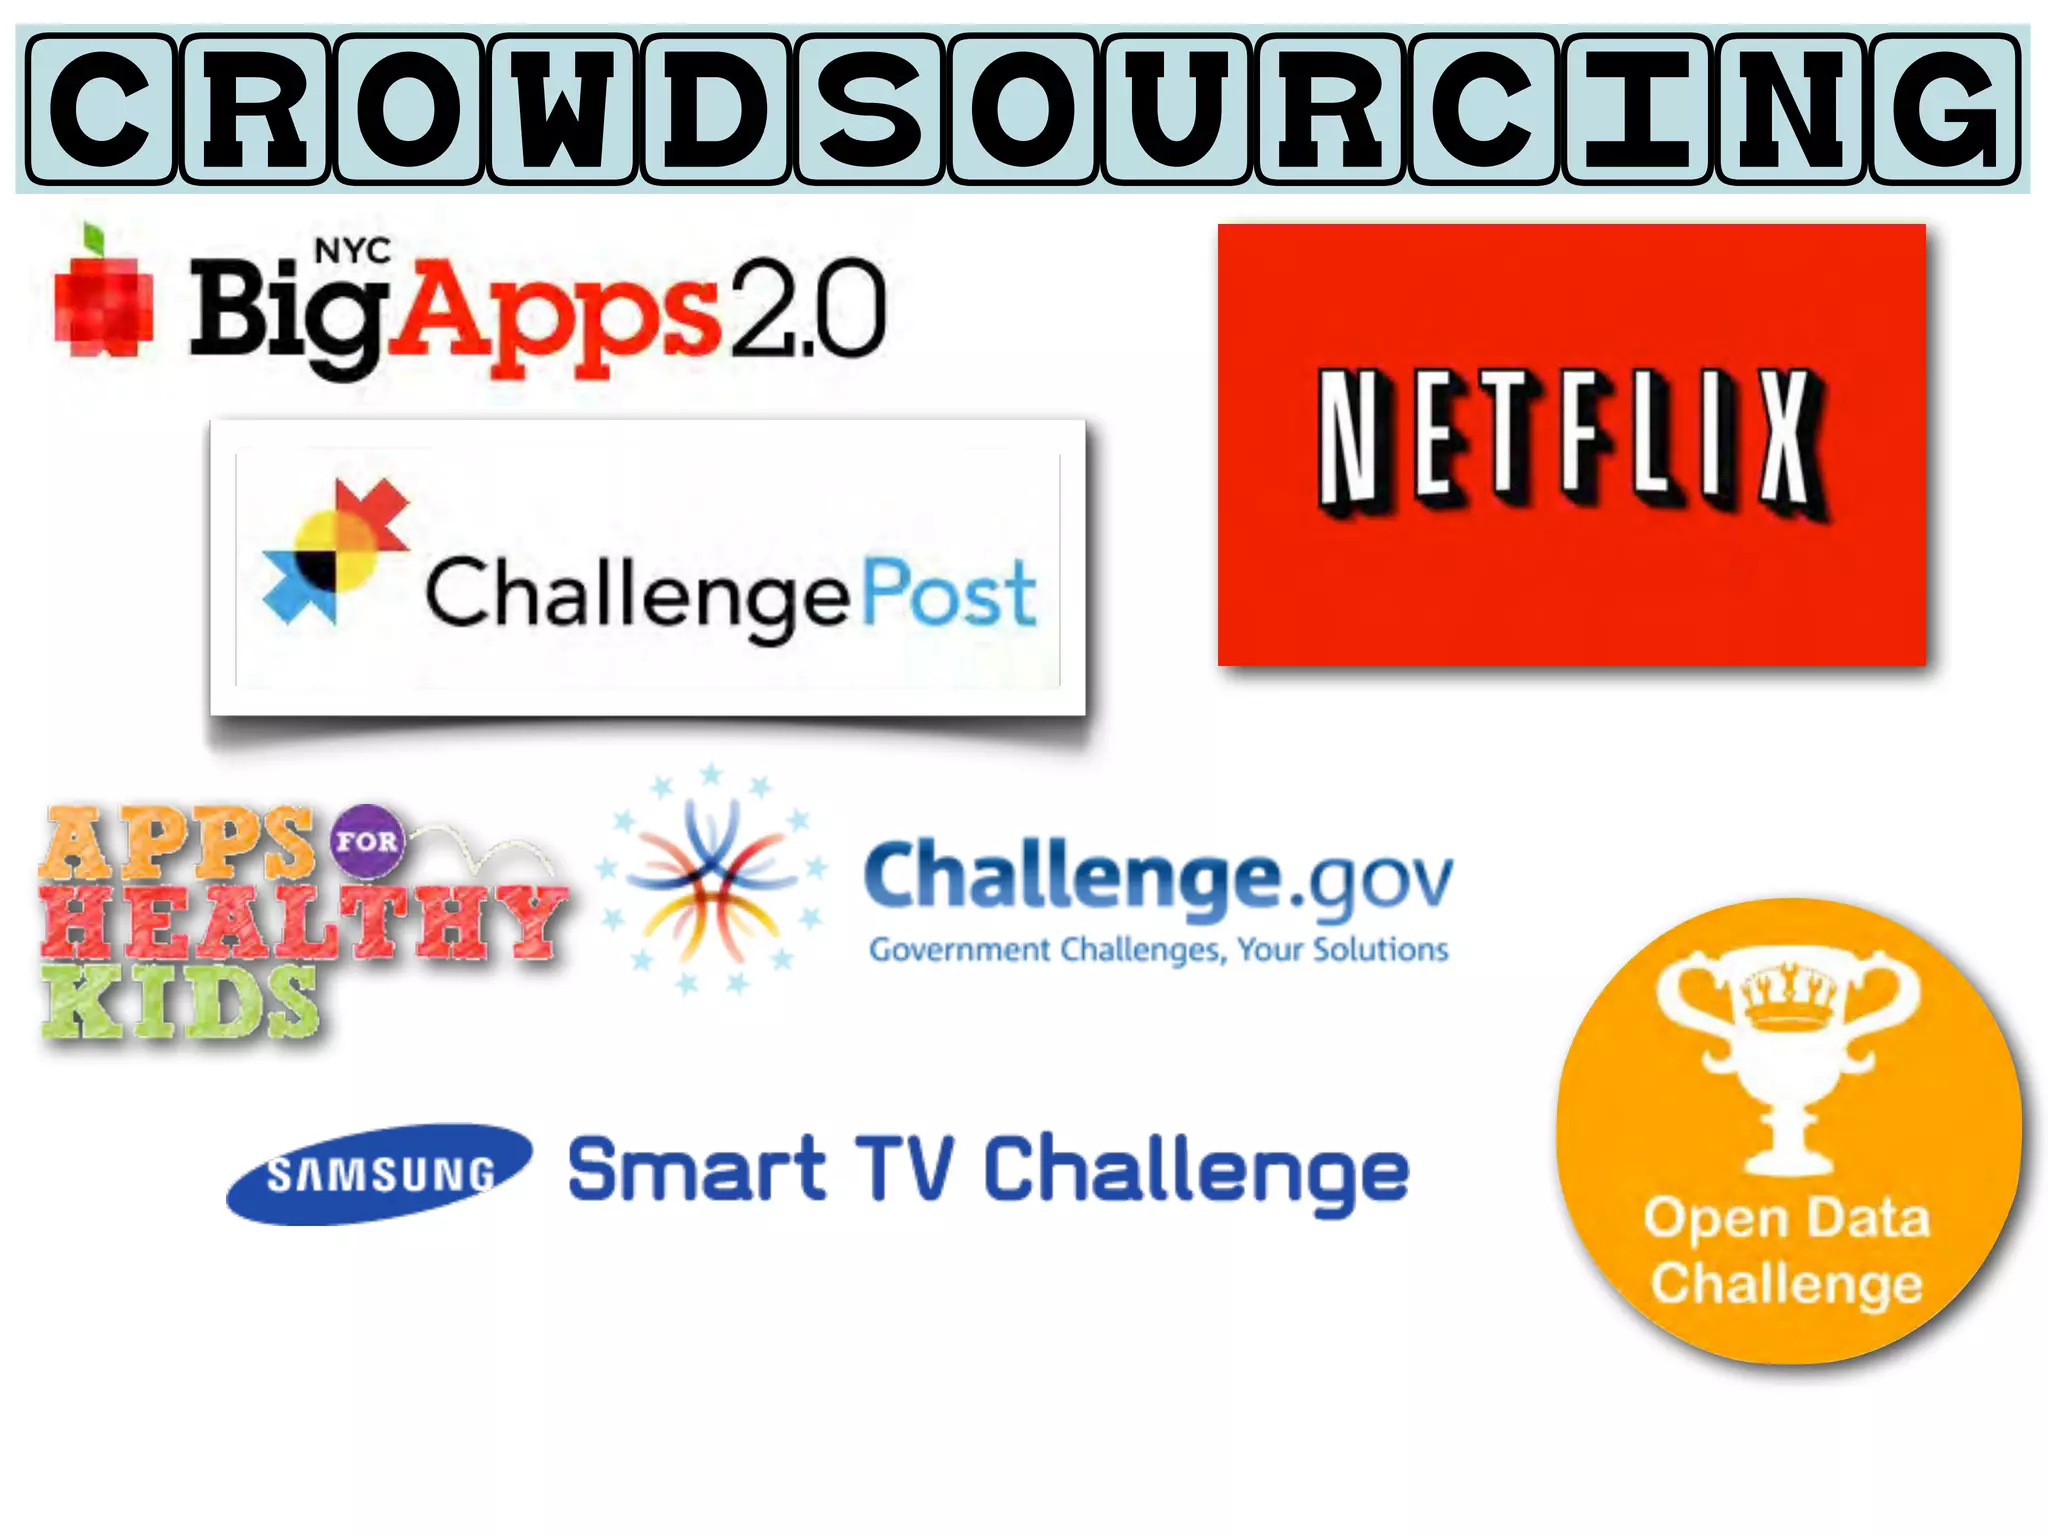
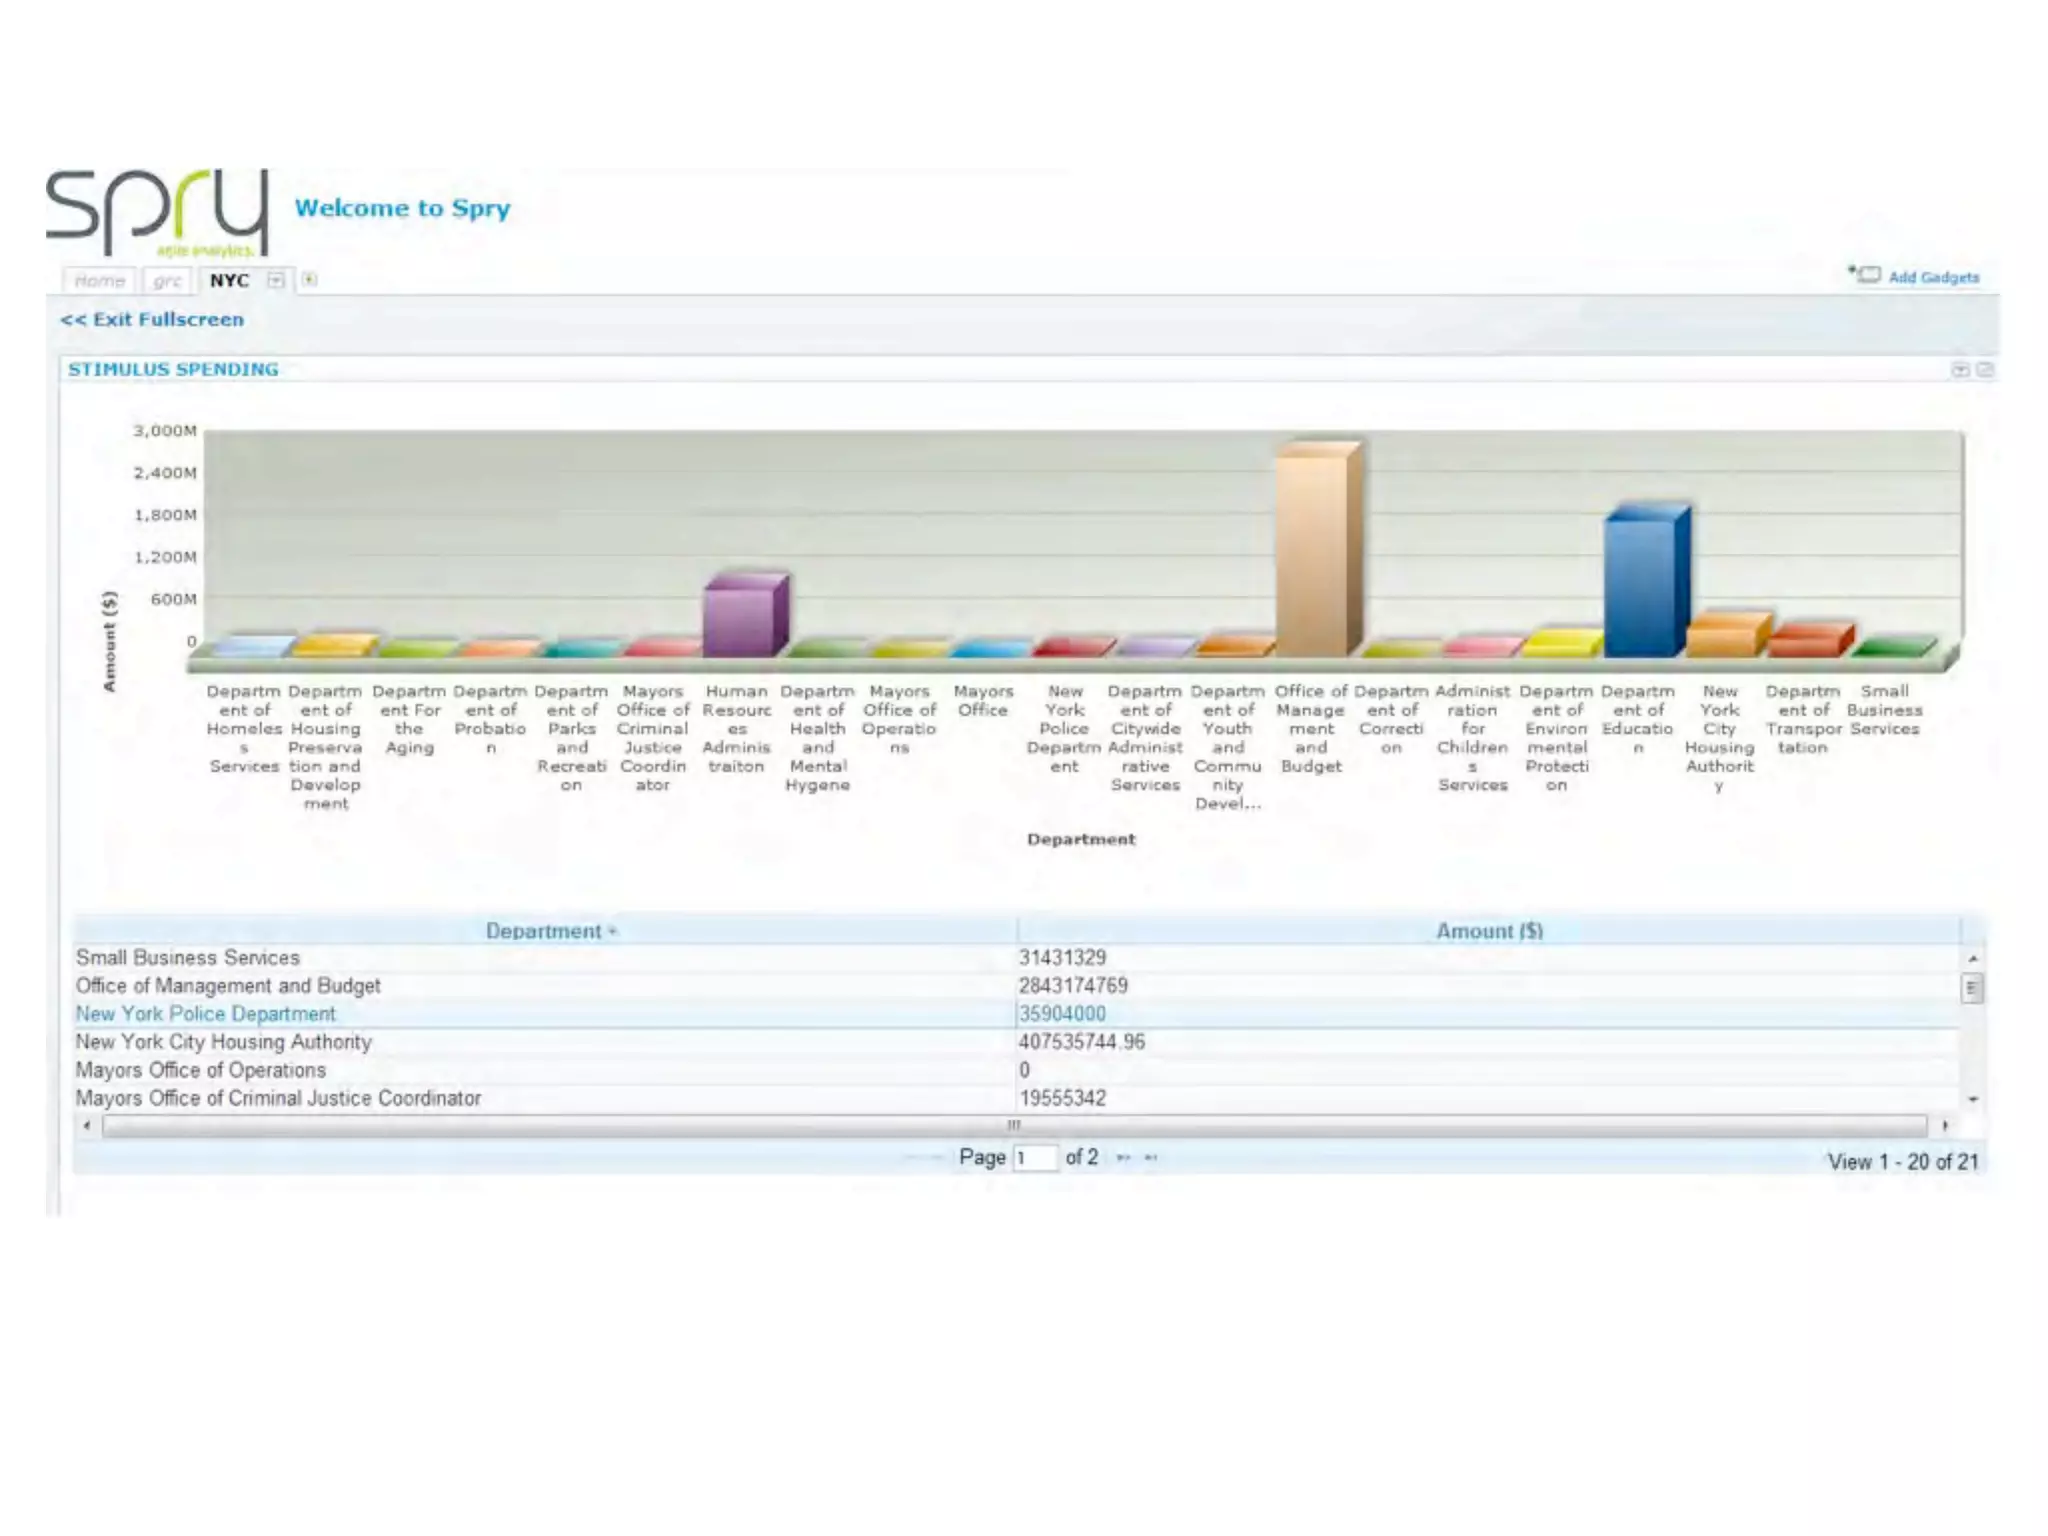
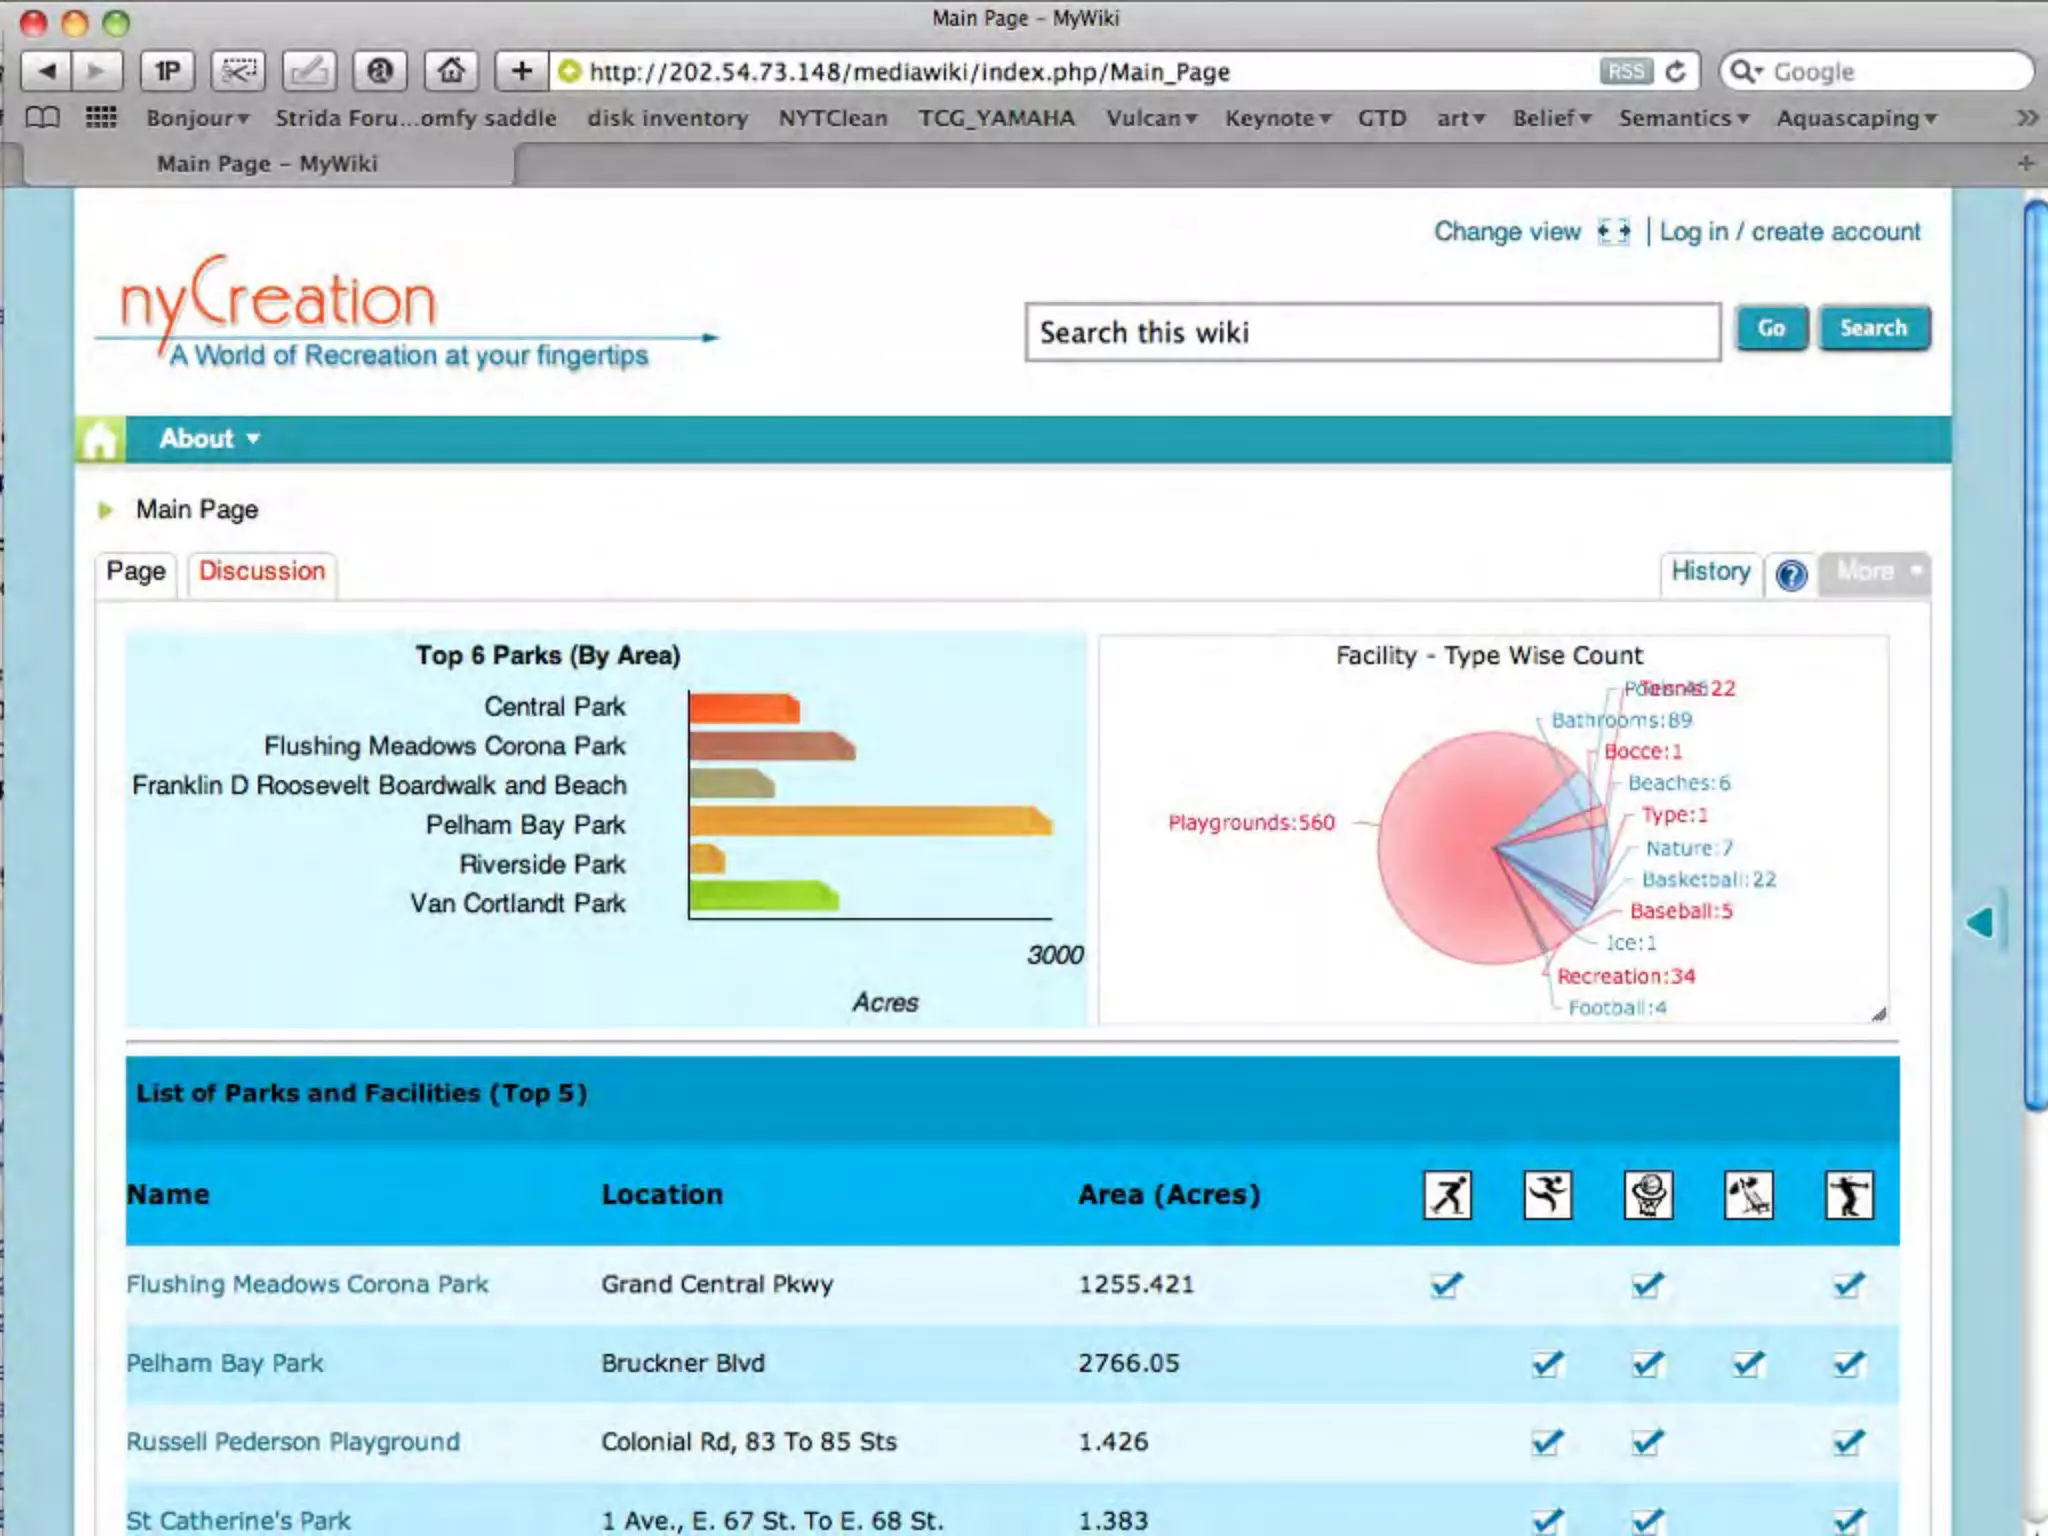
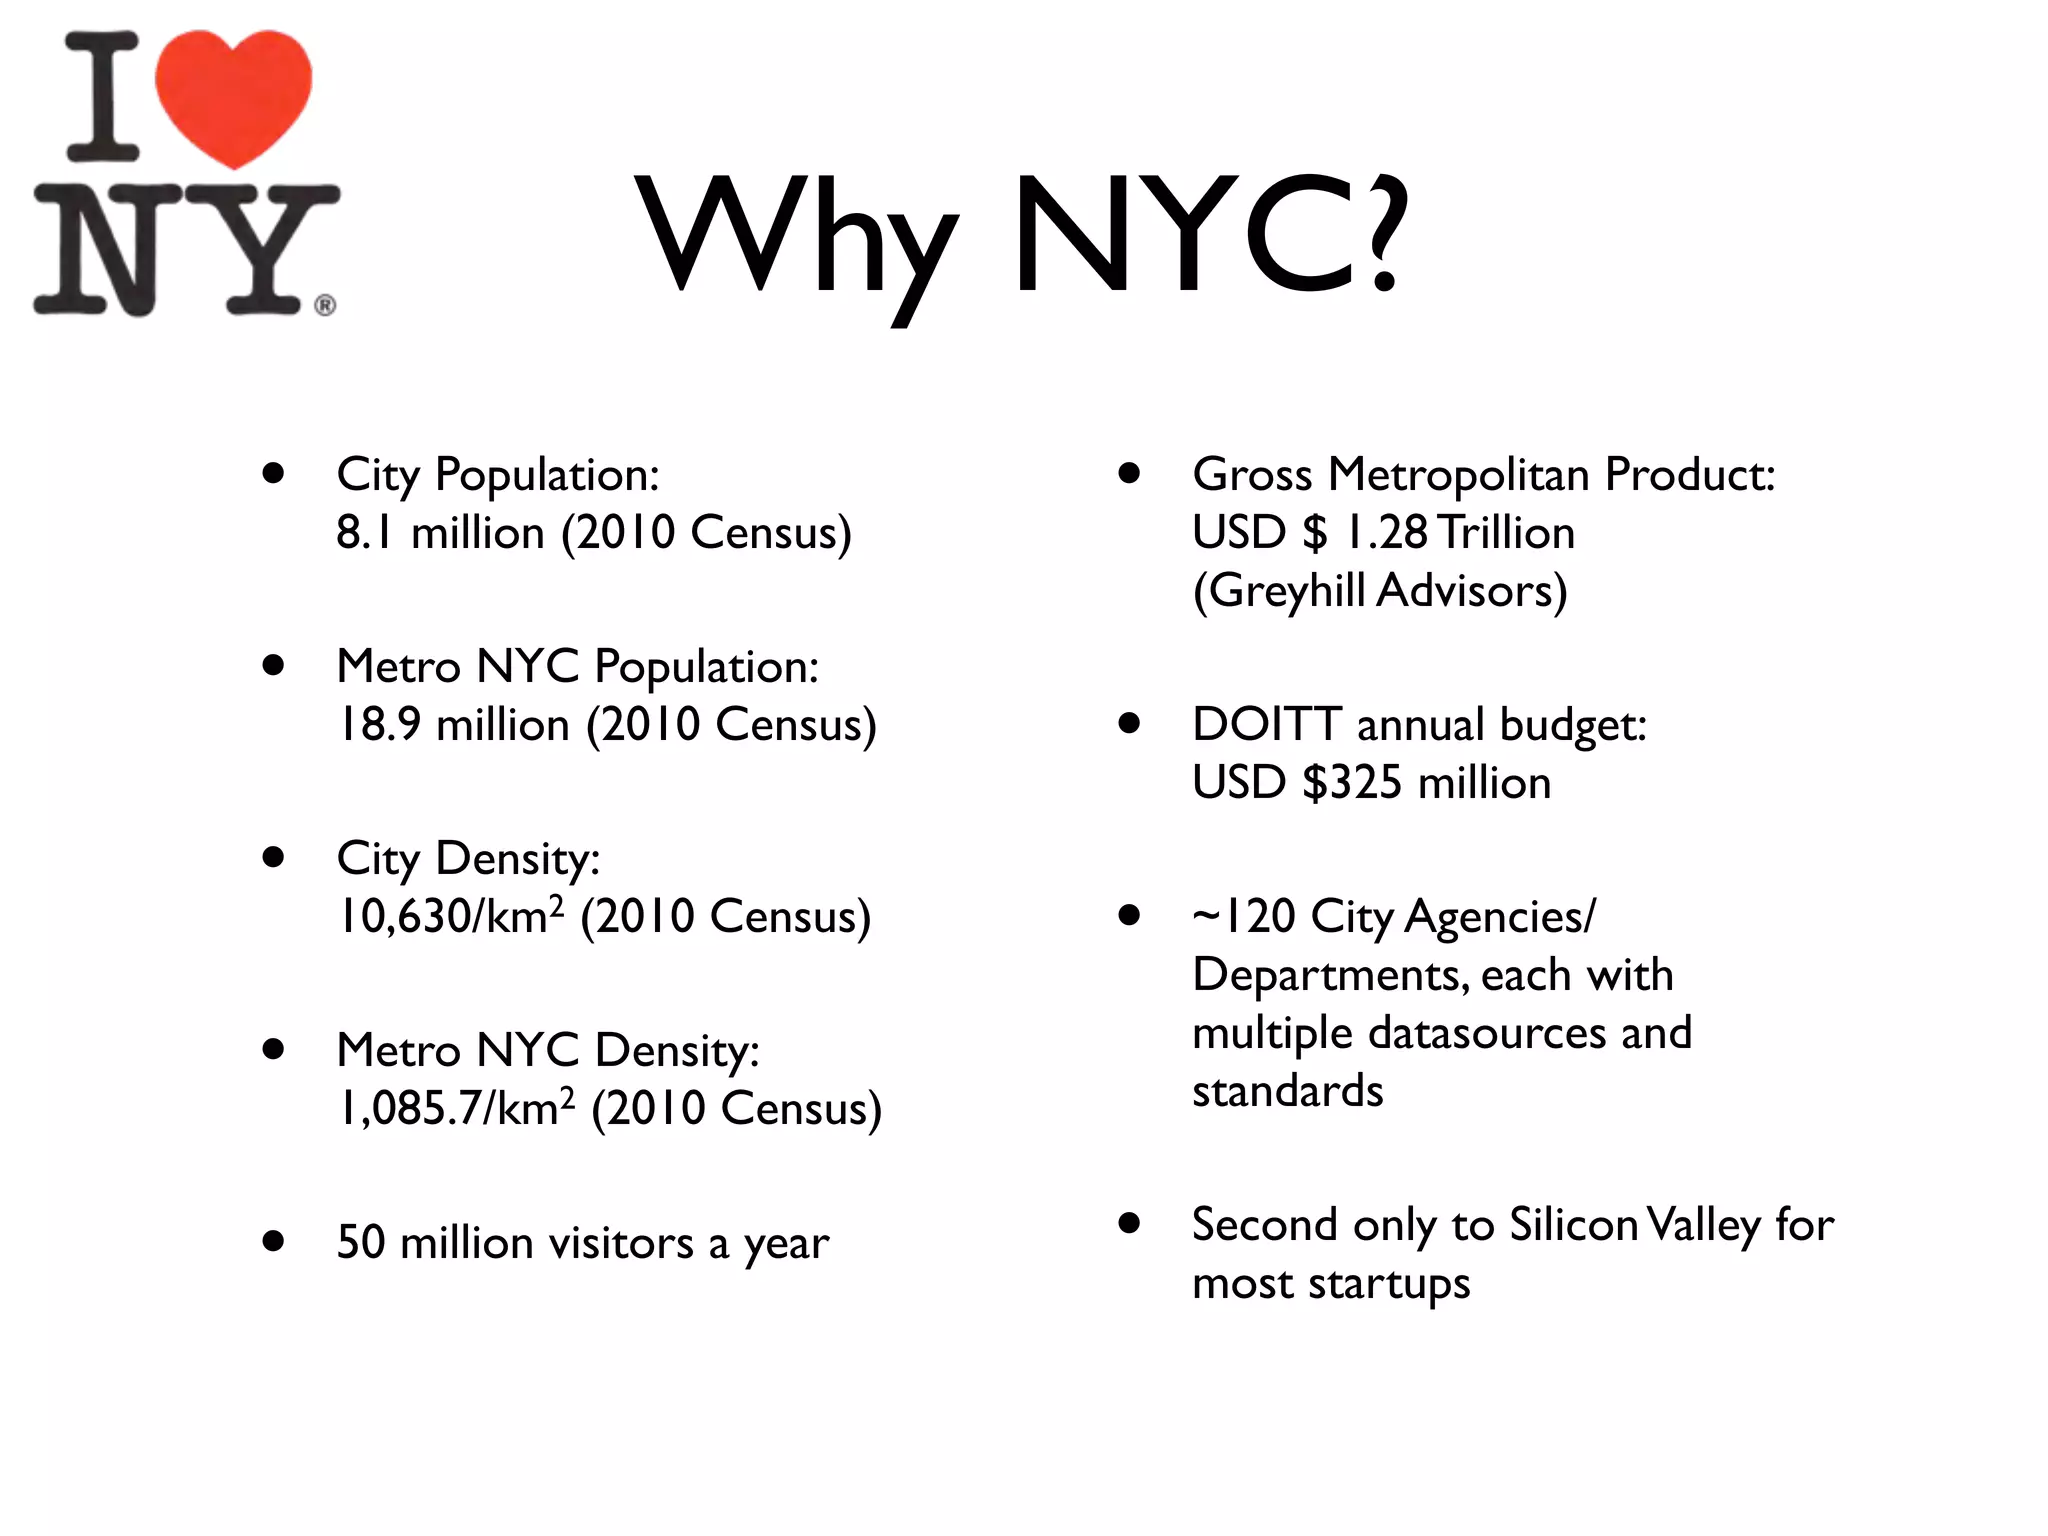
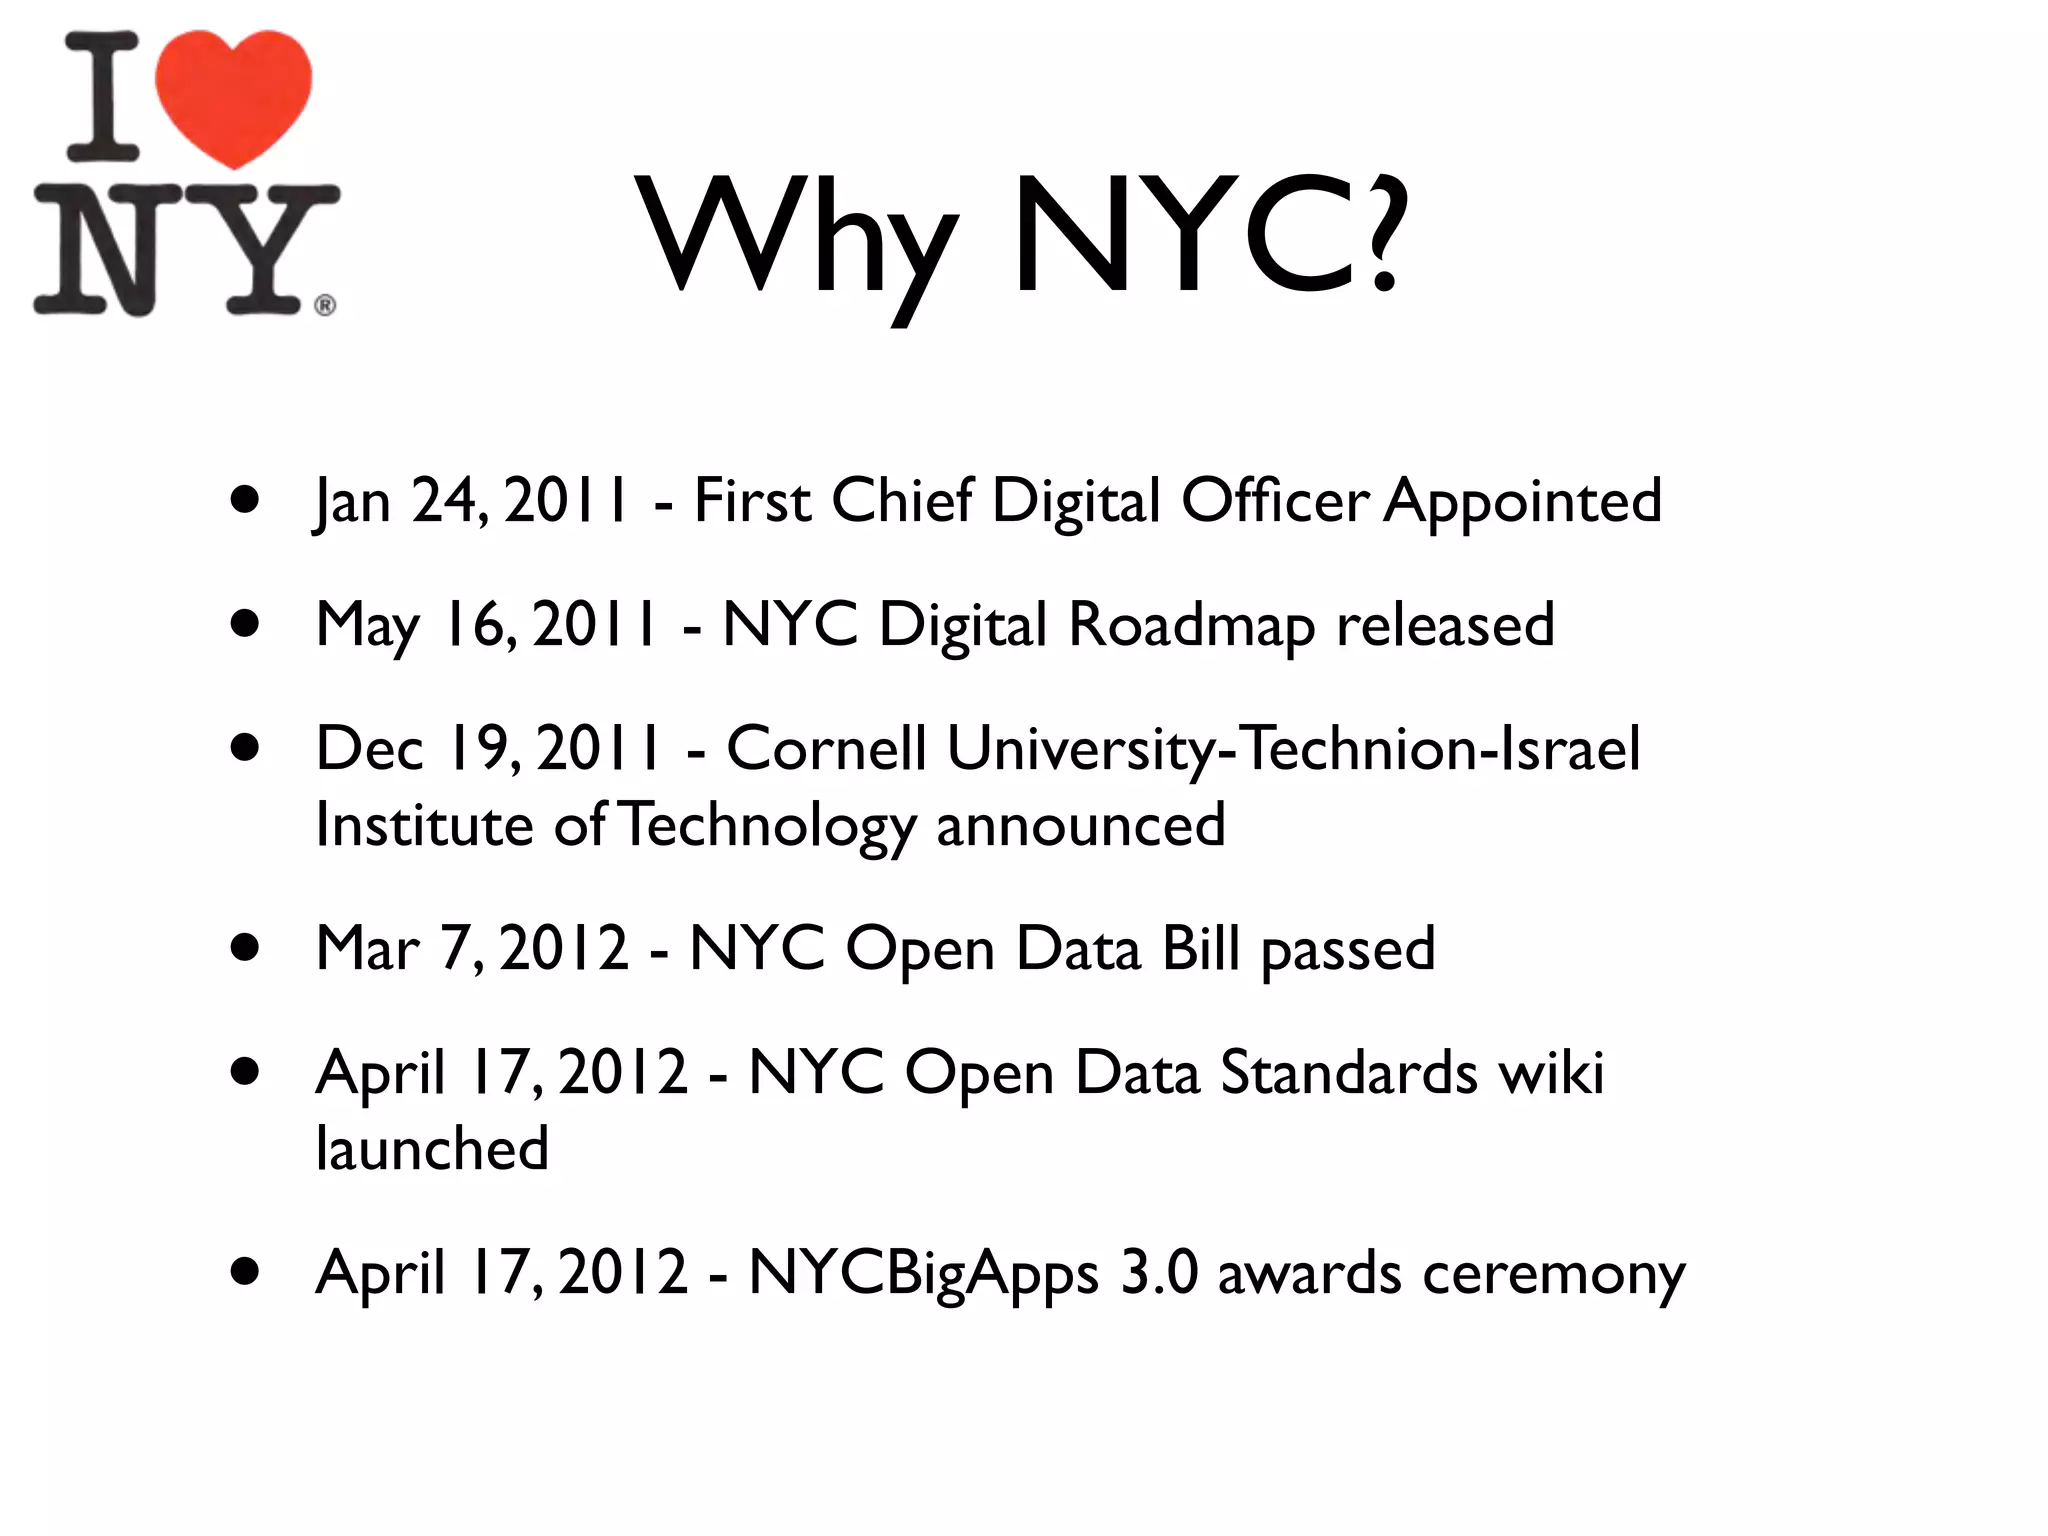
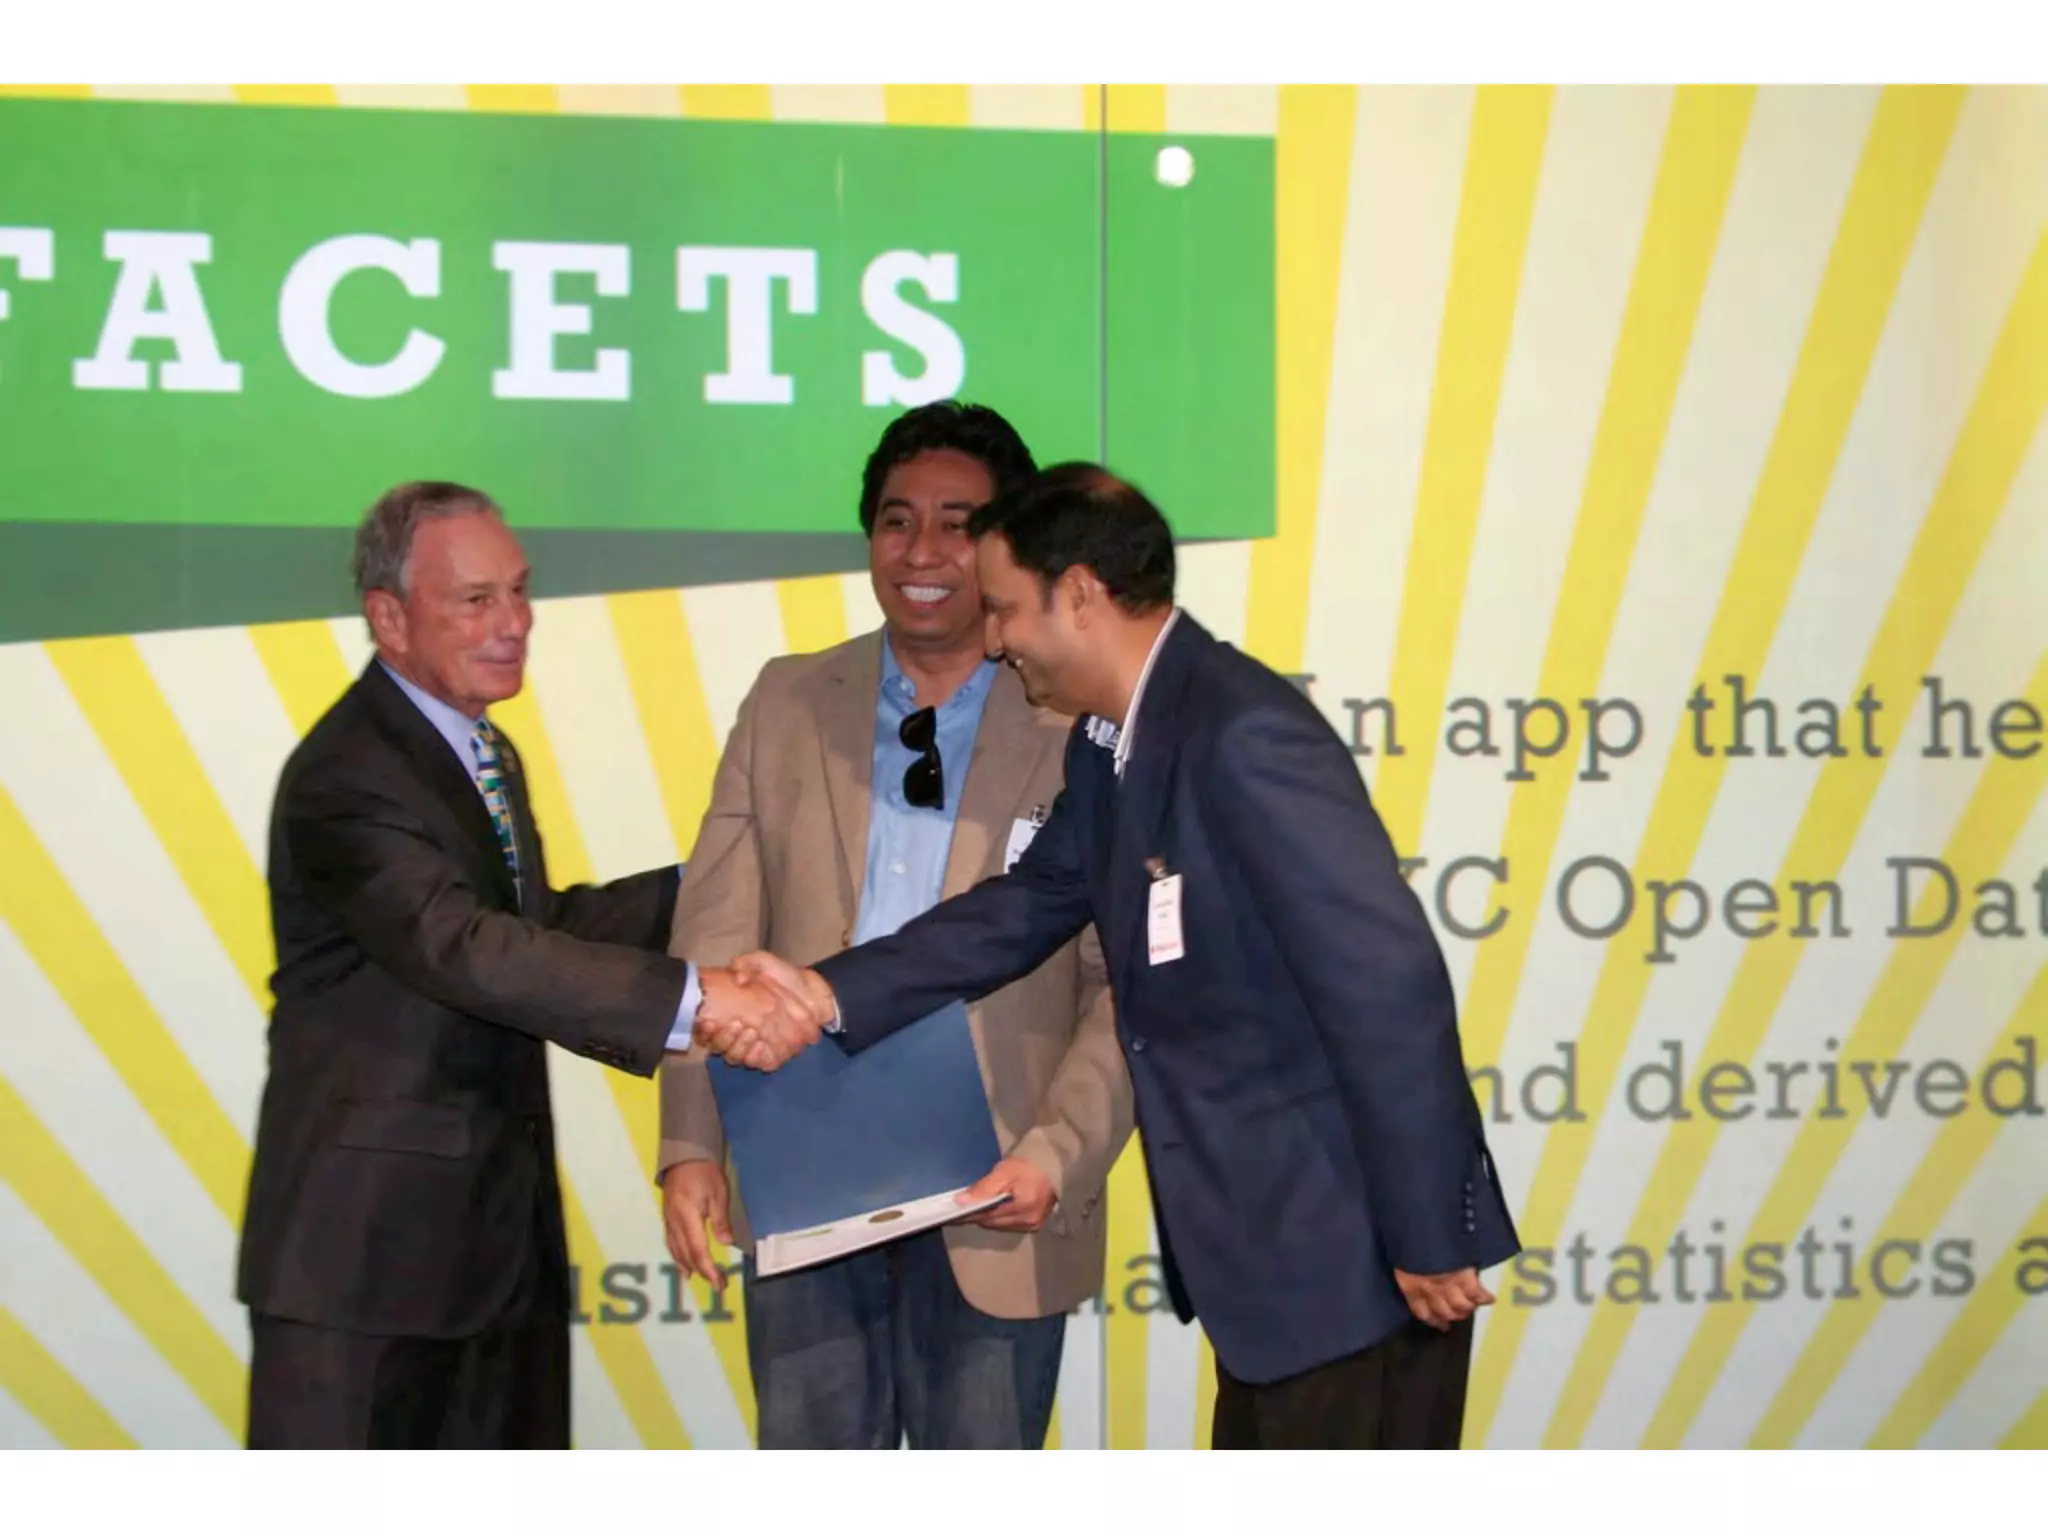
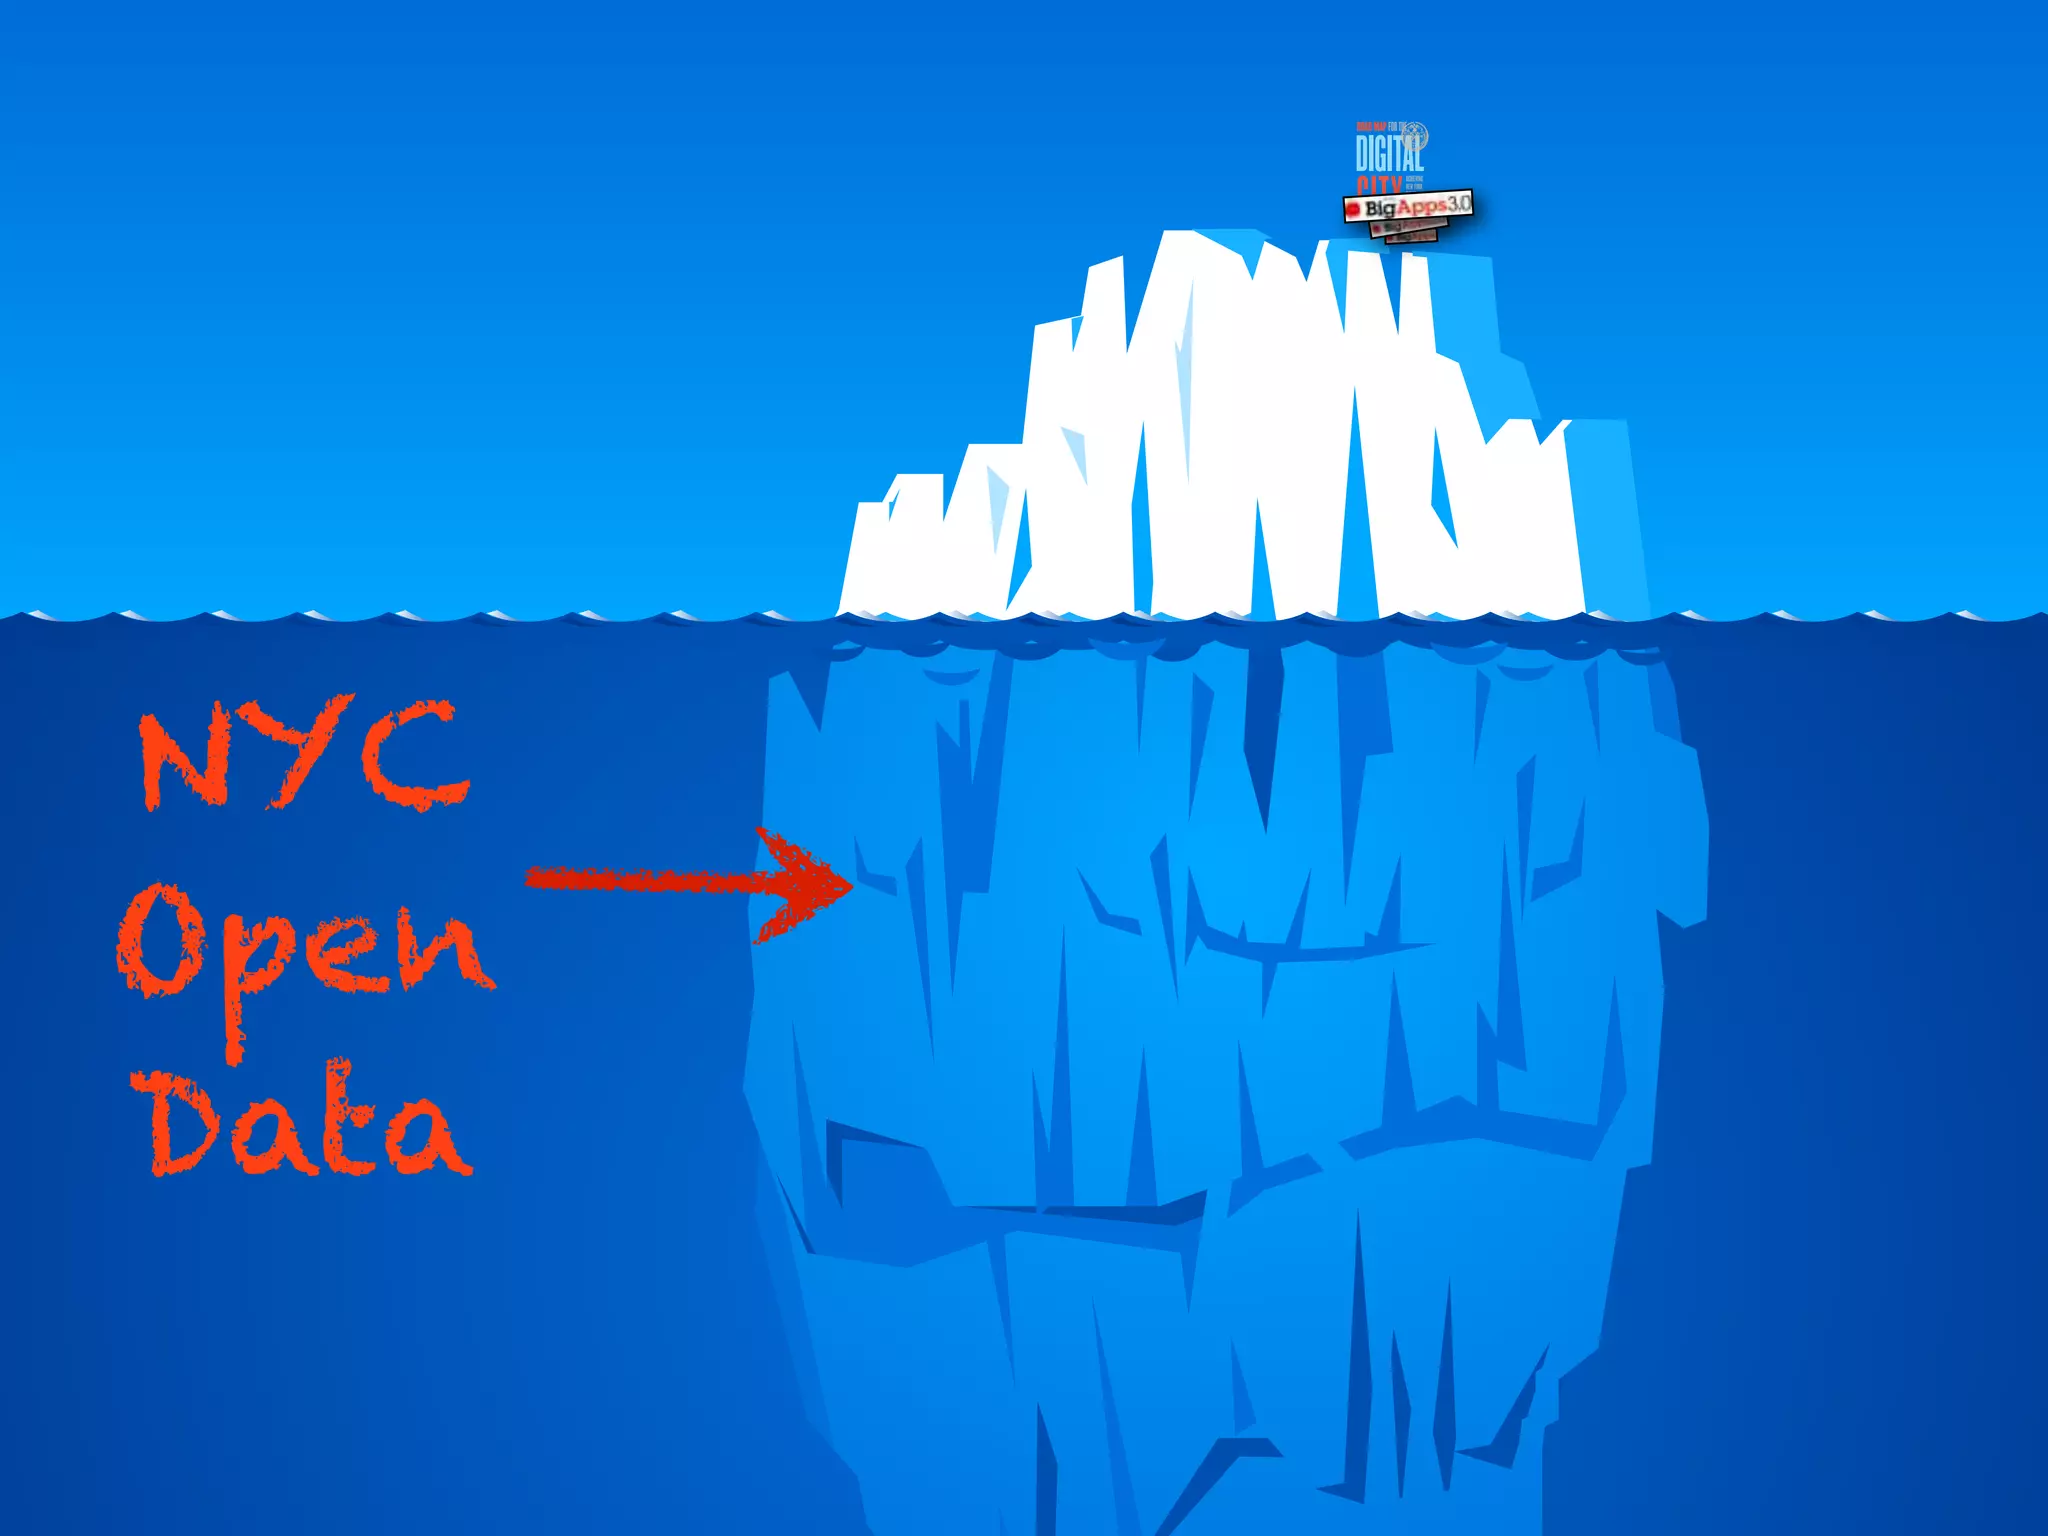
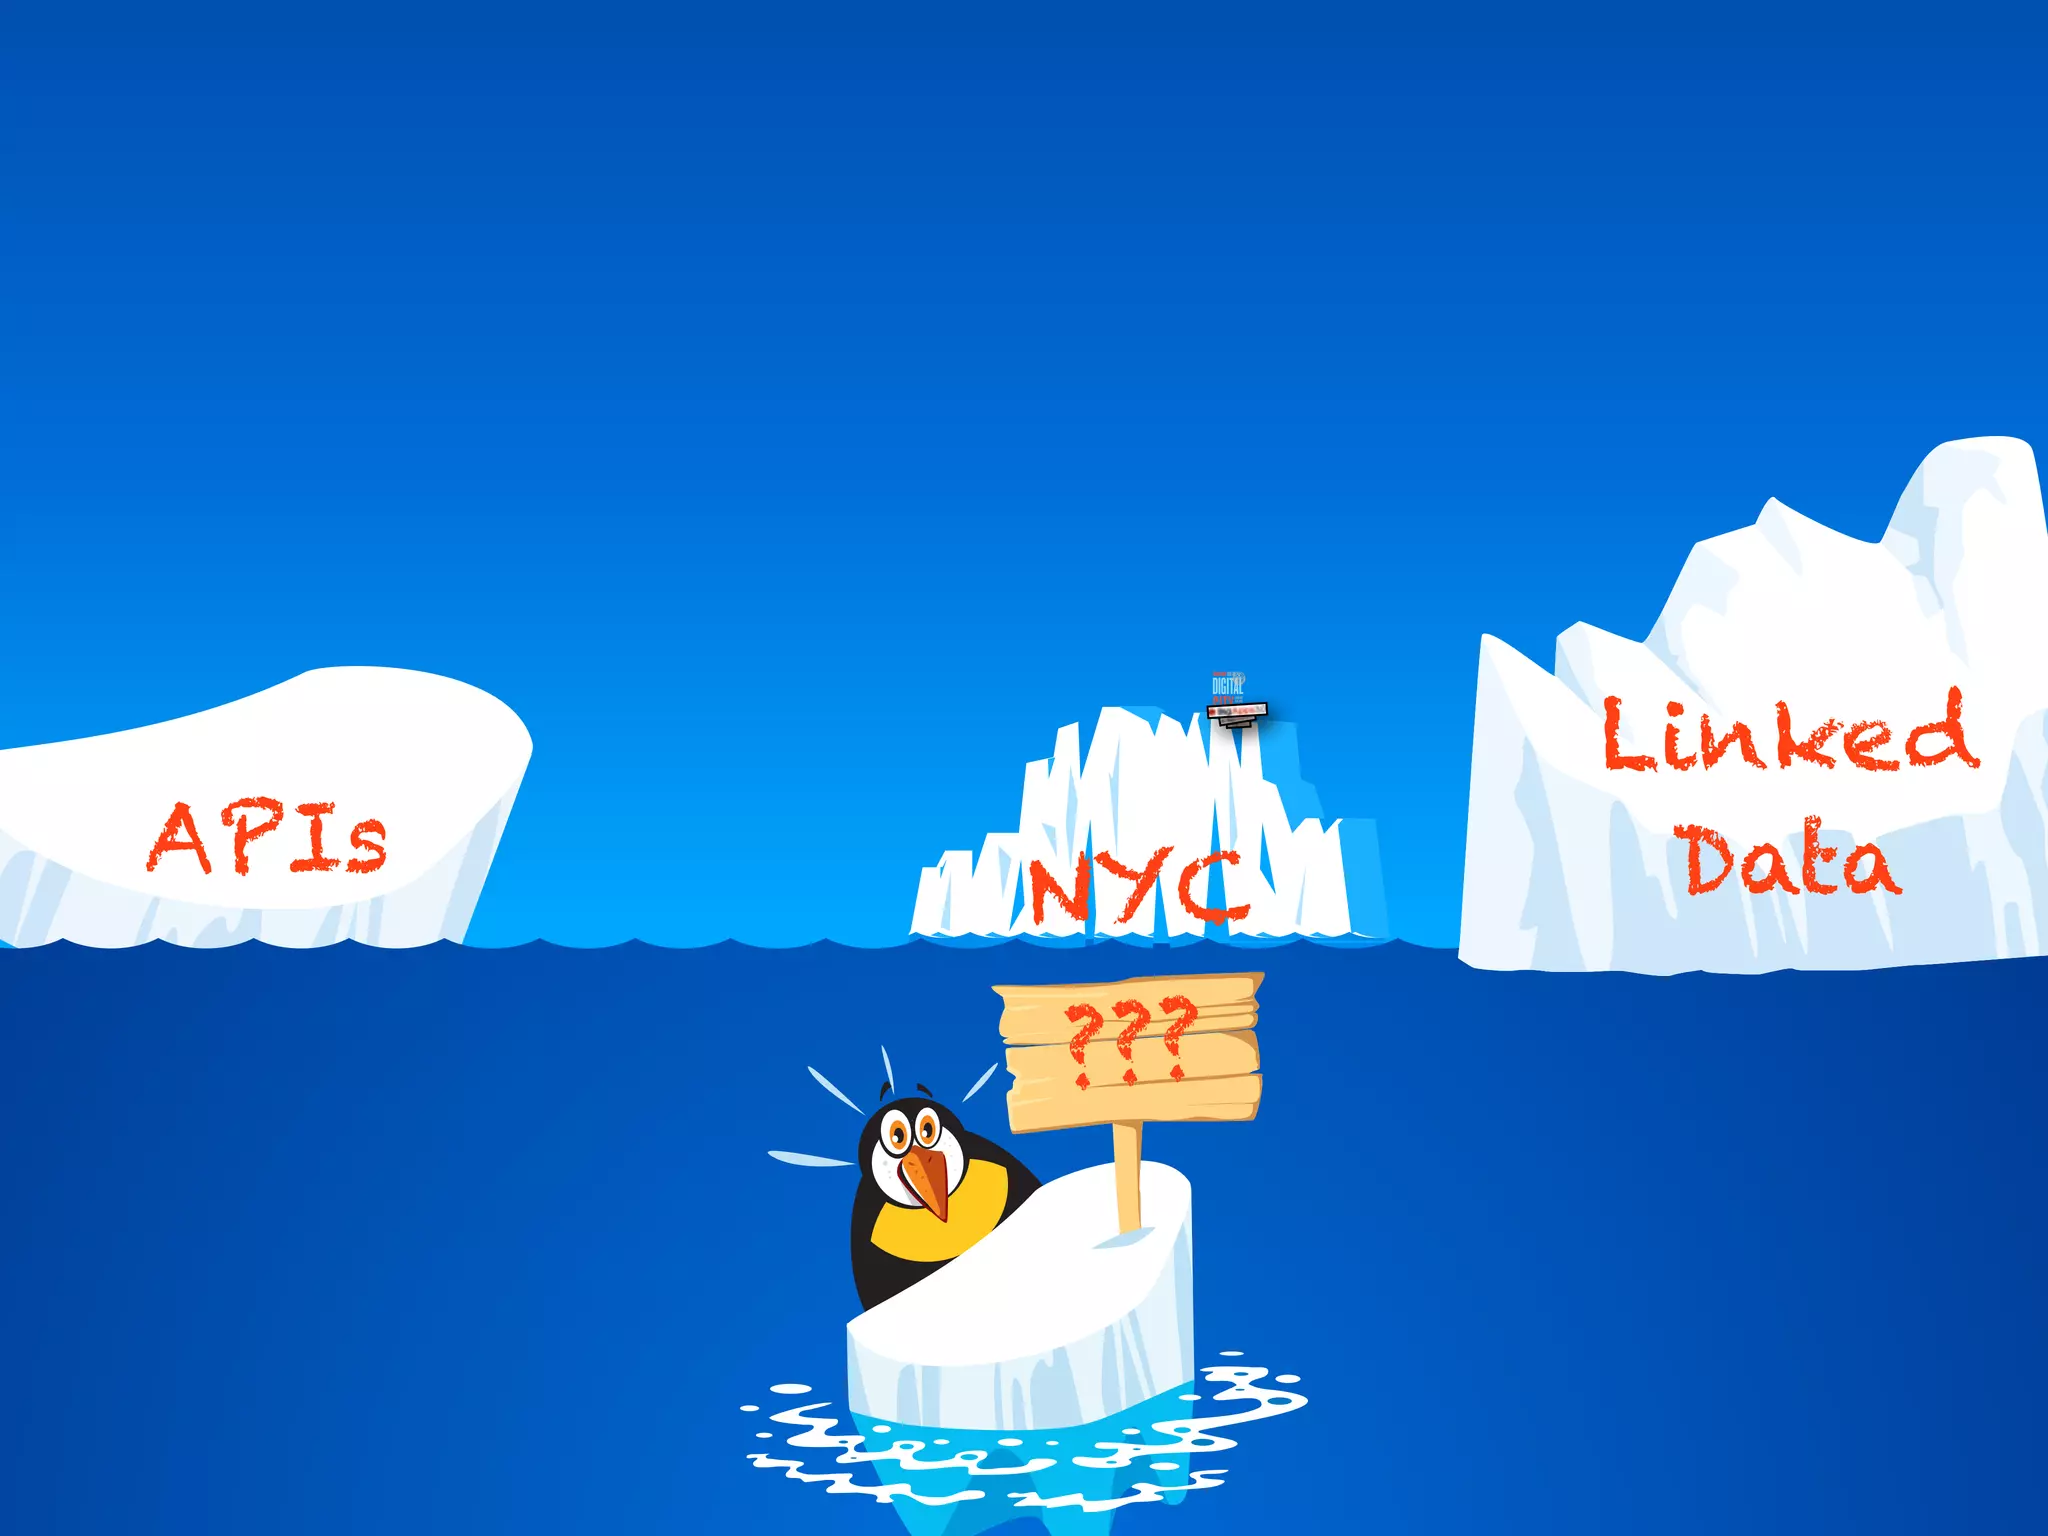
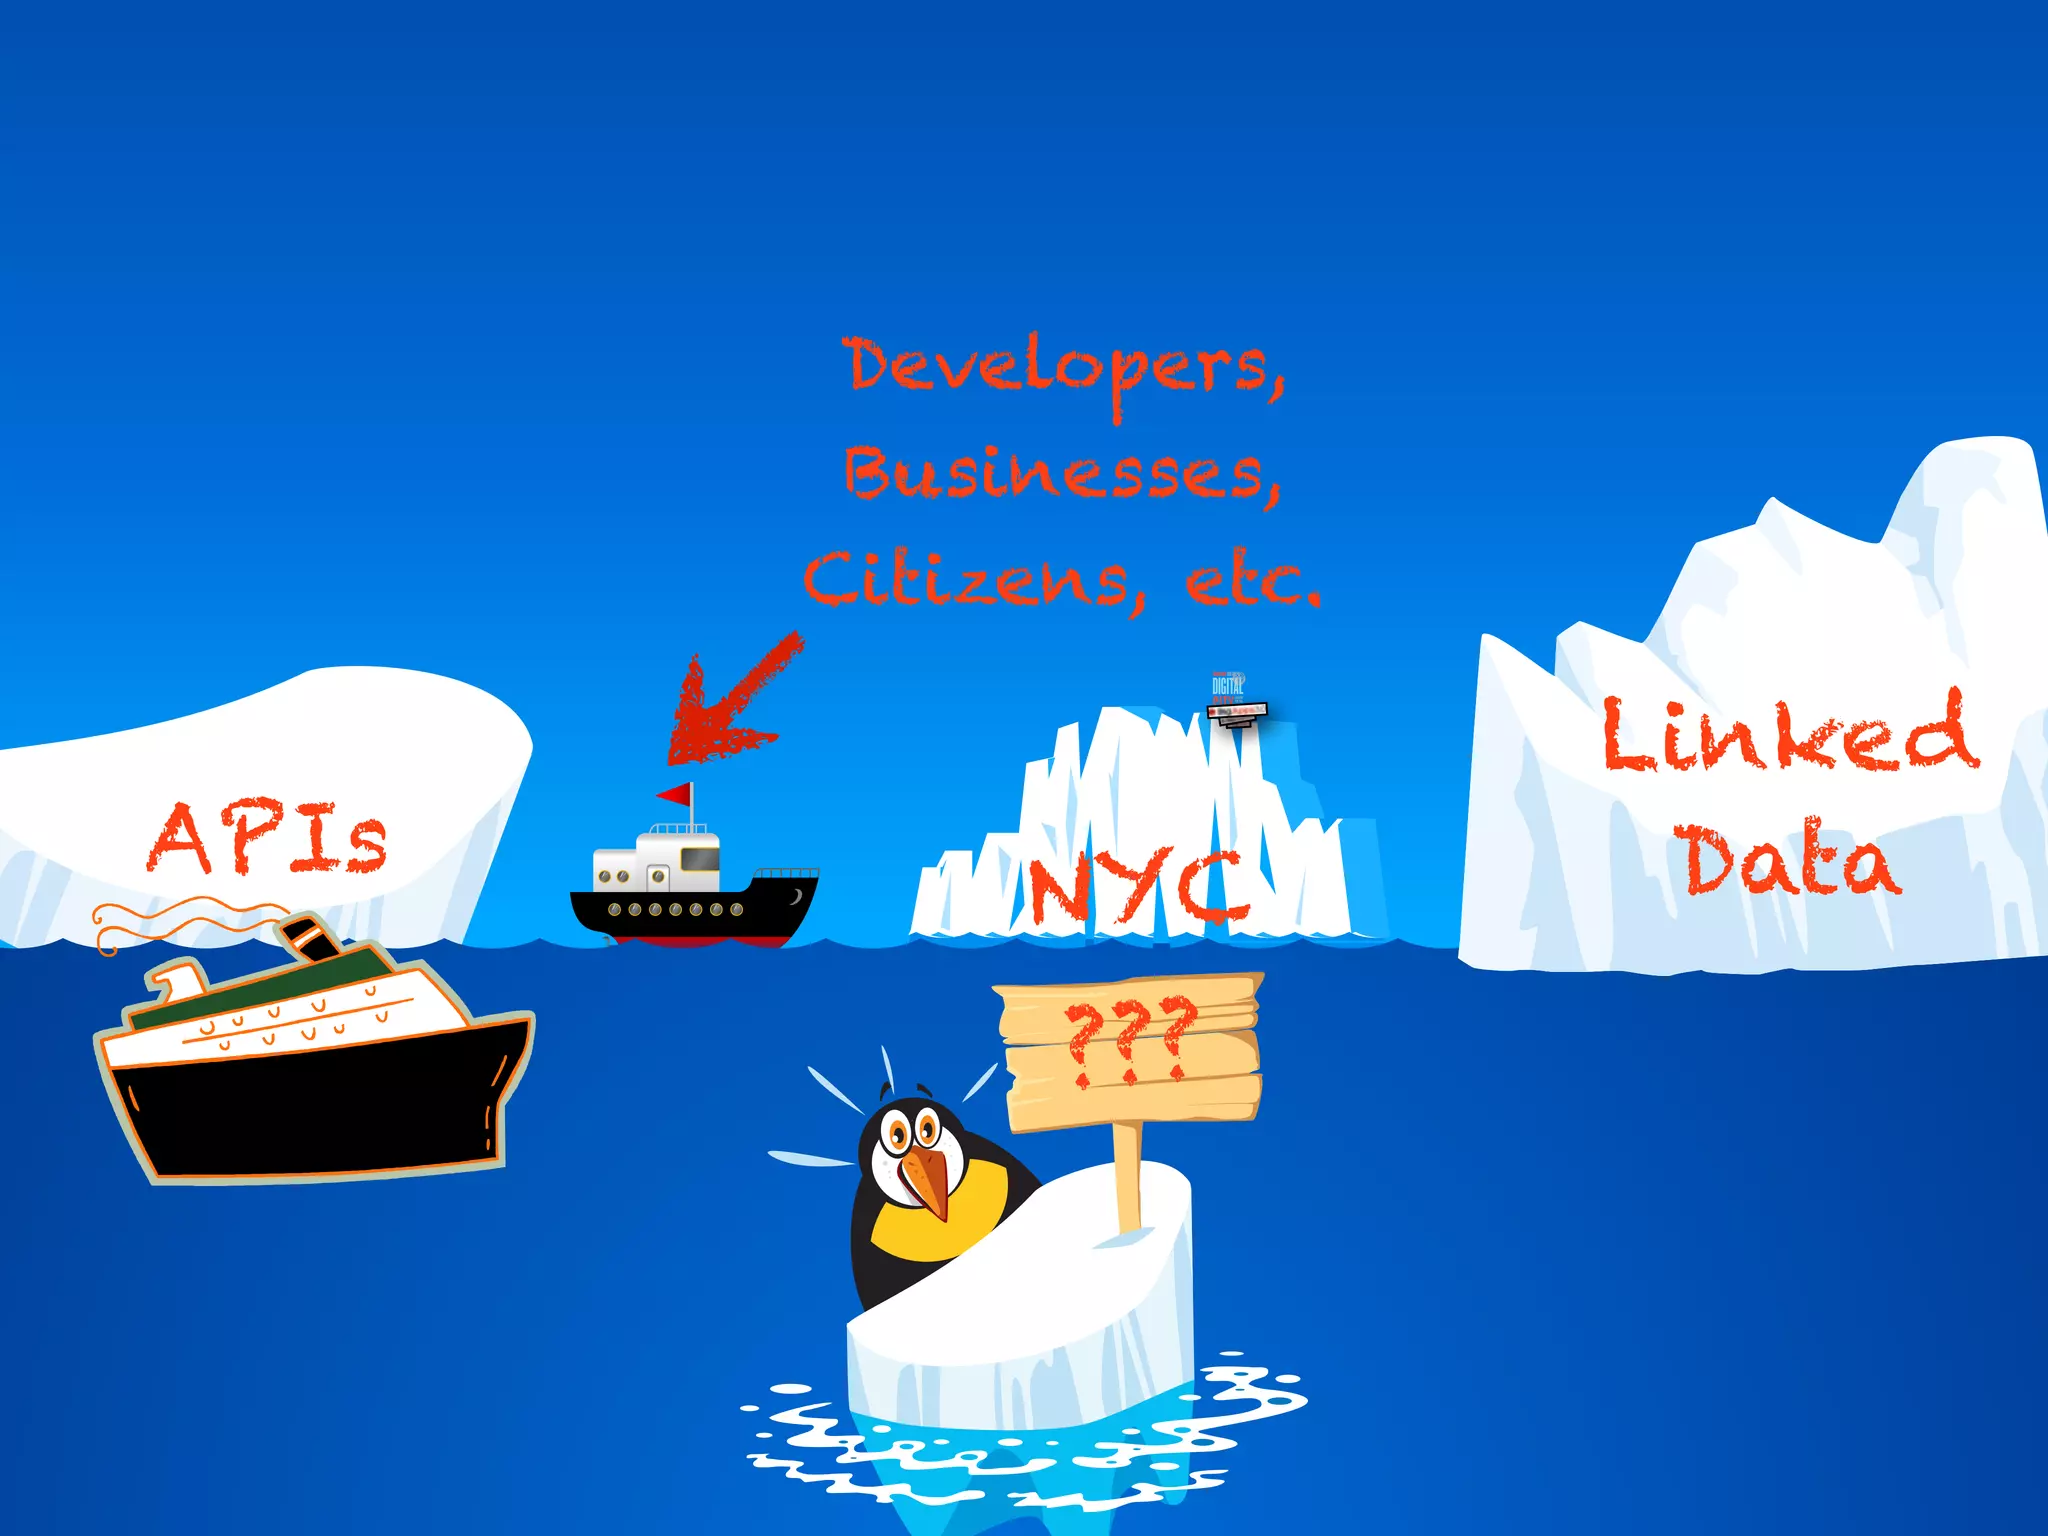
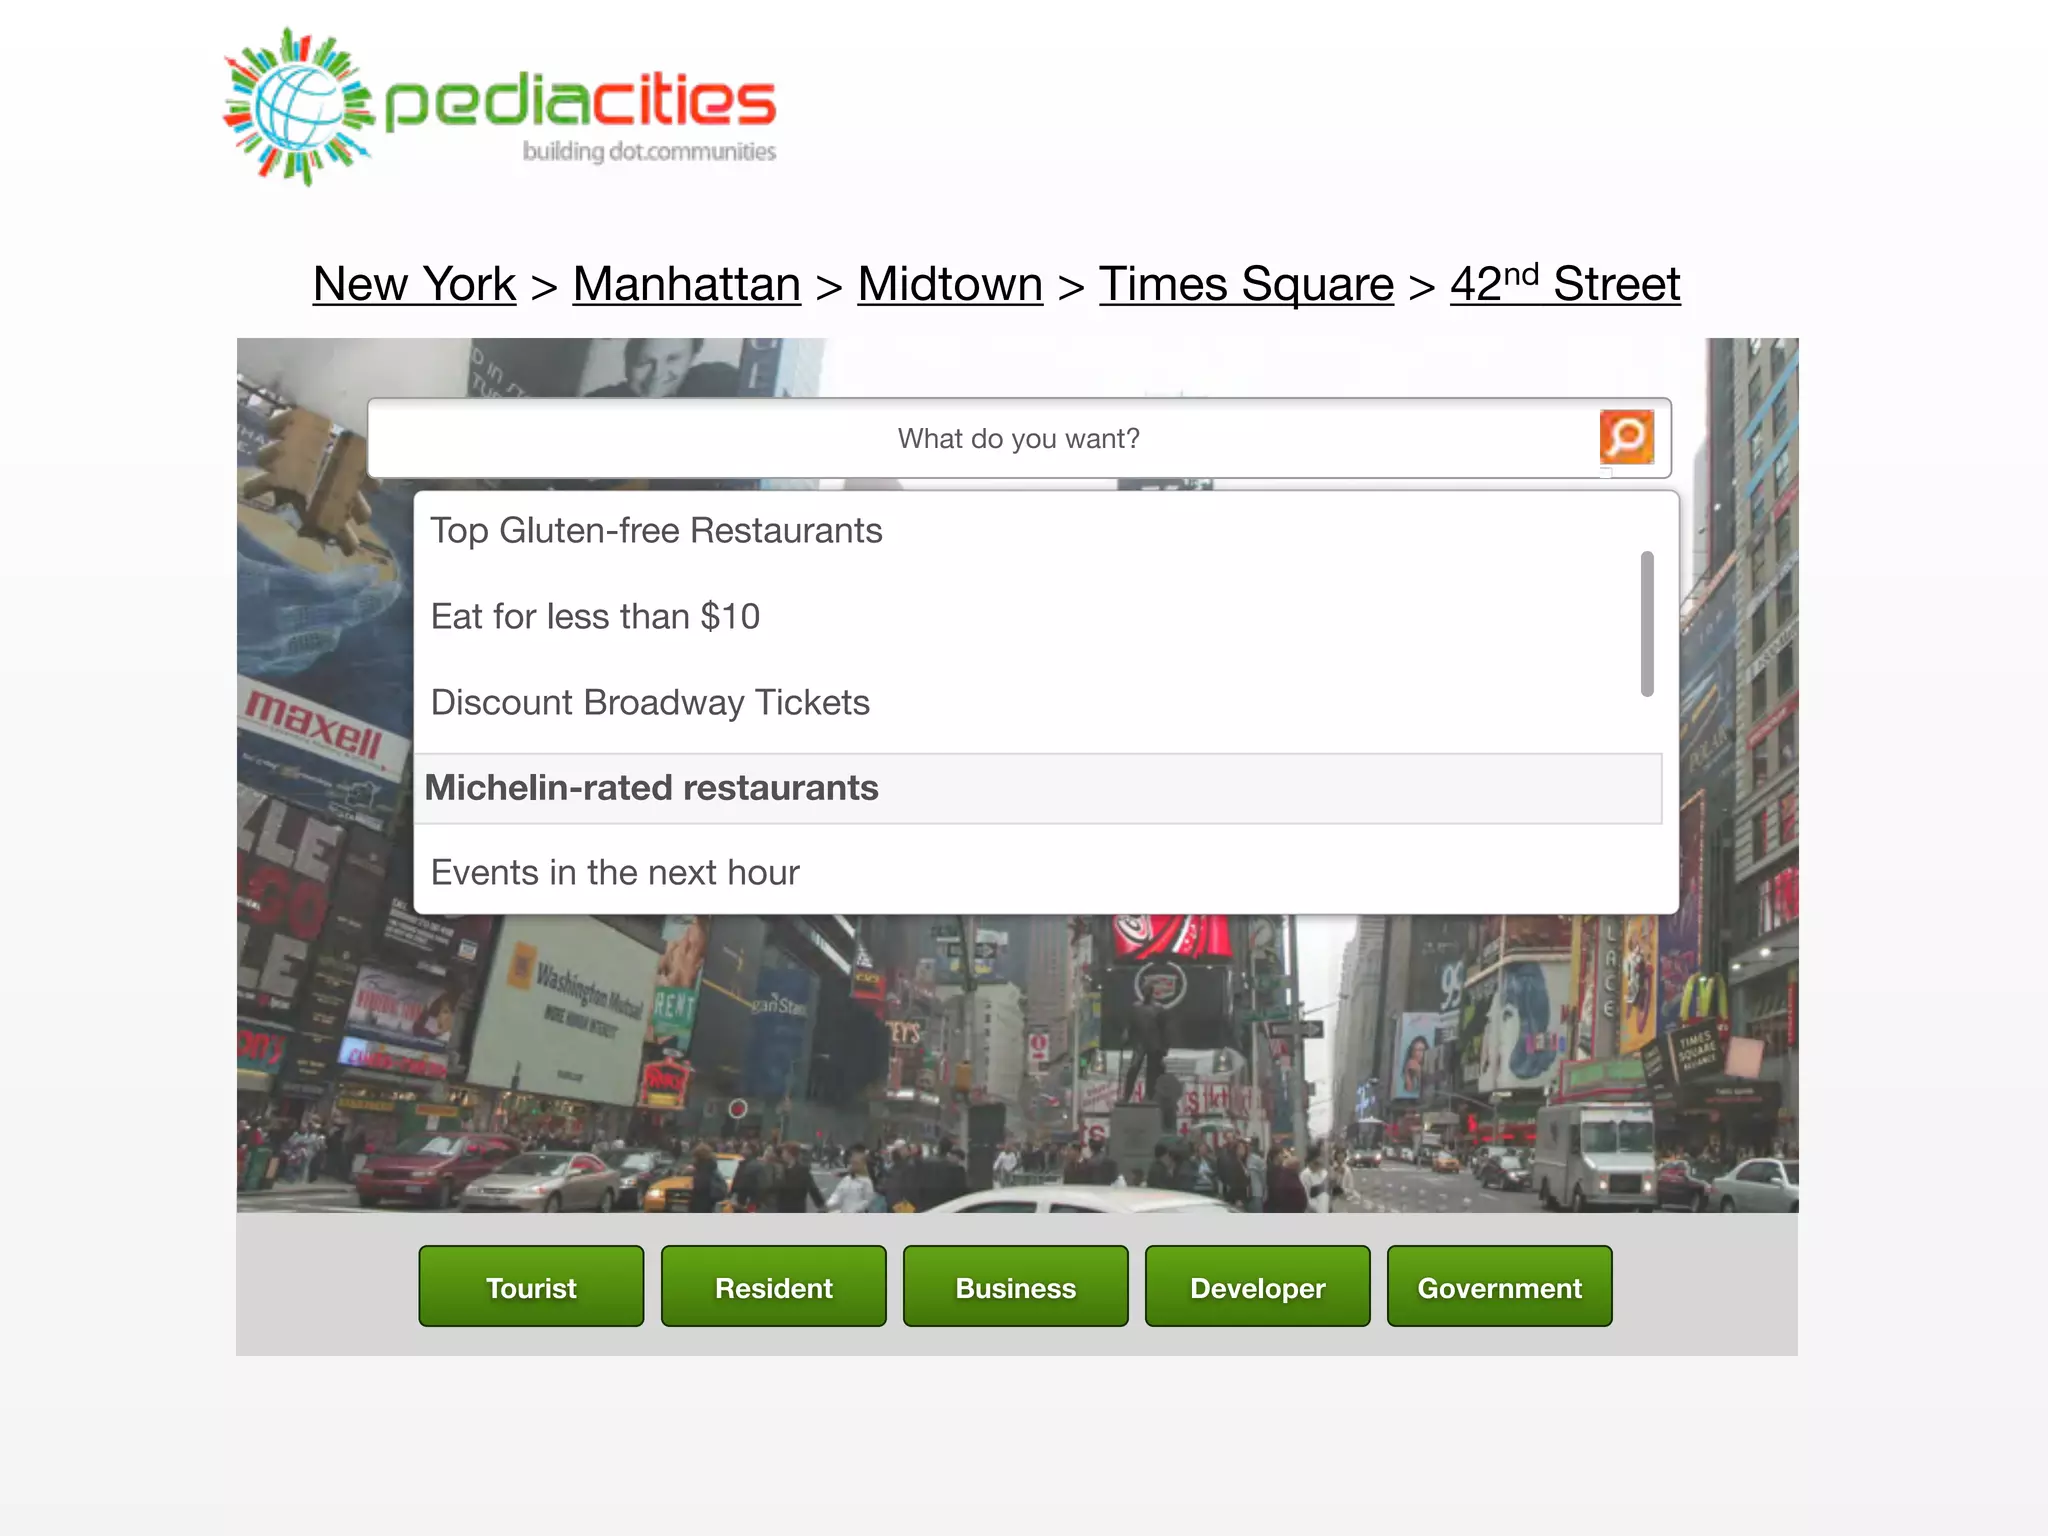
This document discusses smart cities, open data, and semantic mediawiki (SMW). It provides an overview of a conference on these topics held in Carlsbad, CA in 2012. It discusses the goals of using open data and SMW to stimulate app development, encourage innovation, and create new intellectual property. It also provides examples of how crowdsourcing and incentivized competitions can drive innovation.
Webinar: GeoBI Initiative -The Open Source Location Intelligence ecosystemSpagoWorld
The presentation supported the webinar delivered by Andrea Gioia, SpagoBI Architect and GeoBI initiative leader, on 15th December 2010. For more details on the available webinars, visit SpagoWorld Webinar Center: http://www.spagoworld.org/xwiki/bin/view/SpagoWorld/WebinarCenter .
ABSTRACT:
Most university based research is publicly funded and researchers use government data in their work, the data derived from the research of others, and also produce data as part of the research process. The Geomatics and Cartographic Research Centre (GCRC) at Carleton University does this and also adheres to the principle that publicly funded research results should be created in such a way that they can be re-disseminated back to the public. I will therefore discuss how the GCRC collaboratively collects, uses, maps and re-disseminates its data and will highlight some of the open data issues it encounters while doing so. Also, it will be argued that even though the GCRC adheres to access principles, a lack of a national digital data archive and data preservation and management support from granting councils impedes the GCRC and others from sharing their data more broadly while open data strategies have yet to take research data into consideration. Most notably, Canada does not have a research data archive, preservation policy nor a network of university based data repositories.
Researchers use government data in their work, the data derived from the research of others, and also produce data as part of their research processes. Generally, but not always, university based research is publicly funded; however there are few opportunities to re-disseminate these publicly funded data back to the public and to other researchers. Publicly funded research data are not managed nor preserved during the course of academic research and not once a research project is completed, furthermore there is uneven access to government produced data. This conversation session will therefore explore some of these issues by examining research practices at the GCRC and other community based organizations.
In this presentation, Venkatesh introduces IoT and associated trends. His interest area lies in analytics of data obtained through sensors. Some of his ideas include predicting mean sea level based on Oxygen levels, Intelligent transport systems etc.
Open Data, by definition, provides the chance to re-shape and publish heterogeneous pieces and fragments of information which are open, namely anyone is free to use, reuse, and redistribute it. In order for users to fully benefit this idea, Open Data Systems of tomorrow must provide high quality data, relying on real time and ubiquitous services, along with a deep integration with mobile and smart devices and infrastructures.
In this session, we present a syntheses of Whitehall proposal addressed a this vision: is addressed at building Open Data in a fully-fledged Big Data infrastructure, realized using graph based and NoSQL technologies. This idea is shaped in a cultural heritage scenario, where data in envisaged at valorizing one of the main assets of Italy: cultural heritage.
Big Data Ecosystem for Data-Driven Decision MakingAbzetdin Adamov
The extremely fast grow of Internet Services, Web and Mobile Applications and advance of the related Pervasive, Ubiquity and Cloud Computing concepts have stumulated production of tremendous amounts of data partially available online (call metadata, texts, emails, social media updates, photos, videos, location, etc.). Even with the power of today’s modern computers it still big challenge for business and government organizations to manage, search, analyze, and visualize this vast amount of data as information. Data-Intensive computing which is intended to address this problems become quite intense during the last few years yielding strong results. Data intensive computing framework is a complex system which includes hardware, software, communications, and Distributed File System (DFS) architecture.
Just small part of this huge amount is structured (Databases, XML, logs) or semistructured (web pages, email), over 90% of this information is unstructured, what means data does not have predefined structure and model. Generally, unstructured data is useless unless applying data mining and analysis techniques. At the same time, just in case if you can process and understand your data, this data worth anything, otherwise it becomes useless.
Big data visualization frameworks and applications at Kitwarebigdataviz_bay
Big data visualization frameworks and applications at Kitware
Marcus Hanwell, Technical Leader at Kitware, Inc.
March 27th 2014
Kitware develops permissively licensed open source frameworks and applications for scientific data applications, and related areas. Some of the frameworks developed by our High Performance Computing and Visualization group address current challenges in big data visualization and analysis in a number of application domains including geospatial visualization, social media, finance, chemistry, biological (phylogenetics), and climate. The frameworks used to develop solutions in these areas will be described, along with the applications and the nature of the underlying data. These solutions focus on shared frameworks providing data storage, indexing, retrieval, client-server delivery models, server-side serial and parallel data reduction, analysis, and diagnostics. Additionally, they provide mechanisms that enable server-side or client-side rendering based on the capabilities and configuration of the system.
Big Data Visualization Meetup - South Bay
http://www.meetup.com/Big-Data-Visualisation-South-Bay/
over the past years the geospatial technology providers have enabled sharing and integration of geospatial information. Now it's time to shift focus from building the infrastructure to using the content shared through the infrastructure.
Central Texas GiveCamp 2012: Final PresentationMary Chauvin
CTX GiveCamp is a weekend-long event where technology professionals get together to donate time and code to deserving charities. This is the final presentation from the end of CTX GiveCamp 2012
Every day we roughly create 2.5 Quintillion bytes of data; 90% of the worlds collected data has been generated only in the last 2 years. In this slide, learn the all about big data
in a simple and easiest way.
The history, promise, limits, uses and applications associated with big data. A quick review provides enough knowledge to discuss the topic intelligently.
Analytical Innovation: How to Build the Next Generation Data PlatformVMware Tanzu
There was a time when the Enterprise Data Warehouse (EDW) was the only way to provide a 360-degree analytical view of the business. In recent years many organizations have deployed disparate analytics alternatives to the EDW, including: cloud data warehouses, machine learning frameworks, graph databases, geospatial tools, and other technologies. Often these new deployments have resulted in the creation of analytical silos that are too complex to integrate, seriously limiting global insights and innovation.
Join guest speaker, 451 Research’s Jim Curtis and Pivotal’s Jacque Istok for an interactive discussion about some of the overarching trends affecting the data warehousing market, as well as how to build a next generation data platform to accelerate business innovation. During this webinar you will learn:
- The significance of a multi-cloud, infrastructure-agnostic analytics
- What is working and what isn’t, when it comes to analytics integration
- The importance of seamlessly integrating all your analytics in one platform
- How to innovate faster, taking advantage of open source and agile software
Speakers: James Curtis, Senior Analyst, Data Platforms & Analytics, 451 Research & Jacque Istok, Head of Data, Pivotal
Workshop session given at the Institutional Web Management Workshop 2012 (IWMW 2012) event held at the University of Edinburgh on 18th - 20th June 2012.
A modern resource view for tabular data.
This talks shows a modern drop-in replacement for the current default Recline.js based table view in CKAN, which is well beyond a normal table viewer.
Open Data, by definition, provides the chance to re-shape and publish heterogeneous pieces and fragments of information which are open, namely anyone is free to use, reuse, and redistribute it. In order for users to fully benefit this idea, Open Data Systems of tomorrow must provide high quality data, relying on real time and ubiquitous services, along with a deep integration with mobile and smart devices and infrastructures.
In this session, we present a syntheses of Whitehall proposal addressed a this vision: is addressed at building Open Data in a fully-fledged Big Data infrastructure, realized using graph based and NoSQL technologies. This idea is shaped in a cultural heritage scenario, where data in envisaged at valorizing one of the main assets of Italy: cultural heritage.
Big Data Ecosystem for Data-Driven Decision MakingAbzetdin Adamov
The extremely fast grow of Internet Services, Web and Mobile Applications and advance of the related Pervasive, Ubiquity and Cloud Computing concepts have stumulated production of tremendous amounts of data partially available online (call metadata, texts, emails, social media updates, photos, videos, location, etc.). Even with the power of today’s modern computers it still big challenge for business and government organizations to manage, search, analyze, and visualize this vast amount of data as information. Data-Intensive computing which is intended to address this problems become quite intense during the last few years yielding strong results. Data intensive computing framework is a complex system which includes hardware, software, communications, and Distributed File System (DFS) architecture.
Just small part of this huge amount is structured (Databases, XML, logs) or semistructured (web pages, email), over 90% of this information is unstructured, what means data does not have predefined structure and model. Generally, unstructured data is useless unless applying data mining and analysis techniques. At the same time, just in case if you can process and understand your data, this data worth anything, otherwise it becomes useless.
Big data visualization frameworks and applications at Kitwarebigdataviz_bay
Big data visualization frameworks and applications at Kitware
Marcus Hanwell, Technical Leader at Kitware, Inc.
March 27th 2014
Kitware develops permissively licensed open source frameworks and applications for scientific data applications, and related areas. Some of the frameworks developed by our High Performance Computing and Visualization group address current challenges in big data visualization and analysis in a number of application domains including geospatial visualization, social media, finance, chemistry, biological (phylogenetics), and climate. The frameworks used to develop solutions in these areas will be described, along with the applications and the nature of the underlying data. These solutions focus on shared frameworks providing data storage, indexing, retrieval, client-server delivery models, server-side serial and parallel data reduction, analysis, and diagnostics. Additionally, they provide mechanisms that enable server-side or client-side rendering based on the capabilities and configuration of the system.
Big Data Visualization Meetup - South Bay
http://www.meetup.com/Big-Data-Visualisation-South-Bay/
over the past years the geospatial technology providers have enabled sharing and integration of geospatial information. Now it's time to shift focus from building the infrastructure to using the content shared through the infrastructure.
Central Texas GiveCamp 2012: Final PresentationMary Chauvin
CTX GiveCamp is a weekend-long event where technology professionals get together to donate time and code to deserving charities. This is the final presentation from the end of CTX GiveCamp 2012
Every day we roughly create 2.5 Quintillion bytes of data; 90% of the worlds collected data has been generated only in the last 2 years. In this slide, learn the all about big data
in a simple and easiest way.
The history, promise, limits, uses and applications associated with big data. A quick review provides enough knowledge to discuss the topic intelligently.
Analytical Innovation: How to Build the Next Generation Data PlatformVMware Tanzu
There was a time when the Enterprise Data Warehouse (EDW) was the only way to provide a 360-degree analytical view of the business. In recent years many organizations have deployed disparate analytics alternatives to the EDW, including: cloud data warehouses, machine learning frameworks, graph databases, geospatial tools, and other technologies. Often these new deployments have resulted in the creation of analytical silos that are too complex to integrate, seriously limiting global insights and innovation.
Join guest speaker, 451 Research’s Jim Curtis and Pivotal’s Jacque Istok for an interactive discussion about some of the overarching trends affecting the data warehousing market, as well as how to build a next generation data platform to accelerate business innovation. During this webinar you will learn:
- The significance of a multi-cloud, infrastructure-agnostic analytics
- What is working and what isn’t, when it comes to analytics integration
- The importance of seamlessly integrating all your analytics in one platform
- How to innovate faster, taking advantage of open source and agile software
Speakers: James Curtis, Senior Analyst, Data Platforms & Analytics, 451 Research & Jacque Istok, Head of Data, Pivotal
Workshop session given at the Institutional Web Management Workshop 2012 (IWMW 2012) event held at the University of Edinburgh on 18th - 20th June 2012.
Similar to Smart Cities, Open Data and SMW - SMWCon Spring 2012 Keynote (20)
A modern resource view for tabular data.
This talks shows a modern drop-in replacement for the current default Recline.js based table view in CKAN, which is well beyond a normal table viewer.
We were asked: How can we create an engaged, urban, bottom up smarter cities movement?
...that makes communities active stakeholders
...and that engages citizens to capture and contribute data?
Our answer: we need new evidence-based civic infrastructure that builds on the explosive growth in personal data and connects that personal data with urban data. The city will only become truly smart when the people are both its sensory and critical faculties.
Know Yourself. Know the City.
GDG Cloud Southlake #33: Boule & Rebala: Effective AppSec in SDLC using Deplo...James Anderson
Effective Application Security in Software Delivery lifecycle using Deployment Firewall and DBOM
The modern software delivery process (or the CI/CD process) includes many tools, distributed teams, open-source code, and cloud platforms. Constant focus on speed to release software to market, along with the traditional slow and manual security checks has caused gaps in continuous security as an important piece in the software supply chain. Today organizations feel more susceptible to external and internal cyber threats due to the vast attack surface in their applications supply chain and the lack of end-to-end governance and risk management.
The software team must secure its software delivery process to avoid vulnerability and security breaches. This needs to be achieved with existing tool chains and without extensive rework of the delivery processes. This talk will present strategies and techniques for providing visibility into the true risk of the existing vulnerabilities, preventing the introduction of security issues in the software, resolving vulnerabilities in production environments quickly, and capturing the deployment bill of materials (DBOM).
Speakers:
Bob Boule
Robert Boule is a technology enthusiast with PASSION for technology and making things work along with a knack for helping others understand how things work. He comes with around 20 years of solution engineering experience in application security, software continuous delivery, and SaaS platforms. He is known for his dynamic presentations in CI/CD and application security integrated in software delivery lifecycle.
Gopinath Rebala
Gopinath Rebala is the CTO of OpsMx, where he has overall responsibility for the machine learning and data processing architectures for Secure Software Delivery. Gopi also has a strong connection with our customers, leading design and architecture for strategic implementations. Gopi is a frequent speaker and well-known leader in continuous delivery and integrating security into software delivery.
Securing your Kubernetes cluster_ a step-by-step guide to success !KatiaHIMEUR1
Today, after several years of existence, an extremely active community and an ultra-dynamic ecosystem, Kubernetes has established itself as the de facto standard in container orchestration. Thanks to a wide range of managed services, it has never been so easy to set up a ready-to-use Kubernetes cluster.
However, this ease of use means that the subject of security in Kubernetes is often left for later, or even neglected. This exposes companies to significant risks.
In this talk, I'll show you step-by-step how to secure your Kubernetes cluster for greater peace of mind and reliability.
Software Delivery At the Speed of AI: Inflectra Invests In AI-Powered QualityInflectra
In this insightful webinar, Inflectra explores how artificial intelligence (AI) is transforming software development and testing. Discover how AI-powered tools are revolutionizing every stage of the software development lifecycle (SDLC), from design and prototyping to testing, deployment, and monitoring.
Learn about:
• The Future of Testing: How AI is shifting testing towards verification, analysis, and higher-level skills, while reducing repetitive tasks.
• Test Automation: How AI-powered test case generation, optimization, and self-healing tests are making testing more efficient and effective.
• Visual Testing: Explore the emerging capabilities of AI in visual testing and how it's set to revolutionize UI verification.
• Inflectra's AI Solutions: See demonstrations of Inflectra's cutting-edge AI tools like the ChatGPT plugin and Azure Open AI platform, designed to streamline your testing process.
Whether you're a developer, tester, or QA professional, this webinar will give you valuable insights into how AI is shaping the future of software delivery.
Transcript: Selling digital books in 2024: Insights from industry leaders - T...BookNet Canada
The publishing industry has been selling digital audiobooks and ebooks for over a decade and has found its groove. What’s changed? What has stayed the same? Where do we go from here? Join a group of leading sales peers from across the industry for a conversation about the lessons learned since the popularization of digital books, best practices, digital book supply chain management, and more.
Link to video recording: https://bnctechforum.ca/sessions/selling-digital-books-in-2024-insights-from-industry-leaders/
Presented by BookNet Canada on May 28, 2024, with support from the Department of Canadian Heritage.
JMeter webinar - integration with InfluxDB and GrafanaRTTS
Watch this recorded webinar about real-time monitoring of application performance. See how to integrate Apache JMeter, the open-source leader in performance testing, with InfluxDB, the open-source time-series database, and Grafana, the open-source analytics and visualization application.
In this webinar, we will review the benefits of leveraging InfluxDB and Grafana when executing load tests and demonstrate how these tools are used to visualize performance metrics.
Length: 30 minutes
Session Overview
-------------------------------------------
During this webinar, we will cover the following topics while demonstrating the integrations of JMeter, InfluxDB and Grafana:
- What out-of-the-box solutions are available for real-time monitoring JMeter tests?
- What are the benefits of integrating InfluxDB and Grafana into the load testing stack?
- Which features are provided by Grafana?
- Demonstration of InfluxDB and Grafana using a practice web application
To view the webinar recording, go to:
https://www.rttsweb.com/jmeter-integration-webinar
Key Trends Shaping the Future of Infrastructure.pdfCheryl Hung
Keynote at DIGIT West Expo, Glasgow on 29 May 2024.
Cheryl Hung, ochery.com
Sr Director, Infrastructure Ecosystem, Arm.
The key trends across hardware, cloud and open-source; exploring how these areas are likely to mature and develop over the short and long-term, and then considering how organisations can position themselves to adapt and thrive.
Encryption in Microsoft 365 - ExpertsLive Netherlands 2024Albert Hoitingh
In this session I delve into the encryption technology used in Microsoft 365 and Microsoft Purview. Including the concepts of Customer Key and Double Key Encryption.
Smart TV Buyer Insights Survey 2024 by 91mobiles.pdf91mobiles
91mobiles recently conducted a Smart TV Buyer Insights Survey in which we asked over 3,000 respondents about the TV they own, aspects they look at on a new TV, and their TV buying preferences.
The Art of the Pitch: WordPress Relationships and SalesLaura Byrne
Clients don’t know what they don’t know. What web solutions are right for them? How does WordPress come into the picture? How do you make sure you understand scope and timeline? What do you do if sometime changes?
All these questions and more will be explored as we talk about matching clients’ needs with what your agency offers without pulling teeth or pulling your hair out. Practical tips, and strategies for successful relationship building that leads to closing the deal.
Kubernetes & AI - Beauty and the Beast !?! @KCD Istanbul 2024Tobias Schneck
As AI technology is pushing into IT I was wondering myself, as an “infrastructure container kubernetes guy”, how get this fancy AI technology get managed from an infrastructure operational view? Is it possible to apply our lovely cloud native principals as well? What benefit’s both technologies could bring to each other?
Let me take this questions and provide you a short journey through existing deployment models and use cases for AI software. On practical examples, we discuss what cloud/on-premise strategy we may need for applying it to our own infrastructure to get it to work from an enterprise perspective. I want to give an overview about infrastructure requirements and technologies, what could be beneficial or limiting your AI use cases in an enterprise environment. An interactive Demo will give you some insides, what approaches I got already working for real.
Elevating Tactical DDD Patterns Through Object CalisthenicsDorra BARTAGUIZ
After immersing yourself in the blue book and its red counterpart, attending DDD-focused conferences, and applying tactical patterns, you're left with a crucial question: How do I ensure my design is effective? Tactical patterns within Domain-Driven Design (DDD) serve as guiding principles for creating clear and manageable domain models. However, achieving success with these patterns requires additional guidance. Interestingly, we've observed that a set of constraints initially designed for training purposes remarkably aligns with effective pattern implementation, offering a more ‘mechanical’ approach. Let's explore together how Object Calisthenics can elevate the design of your tactical DDD patterns, offering concrete help for those venturing into DDD for the first time!
23. Citywide
Events
Calendar
Electronics
Stores
Parking
Facili7es
Sidewalk
Cafes
Laundry
Facili7es
Financial
Empowerment
Centers
IPIS
(Integrated
Property
Informa7on
System)
City
government
retrofit
projects
NYC
Civil
Service
Titles
NYC
Department
of
Educa7on
Job
Titles
Lis7ng
of
cultural
organiza7ons
with
vital
stats
Programs
Funding
for
FY2010
24. Land
cover
Reservoir
and
Dam
sta7s7cs
Hydrostats
TSA
Entertainment
venues
TSA
Food
and
Beverage
loca7ons
TSA
Hotels
TSA
screens
TSA
pedestrian
counts
Lincoln
Square
BID
Business
List
Museums
and
galleries
City
government
retrofit
projects
School
Point
Loca7ons
School
Zones
2009
School
Survey
2010
School
Survey
25. Main Goals
• stimulate development of apps
that improve access to info
and govt transparency,
and;
• encourage innovation & the
creation of new IP with
commercial potential
31. CROWDSOURCING
• Challenge:
Improve Recommendation Algorithm
by 10%
• Dataset:
STATISTICS
• 100 million ratings (training set) • just 6 days into contest,
• Half a million Users Cinematch bested by 1%
• 18 thousand movies • 20,000 Teams, 150 countries
• Entrants:
• Prize: • Bell Labs
One million US Dollars
• Opera Solutions
• Well-renowned universities
32. CROWDSOURCING
• Challenge:
Improve Recommendation Algorithm
by 10%
• Dataset:
STATISTICS
• 100 million ratings (training set) • just 6 days into contest,
• Half a million Users Cinematch bested by 1%
• 18 thousand movies • 20,000 Teams, 150 countries
• Entrants:
• Prize: • Bell Labs
One million US Dollars
• Opera Solutions
• Well-renowned universities
40. • First Federal CIO - Vivek Kundra
• Open Government Initiative
• Recovery.gov
• Data.gov
• USAspending.gov
• IT Dashboard
• Performance.gov
• Fedspace
• Citizen Services Dashboard
41. • First Federal CIO - Vivek Kundra
• Open Government Initiative
• Recovery.gov
• Data.gov
• USAspending.gov
• IT Dashboard
• Performance.gov
• Fedspace
• Citizen Services Dashboard
42. • First Federal CIO - Vivek Kundra
• Open Government Initiative
• Recovery.gov
• Data.gov
• USAspending.gov
• IT Dashboard
• Performance.gov
• Fedspace
• Citizen Services Dashboard
43. • First Federal CIO - Vivek Kundra
• Open Government Initiative
• Recovery.gov
• Data.gov
• USAspending.gov
• IT Dashboard
• Performance.gov
• Fedspace
• Citizen Services Dashboard
44. • First Federal CIO - Vivek Kundra
• Open Government Initiative
• Recovery.gov
}
• Data.gov Li fe
S u pp o r
t
• USAspending.gov
• IT Dashboard
• Performance.gov
• Fedspace
• Citizen Services Dashboard
45. • First Federal CIO - Vivek Kundra
• Open Government Initiative
•
sh ed
Recovery.gov
}
e t• sla o u Li fe
t S pp
B u dg i lli on
Data.gov
• m
ort
$ 34 o n USAspending.gov
fr o m •m i l l i
$8
IT Dashboard
• Performance.gov
• Fedspace
• Citizen Services Dashboard
51. Int. No. 29: Accessibility to Public Data Sets
“...requires that all public data sets
maintained by City agencies shall be made
available on the Internet through a single
web portal, formatted to enable viewing by
web browsers and mobile devices and also in
their raw or unprocessed form.”
52.
53. ch and
b io ni
Principles
• Cost Effective
• Easy to Use (Developers/Publishers/Citizens)
• based on Open Standards
• Low Adoption Curve
• Help Accelerate Open Data Innovation
• Useable Data Now!
55. Useable Data Now
• “Beautiful” Website
• Useable by Developers/Publishers/Citizens
• based on Open Standards
• Low Adoption Curve
• Help Accelerate Open Data Innovation
• Useable Data Now!
56. What
NYCBigApps
Developers
were
Doing
Download &
Decipher
ETL Text
Processes
Siloed Data
• Spend inordinate amount of time interpreting data
• Massaged Data was then staged locally
• Developers kept reinventing the wheel
• Limited Data mashups
• Applications disconnected from NYCDatamine
42
58. How it Started
• Oct 12, 2010 - NYCBigApps 2.0 announced
• Nov 9, 2010 - NYCBigApps 2.0 kickoff meeting
• late Nov 2010 - spoke with Revelytix/Spry about
collaborating
• early Dec 2010 - started work on NYCDataWeb
• Jan 26, 2011 ~4:30p - submitted entry
59.
60.
61. What
We
Did
Domain
Ontology
Query &
Results
Cache Optimizer
Definitions
Re-Writer Planner
Siloed Data
Indexes Rules
Re-Writer Optimizer Mapping
Ontology
Indexes Planner Rules
Metadata
Ontology
47
85. Phase 2
• Integrate NYCreation • Make it easier for
and NYCmantics Citizens
• Incorporate the whole • Incorporate the best of
NYC datamine Socrata and data.gov
• Make it easier for • Position SMW+ as the
Publishers accelerated data mashup
platform
• Make it easier for
Developers • ...powered by NYC
DataWeb
86. Phase 3
• Open-source • Make it easier STILL for
collaboration with Publishers, Developers
Revelytix and Citizens
(more info at SemTech 2011)
• Widespread adoption of
• <Your city here> SMW/SMW+
DataWeb
• ... keep standing on the
• DataWeb Deployment shoulders of giants
Framework bundle
87. Phase 3
• Open-source • Make it easier STILL for
collaboration with Publishers, Developers
Revelytix and Citizens
(more info at SemTech 2011)
• Widespread adoption of
• <Your city here> SMW/SMW+
DataWeb
• ... keep standing on the
• DataWeb Deployment shoulders of giants
Framework bundle
88. Phase 3
• Open-source • Make it easier STILL for
collaboration with Publishers, Developers
Revelytix and Citizens
(more info at SemTech 2011)
• Widespread adoption of
• <Your city here> SMW/SMW+
DataWeb
• ... keep standing on the
• DataWeb Deployment shoulders of giants
Framework bundle
89. The Genesis of
Ontodia
• Oct 4, 2011 - “Find your next Startup Partner”
meetup - NYEBN
• Oct 5, 2011 - Steve Jobs dies
• Oct 11, 2011 - NYCBigApps 3.0 announced
• Oct 17, 2011 - Joel leaves TCG
• Oct 25, 2011 - Ontodia, LLC formed
90.
91. Your time is limited. Don’t
waste your time living
someone else’s life.
92. We’re here to put a dent in
the universe. Otherwise,
why even be here?
101. "Over
the
next
decade,
cities
will
continue
to
grow
larger
at
a
rapid
pace.
At
the
same
time,
new
technologies
will
unlock
massive
streams
of
data
about
cities
and
their
residents.
As
these
forces
collide,
they
will
turn
every
city
into
a
unique
civic
laboratory—a
place
where
technology
is
adapted
in
novel
ways
to
meet
local
needs."
December
2010.
Institute
of
the
Future's
2020
Forecast
–
The
Future
of
Cities,
Information
and
Inclusion.
102. Ci4es:
Worldwide,
city
leaders
and
managers
need
cost-‐effective
&
smart
solutions
Popula'on
Growth:
-‐ 221
cities
globally
with
more
than
1
million
citizens
-‐
China
will
move
300
million
people
to
cities
by
2020
-‐
90%
of
these
cities
are
in
emerging
markets
-‐
In
2008,
more
people
lived
in
cities
(3.3
billion),
by
2030,
5
billion
-‐ Cities
are
more
efJicient
and
have
less
environmental
impact
Cost
of
City
Services:
Aging
infrastructure,
resource
constraints
&
waste
-‐ Washington
DC’s
water
system
has
elements
that
date
to
the
Civil
War
-‐ InefJiciency,
leaks
and
waste
rival
maintenance
and
expansion
costs
source:
Gartner
–
Is
Smart
Cities
the
Next
Big
Market?
March
2011
103. Why NYC?
• City Population: • Gross Metropolitan Product:
8.1 million (2010 Census) USD $ 1.28 Trillion
(Greyhill Advisors)
• Metro NYC Population:
18.9 million (2010 Census) • DOITT annual budget:
USD $325 million
• City Density:
10,630/km2 (2010 Census) • ~120 City Agencies/
Departments, each with
• Metro NYC Density: multiple datasources and
standards
1,085.7/km2 (2010 Census)
• 50 million visitors a year • Second only to Silicon Valley for
most startups
104. Why NYC?
• Jan 24, 2011 - First Chief Digital Officer Appointed
• May 16, 2011 - NYC Digital Roadmap released
• Dec 19, 2011 - Cornell University-Technion-Israel
Institute of Technology announced
• Mar 7, 2012 - NYC Open Data Bill passed
• April 17, 2012 - NYC Open Data Standards wiki
launched
• April 17, 2012 - NYCBigApps 3.0 awards ceremony
105.
106.
107.
108.
109.
110. ROAD MAP FOR THE
DIGITAL
CITY
ACHIEVING
NEW YORK
CITY’S
DIGITAL
FUTURE
the city of new york • spring 2011
111. ROAD MAP FOR THE
DIGITAL
CITY
ACHIEVING
NEW YORK
CITY’S
DIGITAL
FUTURE
the city of new york • spring 2011
112. ROAD MAP FOR THE
DIGITAL
CITY
ACHIEVING
NEW YORK
CITY’S
DIGITAL
FUTURE
the city of new york • spring 2011
113. ROAD MAP FOR THE
DIGITAL
CITY
ACHIEVING
NEW YORK
CITY’S
DIGITAL
FUTURE
the city of new york • spring 2011
NYC
Open
Data
114. ROAD MAP FOR THE
DIGITAL
CITY
ACHIEVING
NEW YORK
CITY’S
DIGITAL
FUTURE
the city of new york • spring 2011
NYC
Open
Data
115. ROAD MAP FOR THE
Linked
DIGITAL
CITY
ACHIEVING
NEW YORK
CITY’S
DIGITAL
FUTURE
the city of new york • spring 2011
APIs Data
NYC
Open
???
Data
116. Developers,
Businesses,
Citizens, etc.
ROAD MAP FOR THE
Linked
DIGITAL
CITY
ACHIEVING
NEW YORK
CITY’S
DIGITAL
FUTURE
the city of new york • spring 2011
APIs Data
NYC
Open
???
Data
119. 0. Huge Open Data
1. Extract Metadata
2. Derive ExtraMetadata
(Semantics + Statistics + Algorithm + Crowd)
3. Do Federated Queries on both the
Metadata AND the Data
Crowdknowing
126. New York > Manhattan > Midtown > Times Square > 42nd Street
What do you want?
Top Gluten-free Restaurants
Eat for less than $10
Discount Broadway Tickets
Item 4
Michelin-rated restaurants
Events in the next hour
Tourist Resident Business Developer Government
130. We need your help & feedback
A Smart Data Exchange for All Data NYC
Find out more at
http://nyc.pediacities.com/facets
131. CREDITS
• Lego Faceparty picture by RichardAM (http://www.richard-am.net/)
• Lego Inauguration Pictures from various Flickr Users (sluggobear, Atwater,
Dan Hontz)
• Lego Luke looses his Hand by Flickr user wwwayazdotcom
• Tim Berners-Lee highlight from TED (http://www.ted.com/talks/
tim_berners_lee_on_the_next_web.html)
• Hans Rosling highlight from TED (http://www.ted.com/talks/
hans_rosling_shows_the_best_stats_you_ve_ever_seen.html)
• FlowerPowerpont2.pptx provided by Anna Rosling Rönnlund of gapminder
• several images taken from NYC.gov properties
• Various screenshots provided by Revelytix, Spry Inc. and TCG Software
Services