Download to read offline
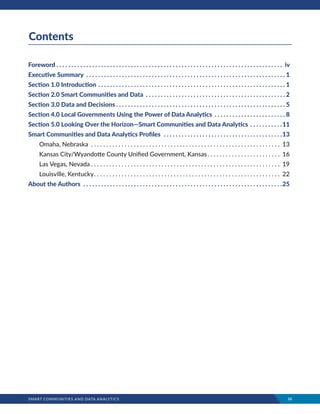


The document discusses the role of data analytics in enhancing the efficiency and effectiveness of local governments through smart community practices. It highlights the collaboration between the International City/County Management Association (ICMA) and SAS to leverage technology and citizen engagement for better public services. The report reveals that local governments can utilize existing resources to implement smart solutions, ultimately aiming for improved service delivery and community outcomes.


