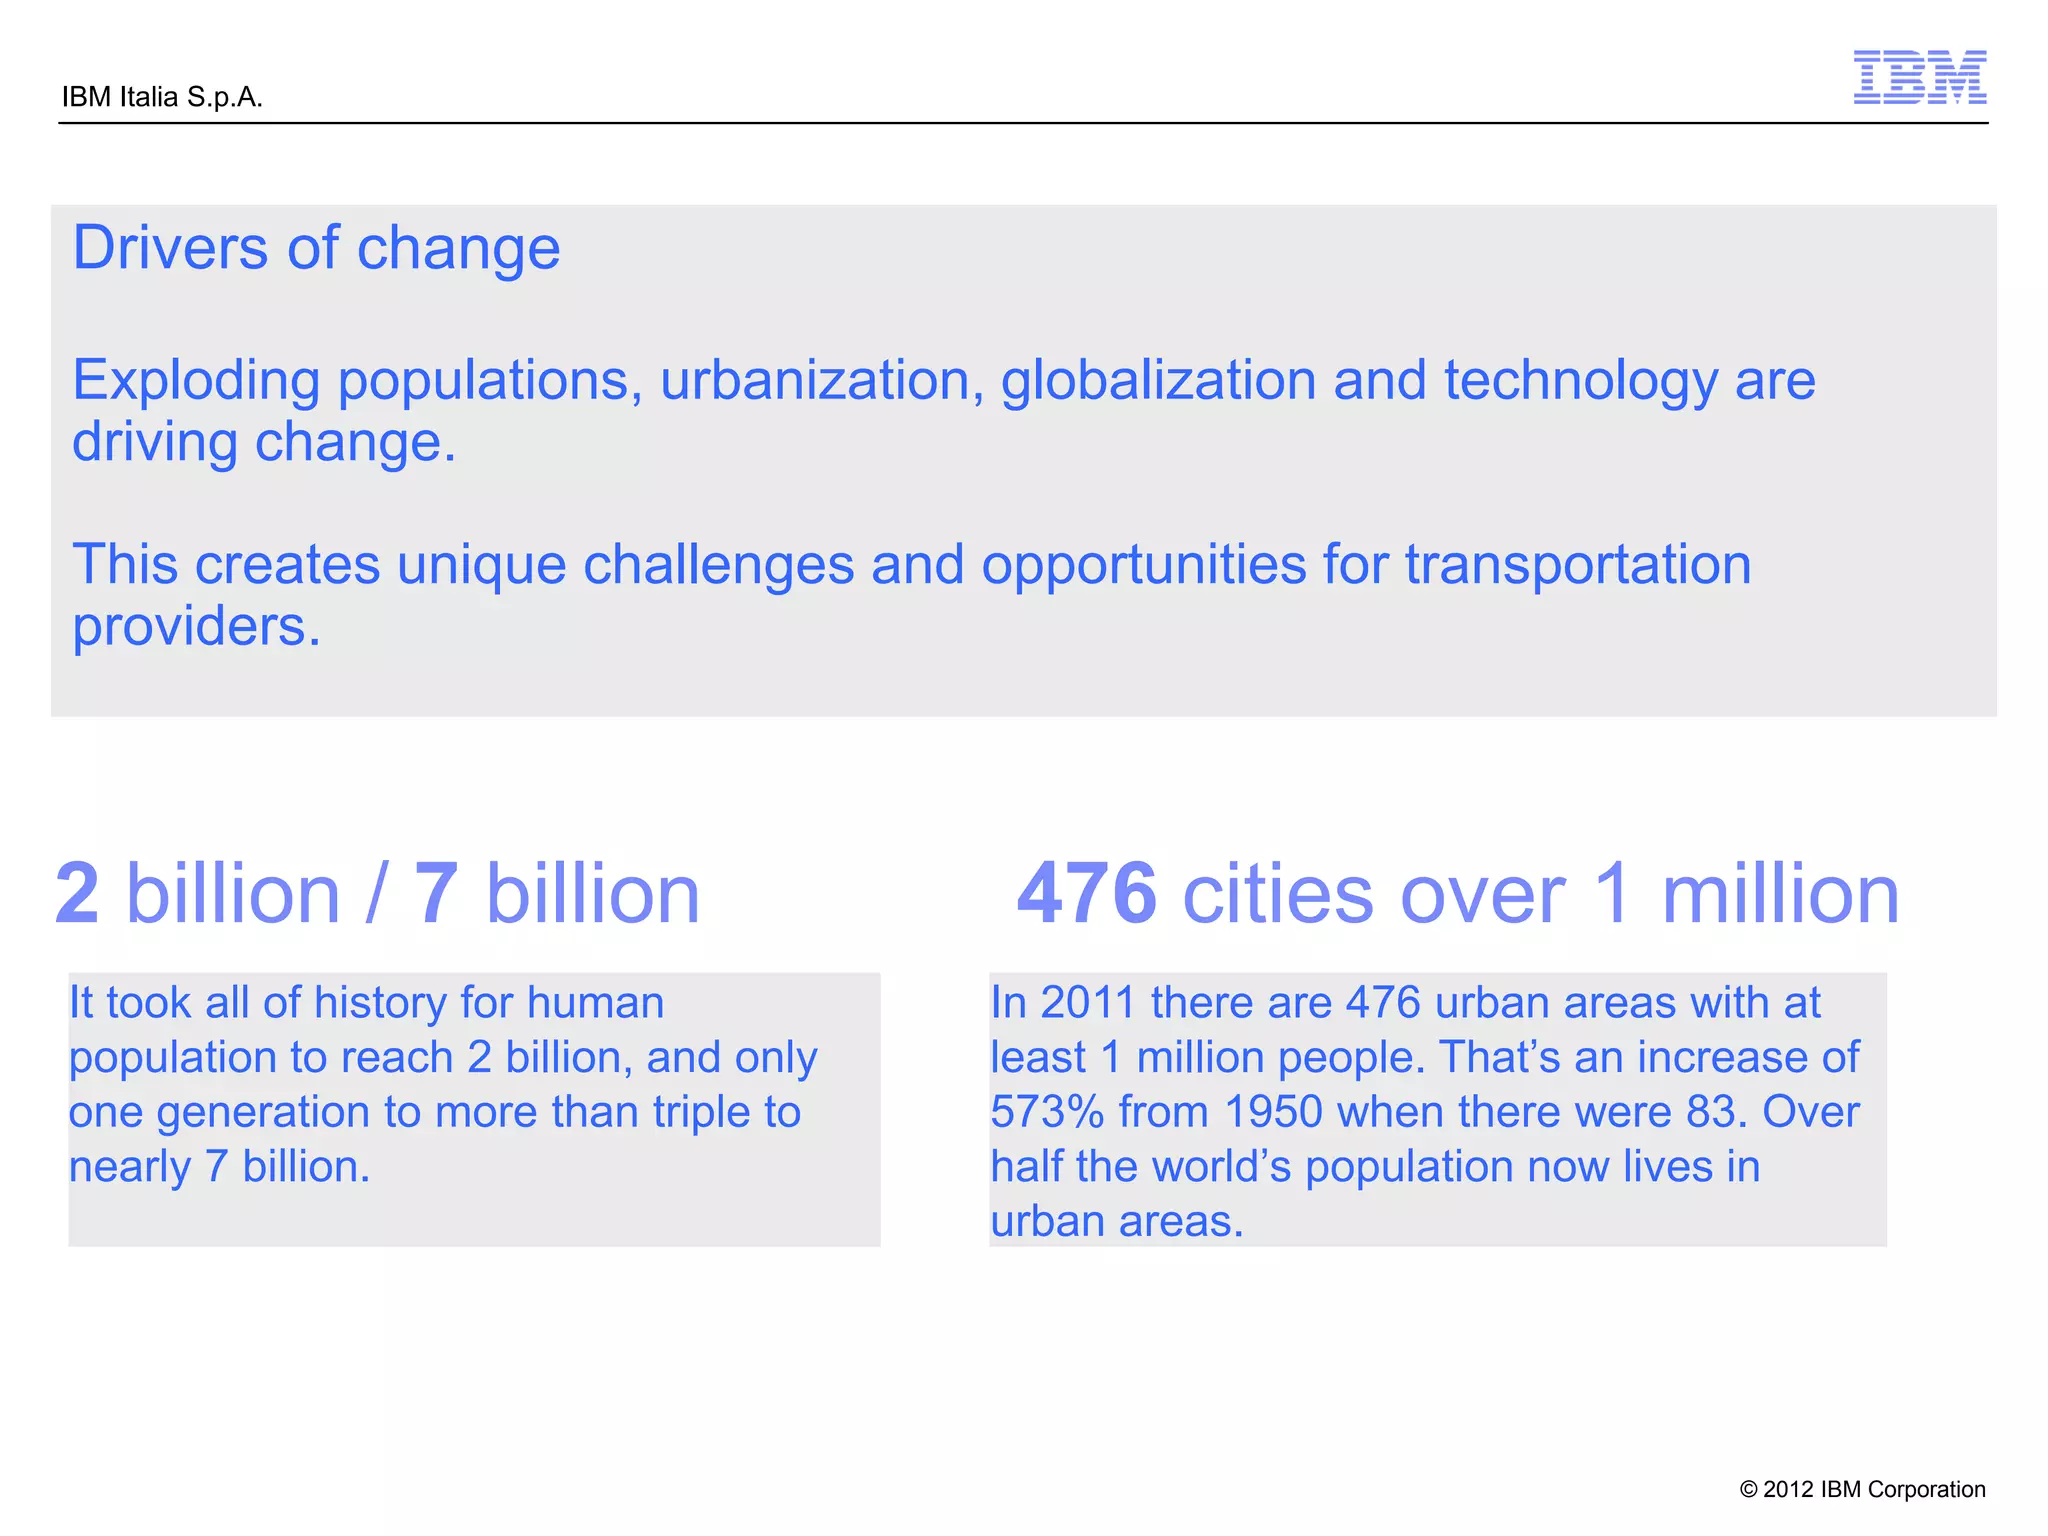
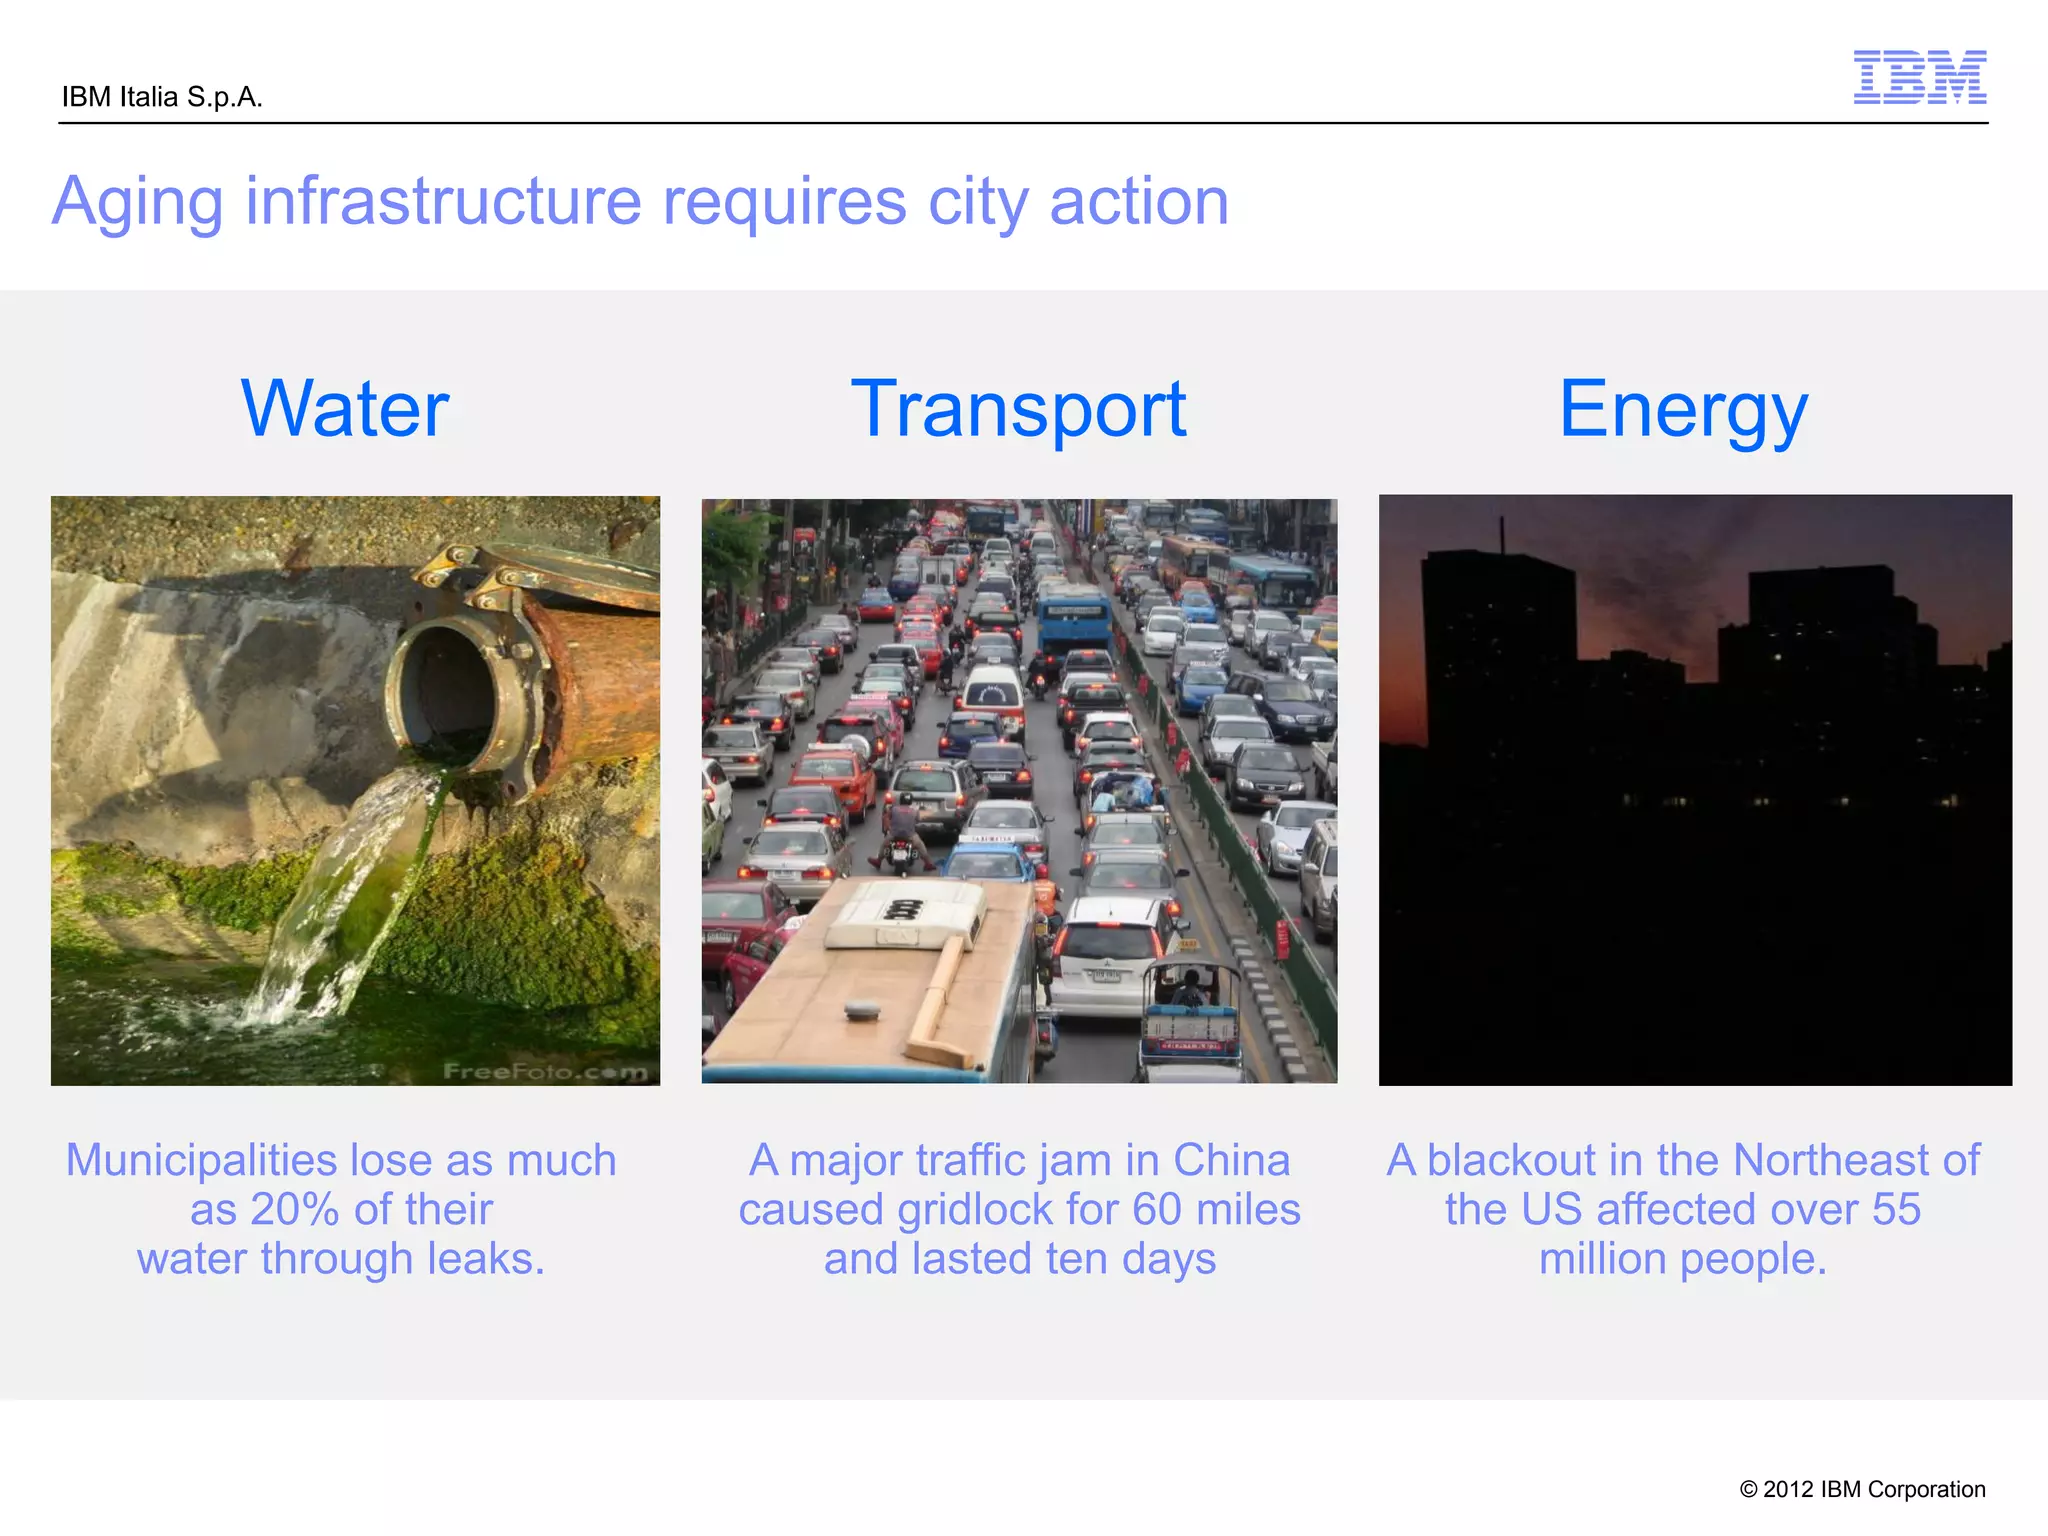
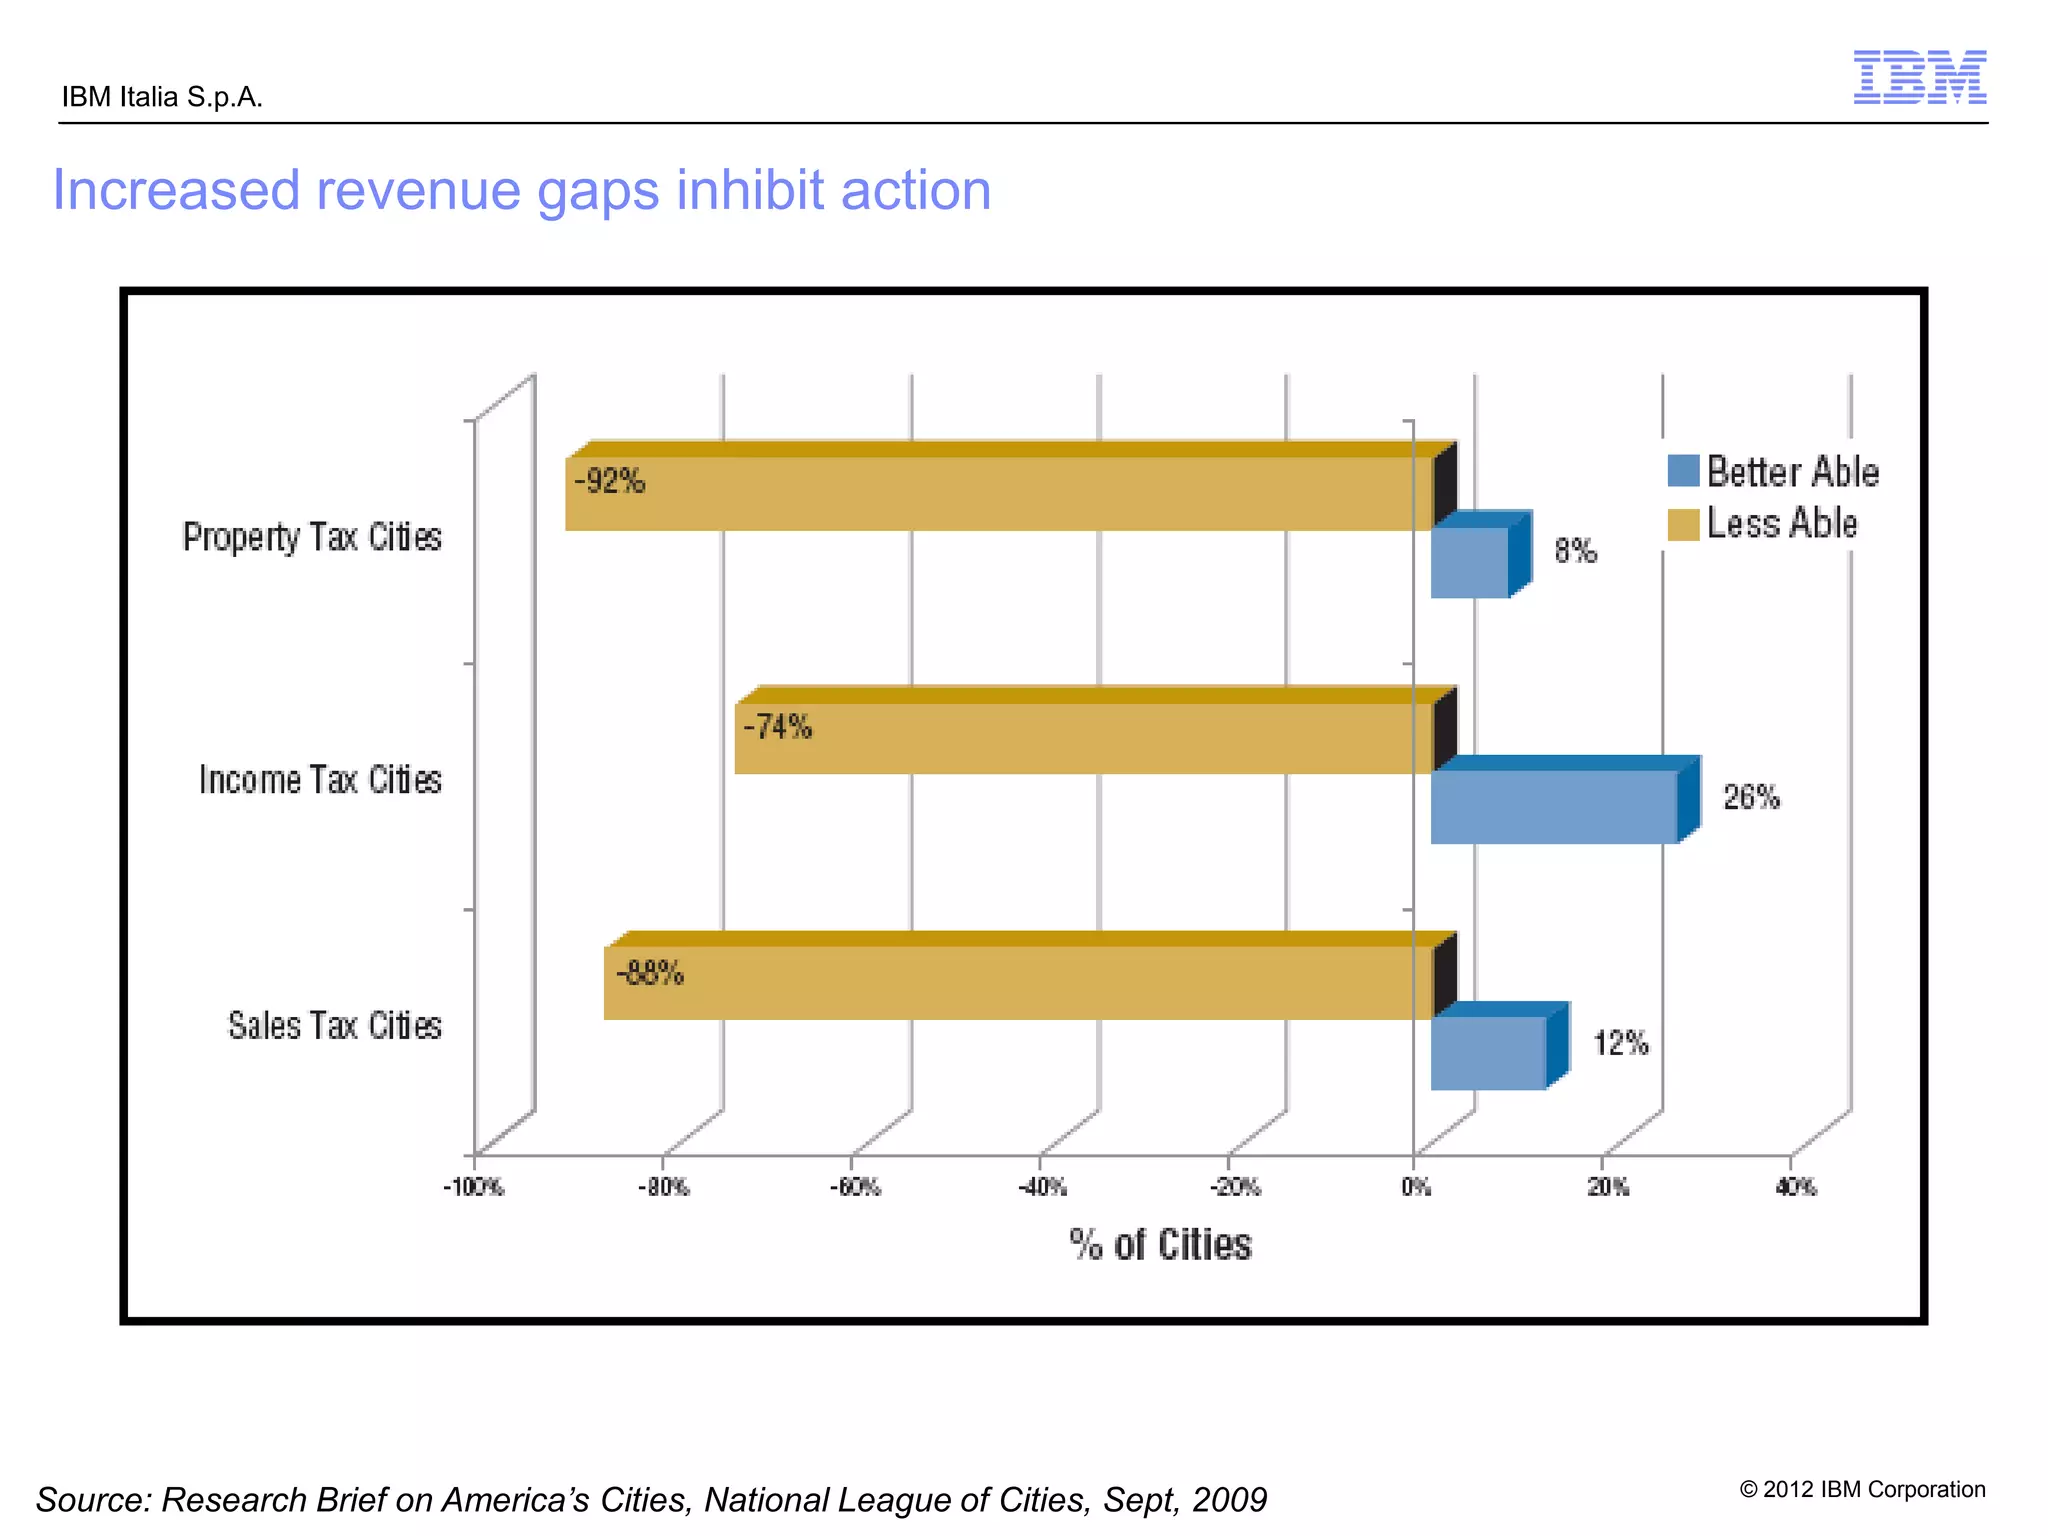
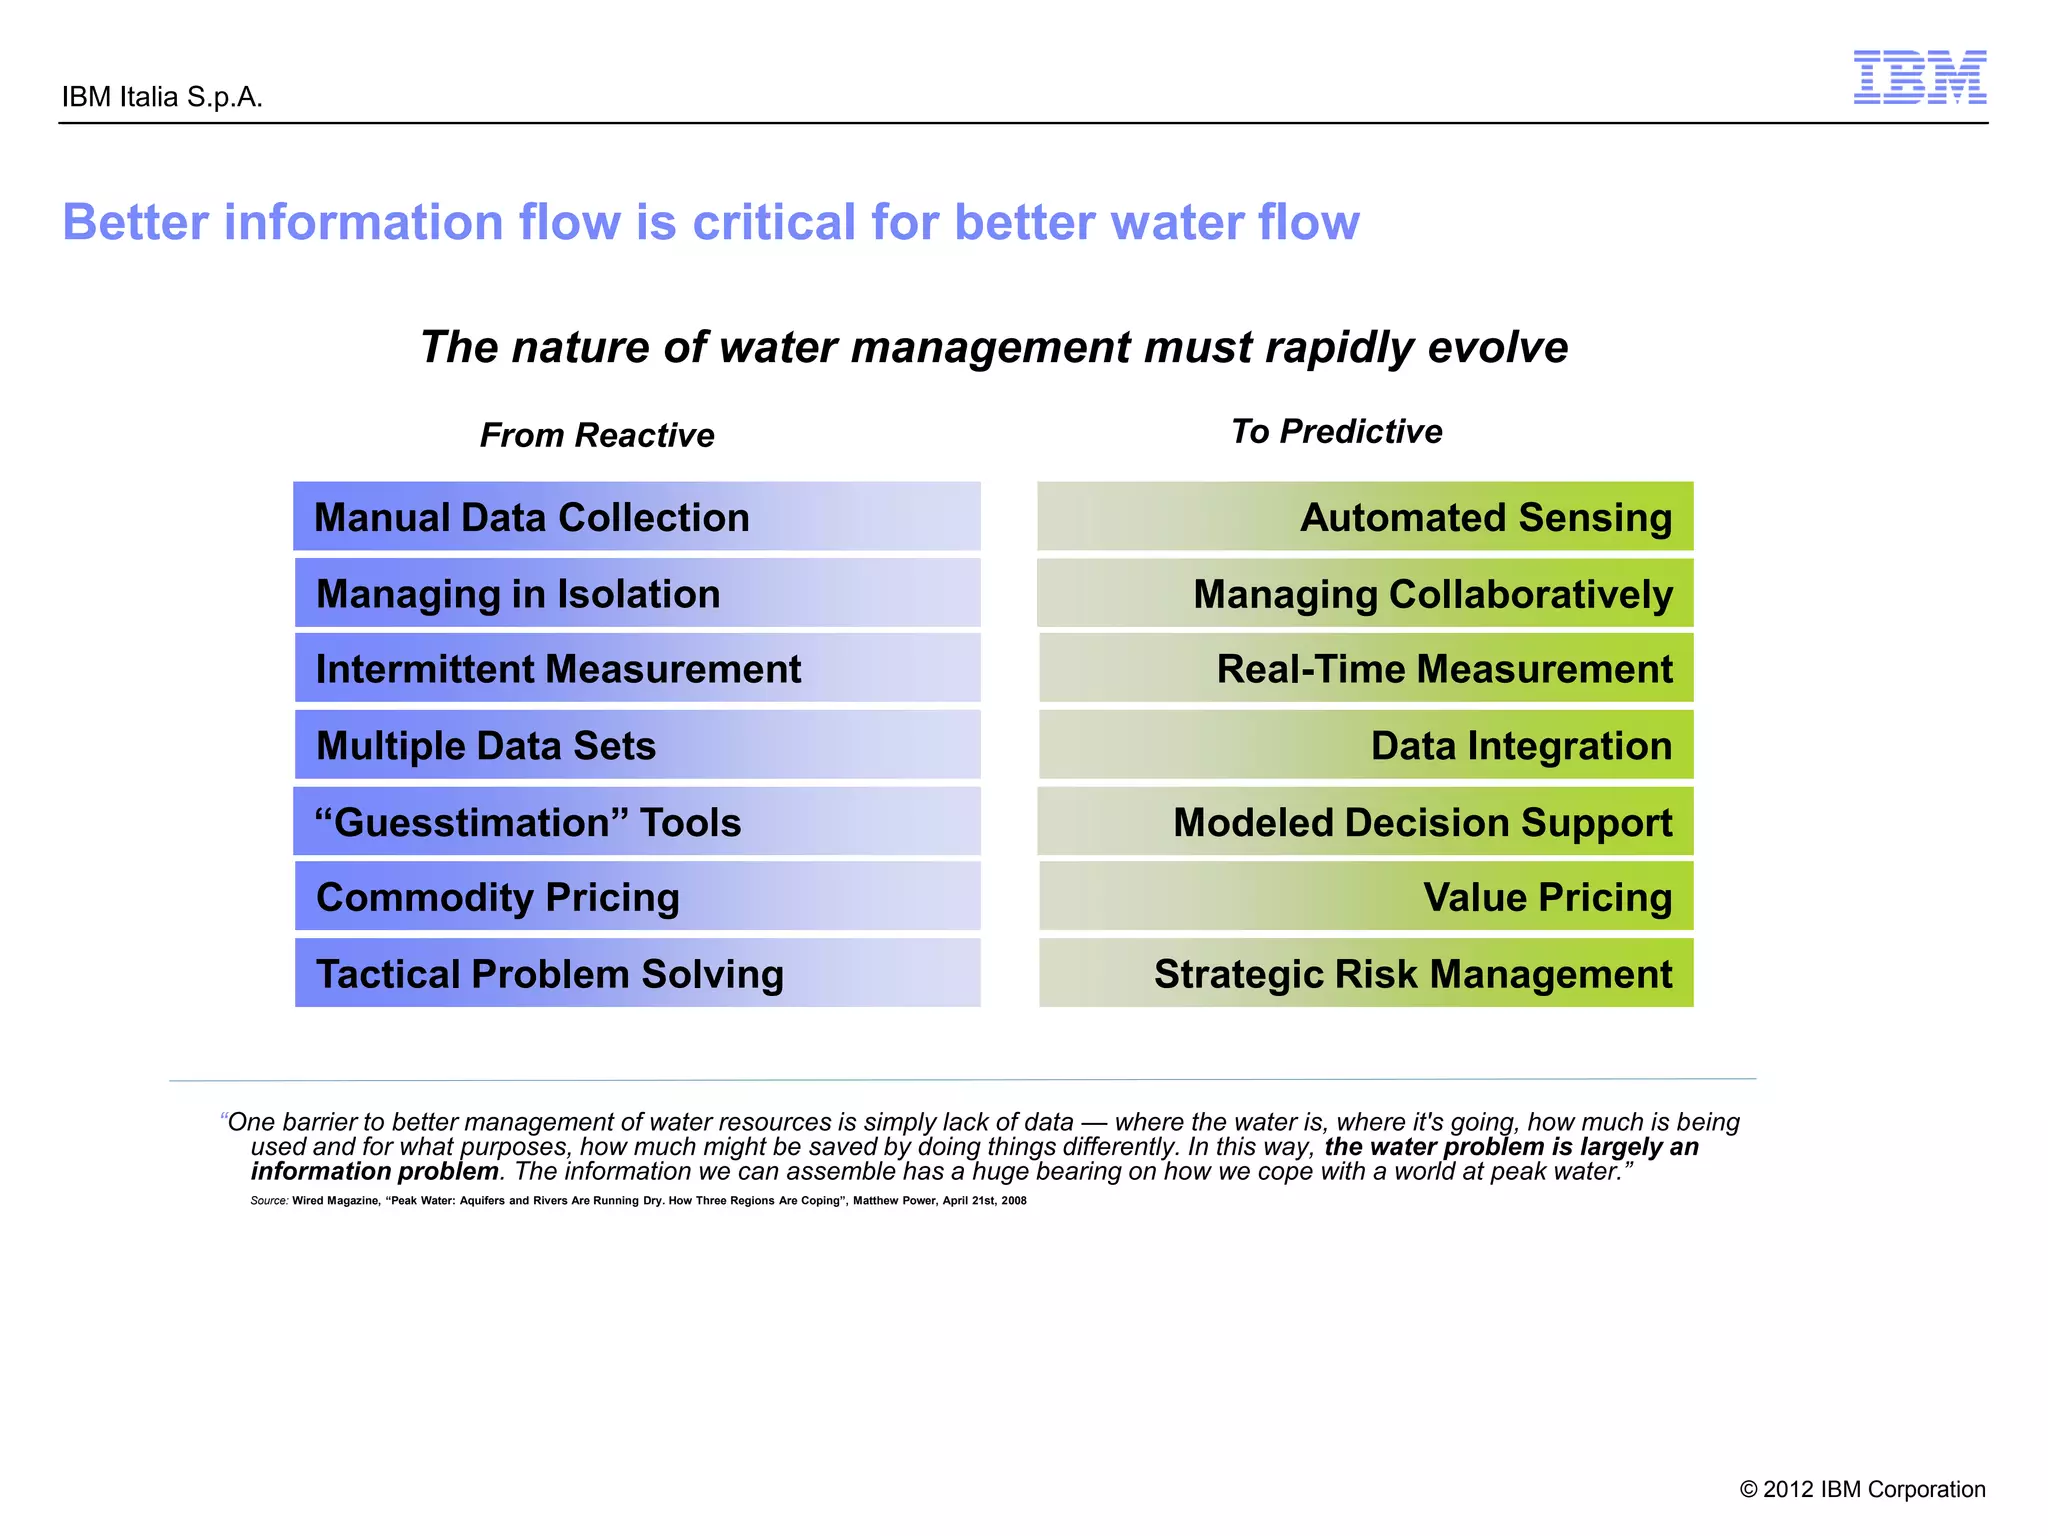
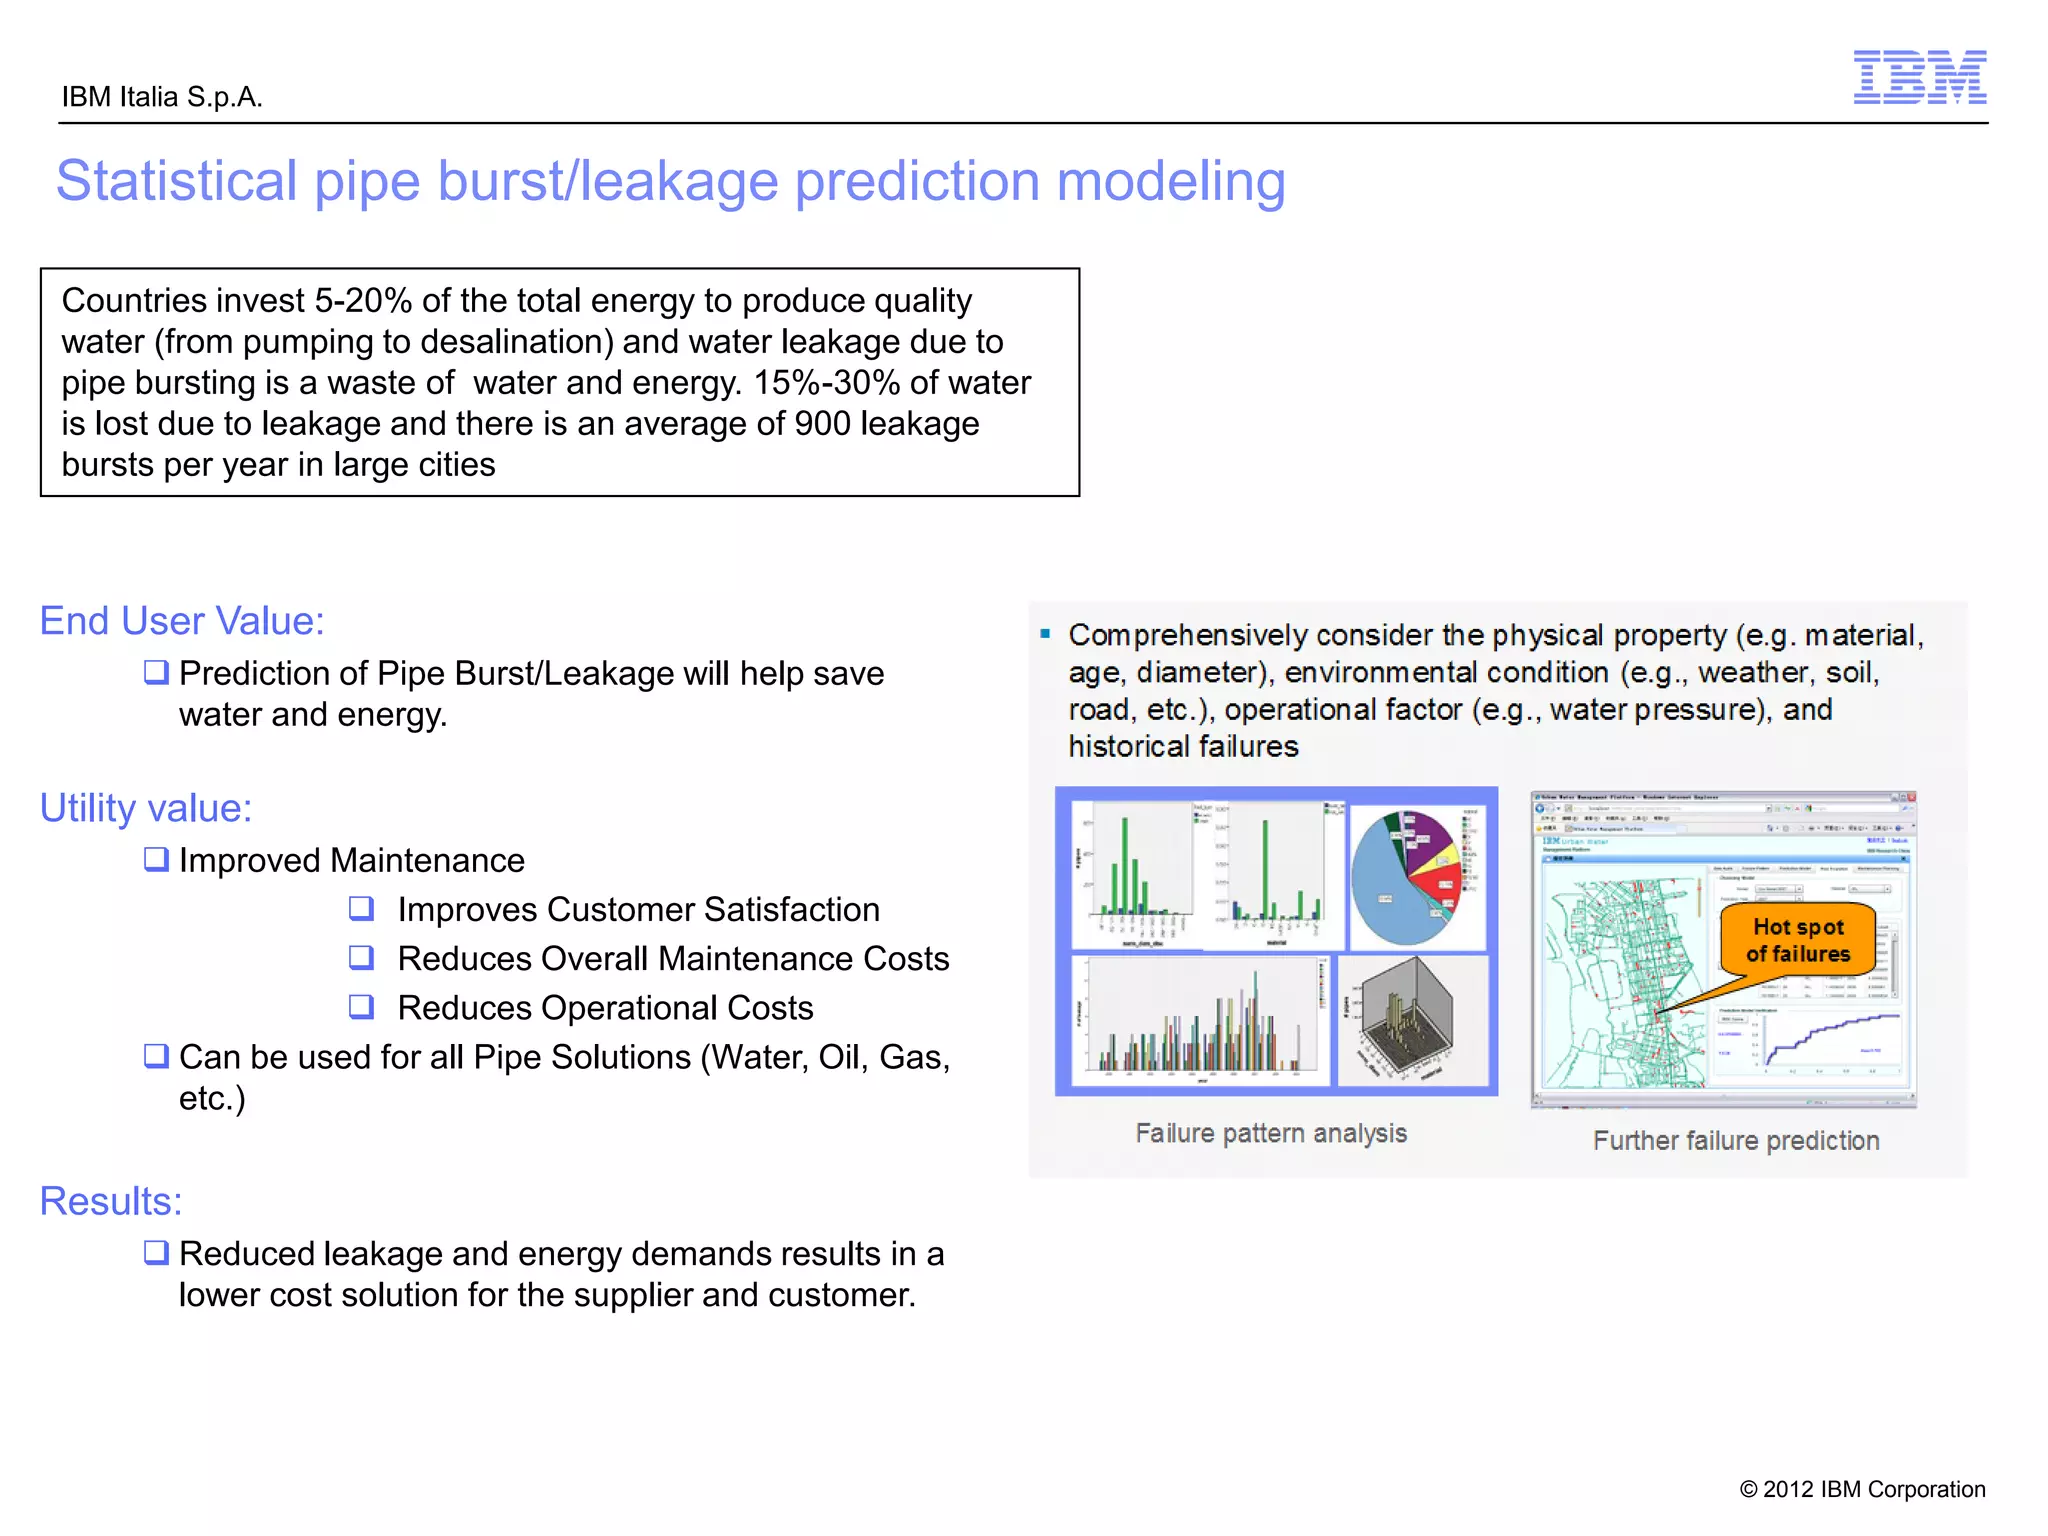
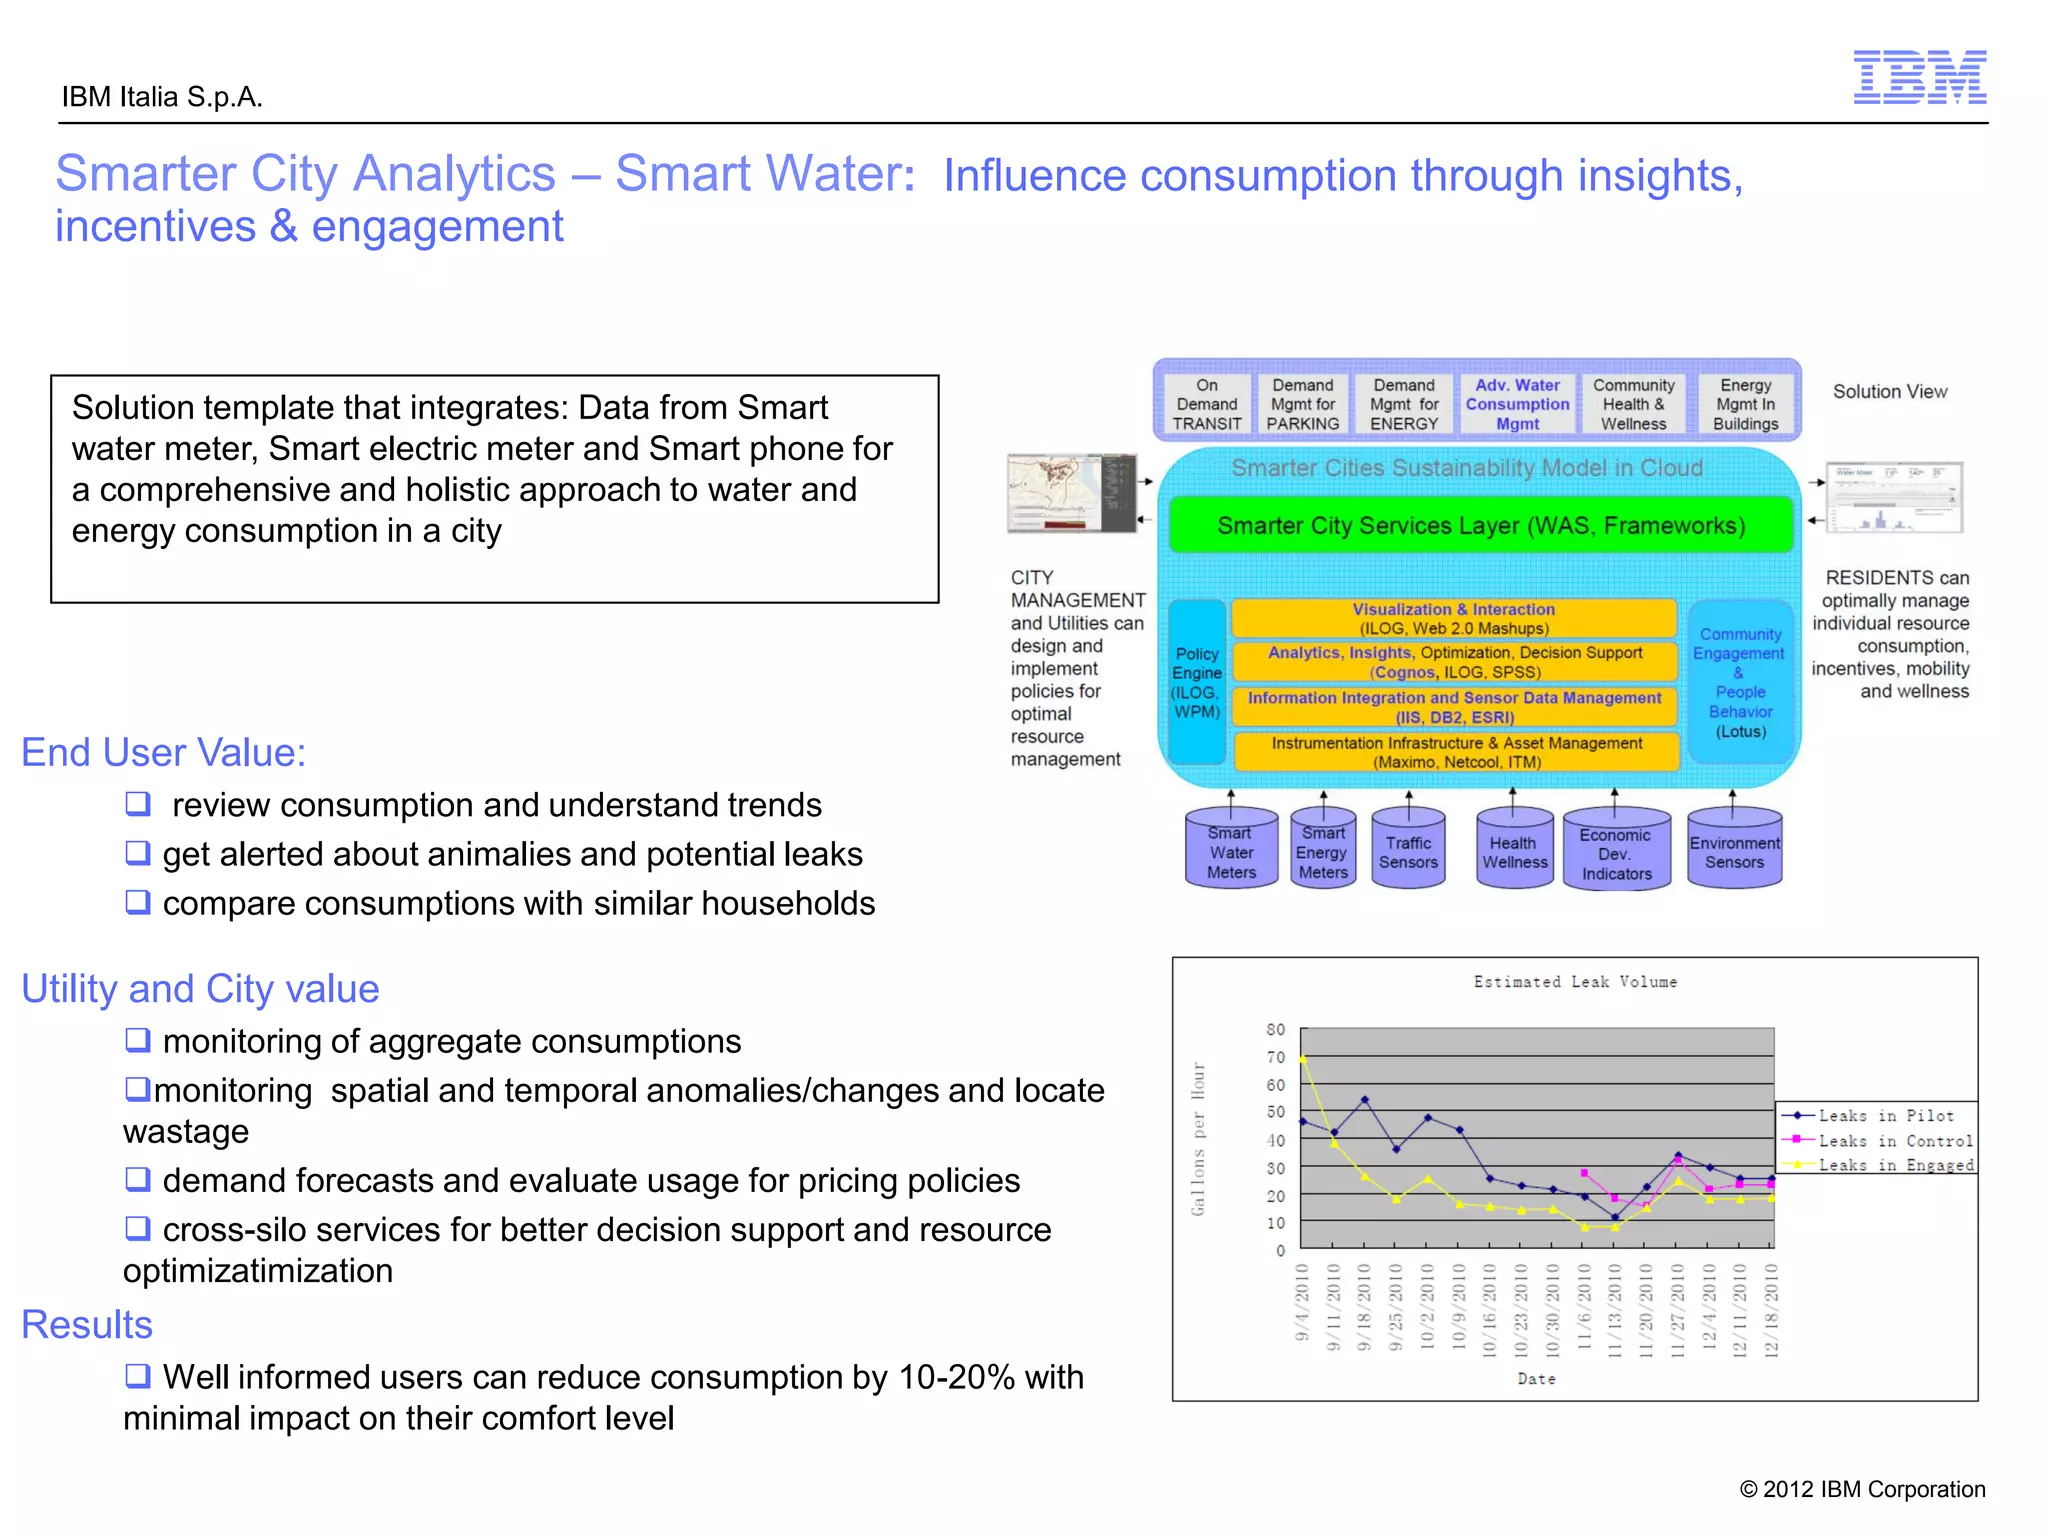
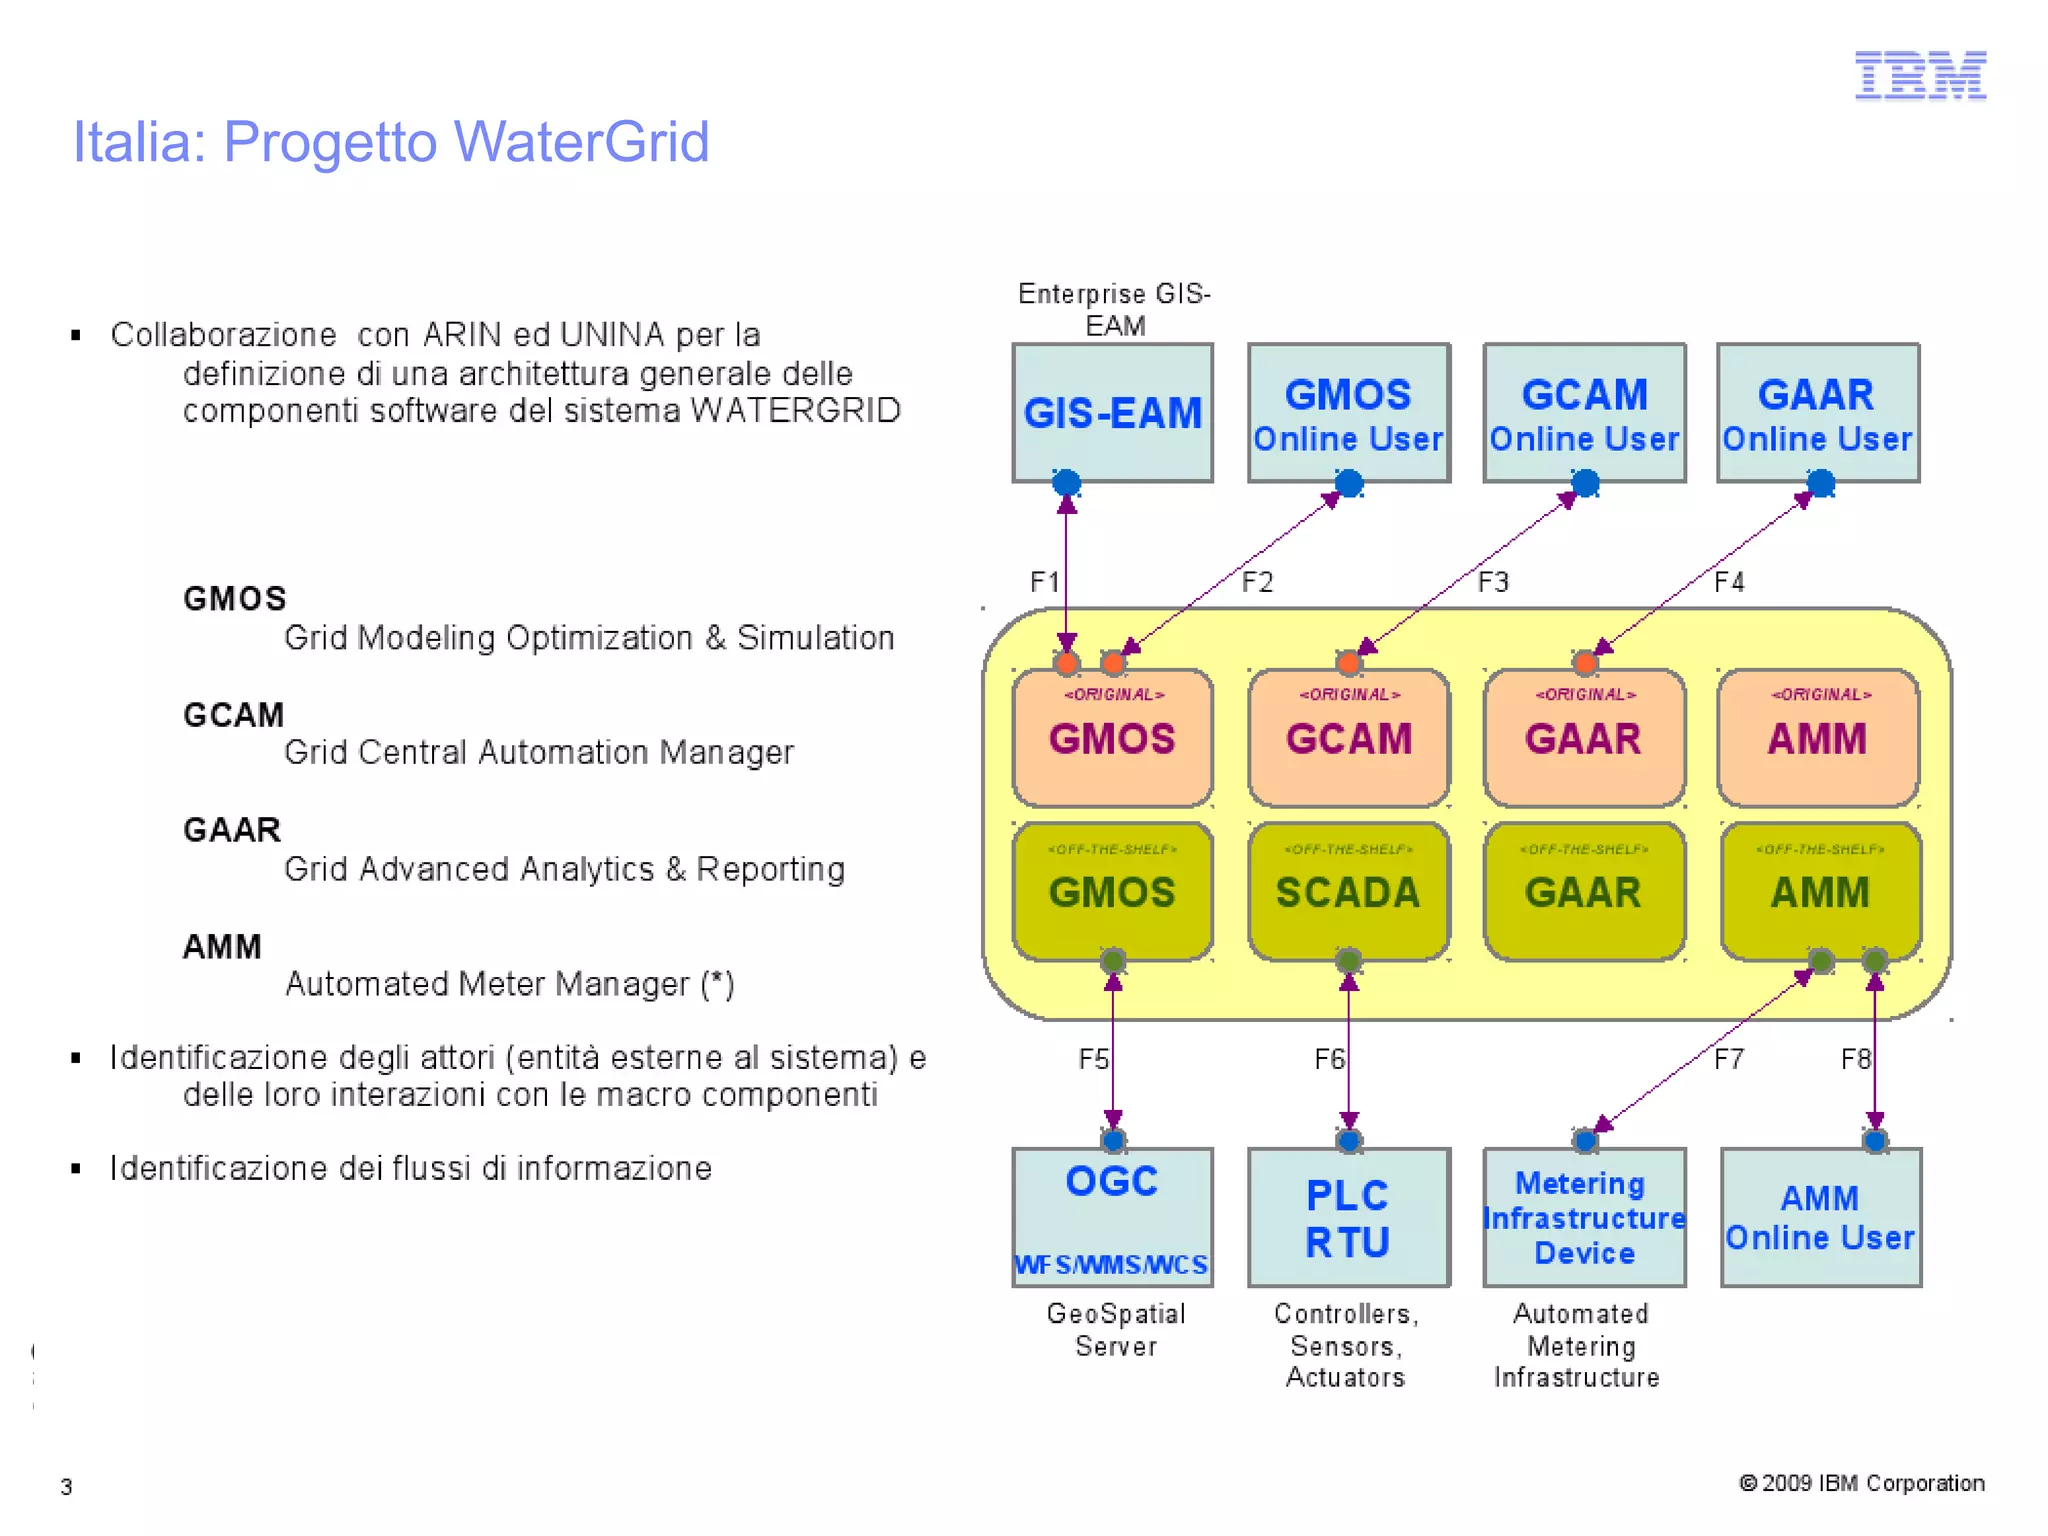
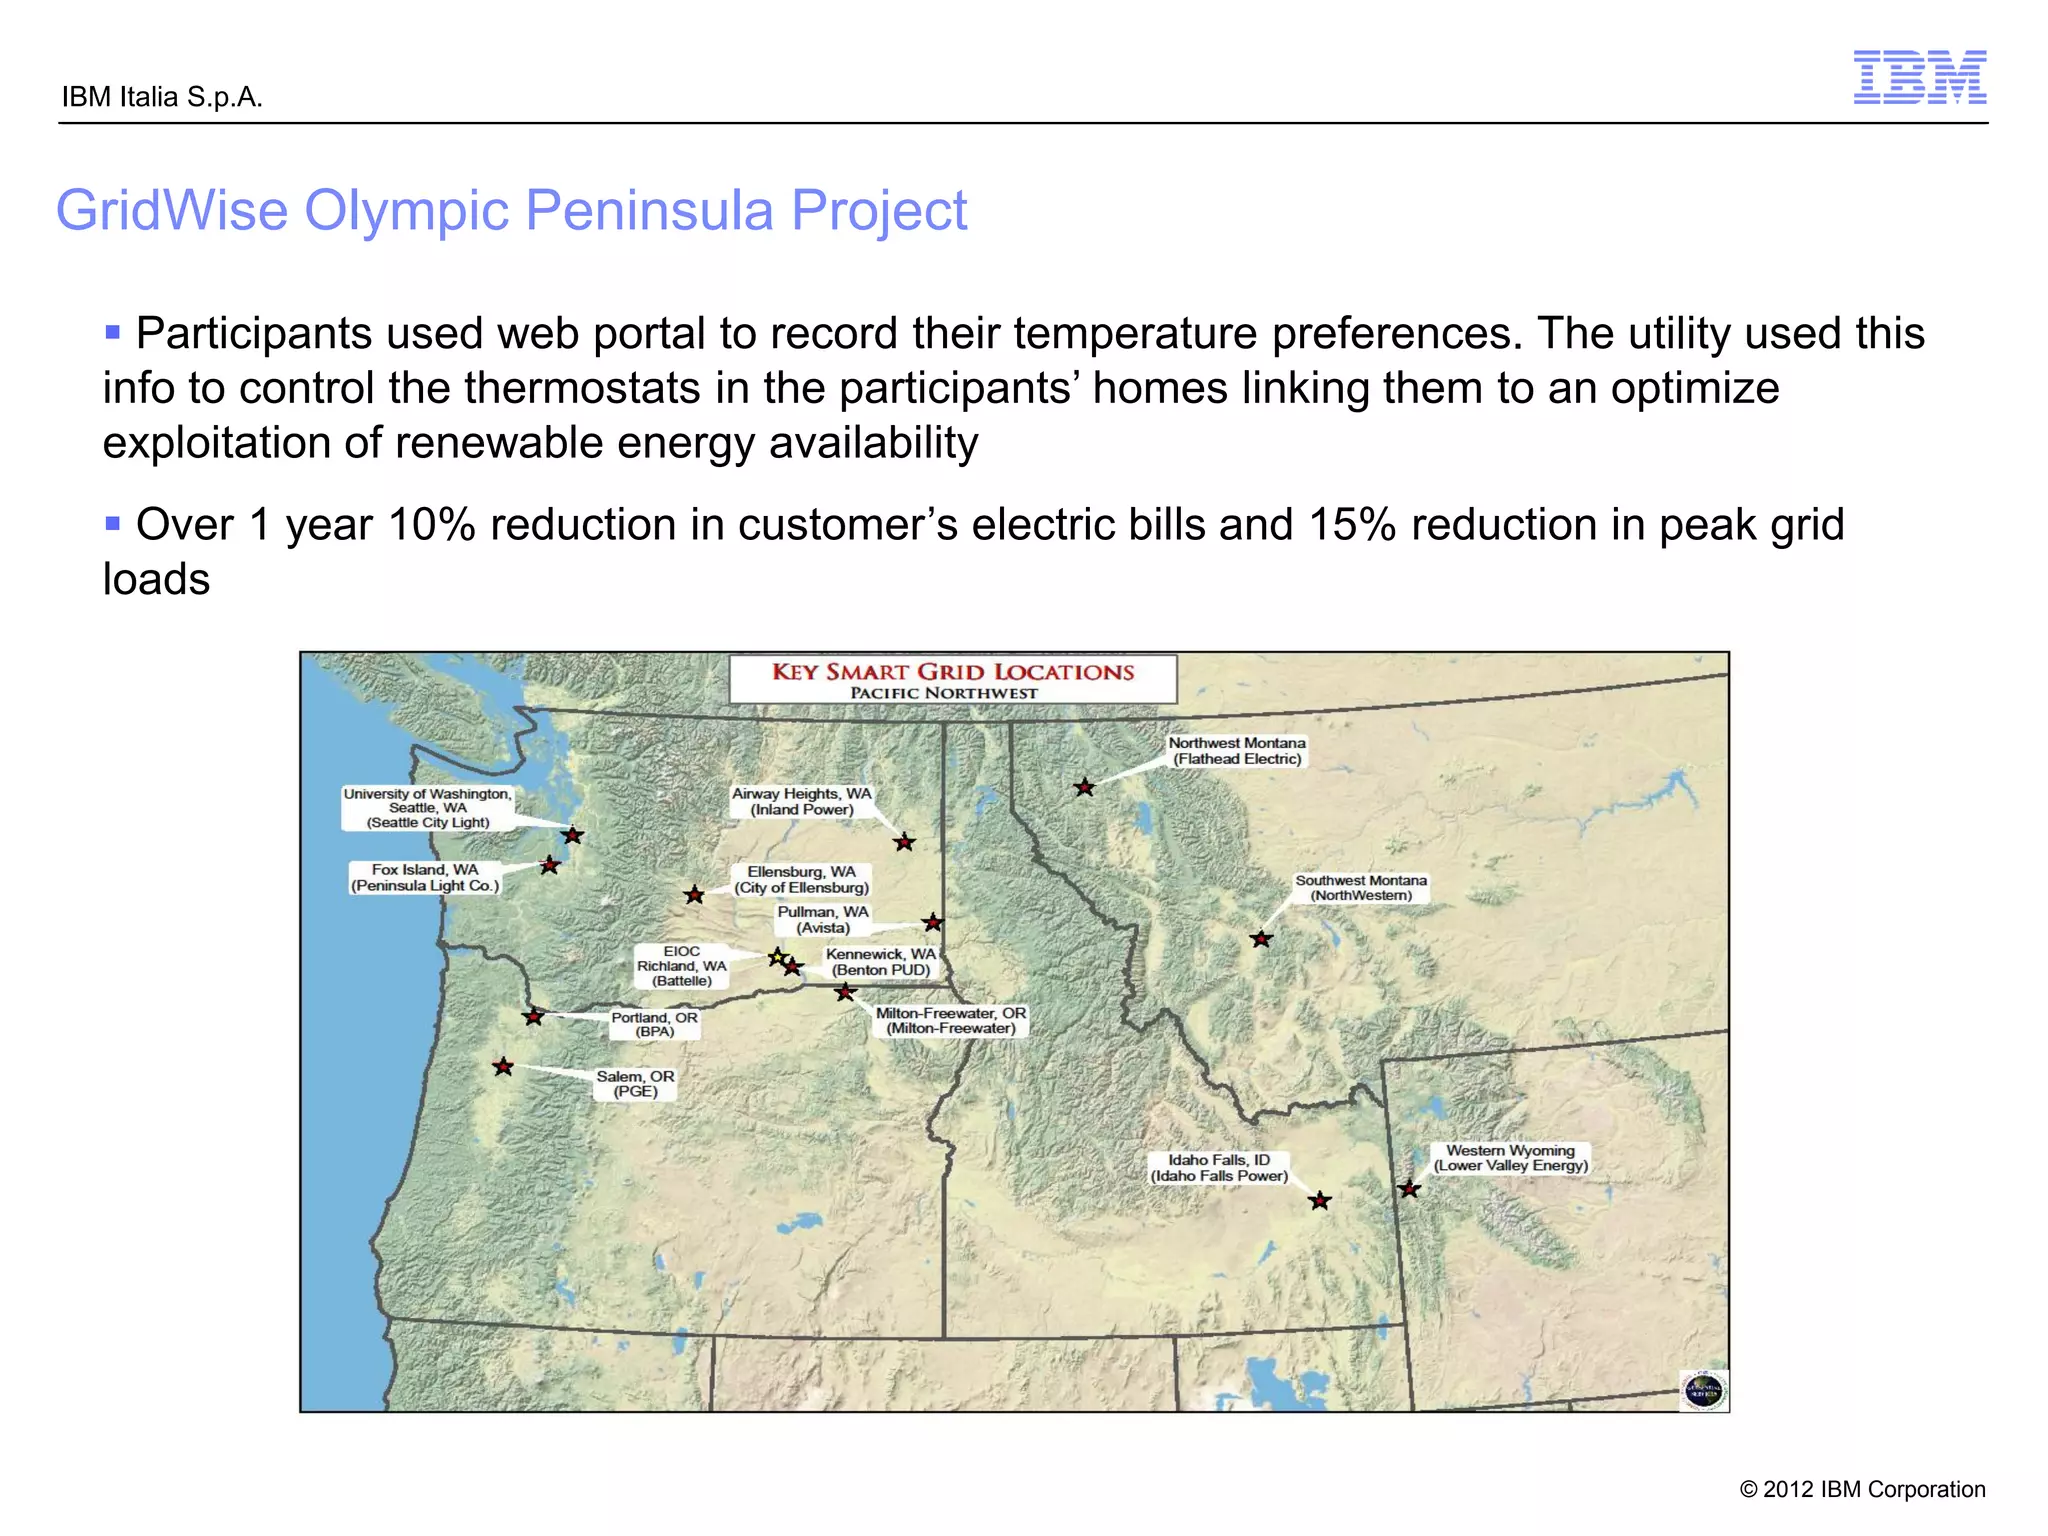
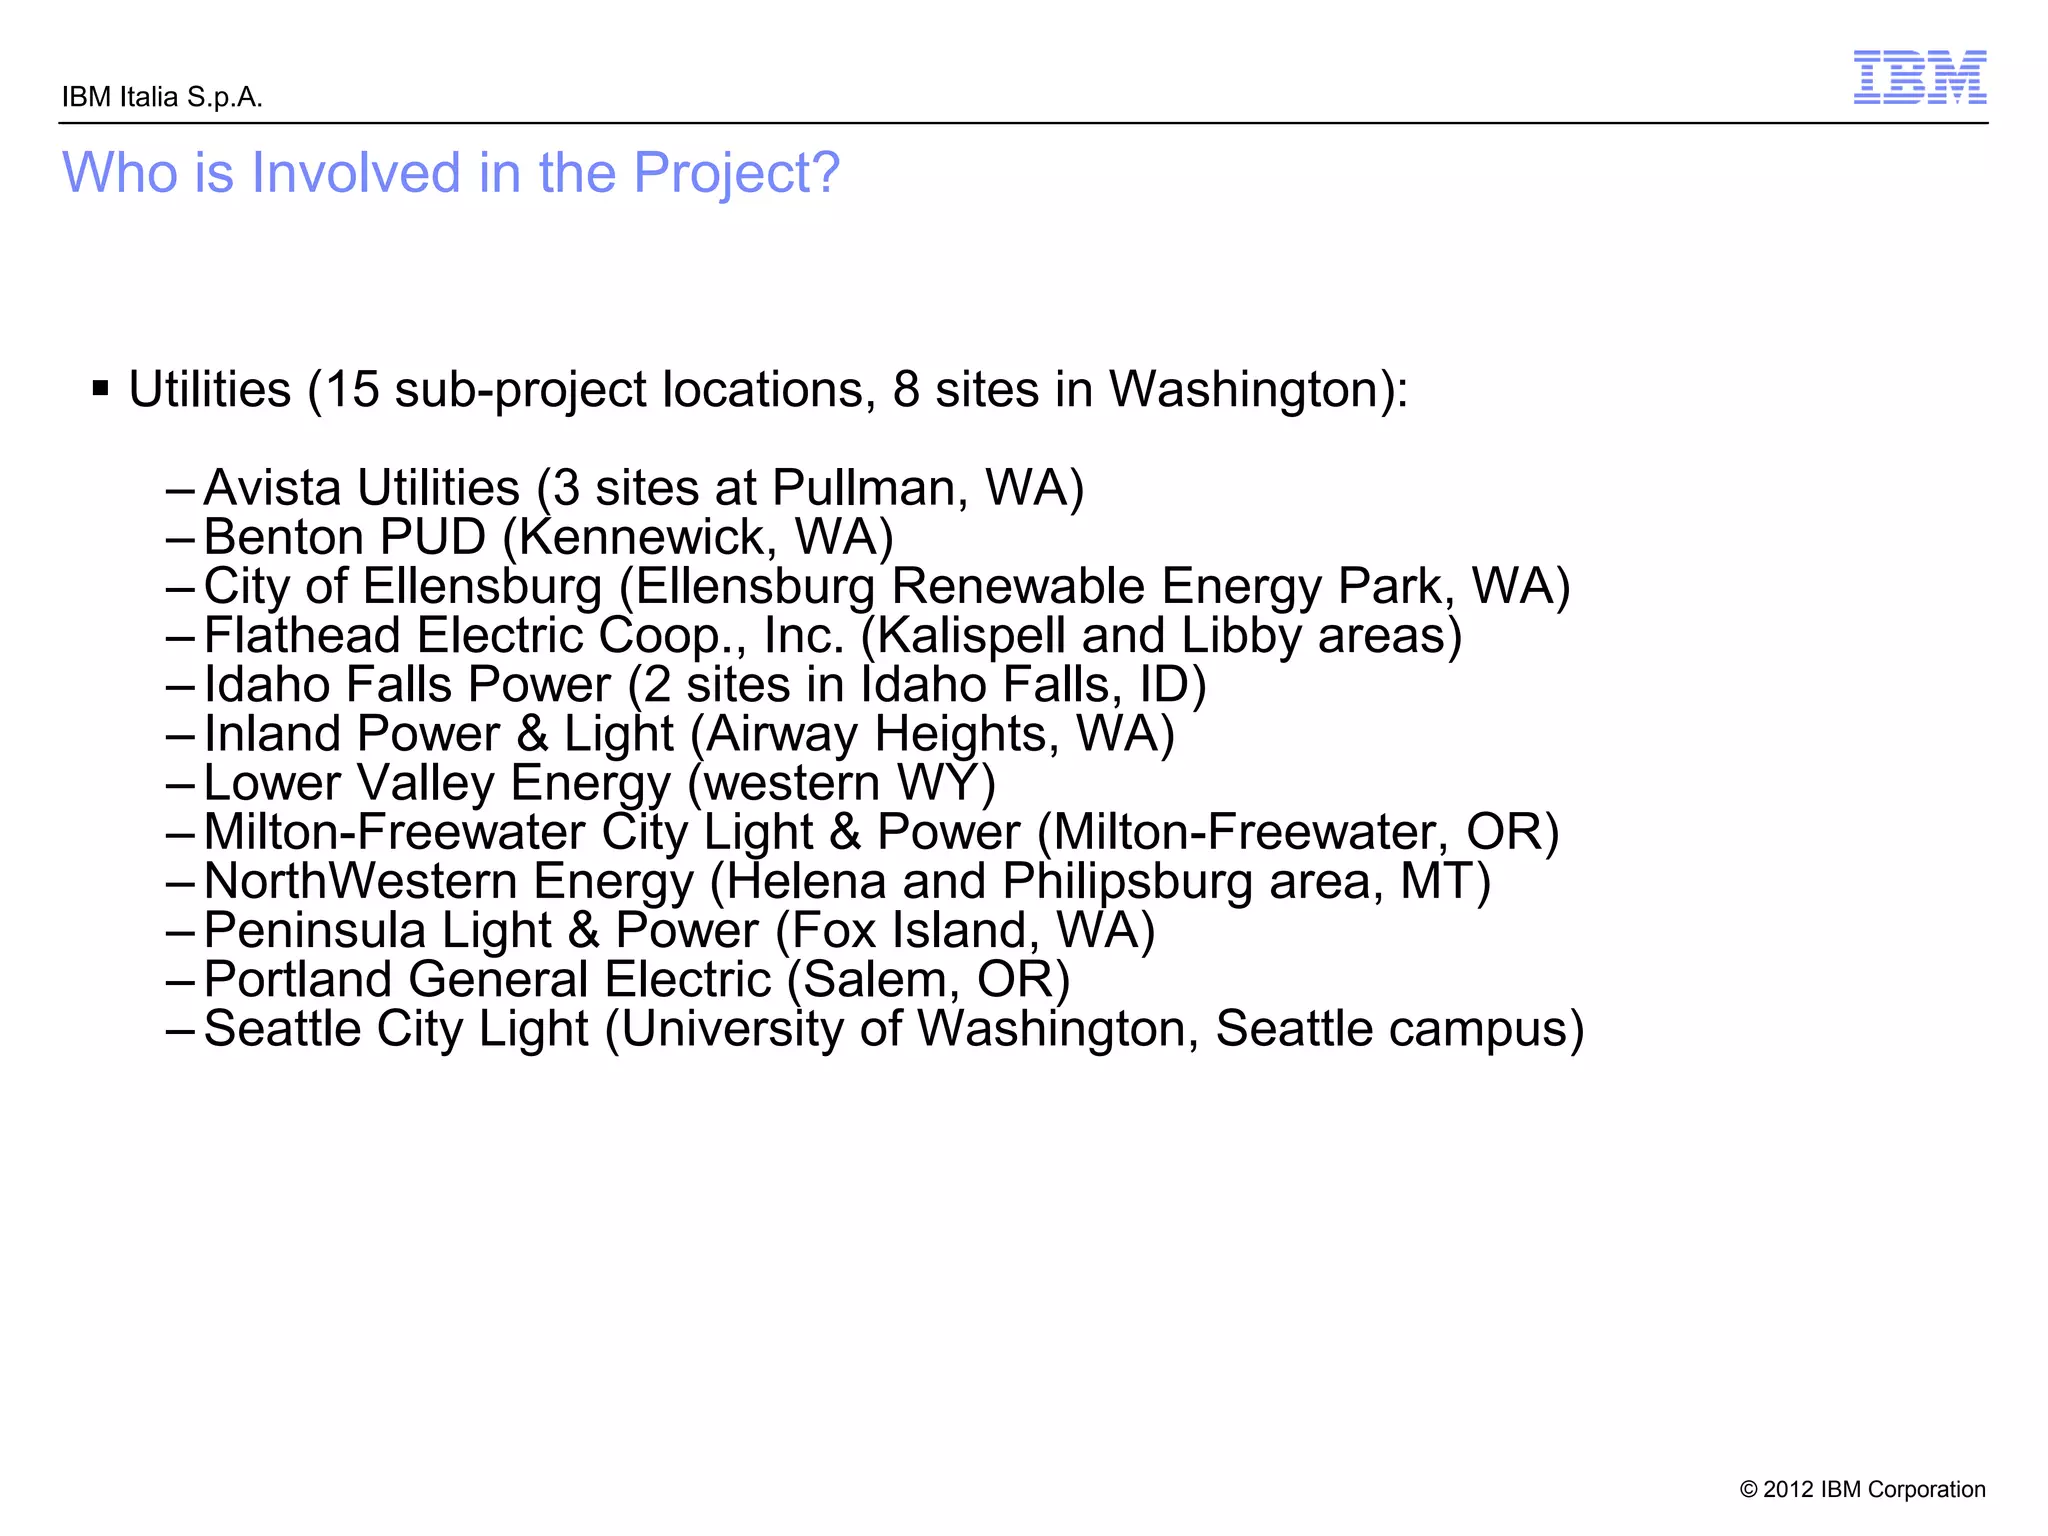
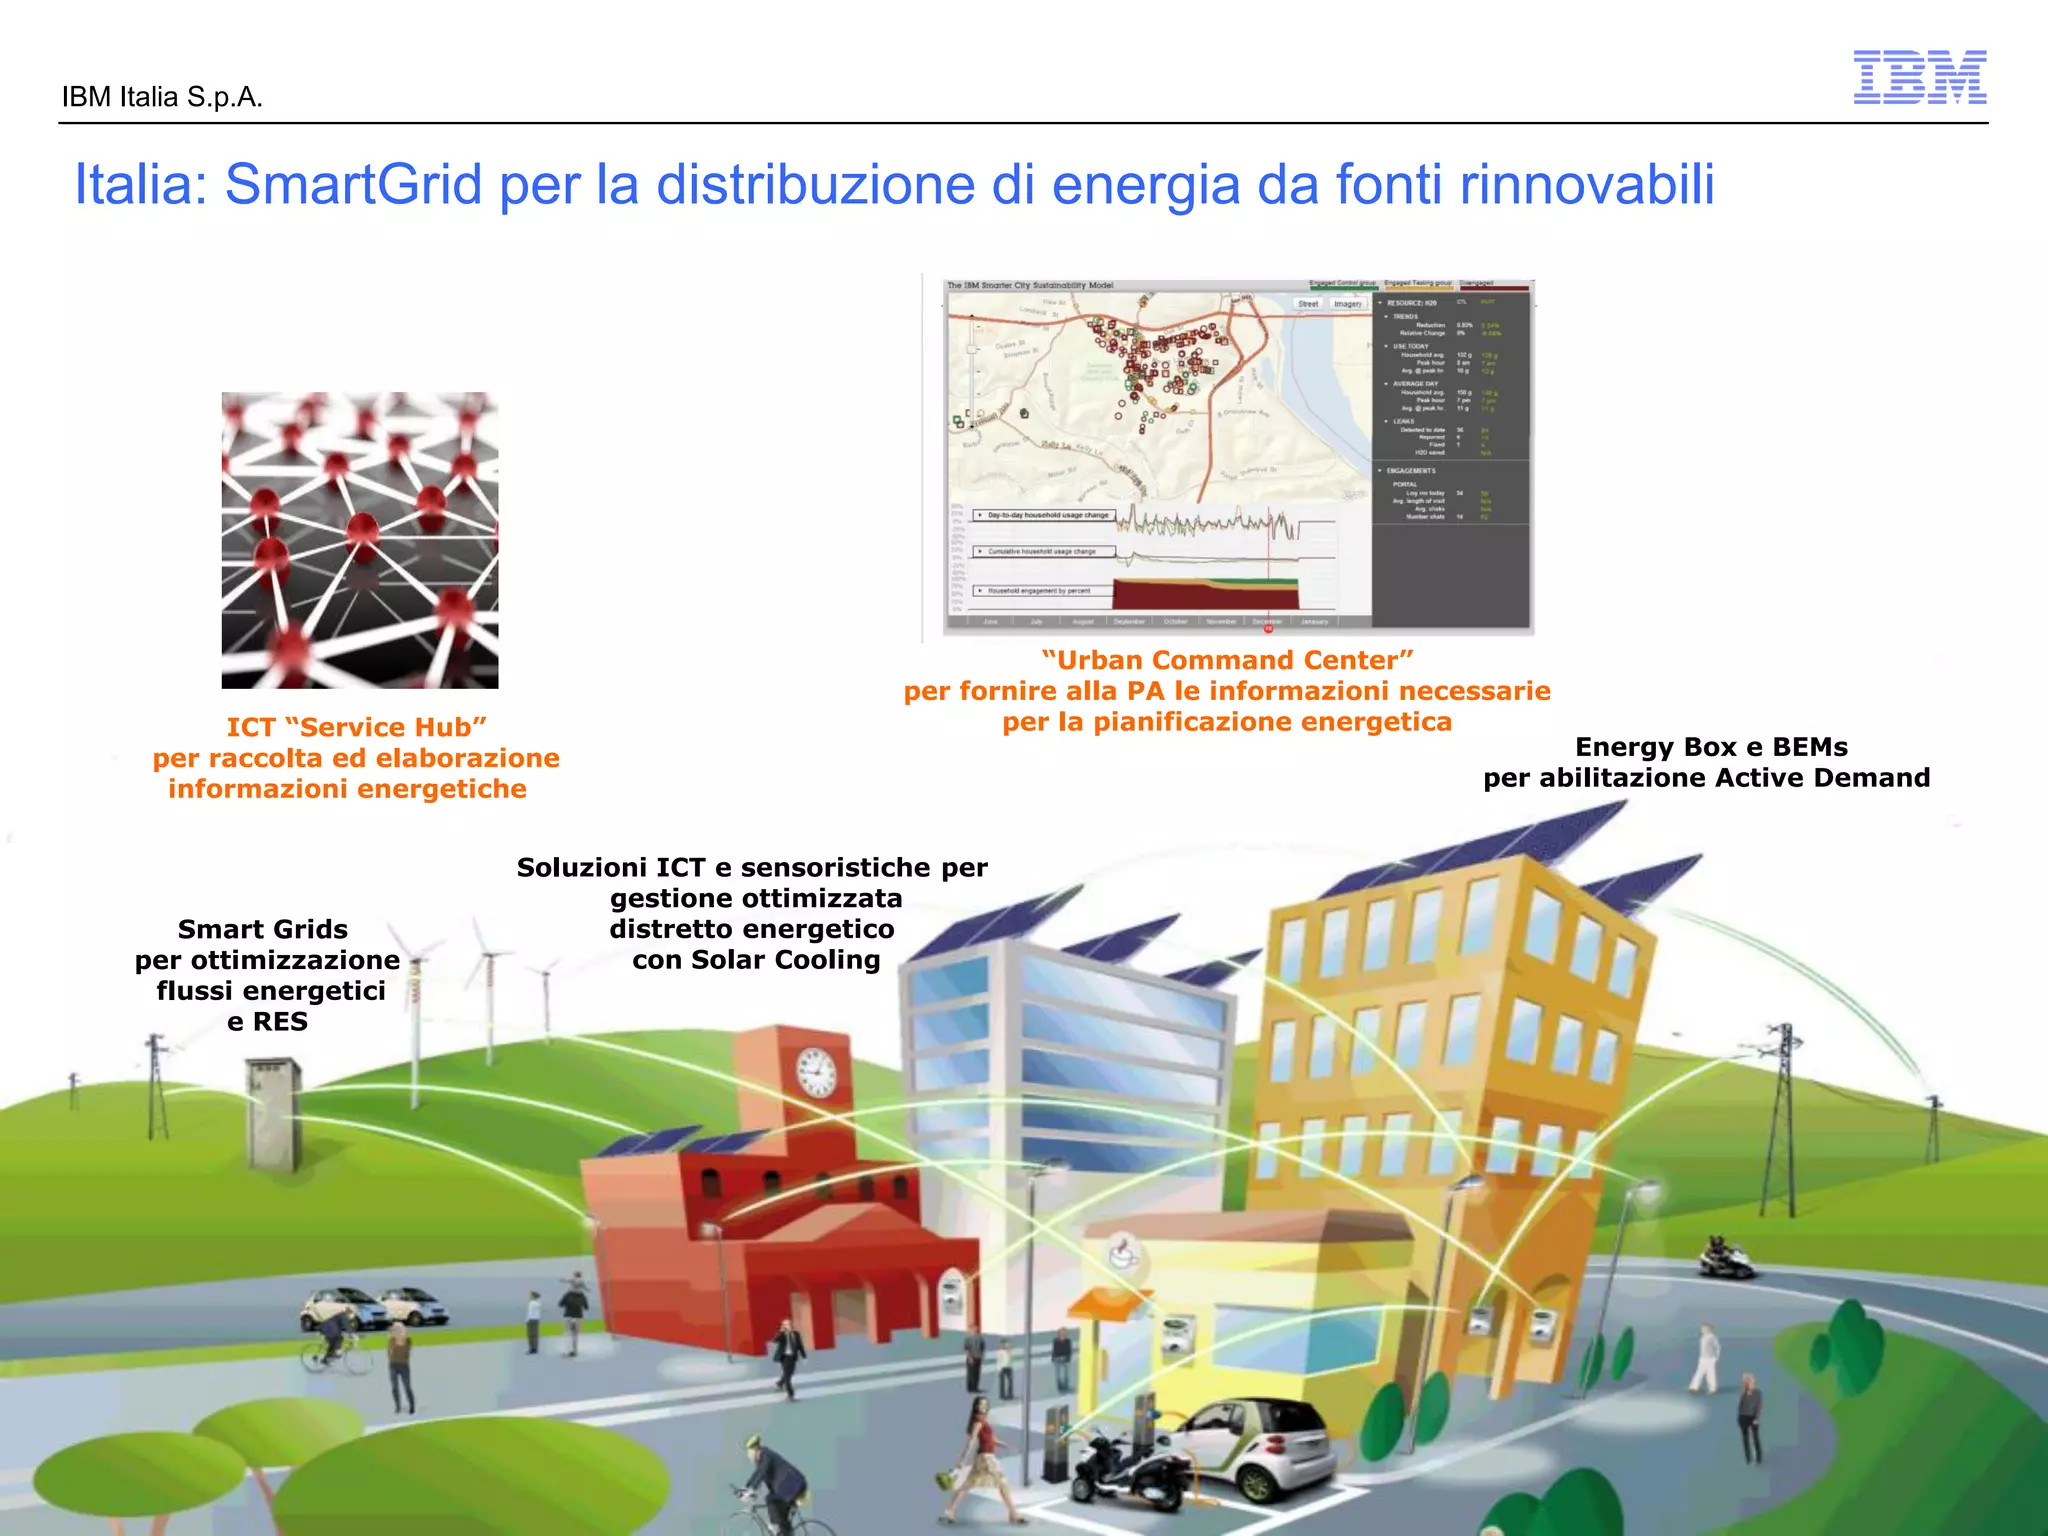
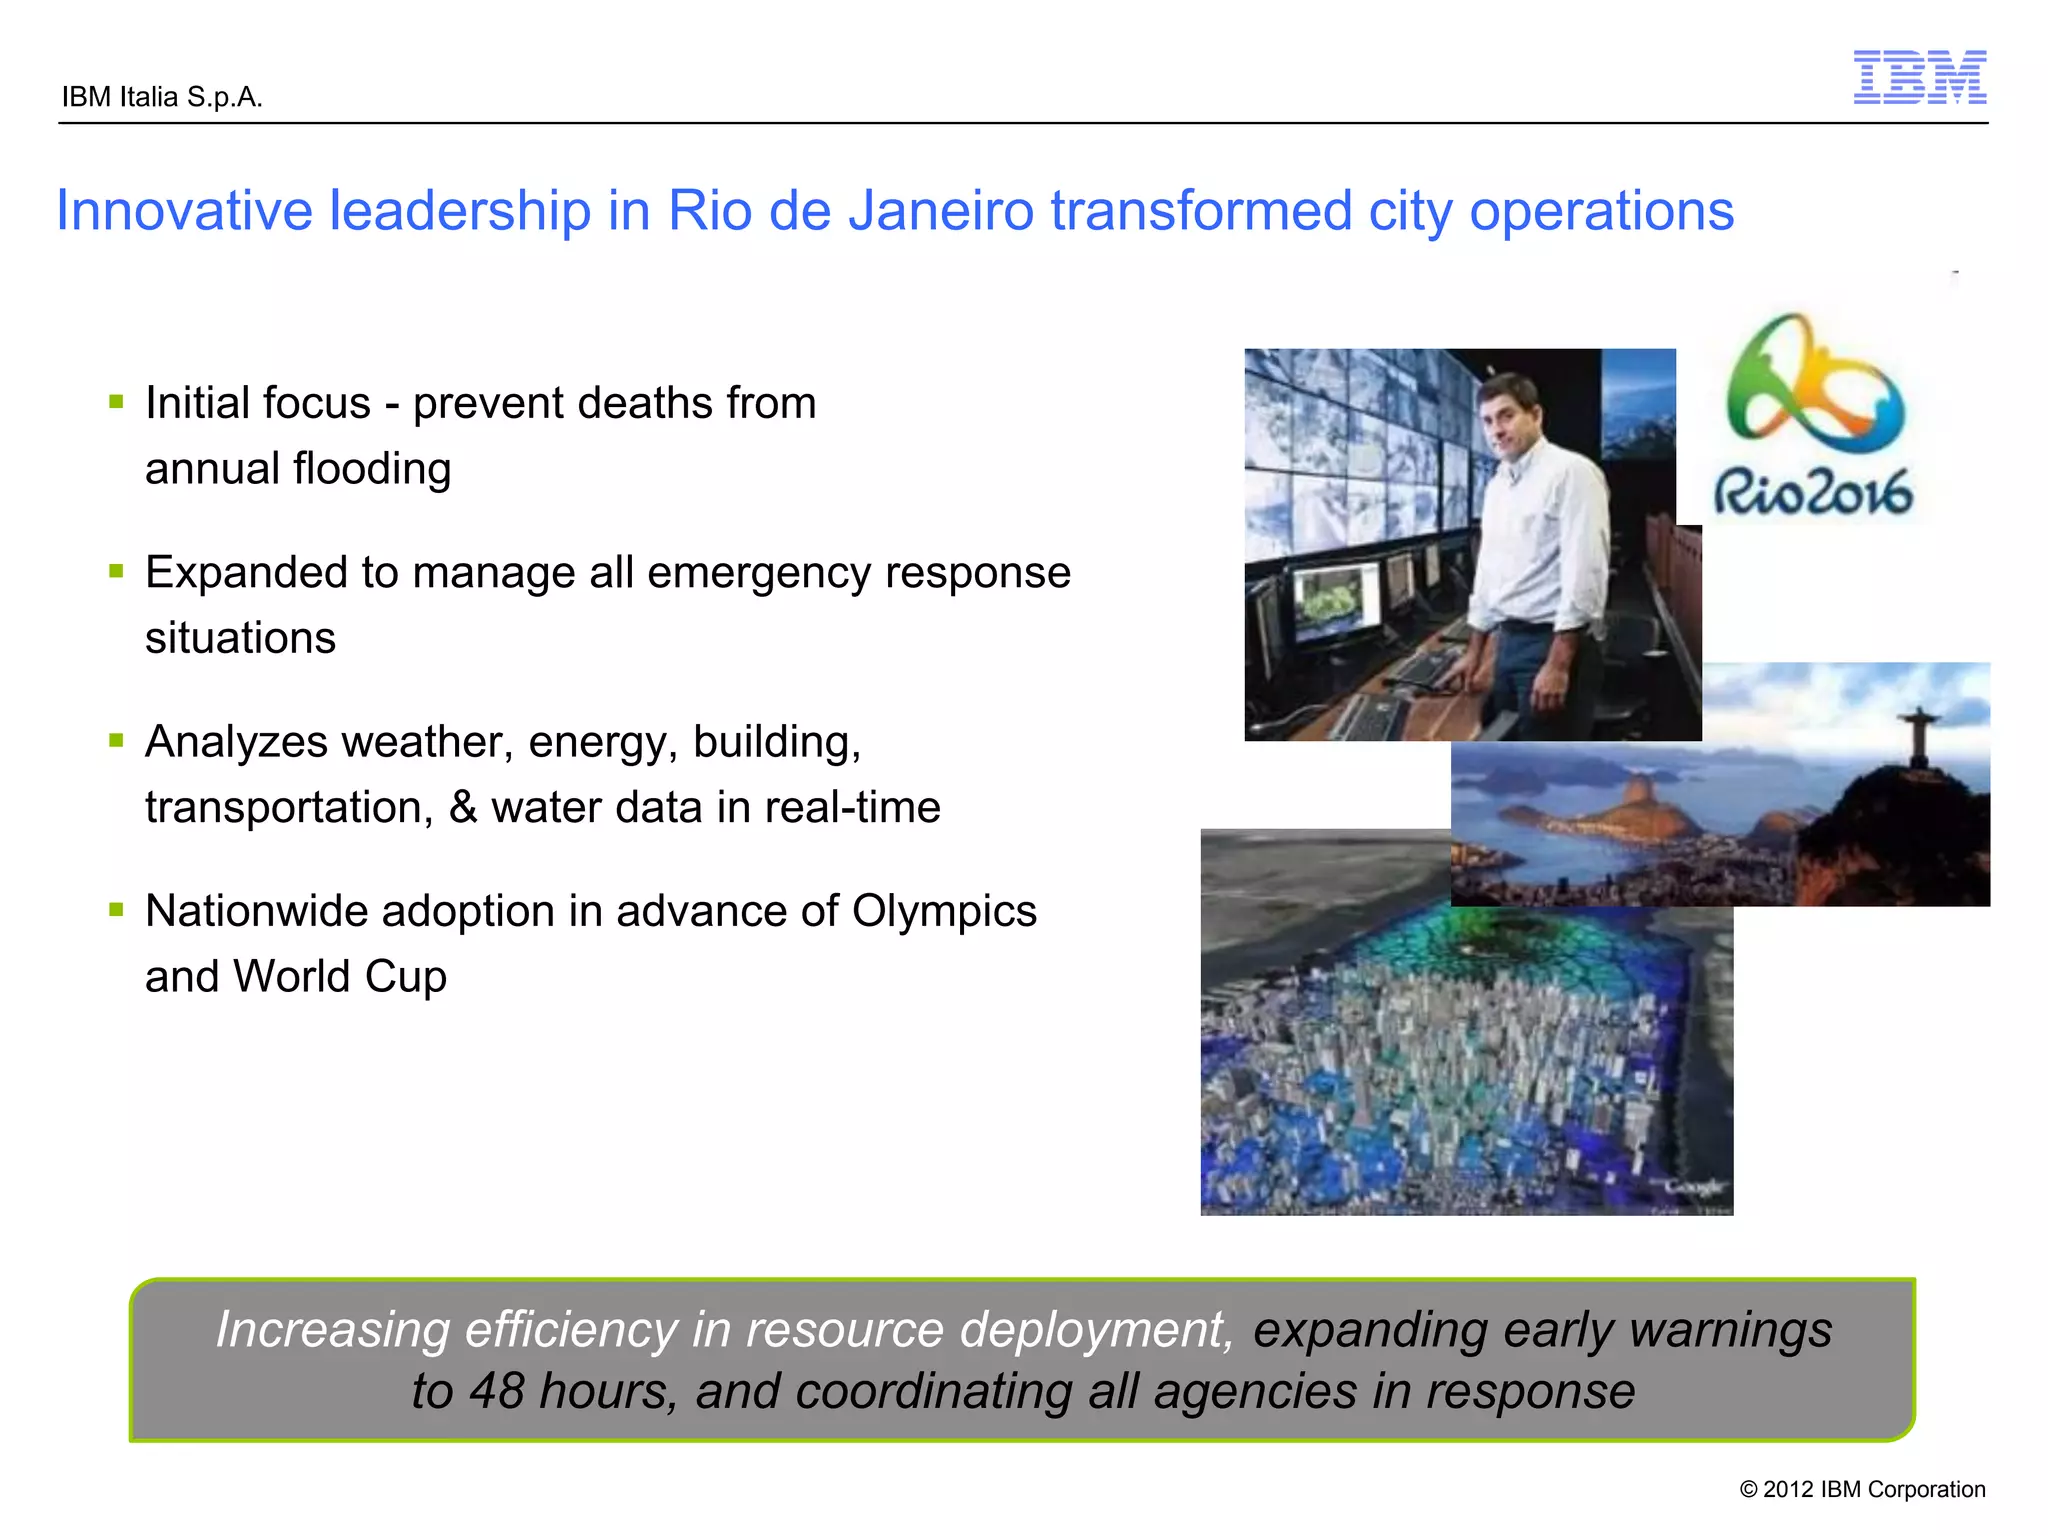
More Related Content More from canaleenergia (20) ibm1. IBM Italia S.p.A.
Come fondare la citta’ del futuro su solide
infrastrutture
Franco Prampolini
IBM Italia – Industry Solutions Director
Giugno 2012
© 2012 IBM Corporation
2. IBM Italia S.p.A.
Drivers of change
Exploding populations, urbanization, globalization and technology are
driving change.
This creates unique challenges and opportunities for transportation
providers.
2 billion / 7 billion 476 cities over 1 million
It took all of history for human In 2011 there are 476 urban areas with at
population to reach 2 billion, and only least 1 million people. That’s an increase of
one generation to more than triple to 573% from 1950 when there were 83. Over
nearly 7 billion. half the world’s population now lives in
urban areas.
2 © 2012 IBM Corporation
3. IBM Italia S.p.A.
Aging infrastructure requires city action
Water Transport Energy
Municipalities lose as much A major traffic jam in China A blackout in the Northeast of
as 20% of their caused gridlock for 60 miles the US affected over 55
water through leaks. and lasted ten days million people.
© 2012 IBM Corporation
4. IBM Italia S.p.A.
Increased revenue gaps inhibit action
Source: Research Brief on America’s Cities, National League of Cities, Sept, 2009 © 2012 IBM Corporation
6. IBM Italia S.p.A.
INSTRUMENTED
We now have the ability to measure, sense
and see the exact condition of everything.
Today, there are 1 billion transistors for each
person on the planet.
In 2011, 30 billion RFID tags have been
embedded into our world and across entire
ecosystems.
Everything will become instrumented:
supply chains, healthcare networks,
cities and even natural systems like rivers.
© 2012 IBM Corporation
7. IBM Italia S.p.A.
INTERCONNECTED
People, systems and objects can
communicate and interact with each
other in entirely new ways.
The internet of people is 1 billion strong.
Almost one third of the world’s population will
be on the web by 2011.
4% of Telco clients generates 70% of traffic
The Internet of Things — cars, appliances,
cameras, roadways, pipeline, pharmaceuticals
and even livestock—is headed to 1 trillion.
© 2012 IBM Corporation
8. IBM Italia S.p.A.
INTELLIGENT
New computing models manage the
massive amounts of data generated by the
proliferation of end-user devices, sensors, and
actuators.
Every day, 15 petabytes of new information are being
generated. This is 8x more than the information in all U.S.
libraries.
We can respond to changes quickly and accurately,
and get better results by predicting and optimizing
for future events.
Using advanced analytics, we can generate new info by the
correlation of structured (i.e. data bases) and unstructured (i.e.
social networks) data
Predictive Information can address dynamic process modelling
and adaptation
© 2012 IBM Corporation
9. IBM Italia S.p.A.
+ + =
An opportunity to think and act in new ways—
economically, socially and technically.
“Less is more” (L. Mies van der Roher)
© 2012 IBM Corporation
10. IBM Italia S.p.A.
Every natural system and man-made system
is becoming interconnected, instrumented and intelligent.
© 2012 IBM Corporation
12. IBM Italia S.p.A.
What does it mean to become Smarter for a utility grid?
Measuring, Monitoring, Modeling and Managing
Sensing Metering
Data collection
Incentives and actions to change behavior
Feedback to user and data source;
Real Time
Data Integration
Data Integration
Real Time Comparison of historical
+ Historical Data data, with newly collected
data
Data Modeling Data modeling and analytics
to create insights from data
+ Analytics
to feed decision support and
actions
Visualization Source: IBM Corporate Strategy
+ Decisions
© 2012 IBM Corporation
13. IBM Italia S.p.A.
Better information flow is critical for better water flow
The nature of water management must rapidly evolve
From Reactive To Predictive
Manual Data Collection Automated Sensing
Managing in Isolation Managing Collaboratively
Intermittent Measurement Real-Time Measurement
Multiple Data Sets Data Integration
“Guesstimation” Tools Modeled Decision Support
Commodity Pricing Value Pricing
Tactical Problem Solving Strategic Risk Management
“One barrier to better management of water resources is simply lack of data — where the water is, where it's going, how much is being
used and for what purposes, how much might be saved by doing things differently. In this way, the water problem is largely an
information problem. The information we can assemble has a huge bearing on how we cope with a world at peak water.”
Source: Wired Magazine, “Peak Water: Aquifers and Rivers Are Running Dry. How Three Regions Are Coping”, Matthew Power, April 21st, 2008
© 2012 IBM Corporation
14. IBM Italia S.p.A.
Statistical pipe burst/leakage prediction modeling
Countries invest 5-20% of the total energy to produce quality
water (from pumping to desalination) and water leakage due to
pipe bursting is a waste of water and energy. 15%-30% of water
is lost due to leakage and there is an average of 900 leakage
bursts per year in large cities
End User Value:
Prediction of Pipe Burst/Leakage will help save
water and energy.
Utility value:
Improved Maintenance
Improves Customer Satisfaction
Reduces Overall Maintenance Costs
Reduces Operational Costs
Can be used for all Pipe Solutions (Water, Oil, Gas,
etc.)
Results:
Reduced leakage and energy demands results in a
lower cost solution for the supplier and customer.
14 IBM Confidential © 2012 IBM Corporation
15. IBM Italia S.p.A.
Smarter City Analytics – Smart Water: Influence consumption through insights,
incentives & engagement
Solution template that integrates: Data from Smart
water meter, Smart electric meter and Smart phone for
a comprehensive and holistic approach to water and
energy consumption in a city
End User Value:
review consumption and understand trends
get alerted about animalies and potential leaks
compare consumptions with similar households
Utility and City value
monitoring of aggregate consumptions
monitoring spatial and temporal anomalies/changes and locate
wastage
demand forecasts and evaluate usage for pricing policies
cross-silo services for better decision support and resource
optimizatimization
Results
Well informed users can reduce consumption by 10-20% with
minimal impact on their comfort level
© 2012 IBM Corporation
17. IBM Italia S.p.A.
Distribution of
energy from
renewable sources
© 2012 IBM Corporation
18. IBM Italia S.p.A.
GridWise Olympic Peninsula Project
Participants used web portal to record their temperature preferences. The utility used this
info to control the thermostats in the participants’ homes linking them to an optimize
exploitation of renewable energy availability
Over 1 year 10% reduction in customer’s electric bills and 15% reduction in peak grid
loads
© 2012 IBM Corporation
19. IBM Italia S.p.A.
Who is Involved in the Project?
Utilities (15 sub-project locations, 8 sites in Washington):
– Avista Utilities (3 sites at Pullman, WA)
– Benton PUD (Kennewick, WA)
– City of Ellensburg (Ellensburg Renewable Energy Park, WA)
– Flathead Electric Coop., Inc. (Kalispell and Libby areas)
– Idaho Falls Power (2 sites in Idaho Falls, ID)
– Inland Power & Light (Airway Heights, WA)
– Lower Valley Energy (western WY)
– Milton-Freewater City Light & Power (Milton-Freewater, OR)
– NorthWestern Energy (Helena and Philipsburg area, MT)
– Peninsula Light & Power (Fox Island, WA)
– Portland General Electric (Salem, OR)
– Seattle City Light (University of Washington, Seattle campus)
© 2012 IBM Corporation
20. IBM Italia S.p.A.
Italia: SmartGrid per la distribuzione di energia da fonti rinnovabili
“Urban Command Center”
per fornire alla PA le informazioni necessarie
ICT “Service Hub” per la pianificazione energetica
per raccolta ed elaborazione Energy Box e BEMs
informazioni energetiche per abilitazione Active Demand
Soluzioni ICT e sensoristiche per
gestione ottimizzata
Smart Grids distretto energetico
per ottimizzazione con Solar Cooling
flussi energetici
e RES
20 © 2012 IBM Corporation
21. IBM Italia S.p.A.
Urban Command Center: IBM Intelligent Operations Center for Smarter
Cities
The Smart City model needs an integrated
view of all that City realities (energy, traffic,
health, security, etc.)
Leverage information across all IBM Intelligent
Intelligent
Operations
Operations
city agencies and departments Center
Center
Anticipate problems and minimize for Smarter Cities
the impact of disruptions
Coordinate resources to respond
to issues rapidly and effectively
Sample Partner Ecosystem
Enables leaders to incorporate
third-party solutions
© 2012 IBM Corporation
22. IBM Italia S.p.A.
Innovative leadership in Rio de Janeiro transformed city operations
Initial focus - prevent deaths from
annual flooding
Expanded to manage all emergency response
situations
Analyzes weather, energy, building,
transportation, & water data in real-time
Nationwide adoption in advance of Olympics
and World Cup
Increasing efficiency in resource deployment, expanding early warnings
to 48 hours, and coordinating all agencies in response
© 2012 IBM Corporation