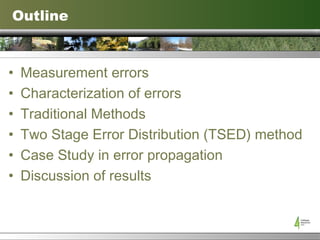
Error Propagation in Forest Planning Models Karl R. Walters and Sean J. Canavan
Outline Measurement errors Characterization of errors Traditional Methods Two Stage Error Distribution (TSED) method Case Study in error propagation Discussion of results
Measurement Error (ME) in Forestry Arises when there is a difference between observed and actual value for an attribute Sampling error (only portion of population measured) Grouping error (model calibrated to one level of precision and then applied to a different one) Mensuration error (a flaw in the measurement process)
Measurement Error (ME) in Forestry Demonstrated Consequences: Biased estimates of tree and stand attributes Biased model parameters and predictions Decreased precision of model predictions Heteroskedastic prediction errors Skewed distributions Biased fit statistics
Measurement Error (ME) in Forestry Distribution of errors provides the means for evaluation and possible correction methods Specified by either: Probability distribution function (PDF) or, Cumulative distribution function (CDF)
Normal (0,1) PDF x 0 0.05 0.1 0.15 0.2 0.25 0.3 0.35 0.4 0.45 -5 -4 -3 -2 -1 0 1 2 3 4 5 f(x)
Normal (O,1) CDF x 0 0.1 0.2 0.3 0.4 0.5 0.6 0.7 0.8 0.9 1 -5 -4 -3 -2 -1 0 1 2 3 4 5 F(x) = P(X < x)
Traditional Methods Errors assumed to be normally distributed Assume  μ ( δ x )  = 0 Assume  μ ( δ x )  = constant other than 0 Assume  μ ( δ x )  = f(x) In turn each of these separated by Assume  σ ( δ x )  = constant Assume  σ ( δ x )  = variable
Traditional Methods Unbiased error doesn’t necessarily average out Basal area example 20 cm tree, 314.16 cm 2 0.5 over, 330.06 cm 2 0.5 under, 298.65 cm 2 Average = 314.56 cm 2 Normal easy to model Is it appropriate choice?
Normal (O,1) CDF x 0 0.1 0.2 0.3 0.4 0.5 0.6 0.7 0.8 0.9 1 -5 -4 -3 -2 -1 0 1 2 3 4 5 F(x) = P(X < x)
Fitted CDF Equation 0.00 0.20 0.40 0.60 0.80 1.00 -1.5 -1 -0.5 0 0.5 1 1.5 Error Size Cumulative Probability  Pr(   = 0)  Pr(   < 0)  Pr(   > 0) P(X =  x ) =  Pr(   < 0)*Negative Error CDF     < 0 Pr(   < 0) + Pr(   = 0)     = 0 Pr(   < 0) + Pr(   = 0) + Pr(   > 0)*Positive Error CDF      > 0
Fits of Error Type Probabilities 0% 10% 20% 30% 40% 50% 60% 70% 80% 90% 100% 0.5 2 4 6 8 10 12 14 16 18 20 22 24 26 28 30 32 34 36 38 40 42 44 46 Dbh (inches) Probability P(e > 0) P(e = 0) P(e < 0)
Empirical Dbh Error CDF Surface Cumulative Probability Dbh (inches) Error (inches) 0.25 0.50 0.75 1.00 0.0 20.0 30.0 40.0 -0.6 0.0 0.6 1.2 1.8 10.0
Fitted Dbh CDF Surface
Forest Modeling Experiment Inventory data (tree lists) from PNW covering a range of forest types Apply corrections to measured dbh and ht derived from TSED analysis None, dbh only, ht only, dbh & ht Project growth through Organon Use yield tables in mock forest planning exercise for a TIMO client
Example Forest Southwest Washington 69,000+ ac Species group(8), site (3),BA(4),stocking(3) Elevation(3),slope(3), operability(2) Regen(2spX2dens), PCT(4), fert, CT(2), prune
Model Parameters NPV maximization (pseudo-delivered price) Delivered prices for 10 products Average logging costs ($/mbf) by equipment type, average hauling cost ($/mbf) Road const & maint ($/mbf), sev. taxes ($/mbf) 5-yr planning periods 30 period planning horizon
Unconstrained Any differences between the four runs are due to yield coefficients Not confounded by constraints
Unconstrained Initial Inventory Dbh_err 14.7% high Others < 0.2% high All periods Dbh_err maintains differential
Unconstrained Period 1 Harvest Dbh_err 5.05% high Others < 0.76% high
Unconstrained 4,838,760  5,142,948  4,925,347  5,180,696  Total Harvest 33,076  32,206  33,355  28,352  HW saw logs 4,403  4,275  4,428  4,333  RC saw logs 18,073  16,731  47,399  16,736  WW oversize logs 591,469  613,119  615,886  606,089  WW saw logs 224,367  220,707  232,815  221,610  DF oversize logs 3,467,413  3,756,908  3,480,189  3,795,724  DF saw logs 499,959  499,000  511,276  507,851  DF export logs Dbh_Ht Err  Ht_Err  Dbh_Err  Clean  50 Year Summary
Unconstrained Period 1 regeneration Clean plants significantly more ac to DF 550 tpa Period 1 PCT Clean performs significantly more PCT Only 450tpa PCT Others use 537tpa also
Unconstrained 36,766  36,144  36,423  35,213  commercial thin 49  19  49  -  precomm thin 537tpa 36  -  19  266  precomm thin 436tpa -  -  -  -  precomm thin 360tpa -  -  -  -  precomm thin 300tpa 18,142  18,142  18,142  17,039  slashing -  -  -  -  planted NF 680tpa 5,656  5,656  5,656  5,108  planted NF 550tpa 19,381  20,504  19,381  30,342  planted DF 550tpa 30,912  29,820  30,850  19,586  planted DF 450tpa 55,948  55,980  55,886  55,036  clearcut Dbh_Ht Err  Ht_Err  Dbh_Err  Clean  50 Year Summary
Nondeclining yield Nondeclining yield constraint on total sawlog Smooths volume and revenue spikes
Nondeclining Yield Inventory Dbh Err usually has highest inventory Dbh_Ht Err usually lowest
Nondeclining Yield Period 1 Harvest Dbh Err 0.5% lower Ht Err 1.8% higher Dbh_Ht Err 2.7% lower Period 9 Harvest Dbh Err 7.6% lower Ht Err 8.1% higher Dbh_Ht Err 0.7% higher
Nondeclining Yield 3,498,616  3,624,749  3,561,097  3,654,132  Total Harvest 35,169  33,695  34,992  33,844  HW saw logs 5,815  5,767  6,181  6,099  RC saw logs 27,815  27,137  57,946  27,880  WW oversize logs 798,669  803,591  819,808  824,113  WW saw logs 351,540  316,824  352,489  322,816  DF oversize logs 1,636,676  1,764,109  1,631,819  1,761,552  DF saw logs 642,932  673,628  657,862  677,828  DF export logs Dbh_Ht Err  Ht_Err  Dbh_Err  Clean  50 Year Summary
Nondeclining Yield Period 1 regeneration Only plants DF Densities chosen relatively consistent Period 1 PCT Dbh_Ht_err significantly more acres, all densities Clean is about half acres Ht_err is mostly 450tpa
Nondeclining Yield 22,493  21,884  21,600  21,368  commercial thin 228  19  1941  -  precomm thin 537tpa 537  -  367  266  precomm thin 436tpa 161  256  -  716  precomm thin 360tpa 74  56  105  56  precomm thin 300tpa 18,142  17,094  17,145  17,094  slashing -  -  -  -  planted NF 680tpa 5,019  5,019  5,019  5,019  planted NF 550tpa 18,704  21,878  16,636 20,809  planted DF 550tpa 21,085  17,931 23,117  18,978  planted DF 450tpa 44,808  44,828  44,772  44,806  clearcut Dbh_Ht Err  Ht_Err  Dbh_Err  Clean  50 Year Summary
Discussion Initial inventory off by as much as 14.7% Nightmare scenario in acquisition due diligence Unconstrained runs show similar results but Clean run did more PCT than others Clean run used equal densities of DF Clean produced more sawlog over 50 yrs
Discussion Flow constraint created bigger differences Significant differences in total volume and in product composition Significant differences in silvicultural regimes chosen
Discussion Measurement errors Conventional wisdom assumes MEs cancel out over the long run…  NOT TRUE!!! Effects are apparent immediately Not limited to small, consistent variation Can pronounce differences in merchandising Log length is becoming the dominant parameter in price determination
Discussion Optimization models can amplify ME effects Sensitive to prices tied to yields Tries to capitalize on erroneous differences in yield to maximize revenue Inappropriate silvicultural regimes chosen Not only objective function is changed Timing and activities also changed Plan is off-track and analysis becomes suspect
Thank you. Any questions?

Error Propagation in Forest Planning Models

  • 1.
    Error Propagation inForest Planning Models Karl R. Walters and Sean J. Canavan
  • 2.
    Outline Measurement errorsCharacterization of errors Traditional Methods Two Stage Error Distribution (TSED) method Case Study in error propagation Discussion of results
  • 3.
    Measurement Error (ME)in Forestry Arises when there is a difference between observed and actual value for an attribute Sampling error (only portion of population measured) Grouping error (model calibrated to one level of precision and then applied to a different one) Mensuration error (a flaw in the measurement process)
  • 4.
    Measurement Error (ME)in Forestry Demonstrated Consequences: Biased estimates of tree and stand attributes Biased model parameters and predictions Decreased precision of model predictions Heteroskedastic prediction errors Skewed distributions Biased fit statistics
  • 5.
    Measurement Error (ME)in Forestry Distribution of errors provides the means for evaluation and possible correction methods Specified by either: Probability distribution function (PDF) or, Cumulative distribution function (CDF)
  • 6.
    Normal (0,1) PDFx 0 0.05 0.1 0.15 0.2 0.25 0.3 0.35 0.4 0.45 -5 -4 -3 -2 -1 0 1 2 3 4 5 f(x)
  • 7.
    Normal (O,1) CDFx 0 0.1 0.2 0.3 0.4 0.5 0.6 0.7 0.8 0.9 1 -5 -4 -3 -2 -1 0 1 2 3 4 5 F(x) = P(X < x)
  • 8.
    Traditional Methods Errorsassumed to be normally distributed Assume μ ( δ x ) = 0 Assume μ ( δ x ) = constant other than 0 Assume μ ( δ x ) = f(x) In turn each of these separated by Assume σ ( δ x ) = constant Assume σ ( δ x ) = variable
  • 9.
    Traditional Methods Unbiasederror doesn’t necessarily average out Basal area example 20 cm tree, 314.16 cm 2 0.5 over, 330.06 cm 2 0.5 under, 298.65 cm 2 Average = 314.56 cm 2 Normal easy to model Is it appropriate choice?
  • 10.
    Normal (O,1) CDFx 0 0.1 0.2 0.3 0.4 0.5 0.6 0.7 0.8 0.9 1 -5 -4 -3 -2 -1 0 1 2 3 4 5 F(x) = P(X < x)
  • 11.
    Fitted CDF Equation0.00 0.20 0.40 0.60 0.80 1.00 -1.5 -1 -0.5 0 0.5 1 1.5 Error Size Cumulative Probability  Pr(  = 0)  Pr(  < 0)  Pr(  > 0) P(X = x ) = Pr(  < 0)*Negative Error CDF  < 0 Pr(  < 0) + Pr(  = 0)  = 0 Pr(  < 0) + Pr(  = 0) + Pr(  > 0)*Positive Error CDF  > 0
  • 12.
    Fits of ErrorType Probabilities 0% 10% 20% 30% 40% 50% 60% 70% 80% 90% 100% 0.5 2 4 6 8 10 12 14 16 18 20 22 24 26 28 30 32 34 36 38 40 42 44 46 Dbh (inches) Probability P(e > 0) P(e = 0) P(e < 0)
  • 13.
    Empirical Dbh ErrorCDF Surface Cumulative Probability Dbh (inches) Error (inches) 0.25 0.50 0.75 1.00 0.0 20.0 30.0 40.0 -0.6 0.0 0.6 1.2 1.8 10.0
  • 14.
  • 15.
    Forest Modeling ExperimentInventory data (tree lists) from PNW covering a range of forest types Apply corrections to measured dbh and ht derived from TSED analysis None, dbh only, ht only, dbh & ht Project growth through Organon Use yield tables in mock forest planning exercise for a TIMO client
  • 16.
    Example Forest SouthwestWashington 69,000+ ac Species group(8), site (3),BA(4),stocking(3) Elevation(3),slope(3), operability(2) Regen(2spX2dens), PCT(4), fert, CT(2), prune
  • 17.
    Model Parameters NPVmaximization (pseudo-delivered price) Delivered prices for 10 products Average logging costs ($/mbf) by equipment type, average hauling cost ($/mbf) Road const & maint ($/mbf), sev. taxes ($/mbf) 5-yr planning periods 30 period planning horizon
  • 18.
    Unconstrained Any differencesbetween the four runs are due to yield coefficients Not confounded by constraints
  • 19.
    Unconstrained Initial InventoryDbh_err 14.7% high Others < 0.2% high All periods Dbh_err maintains differential
  • 20.
    Unconstrained Period 1Harvest Dbh_err 5.05% high Others < 0.76% high
  • 21.
    Unconstrained 4,838,760 5,142,948 4,925,347 5,180,696 Total Harvest 33,076 32,206 33,355 28,352 HW saw logs 4,403 4,275 4,428 4,333 RC saw logs 18,073 16,731 47,399 16,736 WW oversize logs 591,469 613,119 615,886 606,089 WW saw logs 224,367 220,707 232,815 221,610 DF oversize logs 3,467,413 3,756,908 3,480,189 3,795,724 DF saw logs 499,959 499,000 511,276 507,851 DF export logs Dbh_Ht Err Ht_Err Dbh_Err Clean 50 Year Summary
  • 22.
    Unconstrained Period 1regeneration Clean plants significantly more ac to DF 550 tpa Period 1 PCT Clean performs significantly more PCT Only 450tpa PCT Others use 537tpa also
  • 23.
    Unconstrained 36,766 36,144 36,423 35,213 commercial thin 49 19 49 - precomm thin 537tpa 36 - 19 266 precomm thin 436tpa - - - - precomm thin 360tpa - - - - precomm thin 300tpa 18,142 18,142 18,142 17,039 slashing - - - - planted NF 680tpa 5,656 5,656 5,656 5,108 planted NF 550tpa 19,381 20,504 19,381 30,342 planted DF 550tpa 30,912 29,820 30,850 19,586 planted DF 450tpa 55,948 55,980 55,886 55,036 clearcut Dbh_Ht Err Ht_Err Dbh_Err Clean 50 Year Summary
  • 24.
    Nondeclining yield Nondecliningyield constraint on total sawlog Smooths volume and revenue spikes
  • 25.
    Nondeclining Yield InventoryDbh Err usually has highest inventory Dbh_Ht Err usually lowest
  • 26.
    Nondeclining Yield Period1 Harvest Dbh Err 0.5% lower Ht Err 1.8% higher Dbh_Ht Err 2.7% lower Period 9 Harvest Dbh Err 7.6% lower Ht Err 8.1% higher Dbh_Ht Err 0.7% higher
  • 27.
    Nondeclining Yield 3,498,616 3,624,749 3,561,097 3,654,132 Total Harvest 35,169 33,695 34,992 33,844 HW saw logs 5,815 5,767 6,181 6,099 RC saw logs 27,815 27,137 57,946 27,880 WW oversize logs 798,669 803,591 819,808 824,113 WW saw logs 351,540 316,824 352,489 322,816 DF oversize logs 1,636,676 1,764,109 1,631,819 1,761,552 DF saw logs 642,932 673,628 657,862 677,828 DF export logs Dbh_Ht Err Ht_Err Dbh_Err Clean 50 Year Summary
  • 28.
    Nondeclining Yield Period1 regeneration Only plants DF Densities chosen relatively consistent Period 1 PCT Dbh_Ht_err significantly more acres, all densities Clean is about half acres Ht_err is mostly 450tpa
  • 29.
    Nondeclining Yield 22,493 21,884 21,600 21,368 commercial thin 228 19 1941 - precomm thin 537tpa 537 - 367 266 precomm thin 436tpa 161 256 - 716 precomm thin 360tpa 74 56 105 56 precomm thin 300tpa 18,142 17,094 17,145 17,094 slashing - - - - planted NF 680tpa 5,019 5,019 5,019 5,019 planted NF 550tpa 18,704 21,878 16,636 20,809 planted DF 550tpa 21,085 17,931 23,117 18,978 planted DF 450tpa 44,808 44,828 44,772 44,806 clearcut Dbh_Ht Err Ht_Err Dbh_Err Clean 50 Year Summary
  • 30.
    Discussion Initial inventoryoff by as much as 14.7% Nightmare scenario in acquisition due diligence Unconstrained runs show similar results but Clean run did more PCT than others Clean run used equal densities of DF Clean produced more sawlog over 50 yrs
  • 31.
    Discussion Flow constraintcreated bigger differences Significant differences in total volume and in product composition Significant differences in silvicultural regimes chosen
  • 32.
    Discussion Measurement errorsConventional wisdom assumes MEs cancel out over the long run… NOT TRUE!!! Effects are apparent immediately Not limited to small, consistent variation Can pronounce differences in merchandising Log length is becoming the dominant parameter in price determination
  • 33.
    Discussion Optimization modelscan amplify ME effects Sensitive to prices tied to yields Tries to capitalize on erroneous differences in yield to maximize revenue Inappropriate silvicultural regimes chosen Not only objective function is changed Timing and activities also changed Plan is off-track and analysis becomes suspect
  • 34.
    Thank you. Anyquestions?