

![Literature Survey
Infrared (IR) radiation is a type of electromagnetic radiation. Infrared light has a longer wavelength than visible light. The infrared has a wavelength of 750 nm to 100 μm. The infrared radiation is invisible to humans but we can feel it as heat. According to the thesis ‘Pyroelectric Infrared (PIR) Sensor Based Event Detection’ by Emin Birey Soyer[2], Pyroelectricity is the ability of certain materials to generate a temporary electrical potential when they are heated or cooled. These changes in the heat are produced when a warm/hot bodied object passes by those materials. Hence PIRs can be used for motion detection. PIR sensor is an electronic device that generates an electric charge when exposed to infrared radiation. As the name implies this sensor is made of pyroelectric materials such as crystals. When the amount of infrared radiation that is striking to the crystal changes, the amount of charge also changes. This charge is sensed and converted to a voltage level via a FET transistor that is build inside the sensor. The sensor is sensitive over a wide spectrum. A Fresnel lens attached to the PIR improves the field of vision for detection. A Fresnel lens is a plano convex lens that has been collapsed on itself to form a at lens that retains its optical characteristics but is much smaller in thickness and therefore has less absorption loss. The Fresnel lens is made of an infrared transmitting material that has an IR transmission range of 8 μm to 14 μm that is most sensitive to human body radiation. Another issue of a Fresnel lens is the pattern. The pattern affects the performance of the sensor directly. In order to increase the performance and coverage, different geometries are applied.
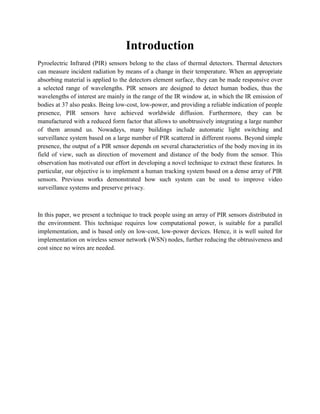
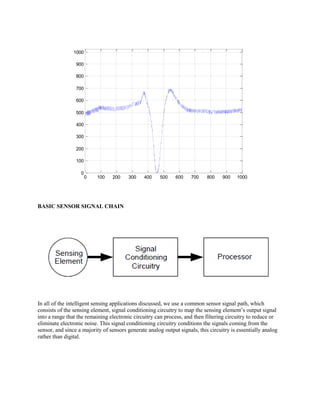
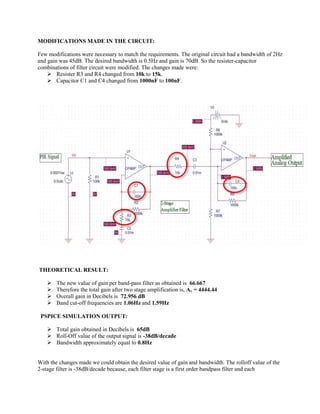
We first studied the result on analogue output of the PIR when a warm object was waved in front of the PIR. An oscilloscope was used in the mentioned process, and we could detect faint impulses generated by the sensor. The output was in terms of millivolts and thus the choice of an oscilloscope instead of a digital multimeter. Also we could observe the shape of the response generated, vaguely. We checked the PIR output with and without the Fresnel lens, and the range was a little markedly increased with its use
Since PIR sensor's output is very low, it should be well amplified. For processing and utilization of a PIR output in a microcontroller, amplification is necessary. A suggested gain of around 10000 would suffice microcontroller’s utilization. Because there is a high gain, amplifiers with band-pass characteristics are used. The output of a PIR sensor has a low frequency tendency around DC to 10Hz. So the frequency response of the amplifier block tends to remove or reduce the high frequency components while amplifying the interested frequency band in the output signal of a PIR.
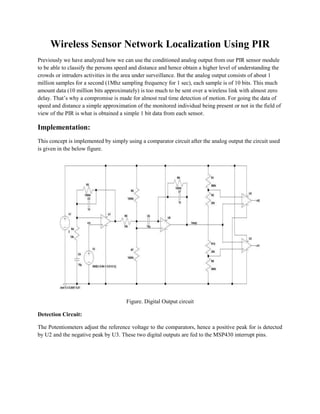
We used active band pass filters for amplification and band limiting. A cascaded filter circuitry was essential in getting a high gain. A good amplification implies that the microcontroller can effectively use its Analogue-Digital conversion for signal processing and a good band limitation implies increased sensitivity. This way ambient noise could be eliminated. We tried two different amplifications and two different bandwidths. The circuit with more amplification, of the two and lesser bandwidth was found to be more viable.](https://image.slidesharecdn.com/undergradthesis-141019163506-conversion-gate02/85/Undergrad-thesis-Vivekananda-S-8-320.jpg)
![PIRs can be used for three purposes:
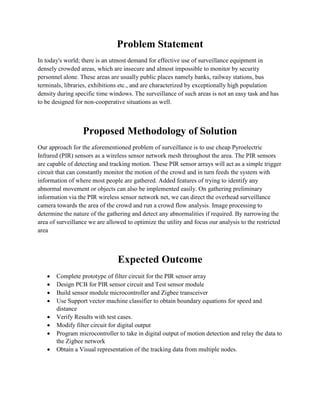
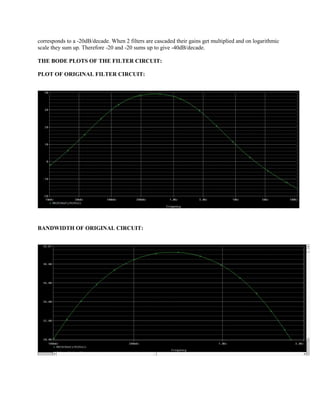
Direction of movement: In the presence of a single lens, the passage of a body results in a PIR output signal made up of two peaks, one positive and one negative. The reason is that the sensing elements detect the body in sequence. Being placed in series with opposite polarization each of them causes a peak with different direction.
Distance of movement: The signal amplitude (calculated as the difference between the maximum and minimum value of the PIR output) is at a maximum for passages in the smaller distance.
Speed of movement: The signal duration (calculated as the time between the instant when the PIR output exceeds one of the two thresholds and the instant when it lies between the thresholds for some time) increases with decrease in speed.
We took many trials for various distances and different speeds. The acquired data was almost analogous to the features explained in the paper. A tabulation of all the collected data was made for further classification process.
Classification of distance and speed is possible when the above mentioned voltage difference and time difference can used as suitable parameters. Below mentioned are three suggested types of classification.
1) Naïve Bayes: The Naïve Bayes classifier is a simple probabilistic classifier based on Bayes theorem, and the assumption that input features are independent. Using the Bayes theorem, the classifier calculates the posterior probability of all classes given the input features. A decision rule selects the output class: in this paper, we assign the instance to the class with higher posterior probability.
2) -Nearest Neighbour (k-NN): -NN, given a set of reference instances, classifies a new pattern as the one most represented among the closer ones [26]. -NN training phase is simply the collection of a set of reference instances from each class. The drawback of this approach is that its complexity and memory cost increase with reference dataset dimensions, which may be relatively large. Moreover, the accuracy of the algorithm can be severely limited by noisy training instances, especially if k is small (i.e., k=1).
3) Support Vector Machines: SVM belongs to the class of linear discriminant classifiers. Such classifiers use discriminant functions that are a combination (either linear or not linear) of the input vectors’ components. Geometrically, a discriminant function defines a hyperplane that separates two classes. Several solutions have been proposed to deal also with non-separable data. The SVM use a set of kernel functions to pre-process the input vectors and represent them in a higher dimensional space where they can be separated more easily. The training phase looks for the support vectors, which are the (transformed) training instances closer to the separating hyperplanes and are used to build the hyperplanes for the classification.
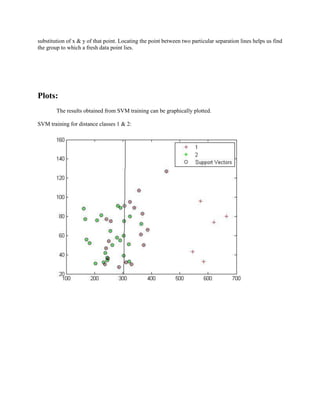
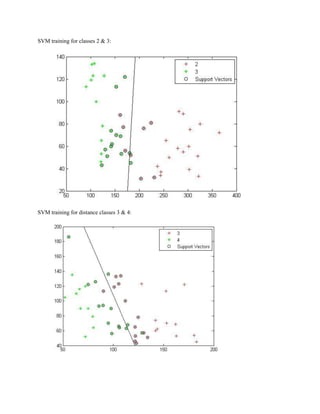
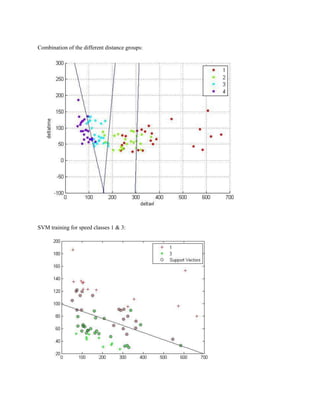
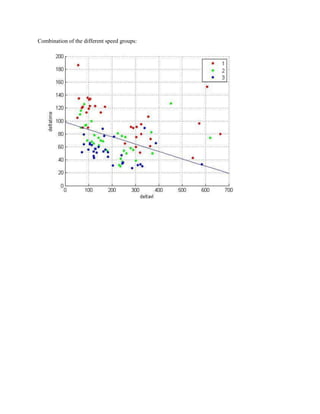
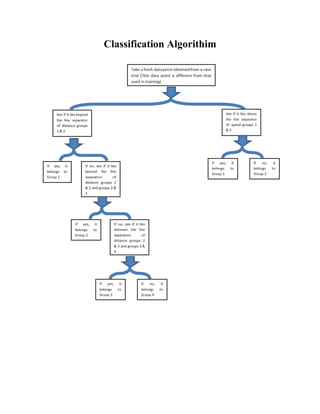
We tried k-NN and Naïve Bayes classification initially in the intent of performing dynamic learning. The separate domains after training were not very well demarcated as it is a probabilistic process. Hence SVM was used, owing to its linearity and simple classification data for fresh data points. Here different domains are separated by straight lines, which make classification lucid enough for a microcontroller](https://image.slidesharecdn.com/undergradthesis-141019163506-conversion-gate02/85/Undergrad-thesis-Vivekananda-S-9-320.jpg)

![Conclusion
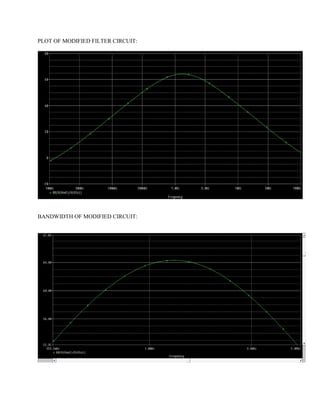
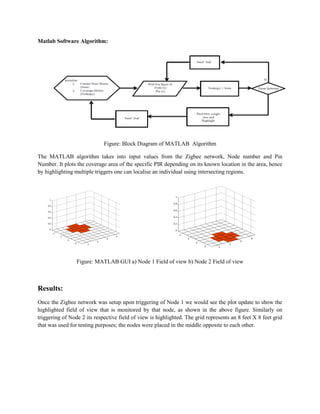
Our project aims to use a simple passive sensor like the pyroelectric infrared sensor and implement an entire system for tracking, locating and verifying movements of human beings. We were able to start with a simple amplified and band passed analog signal extraction from the PIR. We then verified the results of [1] , where the effects of distance and direction were observed on the analog signal. We used K-nearest neighbor, Bayes and Support Vector Machine classifiers to extract and classify the information of speed and distance of the individual. By using the SVM linear boundaries were defined between each class and equations were used to simply verify which class a new test case belongs to. This allowed us to reduce the memory requirement on the sensor node side and hence allow us to greatly reduce the load on the network.
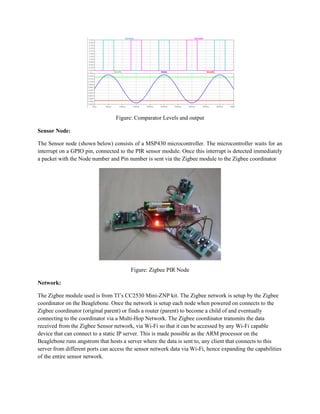
For real time and low cost sensor network we fed the analog signal to a digital output giving rise to a 1 bit digital signal to indicate the presence or absence of motion of a human being. By using multiple PIR’s in an array we can use this simple 1 bit data to track the movements of an individual to certain extent, the more number of sensors the more accurate our results. For the sensor network we used a Multi-Hop Zigbee network which then fed the data to a Wi-Fi server on an ARM processor this allowed us to extend the range of the Sensor network from the base station as well as allow multiple off the shelf devices like phones and laptops to interface with the Zigbee network. The data obtained was then plotted on a MATLAB generated grid that in practice would be overlaid over the area monitored, this would allow us to visualize the triggers and detections of an individual in the area.](https://image.slidesharecdn.com/undergradthesis-141019163506-conversion-gate02/85/Undergrad-thesis-Vivekananda-S-32-320.jpg)
![References
[1] Piero Zappi, Elisabetta Farella, and Luca Benini,” Tracking Motion Direction and Distance
With Pyroelectric IR Sensors”, IEEE Sensors Journal, VOL. 10, NO. 9, September 2010
[2]Emin Birey Soyer, “PIR sensor based event detection ” a thesis submitted to the Department of Electrical and Electronics Engineering and the institute of engineering and sciences of Bilkent University in partial fulfilment of the requirements for the Degree of Master of Science, July 2009
[3]R. Cucchiara, A. Prati, R. Vezzani, L. Benini, E. Farella, and P. Zappi, “Using a wireless sensor network to enhance video surveillance,” J. Ubiquitous Comput. Intell. (JUCI), vol. 1, pp. 1–11, 2006.
[4] U. Gopinathan, D. Brady, and N. Pitsianis, “Coded apertures for efficient pyroelectric motion tracking,” Opt. Exp., vol. 11, no. 18, pp. 2142–2152, 2003.
[5] Q. Hao, D. Brady, B. Guenther, J. Burchett, M. Shankar, and S. Feller, “Human tracking with wireless distributed pyroelectric sensors,” IEEE Sensors J., vol. 6, no. 6, pp. 1683–1696, Dec. 2006.
[6] M. Shankar, J. B. Burchett, Q. Hao, B. D. Guenther, and D. J. Brady, “Human-tracking systems using pyroelectric infrared detectors,” Opt. Eng., vol. 45, no. 10, pp. 106401-1–106401-10, 2006.
[7] N. Li and Q. Hao, “Multiple human tracking with wireless distributed pyro-electric sensors,” Proc. SPIE, vol. 6940, no. 1, pp. 694033-1–694033-12, 2008.](https://image.slidesharecdn.com/undergradthesis-141019163506-conversion-gate02/85/Undergrad-thesis-Vivekananda-S-33-320.jpg)


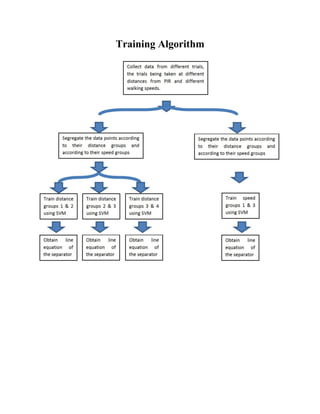
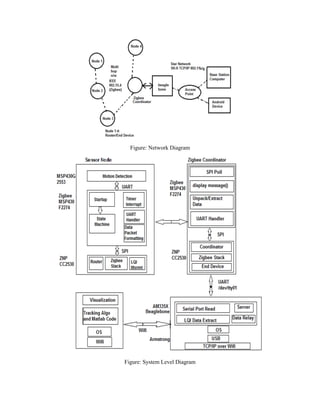
This document summarizes a project report on implementing a wireless sensor network for localization using pyroelectric infrared (PIR) sensors. The project aims to use analog output from the PIR sensors to determine the accurate location of individuals, as well as digital output to provide approximate localization. The analog output will undergo feature extraction and classification using a neural network to determine distance or speed. The digital output can detect presence or absence in the sensor field of view. A multi-hop Zigbee network will transmit the sensor data. The literature survey discusses PIR sensor functionality and previous work on using PIR sensor arrays for human tracking and video surveillance applications.


![Human presence detection based room light controller using pir2.pptx [repaired]](https://cdn.slidesharecdn.com/ss_thumbnails/humanpresencedetectionbasedroomlightcontrollerusingpir2-160418083434-thumbnail.jpg?width=640&height=640&fit=bounds)


