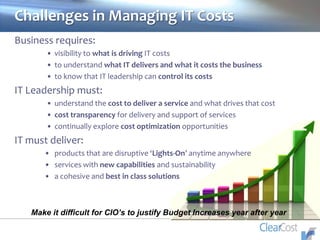
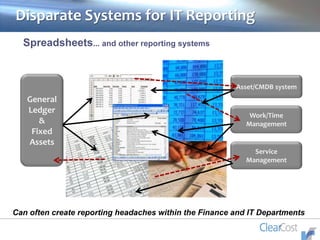
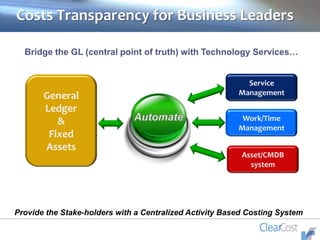
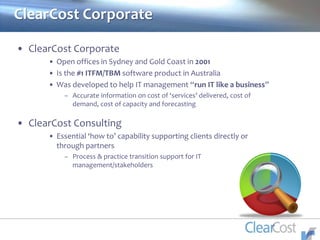
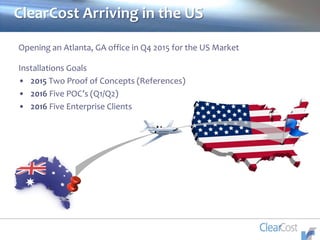
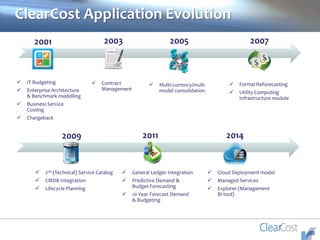
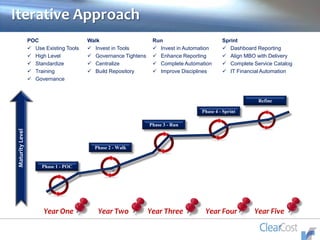
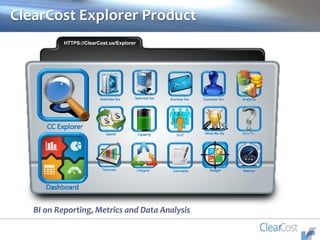
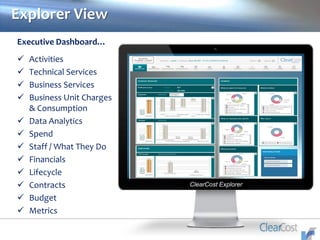
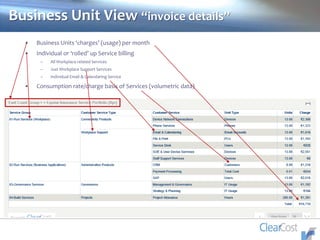
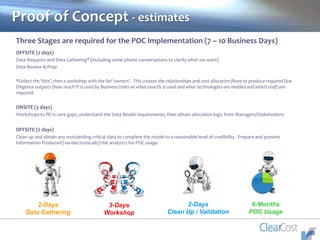
ClearCost Introduction
Version 7.2
About ClearCost2
Supporting the Needs of the Business1
Application Design3
Dashboards & Analytics4
Proof of Concept – Trail Package5
Pricing Matrix for the Enterprise6
Why Does IT Exist?
To support the technology requirements of the Business
Expansion of Infrastructure and Big Data
Application Dependencies
Provisioning ManagementWeb Services
Application ModelingNetwork Security
Network Management Server Management Router Network
Makes it more difficult to manage complex and disparate Infrastructures
Increase Demands in Data Protection
Place Security & Compliance initiatives in IT’s Top-10 priorities
Challenges in Managing IT Costs
Business requires:
• visibility to what is driving IT costs
• to understand what IT delivers and what it costs the business
• to know that IT leadership can control its costs
IT Leadership must:
• understand the cost to deliver a service and what drives that cost
• cost transparency for delivery and support of services
• continually explore cost optimization opportunities
IT must deliver:
• products that are disruptive ‘Lights-On’ anytime anywhere
• services with new capabilities and sustainability
• a cohesive and best in class solutions
Make it difficult for CIO’s to justify Budget Increases year after year
Disparate Systems for IT Reporting
General
Ledger
&
Fixed
Assets
Service
Management
Asset/CMDB system
Work/Time
Management
Spreadsheets... and other reporting systems
Can often create reporting headaches within the Finance and IT Departments
Costs Transparency for Business Leaders
General
Ledger
&
Fixed
Assets
Service
Management
Asset/CMDB
system
Work/Time
Management
Bridge the GL (central point of truth) with Technology Services…
Provide the Stake-holders with a Centralized Activity Based Costing System
• ClearCost Corporate
• Open offices in Sydney and Gold Coast in 2001
• Is the #1 ITFM/TBM software product in Australia
• Was developed to help IT management “run IT like a business”
– Accurate information on cost of ‘services’ delivered, cost of
demand, cost of capacity and forecasting
• ClearCost Consulting
• Essential ‘how to’ capability supporting clients directly or
through partners
– Process & practice transition support for IT
management/stakeholders
ClearCost Corporate
APAC Industries We’re In
 Federal Government
 State Government
 Territory/Local Government
 Water/Electricity Utilities
 Finance Sector
 Universities
 Research Institutes
 Media Sector
 Manufacturing
 Customer Services
 Environmental Services
ClearCost Arriving in the US
Opening an Atlanta, GA office in Q4 2015 for the US Market
Installations Goals
• 2015 Two Proof of Concepts (References)
• 2016 Five POC’s (Q1/Q2)
• 2016 Five Enterprise Clients
ClearCost Application Evolution
 IT Budgeting
 Enterprise Architecture
& Benchmark modelling
 Business Service
Costing
 Chargeback
 Contract
Management
 Multi-currency/multi
model consolidation
 Formal Reforecasting
 Utility Computing
Infrastructure module
 2nd (Technical) Service Catalog
 CMDB Integration
 Lifecycle Planning
 General Ledger Integration
 Predictive Demand &
Budget Forecasting
 10 Year Forecast Demand
& Budgeting
 Cloud Deployment model
 Managed Services
 Explorer (Management
BI tool)
2001 2003 2005 2007
2009 2011 2014
TECHNICAL
SERVICE
CATALOG
CUSTOMER
UNITS
ACTIVITIES &
COST POOLS
ACTIVITY
BASED
DRIVERS
CAPACITY
BASED
DRIVERS
DEMAND
BASED
DRIVERS
BUDGET
& ACTUALS
GL
CoA
BUSINESS
SERVICE
CATALOG
CAPACITY &
DEMAND
BASED
DRIVERS
Framework
What we
spend
What we do What we
deliver
Who uses
what
we deliver
Our Service
building
blocks
Every
resource
linked to
an activity
Every
Activity
linked to a
Technical
Service
Every
Service
linked to a
‘Customer’
Every
Technical
Service
linked to an
end-Service
ASSETS &
CAPACITY
CONTRACT
REGISTER
Year One Year Two Year Three Year Four Year Five
MaturityLevel
Iterative Approach
POC
 Use Existing Tools
 High Level
 Standardize
 Training
 Governance
Phase 1 - POC
Phase 2 - Walk
Phase 4 - Sprint
Phase 3 - Run
Walk
 Invest in Tools
 Governance Tightens
 Centralize
 Build Repository
Run
 Invest in Automation
 Enhance Reporting
 Complete Automation
 Improve Disciplines
Sprint
 Dashboard Reporting
 Align MBO with Delivery
 Complete Service Catalog
 IT Financial Automation
Refine
Business Unit Data Analytics
Business Management
IT Technical Managers
CIO & Executives
CFO & Finance
Service Managers
ClearCost Explorer Product
BI on Reporting, Metrics and Data Analysis
HTTPS://ClearCost.us/Explorer
ClearCost Explorer
Explorer View
Executive Dashboard…
 Activities
 Technical Services
 Business Services
 Business Unit Charges
& Consumption
 Data Analytics
 Spend
 Staff / What They Do
 Financials
 Lifecycle
 Contracts
 Budget
 Metrics
ClearCost Enterprise Product
Managing the Data and Meta Data Locally
Enterprise Application View
ClearCost Enterprise
Operational User Dashboard…
 Service Financials
 Expenses
 Activity
 Technical Services
 Customer Services
 Business Unit Usage
 Information Analysis
 Reports
 Charts
 Data Warehouse
 Trending
 Operations Functions
 Assets Capacity
 Contract Register
 Administration
 User Authorities
 Data Imports / Exports
Dashboard View
Business Services View “CRM”
• It costs $152 per Customer
per mth to automate
Customer Tracking
management
• Almost 20% of the
effort/cost is discretionary
• The General Ledger costs
contributing to the CRM
costs are profiled
• Most of the resources for
this are outsourced
• Most of the cost is related
to the application support
and enhancement
• We can ‘see’ the technical
dependencies from the
CMDB that drive
infrastructure costs
Business Unit View “invoice details”
• Business Units ‘charges’ (usage) per month
• Individual or ‘rolled’ up Service billing
– All Workplace related Services
– Just Workplace Support Services
– Individual Email & Calendaring Service
• Consumption rate/charge basis of Services (volumetric data)
Business Application Catalog View “services”
Chargeback / Show-back View “invoice”
Proof of Concept - estimates
Three Stages are required for the POC Implementation (7 – 10 Business Days)
OFFSITE (2 days)
Data Requests and Data Gathering* (including some phone conversations to clarify what we want)
Data Review & Prep
*Collect the ‘lists’, then a workshop with the list ‘owners’. This creates the relationships and cost allocation flows to produce required Due
Diligence outputs (how much IT is used by Business Units an what exactly is used and what technologies are needed and which staff are
required.
ONSITE (3 days)
Workshops to fill in core gaps, understand the Data Model requirements, then obtain allocation logic from Managers/Stakeholders
OFFSITE (2 days)
Clean up and obtain any outstanding critical data to complete the model to a reasonable level of credibility. Prepare and present
Information Produced (via electronically) the analytics for POC usage.
2-Days
Data Gathering
3-Days
Workshop
2-Days
Clean Up / Validation
6-Months
POC Usage
Data Gathering
Data Gathering (2 Days)
1. Budget details, included Staff and Contracts and Depreciation (if applicable):
2. Platform List (different server types i.e.; Solaris, Windows, ESX. Linux; databases – Oracle,
SQL Server, Postgres, etc…), plus asset details to a point
3. Application List (top 100 or whatever the target Business Units use)
4. Connect the dots, link platforms to Applications, link budget to platforms, link Services to
Business Units (ClearCost in a nutshell).
On-Site Workshops
Data Model ‘Build’ Methodology (3 Days)
A. Budget/Financial data
a. Budget (by Cost Centre & Account Code), Staff by Cost Centre
b. Actuals per G/L for YTD
c. Reforecast for remainder (optional)
d. Contracts (dedicated to in scope BU or shared across many)
B. Technologies
a. Platform List
b. Application List
c. Checklist of B(a) to B(b)
C. Business Units in scope counts
a. Business Units
b. Staff counts (for desktop & road warrior related services)
c. PC counts/AD Accounts
d. Map B(b) to C(a)
D. Assets
a. If dedicated to C(a)
b. If shared among BU’s
c. Map B(a) to D(a & b)
E. Depreciation (assuming technology comes with the deal)
a. Split by B(a)
b. Project depreciation?
Complete and Present the Model
Information Produced (2 Days)
Total spend on IT translated:
1. How much each Business Unit consumes
2. What each Business Service costs to deliver and what
Technical Services they are dependent on
3. How much is spent on specific technology platforms,
applications, governance, management and project
activities
4. What staff and external contracts underpin which
Technical Services through to which Business Services
POC Pricing Estimates
Estimated Cost
Remote request of information so we can work out gaps before coming onsite. Onsite we have concentration
of workshops to flush out more detail or do the allocation/linking. Then we finalize the model and produce
analytics. Pricing is based on POC Assumptions and any approved Change Management outlined in the
following two slides.
7 days x2 consultants = $40,000
Plus any approved travel expenses from / to Atlanta
License & Consulting Estimates
IT Budget $2m to $10m, with staff of 10-30
 $50k scope, 10-30 days for installation & training
IT Budget $10m to $30m, with staff of 30-100
 $90k scope, 45-60 days for installation & training
IT Budget $30m to $50m, with staff of 100-150
 $120k scope, 60-90 days for installation & training
IT Budget $50 to $100m, with staff of 150-250
 $160K scope, 90 days for installation & training
IT Budget $100-250m, with staff of 250-500
 $200K scope, 90-120 days for installation & training
IT Budget $250m+, with staff of 500-1,000+
 $300K+ scope, 120-150 days for installation & training
Consulting Efforts Include
As Defined in the Scope:
 IT operational (expense) budget
 Anything else (IT costs outside of IT)?
 Activity & Capacity model to be defined
 Use our quick start industry standard model
 IT Service Catalogue to be defined
 Quick Start Technical Catalog (structure & content)
 Business Catalog (structure)
 Sustainability Framework
 Advice/training to support this
 Demand profile defined
 Administrator Training
Out-of-the-Box Analytics
Standard Outputs:
 Defensible cost budgets linking the cost of supply to meet the budgeted demand
 Costed and priced Service Catalogues (including unit prices)
 Performance/Benchmark metrics across the full Service spectrum
 Infrastructure Capacity Rates - unit rates for Servers & Storage
 Chargeback (or Show-back) to Business Units
 Budget generation – multiple options (based on Demand, Current forecast,
predictive forecast, cost trends etc…)
 Contract Management, Lease management
 Re-forecasting & variance analysis (from finance (GL) to demand)
 Expense and demand Forecasting (up to 10 years)
Scope of Work Assumptions
Assumptions
 CLIENT will provide access to Subject Matter Experts (SMEs) and resources that are required for the IT assessment.
 CLIENT will coordinate access to business stakeholders that are required for the interview phases of this assessment.
 CLIENT will ensure requirements and other ClearCost deliverables are reviewed and signed-off in a timely manner by
employees of the appropriate level.
 CLIENT will provide ClearCost resources office space for staff as needed, including a phone and Internet connection (either
LAN or phone line), conference rooms for meetings/workshops, and access to building areas necessary to complete this
project.
 CLIENT will provide ClearCost consultants with timely access to technical information and environments.
 ClearCost is not responsible for any product that is not provided by or any task that is not performed by ClearCost
consultants.
 All Discovery and Planning work will be performed during normal business hours (8:00 am to 5:00 pm local time), Monday
through Friday, except holidays. Time and half will be charged for work performed after 5:00 pm if needed and approved.
 ClearCost shall commence work under this SOW on a mutually agreeable date after receipt of a fully executed SOW and PO,
if required.
 ClearCost reserves the right to use subcontractors in any role within the Service where ClearCost deems appropriate.
 The tasks and deliverables described in this SOW will be deemed accepted by CLIENT upon delivery.
 ClearCost reserves the right to terminate the contract with prior notice due to non-performance by CLIENT of
responsibilities stated above. All services fees and expenses incurred to the date of termination will be invoiced as occurred.
 If security clearances are required, CLIENT will coordinate all security clearances for ClearCost personnel prior to each
project engagement.
 In the event that Service is delayed, CLIENT will be responsible for payment of additional fees and out-of pocket costs
incurred by ClearCost.
Out of Scope Efforts
Change Control for Changes or Additions
Should project objectives or requirements exceed the defined deliverables identified in this Statement of Work, all parties will utilize the
Change Control process to refine additional time, cost, and schedule impact to meet proposed workloads/deliverables and time frames. As
such situations occur, each change will be documented, and if such change is deemed to alter the time required to complete the project or
its cost, the change will be acknowledged by both parties, and the cost and or time estimates updated accordingly by both parties’
acceptance. All noted changes must be formally accepted prior to executing the change.
Requirements, working papers, project plan documents, and Change Management Requests will be kept in accessible electronic location for
review.
Steve Middeldorp
Founder & CEO ClearCost
Sydney Australia
Phone +61.414.506.749
Steven.Middeldorp@ClearCostConsulting.com
Mark S. Mahre
Managing Partner ClearCost US
Atlanta Georgia
Phone +1.678.641.0390
Mark.Mahre@ClearCost.us
@Mahre11

ClearCost Introduction 2015

  • 1.
    ClearCost Introduction Version 7.2 AboutClearCost2 Supporting the Needs of the Business1 Application Design3 Dashboards & Analytics4 Proof of Concept – Trail Package5 Pricing Matrix for the Enterprise6
  • 2.
    Why Does ITExist? To support the technology requirements of the Business
  • 3.
    Expansion of Infrastructureand Big Data Application Dependencies Provisioning ManagementWeb Services Application ModelingNetwork Security Network Management Server Management Router Network Makes it more difficult to manage complex and disparate Infrastructures
  • 4.
    Increase Demands inData Protection Place Security & Compliance initiatives in IT’s Top-10 priorities
  • 5.
    Challenges in ManagingIT Costs Business requires: • visibility to what is driving IT costs • to understand what IT delivers and what it costs the business • to know that IT leadership can control its costs IT Leadership must: • understand the cost to deliver a service and what drives that cost • cost transparency for delivery and support of services • continually explore cost optimization opportunities IT must deliver: • products that are disruptive ‘Lights-On’ anytime anywhere • services with new capabilities and sustainability • a cohesive and best in class solutions Make it difficult for CIO’s to justify Budget Increases year after year
  • 6.
    Disparate Systems forIT Reporting General Ledger & Fixed Assets Service Management Asset/CMDB system Work/Time Management Spreadsheets... and other reporting systems Can often create reporting headaches within the Finance and IT Departments
  • 7.
    Costs Transparency forBusiness Leaders General Ledger & Fixed Assets Service Management Asset/CMDB system Work/Time Management Bridge the GL (central point of truth) with Technology Services… Provide the Stake-holders with a Centralized Activity Based Costing System
  • 8.
    • ClearCost Corporate •Open offices in Sydney and Gold Coast in 2001 • Is the #1 ITFM/TBM software product in Australia • Was developed to help IT management “run IT like a business” – Accurate information on cost of ‘services’ delivered, cost of demand, cost of capacity and forecasting • ClearCost Consulting • Essential ‘how to’ capability supporting clients directly or through partners – Process & practice transition support for IT management/stakeholders ClearCost Corporate
  • 9.
    APAC Industries We’reIn  Federal Government  State Government  Territory/Local Government  Water/Electricity Utilities  Finance Sector  Universities  Research Institutes  Media Sector  Manufacturing  Customer Services  Environmental Services
  • 10.
    ClearCost Arriving inthe US Opening an Atlanta, GA office in Q4 2015 for the US Market Installations Goals • 2015 Two Proof of Concepts (References) • 2016 Five POC’s (Q1/Q2) • 2016 Five Enterprise Clients
  • 11.
    ClearCost Application Evolution IT Budgeting  Enterprise Architecture & Benchmark modelling  Business Service Costing  Chargeback  Contract Management  Multi-currency/multi model consolidation  Formal Reforecasting  Utility Computing Infrastructure module  2nd (Technical) Service Catalog  CMDB Integration  Lifecycle Planning  General Ledger Integration  Predictive Demand & Budget Forecasting  10 Year Forecast Demand & Budgeting  Cloud Deployment model  Managed Services  Explorer (Management BI tool) 2001 2003 2005 2007 2009 2011 2014
  • 12.
    TECHNICAL SERVICE CATALOG CUSTOMER UNITS ACTIVITIES & COST POOLS ACTIVITY BASED DRIVERS CAPACITY BASED DRIVERS DEMAND BASED DRIVERS BUDGET &ACTUALS GL CoA BUSINESS SERVICE CATALOG CAPACITY & DEMAND BASED DRIVERS Framework What we spend What we do What we deliver Who uses what we deliver Our Service building blocks Every resource linked to an activity Every Activity linked to a Technical Service Every Service linked to a ‘Customer’ Every Technical Service linked to an end-Service ASSETS & CAPACITY CONTRACT REGISTER
  • 13.
    Year One YearTwo Year Three Year Four Year Five MaturityLevel Iterative Approach POC  Use Existing Tools  High Level  Standardize  Training  Governance Phase 1 - POC Phase 2 - Walk Phase 4 - Sprint Phase 3 - Run Walk  Invest in Tools  Governance Tightens  Centralize  Build Repository Run  Invest in Automation  Enhance Reporting  Complete Automation  Improve Disciplines Sprint  Dashboard Reporting  Align MBO with Delivery  Complete Service Catalog  IT Financial Automation Refine
  • 14.
    Business Unit DataAnalytics Business Management IT Technical Managers CIO & Executives CFO & Finance Service Managers
  • 15.
    ClearCost Explorer Product BIon Reporting, Metrics and Data Analysis HTTPS://ClearCost.us/Explorer
  • 16.
    ClearCost Explorer Explorer View ExecutiveDashboard…  Activities  Technical Services  Business Services  Business Unit Charges & Consumption  Data Analytics  Spend  Staff / What They Do  Financials  Lifecycle  Contracts  Budget  Metrics
  • 17.
    ClearCost Enterprise Product Managingthe Data and Meta Data Locally
  • 18.
    Enterprise Application View ClearCostEnterprise Operational User Dashboard…  Service Financials  Expenses  Activity  Technical Services  Customer Services  Business Unit Usage  Information Analysis  Reports  Charts  Data Warehouse  Trending  Operations Functions  Assets Capacity  Contract Register  Administration  User Authorities  Data Imports / Exports
  • 19.
  • 20.
    Business Services View“CRM” • It costs $152 per Customer per mth to automate Customer Tracking management • Almost 20% of the effort/cost is discretionary • The General Ledger costs contributing to the CRM costs are profiled • Most of the resources for this are outsourced • Most of the cost is related to the application support and enhancement • We can ‘see’ the technical dependencies from the CMDB that drive infrastructure costs
  • 21.
    Business Unit View“invoice details” • Business Units ‘charges’ (usage) per month • Individual or ‘rolled’ up Service billing – All Workplace related Services – Just Workplace Support Services – Individual Email & Calendaring Service • Consumption rate/charge basis of Services (volumetric data)
  • 22.
    Business Application CatalogView “services”
  • 23.
    Chargeback / Show-backView “invoice”
  • 24.
    Proof of Concept- estimates Three Stages are required for the POC Implementation (7 – 10 Business Days) OFFSITE (2 days) Data Requests and Data Gathering* (including some phone conversations to clarify what we want) Data Review & Prep *Collect the ‘lists’, then a workshop with the list ‘owners’. This creates the relationships and cost allocation flows to produce required Due Diligence outputs (how much IT is used by Business Units an what exactly is used and what technologies are needed and which staff are required. ONSITE (3 days) Workshops to fill in core gaps, understand the Data Model requirements, then obtain allocation logic from Managers/Stakeholders OFFSITE (2 days) Clean up and obtain any outstanding critical data to complete the model to a reasonable level of credibility. Prepare and present Information Produced (via electronically) the analytics for POC usage. 2-Days Data Gathering 3-Days Workshop 2-Days Clean Up / Validation 6-Months POC Usage
  • 25.
    Data Gathering Data Gathering(2 Days) 1. Budget details, included Staff and Contracts and Depreciation (if applicable): 2. Platform List (different server types i.e.; Solaris, Windows, ESX. Linux; databases – Oracle, SQL Server, Postgres, etc…), plus asset details to a point 3. Application List (top 100 or whatever the target Business Units use) 4. Connect the dots, link platforms to Applications, link budget to platforms, link Services to Business Units (ClearCost in a nutshell).
  • 26.
    On-Site Workshops Data Model‘Build’ Methodology (3 Days) A. Budget/Financial data a. Budget (by Cost Centre & Account Code), Staff by Cost Centre b. Actuals per G/L for YTD c. Reforecast for remainder (optional) d. Contracts (dedicated to in scope BU or shared across many) B. Technologies a. Platform List b. Application List c. Checklist of B(a) to B(b) C. Business Units in scope counts a. Business Units b. Staff counts (for desktop & road warrior related services) c. PC counts/AD Accounts d. Map B(b) to C(a) D. Assets a. If dedicated to C(a) b. If shared among BU’s c. Map B(a) to D(a & b) E. Depreciation (assuming technology comes with the deal) a. Split by B(a) b. Project depreciation?
  • 27.
    Complete and Presentthe Model Information Produced (2 Days) Total spend on IT translated: 1. How much each Business Unit consumes 2. What each Business Service costs to deliver and what Technical Services they are dependent on 3. How much is spent on specific technology platforms, applications, governance, management and project activities 4. What staff and external contracts underpin which Technical Services through to which Business Services
  • 28.
    POC Pricing Estimates EstimatedCost Remote request of information so we can work out gaps before coming onsite. Onsite we have concentration of workshops to flush out more detail or do the allocation/linking. Then we finalize the model and produce analytics. Pricing is based on POC Assumptions and any approved Change Management outlined in the following two slides. 7 days x2 consultants = $40,000 Plus any approved travel expenses from / to Atlanta
  • 29.
    License & ConsultingEstimates IT Budget $2m to $10m, with staff of 10-30  $50k scope, 10-30 days for installation & training IT Budget $10m to $30m, with staff of 30-100  $90k scope, 45-60 days for installation & training IT Budget $30m to $50m, with staff of 100-150  $120k scope, 60-90 days for installation & training IT Budget $50 to $100m, with staff of 150-250  $160K scope, 90 days for installation & training IT Budget $100-250m, with staff of 250-500  $200K scope, 90-120 days for installation & training IT Budget $250m+, with staff of 500-1,000+  $300K+ scope, 120-150 days for installation & training
  • 30.
    Consulting Efforts Include AsDefined in the Scope:  IT operational (expense) budget  Anything else (IT costs outside of IT)?  Activity & Capacity model to be defined  Use our quick start industry standard model  IT Service Catalogue to be defined  Quick Start Technical Catalog (structure & content)  Business Catalog (structure)  Sustainability Framework  Advice/training to support this  Demand profile defined  Administrator Training
  • 31.
    Out-of-the-Box Analytics Standard Outputs: Defensible cost budgets linking the cost of supply to meet the budgeted demand  Costed and priced Service Catalogues (including unit prices)  Performance/Benchmark metrics across the full Service spectrum  Infrastructure Capacity Rates - unit rates for Servers & Storage  Chargeback (or Show-back) to Business Units  Budget generation – multiple options (based on Demand, Current forecast, predictive forecast, cost trends etc…)  Contract Management, Lease management  Re-forecasting & variance analysis (from finance (GL) to demand)  Expense and demand Forecasting (up to 10 years)
  • 32.
    Scope of WorkAssumptions Assumptions  CLIENT will provide access to Subject Matter Experts (SMEs) and resources that are required for the IT assessment.  CLIENT will coordinate access to business stakeholders that are required for the interview phases of this assessment.  CLIENT will ensure requirements and other ClearCost deliverables are reviewed and signed-off in a timely manner by employees of the appropriate level.  CLIENT will provide ClearCost resources office space for staff as needed, including a phone and Internet connection (either LAN or phone line), conference rooms for meetings/workshops, and access to building areas necessary to complete this project.  CLIENT will provide ClearCost consultants with timely access to technical information and environments.  ClearCost is not responsible for any product that is not provided by or any task that is not performed by ClearCost consultants.  All Discovery and Planning work will be performed during normal business hours (8:00 am to 5:00 pm local time), Monday through Friday, except holidays. Time and half will be charged for work performed after 5:00 pm if needed and approved.  ClearCost shall commence work under this SOW on a mutually agreeable date after receipt of a fully executed SOW and PO, if required.  ClearCost reserves the right to use subcontractors in any role within the Service where ClearCost deems appropriate.  The tasks and deliverables described in this SOW will be deemed accepted by CLIENT upon delivery.  ClearCost reserves the right to terminate the contract with prior notice due to non-performance by CLIENT of responsibilities stated above. All services fees and expenses incurred to the date of termination will be invoiced as occurred.  If security clearances are required, CLIENT will coordinate all security clearances for ClearCost personnel prior to each project engagement.  In the event that Service is delayed, CLIENT will be responsible for payment of additional fees and out-of pocket costs incurred by ClearCost.
  • 33.
    Out of ScopeEfforts Change Control for Changes or Additions Should project objectives or requirements exceed the defined deliverables identified in this Statement of Work, all parties will utilize the Change Control process to refine additional time, cost, and schedule impact to meet proposed workloads/deliverables and time frames. As such situations occur, each change will be documented, and if such change is deemed to alter the time required to complete the project or its cost, the change will be acknowledged by both parties, and the cost and or time estimates updated accordingly by both parties’ acceptance. All noted changes must be formally accepted prior to executing the change. Requirements, working papers, project plan documents, and Change Management Requests will be kept in accessible electronic location for review.
  • 34.
    Steve Middeldorp Founder &CEO ClearCost Sydney Australia Phone +61.414.506.749 Steven.Middeldorp@ClearCostConsulting.com
  • 35.
    Mark S. Mahre ManagingPartner ClearCost US Atlanta Georgia Phone +1.678.641.0390 Mark.Mahre@ClearCost.us @Mahre11