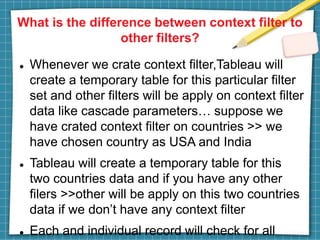
Tableau Interview
Questions & Answers
Hope Tutors
What is the difference between context filter to
other filters?
 Whenever we crate context filter,Tableau will
create a temporary table for this particular filter
set and other filters will be apply on context filter
data like cascade parameters… suppose we
have crated context filter on countries >> we
have chosen country as USA and India
 Tableau will create a temporary table for this
two countries data and if you have any other
filers >>other will be apply on this two countries
data if we don’t have any context filter
 Each and individual record will check for all
What is disadvantage of context filters?
 The context filter is not frequently changed by
the user – if the filter is changed the database
must recomputed and rewrite the temporary
table, slowing performance.
 When you set a dimension to context, Tableau
crates a temporary table that will require a
reload each time the view is initiated. For Excel,
Access and text data sources, the temporary
table created is in an Access table format. For
SQL Server, My SQL and Oracle data sources,
you must have permission to create a
What are the five main product offered by
Tableau company?
 Tableau offers five main products: Tableau
Desktop, Tableau Server, Tableau Online,
Tableau reader and Tableau Public.
What is data visualization?
 Data visualization refers to the techniques used
to communicate data or information by
encoding it as visual objects (e.g. points, lines
or bars) contained in graphics.
Why tableau?
 Whether your data is in an on-premise
database, a database, a data warehouse, a
cloud application or an Excel file, you can
analyze it with Tableau.
 You can create views of your data and share it
with colleagues, customers, and partners. You
can use Tableau to blend it with other data. And
you can keep your data up to date
automatically.
What is the difference between heat map
and tree map?
 A heat map is a great way to compare
categories using color and size. In this, you can
compare two different measures.
 Tree map is a very powerful visualization,
particularly for illustrating hierarchical (tree –
structured) data and part – to – whole
relationships.
What is blended axis?
 Multiple Measures are shown in single axis and
also all the marks shown in single pane
 Drag a dimension in a column
 Drag the first measure in column
 Drag 2nd measure in existing axis
 Us/multiplemeasures_blendedaxes.html
For More Check
Tableau Interview
Questions

Ui path interview questions

  • 1.
    Tableau Interview Questions &Answers Hope Tutors
  • 2.
    What is thedifference between context filter to other filters?  Whenever we crate context filter,Tableau will create a temporary table for this particular filter set and other filters will be apply on context filter data like cascade parameters… suppose we have crated context filter on countries >> we have chosen country as USA and India  Tableau will create a temporary table for this two countries data and if you have any other filers >>other will be apply on this two countries data if we don’t have any context filter  Each and individual record will check for all
  • 3.
    What is disadvantageof context filters?  The context filter is not frequently changed by the user – if the filter is changed the database must recomputed and rewrite the temporary table, slowing performance.  When you set a dimension to context, Tableau crates a temporary table that will require a reload each time the view is initiated. For Excel, Access and text data sources, the temporary table created is in an Access table format. For SQL Server, My SQL and Oracle data sources, you must have permission to create a
  • 4.
    What are thefive main product offered by Tableau company?  Tableau offers five main products: Tableau Desktop, Tableau Server, Tableau Online, Tableau reader and Tableau Public.
  • 5.
    What is datavisualization?  Data visualization refers to the techniques used to communicate data or information by encoding it as visual objects (e.g. points, lines or bars) contained in graphics.
  • 6.
    Why tableau?  Whetheryour data is in an on-premise database, a database, a data warehouse, a cloud application or an Excel file, you can analyze it with Tableau.  You can create views of your data and share it with colleagues, customers, and partners. You can use Tableau to blend it with other data. And you can keep your data up to date automatically.
  • 7.
    What is thedifference between heat map and tree map?  A heat map is a great way to compare categories using color and size. In this, you can compare two different measures.  Tree map is a very powerful visualization, particularly for illustrating hierarchical (tree – structured) data and part – to – whole relationships.
  • 8.
    What is blendedaxis?  Multiple Measures are shown in single axis and also all the marks shown in single pane  Drag a dimension in a column  Drag the first measure in column  Drag 2nd measure in existing axis  Us/multiplemeasures_blendedaxes.html
  • 9.
    For More Check TableauInterview Questions