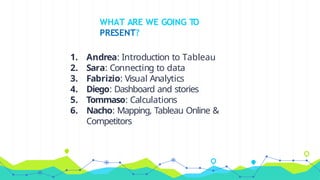
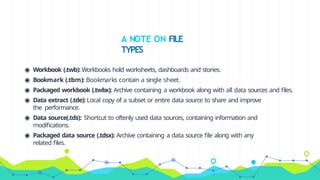
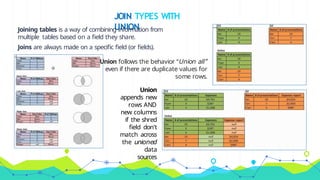
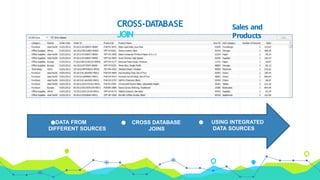
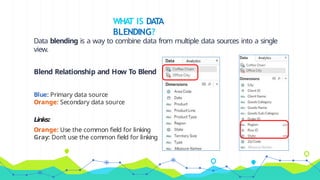
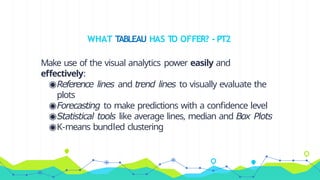
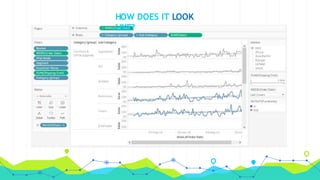
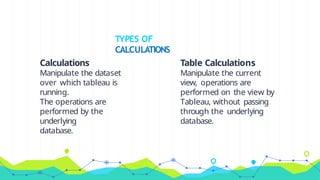
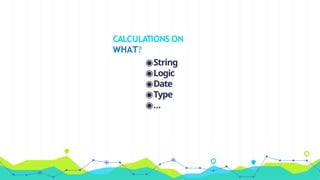
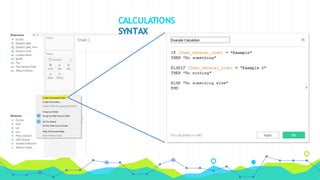
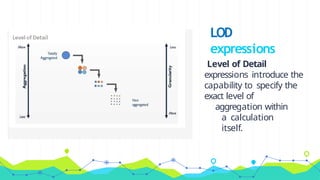
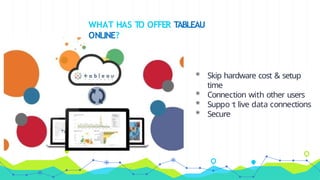
TABLEAU
MS in Engineering in Computer
Science
Data Mining
a.y. 2016-17
You can find us at:
● abissoli.ab@gmail.com
● dieguersc@gmail.com
● farinaccifabrizio@gmail.co
m
● ignacio.cplatas@gmail.com
● sara.cannoni92@gmai.com
● tommasodorsi@gmail.com
WHAT ARE WE GOING TO
PRESENT?
1. Andrea: Introduction to Tableau
2. Sara: Connecting to data
3. Fabrizio: Visual Analytics
4. Diego: Dashboard and stories
5. Tommaso: Calculations
6. Nacho: Mapping, Tableau Online &
Competitors
Introduction to
Tableau
Let’s start with the first
1
WHAT IS
TABLEAU?
We have to answer two important
questions:
WHA
T IS DATA
VISUALIZATION?
WHY IS DATA VISUALIZATION
IMPORT
ANT?
WHAT IS DATA
VISUALIZATION?
Data visualization is the process of
describing information through visual
rendering.
WHA
T IS DATA
VISUALIZATION?
WHY IS DATA VISUALIZATION IMPORTANT?
◉ Technological advances have made data visualization
more
prevalent and powerful than ever before.
◉ Businesses purpose.
WHAT IS
TABLEAU?
◉ Tableau is groundbreaking data visualization software created by
Tableau Software.
◉Tableau connects easily to nearly any data source
◉Tableau allows for instantaneous insight by transforming data into
interactive visualizations called dashboards.
WHAT IS TABLEAU? -
Cont’d
T
ABLEAU
FEATURES
SPEED TO
MARKET
T
ABLEAU DOES BIG
DA
T
A
T
ABLEAU DOES ANY
DA
T
A
STUNNING & INTERACTIVE
PLOTS
T
ABLEAU IS AN INDUSTRY
LEADER
T
ABLEAU IS EASY TO
USE
Connecting to
data
Let’s connect Tableau to the
2
CONNECTING TO
DAT
A
EXCE
L
DATABASE CLOU
D
ADDING ANOTHER DATA
SOURCE
Aworkbook canhave multiple data source. We can
connect to a locally saved extractor to a data source
which is published to Tableau Online or Tableau
Server
.
LIVE VS
EXTRACT
DAT
A PREP WITH TEXT AND EXCEL
FILES
DATA INTERPRETER With no columns names and a lot of nulls, Data Interpreter strips
out them and the columns are properly identified.
PIVOT
The Pivot merges the information from the original columns and
rows into two new columns.
METADATA GRID
It’s can be a useful view with a large number of files and when tables
have been joined.
SPLIT We can split the columns based on the shared delimiter of that
hyphen.
CUSTOM SPLIT We can choose our delimiter and use a hyphen.
USING DATA
INTERPRETER
Click on
Review the
results
An Excel file is generated
with the interpreted null
values.
Look the ‘A’s!
SAVING AND PUBLISHING DATA
SOURCES
Saving data source as
a .tds
this is not the data
itself!
Saving a data source
makes it easily
available in your copy of
Tableau Desktop...
...or it can be published
to Tableau Online or
Tableau Server.
◉ Workbook (.twb): Workbooks hold worksheets, dashboards and stories.
◉ Bookmark (.tbm): Bookmarks contain a single sheet.
◉ Packaged workbook (.twbx): Archive containing a workbook along with all data sources and files.
◉ Data extract (.tde): Local copy of a subset or entire data source to share and improve
the performance.
◉ Data source(.tds): Shortcut to oftenly used data sources, containing information and
modifications.
◉ Packaged data source (.tdsx): Archive containing a data source file along with any
related files.
A NOTE ON FILE
TYPES
JOIN TYPES WITH
UNION
Joining tables is a way of combining information from
multiple tables based on a field they share.
Joins are always made on a specific field (or fields).
Union follows the behavior “Union all”
even if there are duplicate values for
some rows.
Union
appends new
rows AND
new columns
if the shred
field don’t
match across
the unioned
data
sources
CROSS-DATABASE
JOIN
Sales and
Products
●DATA FROM
DIFFERENT SOURCES
● CROSS DATABASE
JOINS
● USING INTEGRATED
DATA SOURCES
WHA
T IS DAT
A
BLENDING?
Data blending is a way to combine data from multiple data sources into a single
view.
Blend Relationship and How To Blend
Blue: Primary data source
Orange: Secondary data source
Links:
Orange: Use the common field for linking
Gray: Don’t use the common field for linking
Visual
Analytics
Let’s give some meaning to that
3
WHAT IS VISUAL
ANALYTICS?
Is a field in information visualization that focuses
on analytical reasoning facilitated and supported
by interactive visual interfaces.
A PICTURE IS WORTH A THOUSAND
WORDS
Humans are very
good
in solving complex
problems
…
Visual
representations
enhances the
human
cognitive
process
WHAT TABLEAU HAS TO OFFER? - PT1
Powerful ways to select and aggregate the data to
consider:
◉ Hierarchies
◉ Groups
◉ Sets
◉ Filters
WHAT TABLEAU HAS TO OFFER? - PT2
Make use of the visual analytics power easily and
effectively:
◉Reference lines and trend lines to visually evaluate the
plots
◉Forecasting to make predictions with a confidence level
◉Statistical tools like average lines, median and Box Plots
◉K-means bundled clustering
HOW DOES IT LOOK
LIKE?
Dashboard and
stories
Let’s make it more
4
WHAT IS A
DASHBOARD?
◉ Powerful tool for mixing multiple views in a unique one
◉ Allow us to create interactive and common filters for all
the sheets grouped
◉ Excellent tool for generic views
DASHBOARDS -
EXAMPLE
WHAT IS A STORY IN
TABLEAU?
◉ Sheet that contains a sequence of worksheets or
dashboards that work together to convey information
◉ All methods that are able for datasheets and
dashboards apply to stories
◉ Powerful navigation tool for presentations
STORIES -
EXAMPLE
Calculation
s
Or how to manipulate the data
5
Calculations
Manipulate the dataset
over which tableau is
running.
The operations are
performed by the
underlying
database.
TYPES OF
CALCULATIONS
Table Calculations
Manipulate the current
view, operations are
performed on the view by
Tableau, without passing
through the underlying
database.
CALCULATIONS ON
WHAT?
◉String
◉Logic
◉Date
◉Type
◉...
CALCULATIONS
SYNTAX
Level of Detail
expressions introduce the
capability to specify the
exact level of
aggregation within
a calculation
itself.
LOD
expressions
Mapping, Similar Tools & Tableau
Online
Let’s give some meaning to that
6
THE POSSIBILITIES ARE
INFINITE
Online maps, WMS
and Mapbox let you
create your own custom
background map or
connect to one
Automatically
recognize and display
geographic data and
associated metrics at
different geographic
granularities
T
ABLEAU’S
COMPETITORS
T
ABLEAU DESKTOP VS THE
REST
*Pentaho asks for a specific price depending on the desired solution: we suppose that, in the average, is more expensive
than Tableau.
Download &
Installation
Data Connection
Data Manipulation
Graphic Ability
Cost
*
WHAT HAS TO OFFER TABLEAU
ONLINE?
◉ Skip hardware cost & setup
time
◉ Connection with other users
◉ Support live data connections
◉ Secure
THANKS
!
Any questions?

tableau-finalpresentation-161211155749.pptx

  • 1.
  • 2.
    MS in Engineeringin Computer Science Data Mining a.y. 2016-17 You can find us at: ● abissoli.ab@gmail.com ● dieguersc@gmail.com ● farinaccifabrizio@gmail.co m ● ignacio.cplatas@gmail.com ● sara.cannoni92@gmai.com ● tommasodorsi@gmail.com
  • 3.
    WHAT ARE WEGOING TO PRESENT? 1. Andrea: Introduction to Tableau 2. Sara: Connecting to data 3. Fabrizio: Visual Analytics 4. Diego: Dashboard and stories 5. Tommaso: Calculations 6. Nacho: Mapping, Tableau Online & Competitors
  • 4.
  • 5.
    WHAT IS TABLEAU? We haveto answer two important questions: WHA T IS DATA VISUALIZATION? WHY IS DATA VISUALIZATION IMPORT ANT?
  • 6.
    WHAT IS DATA VISUALIZATION? Datavisualization is the process of describing information through visual rendering.
  • 7.
  • 8.
    WHY IS DATAVISUALIZATION IMPORTANT? ◉ Technological advances have made data visualization more prevalent and powerful than ever before. ◉ Businesses purpose.
  • 9.
    WHAT IS TABLEAU? ◉ Tableauis groundbreaking data visualization software created by Tableau Software. ◉Tableau connects easily to nearly any data source ◉Tableau allows for instantaneous insight by transforming data into interactive visualizations called dashboards.
  • 10.
    WHAT IS TABLEAU?- Cont’d
  • 11.
    T ABLEAU FEATURES SPEED TO MARKET T ABLEAU DOESBIG DA T A T ABLEAU DOES ANY DA T A STUNNING & INTERACTIVE PLOTS T ABLEAU IS AN INDUSTRY LEADER T ABLEAU IS EASY TO USE
  • 12.
  • 13.
  • 14.
    ADDING ANOTHER DATA SOURCE Aworkbookcanhave multiple data source. We can connect to a locally saved extractor to a data source which is published to Tableau Online or Tableau Server . LIVE VS EXTRACT
  • 15.
    DAT A PREP WITHTEXT AND EXCEL FILES DATA INTERPRETER With no columns names and a lot of nulls, Data Interpreter strips out them and the columns are properly identified. PIVOT The Pivot merges the information from the original columns and rows into two new columns. METADATA GRID It’s can be a useful view with a large number of files and when tables have been joined. SPLIT We can split the columns based on the shared delimiter of that hyphen. CUSTOM SPLIT We can choose our delimiter and use a hyphen.
  • 16.
    USING DATA INTERPRETER Click on Reviewthe results An Excel file is generated with the interpreted null values. Look the ‘A’s!
  • 17.
    SAVING AND PUBLISHINGDATA SOURCES Saving data source as a .tds this is not the data itself! Saving a data source makes it easily available in your copy of Tableau Desktop... ...or it can be published to Tableau Online or Tableau Server.
  • 18.
    ◉ Workbook (.twb):Workbooks hold worksheets, dashboards and stories. ◉ Bookmark (.tbm): Bookmarks contain a single sheet. ◉ Packaged workbook (.twbx): Archive containing a workbook along with all data sources and files. ◉ Data extract (.tde): Local copy of a subset or entire data source to share and improve the performance. ◉ Data source(.tds): Shortcut to oftenly used data sources, containing information and modifications. ◉ Packaged data source (.tdsx): Archive containing a data source file along with any related files. A NOTE ON FILE TYPES
  • 19.
    JOIN TYPES WITH UNION Joiningtables is a way of combining information from multiple tables based on a field they share. Joins are always made on a specific field (or fields). Union follows the behavior “Union all” even if there are duplicate values for some rows. Union appends new rows AND new columns if the shred field don’t match across the unioned data sources
  • 20.
    CROSS-DATABASE JOIN Sales and Products ●DATA FROM DIFFERENTSOURCES ● CROSS DATABASE JOINS ● USING INTEGRATED DATA SOURCES
  • 21.
    WHA T IS DAT A BLENDING? Datablending is a way to combine data from multiple data sources into a single view. Blend Relationship and How To Blend Blue: Primary data source Orange: Secondary data source Links: Orange: Use the common field for linking Gray: Don’t use the common field for linking
  • 22.
  • 23.
    WHAT IS VISUAL ANALYTICS? Isa field in information visualization that focuses on analytical reasoning facilitated and supported by interactive visual interfaces.
  • 24.
    A PICTURE ISWORTH A THOUSAND WORDS Humans are very good in solving complex problems … Visual representations enhances the human cognitive process
  • 25.
    WHAT TABLEAU HASTO OFFER? - PT1 Powerful ways to select and aggregate the data to consider: ◉ Hierarchies ◉ Groups ◉ Sets ◉ Filters
  • 26.
    WHAT TABLEAU HASTO OFFER? - PT2 Make use of the visual analytics power easily and effectively: ◉Reference lines and trend lines to visually evaluate the plots ◉Forecasting to make predictions with a confidence level ◉Statistical tools like average lines, median and Box Plots ◉K-means bundled clustering
  • 27.
    HOW DOES ITLOOK LIKE?
  • 28.
  • 29.
    WHAT IS A DASHBOARD? ◉Powerful tool for mixing multiple views in a unique one ◉ Allow us to create interactive and common filters for all the sheets grouped ◉ Excellent tool for generic views
  • 30.
  • 31.
    WHAT IS ASTORY IN TABLEAU? ◉ Sheet that contains a sequence of worksheets or dashboards that work together to convey information ◉ All methods that are able for datasheets and dashboards apply to stories ◉ Powerful navigation tool for presentations
  • 32.
  • 33.
    Calculation s Or how tomanipulate the data 5
  • 34.
    Calculations Manipulate the dataset overwhich tableau is running. The operations are performed by the underlying database. TYPES OF CALCULATIONS Table Calculations Manipulate the current view, operations are performed on the view by Tableau, without passing through the underlying database.
  • 35.
  • 36.
  • 37.
    Level of Detail expressionsintroduce the capability to specify the exact level of aggregation within a calculation itself. LOD expressions
  • 38.
    Mapping, Similar Tools& Tableau Online Let’s give some meaning to that 6
  • 39.
    THE POSSIBILITIES ARE INFINITE Onlinemaps, WMS and Mapbox let you create your own custom background map or connect to one Automatically recognize and display geographic data and associated metrics at different geographic granularities
  • 40.
  • 41.
    T ABLEAU DESKTOP VSTHE REST *Pentaho asks for a specific price depending on the desired solution: we suppose that, in the average, is more expensive than Tableau. Download & Installation Data Connection Data Manipulation Graphic Ability Cost *
  • 42.
    WHAT HAS TOOFFER TABLEAU ONLINE? ◉ Skip hardware cost & setup time ◉ Connection with other users ◉ Support live data connections ◉ Secure
  • 43.