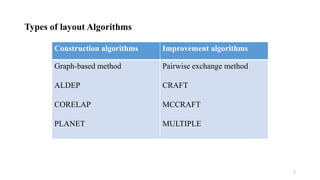
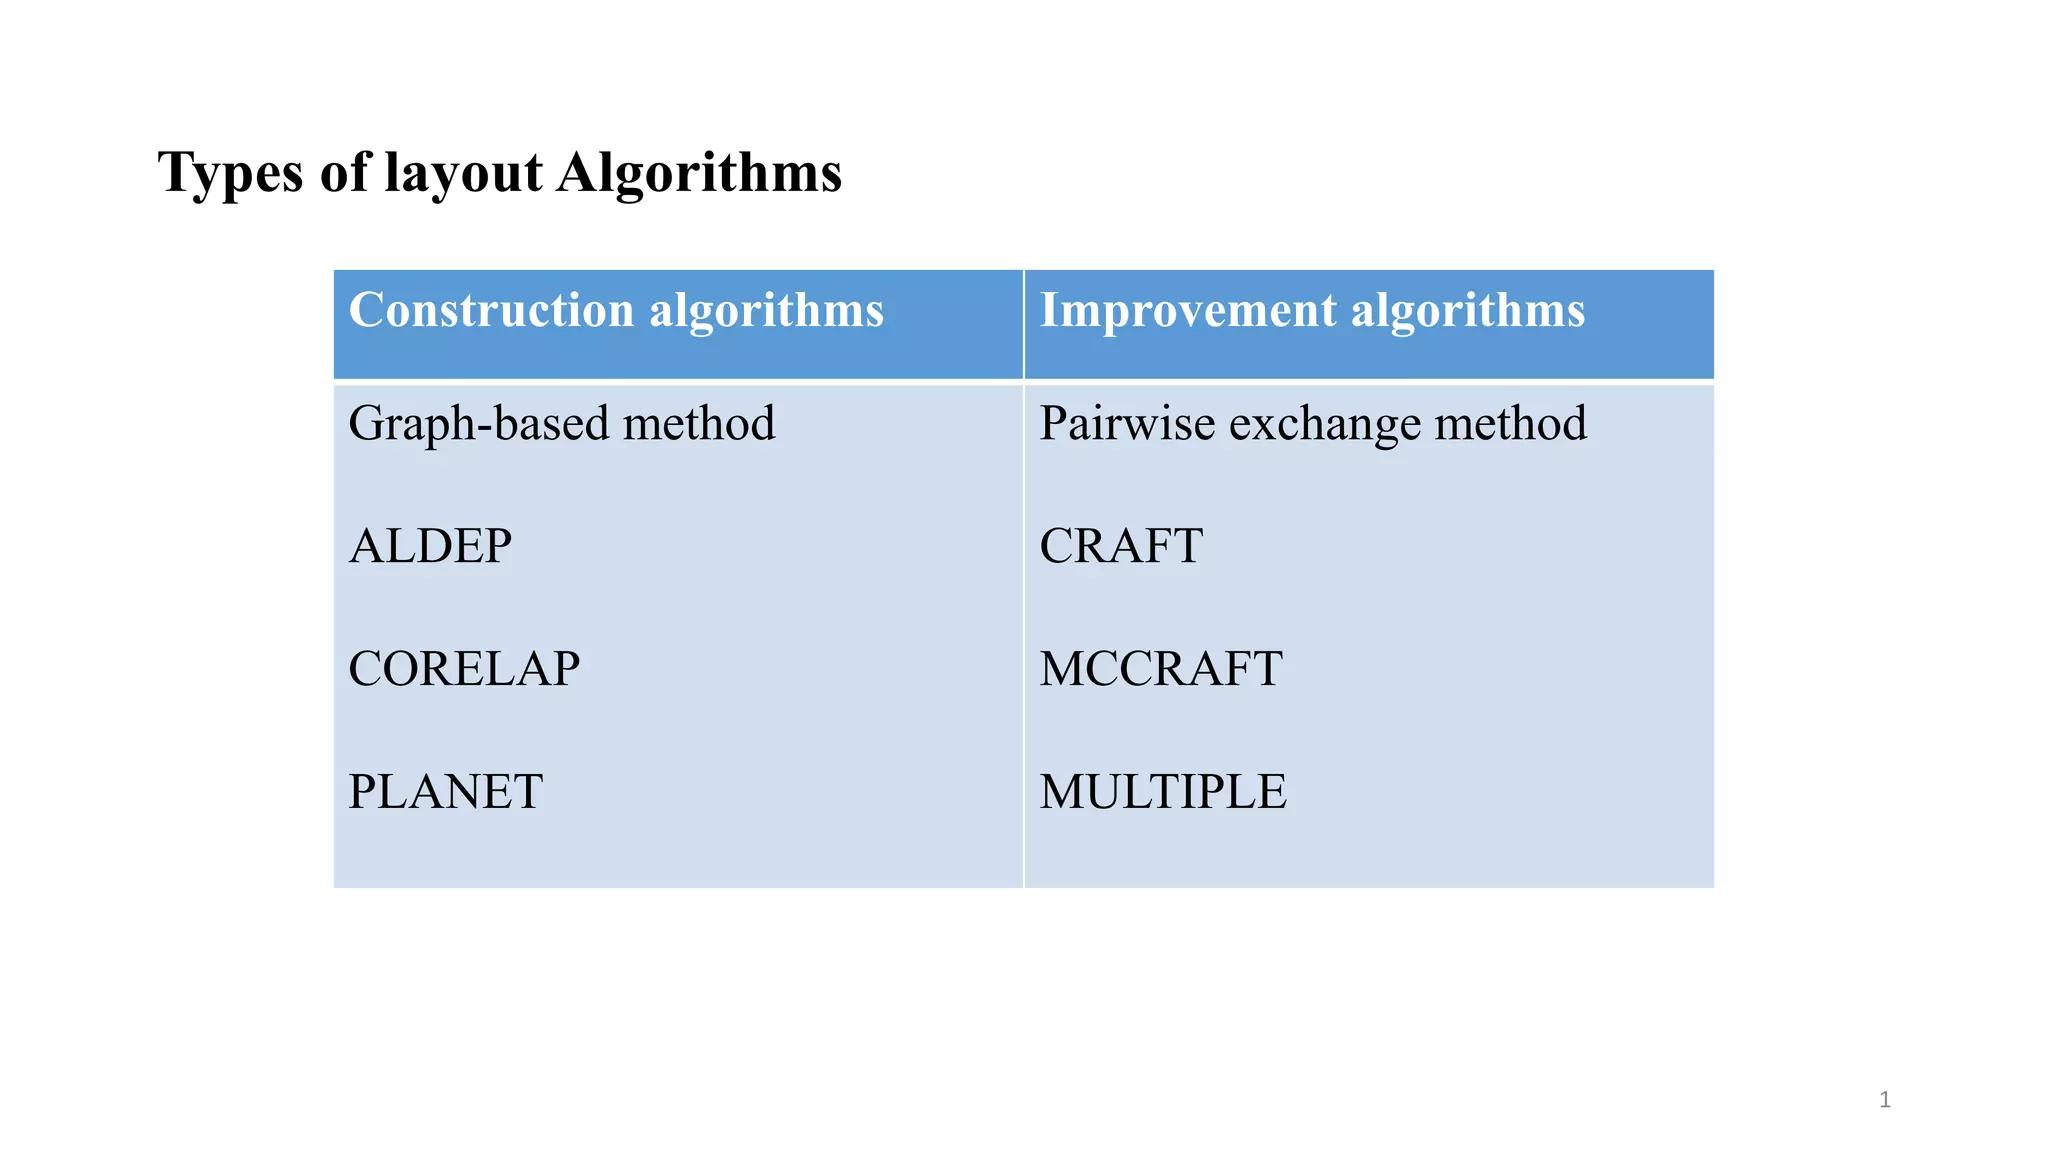
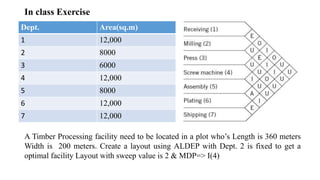
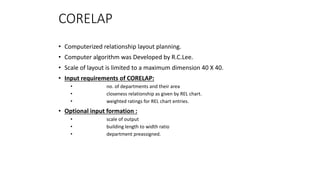
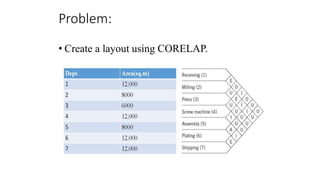
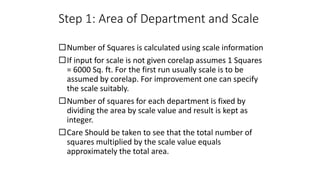
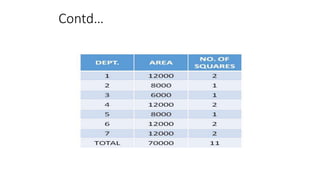
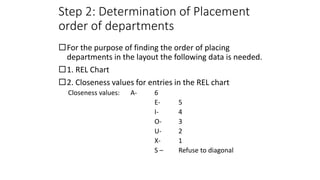
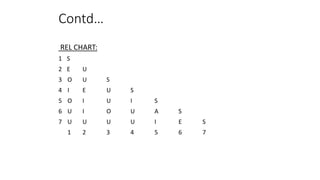
Types of layout Algorithms
Construction algorithms Improvement algorithms
Graph-based method
ALDEP
CORELAP
PLANET
Pairwise exchange method
CRAFT
MCCRAFT
MULTIPLE
1
AUTOMATED LAYOUT DESIGN PROGRAM (ALDEP)
• ALDEP is basically a construction algorithm, but it can also be used to evaluate
two layouts
• It uses basic data on facilities & builds a layout by successively placing the layout
using relationship information between the departments
• Data requirements
• Area of Departments
• REL Chart with A,E,I,O,U,X rankings
• Sweep width
• Minimum Department Preferences (MDP)
• Ranking values:
• A = 64, Absolutely necessary
• E = 16, Especially important
• I = 4, Important
• O = 1, Ordinarily important
• U = 0, Unimportant
• X = -1024, Undesirable
2
ALDEP Facility Representation
Facility Length
FacilityWidth
Discrete Representation
Sweep Method
Facility Length
FacilityWidth
ALDEP Facility Representation
A
A
A
A
A A
A A
Facility Length
FacilityWidth
Dept. size = 8 squares
Facility width = 6 squares
Sweep width = 1 square
C C
C C
C C
C C
C C
C C C C
Facility Length
FacilityWidth
Dept. size = 14 squares
Facility width = 6 squares
Sweep width = 2 squares
Example
Dept. Area(sq.m)
1 12,000
2 8000
3 6000
4 12,000
5 8000
6 12,000
7 12,000
A Timber Processing facility need to be located in a plot who’s Length is 360 meters
Width is 200 meters. Create a layout using ALDEP to get a optimal facility Layout
with sweep value is 2 & MDP=> E(16)
Example
Dept. Area
1 12,000
2 8000
3 6000
4 12,000
5 8000
6 12,000
7 12,000
From the above table we try to scale it down by considering common
area value of 400 sq.m. We get number of squares.
Departments 1,4,6,7 have same number of squares. Select any one
Randomly
Number of Squares
30
20
15
30
20
30
30
Dept. Area
1 12,000
2 8000
3 6000
4 12,000
5 8000
6 12,000
7 12,000
Number of Squares
30
20
15
30
20
30
30
175
Facility Length=18
FacilityWidth=10
• One square is 400 sq.m
• Length of square =20m
• Width of square= 20m
• Length of plot is 360m
• Width of plot is 200m
Length of layout matrix = 360/20=18
widthoflayoutmatrix
200/20=10
• We randomly select Dept. 4 as first dept. in the layout matrix.
• If a dept. is said to be fixed then start with that dept. or office.
• Now sweep Value is 2. So fill the layout matrix accordingly.
• Now compare Dept. 4 with our dept. to find which is nearer.
• Dept. 4 ->1,2,3,5,6,7
• Dept. Rank ->I,E,U,I,U,U So E (Dept. 2) is selected
• Now dept. 2 is entered then its now compared with other Depts.
• To find which is nearer to the Dept. 2
• Now compare Dept. 2 with other Depts.
• Dept. 2 ->1,3,5,6,7
• Dept. Rank->E,U,I,I,U So E (Dept. 1) is selected
The sequence of selection is 4-2-1-6-5-7-3
Scoring the layout
Neighbouring
Departments
Rel Grade Rel Value
4-2 E 16
4-1 I 4
2-1 E 16
1-6 U 0
6-5 A 64
6-7 E 16
5-7 I 4
7-3 U 0
120
Total scoring = 120*2=240 Since both the ways we can have neighbour pairs
In class Exercise
Dept. Area(sq.m)
1 12,000
2 8000
3 6000
4 12,000
5 8000
6 12,000
7 12,000
A Timber Processing facility need to be located in a plot who’s Length is 360 meters
Width is 200 meters. Create a layout using ALDEP with Dept. 2 is fixed to get a
optimal facility Layout with sweep value is 2 & MDP=> I(4)
In class Exercise-Solution
Steps Depts. Area(sq.m)
Total scoring = 104*2=208 Since both the ways we can have neighbour pairs
1 2 Fixed
3 4 “I” with 1
2 1 “E” with 2
4 5 “I” with 1
5 6 “A” with 5
6 7 “E” with 6
7 3 Remaining
CORELAP
CORELAP
• Computerized relationship layout planning.
• Computer algorithm was Developed by R.C.Lee.
• Scale of layout is limited to a maximum dimension 40 X 40.
• Input requirements of CORELAP:
• no. of departments and their area
• closeness relationship as given by REL chart.
• weighted ratings for REL chart entries.
• Optional input formation :
• scale of output
• building length to width ratio
• department preassigned.
Problem:
• Create a layout using CORELAP.
Step 1: Area of Department and Scale
Number of Squares is calculated using scale information
If input for scale is not given corelap assumes 1 Squares
= 6000 Sq. ft. For the first run usually scale is to be
assumed by corelap. For improvement one can specify
the scale suitably.
Number of squares for each department is fixed by
dividing the area by scale value and result is kept as
integer.
Care Should be taken to see that the total number of
squares multiplied by the scale value equals
approximately the total area.
Contd…
Step 2: Determination of Placement
order of departments
For the purpose of finding the order of placing
departments in the layout the following data is needed.
1. REL Chart
2. Closeness values for entries in the REL chart
Closeness values: A- 6
E- 5
I- 4
O- 3
U- 2
X- 1
S – Refuse to diagonal
Contd…
REL CHART:
1 S
2 E U
3 O U S
4 I E U S
5 O I U I S
6 U I O U A S
7 U U U U I E S
1 2 3 4 5 6 7
Contd…
• Using the REL Chart information total closeness
rating is computed for all the departments
 Total closeness rating (TCR) is the sum of the numerical values
assigned to the closeness relationship between a department
and all other department.
Contd…
Contd…
• The following steps are carried out to select the
placement order of departments
• Step 1: Department with largest TCR is selected for
first placement. In case of ties the department with
the largest area is selected. For the example,
department 5 is selected. Dept 5 has the largest TCR
value 23
Contd…
Step 2:
Review the closeness relationship of dept.5 with
other departments to find the department that has
high closeness relationship with dept5.
closeness of dept. 5 with : 1, 2, 3, 4, 6, 7
O, I, U, I, A, I
Dept 6 has the highest closeness relationship with the
first selected dept 5. Dept 6 is selected as second in
placement order.
Contd…
• Step 3: Scan the REL chart for the closeness values for the unsigned
departments with department 5.
closeness of dept. 5 with : 1, 2, 3, 4, 6, 7
O, I, U, I, A, I
None of the unassigned has an “A” closeness with dept 5
Check the closeness of unassigned department with dept 6 (next in the
placement order)
closeness of dept. 6 with :1, 2, 3, 4, 7
U, I, O, U, E
None of the unassigned has an “A” closeness with dept 6
Check whether any of the unassigned dept has an “E” relationship with the
departments already included in the placement order. None of the
unassigned has “E” closeness with dept 5. Dept 7 has an “E” closeness with
the dept 6. Dept 7 is included third in the order.
Contd…
Step 4: Repeat the procedure of step 3 with the
unassigned departments.
1, 2, 3, 4
With Dept 5 : O, I, U, I
Dept 6: U, I, O, U
Dept 7: U, U, U, U
Dept 2 and 4 have an “I” closeness with dept 5. In the case
of ties, select based on highest TCR. Dept 2 (TCR=22) is
selected and included forth in the placement order
 Repeat this until all departments are included.
Placement order: 5,6,7,2,1,4,3
Step 3: Placement of department in
the layout
0 0 0 0 0 0 0 0
0 0 0 0 0 0 0 0
0 0 0 0 0 0 0 0
0 0 0 0 5 0 0 0
0 0 0 0 0 0 0 0
0 0 0 0 0 0 0 0
Step 1: the first department in the
placement order (dept 5) is placed at the
centre of the (40 X 40) layout.
Contd…
• Step 2: the second department from the list is placed
adjacent to the first department.
0 0 0 0 0 0 0 0
0 0 0 0 0 0 0 0
0 0 0 6 6 0 0 0
0 0 0 0 5 0 0 0
0 0 0 0 0 0 0 0
0 0 0 0 0 0 0 0
Contd…
• Step 3: Department 7 is to be placed next in the
layout. It can be seen that there are many
arrangements in which dept 7 can be placed as an
adjacent department to the layout.
• To aid evaluation of different placing alternatives
placing Rating (PR) is calculated.
• Placing rating is the sum of the weighted closeness
ratings between the entering department and its new
neighbours.
• CORELAP uses the following weighted closeness
rating values:
Contd…
• Dept 7 has 2 squares. The following placements are
possible
0 0 0 0 0 0 0 0
0 0 0 7 7 0 0 0
0 0 0 6 6 0 0 0
0 0 0 0 5 0 0 0
0 0 0 0 0 0 0 0
0 0 0 0 0 0 0 0
Dept7with6=E=81
PR=81
• Option 2:
0 0 0 0 0 0 0 0
0 0 0 0 0 0 0 0
0 0 0 6 6 7 0 0
0 0 0 0 5 7 0 0
0 0 0 0 0 0 0 0
0 0 0 0 0 0 0 0
Dept7with6=E=81
with5=I=27
PR=108
• Option 3:
0 0 0 0 0 0 0 0
0 0 0 0 0 0 0 0
0 0 0 6 6 0 0 0
0 0 7 7 5 0 0 0
0 0 0 0 0 0 0 0
0 0 0 0 0 0 0 0
Dept7with6=E=81
with5=I=27
PR=108
Contd…
• Select the Option 3 ( random between 2 and 3 ).
Department 7 is placed as shown in figure below.
0 0 0 0 0 0 0 0
0 0 0 0 0 0 0 0
0 0 0 6 6 0 0 0
0 0 7 7 5 0 0 0
0 0 0 0 0 0 0 0
0 0 0 0 0 0 0 0
Contd…
Step 4: Now Dept 2 is placed. Dept 2 has 1 square.
the best location is to place dept 2 adjacent to two
depts (dept 6 and dept 7) so that the PR can be
maximized (PR =28). All other arrangement will have
PR less than 28.
0 0 0 0 0 0 0 0
0 0 0 0 0 0 0 0
0 0 2 6 6 0 0 0
0 0 7 7 5 0 0 0
0 0 0 0 0 0 0 0
0 0 0 0 0 0 0 0
 Repeat this procedure until all the departments are
selected
Final Arrangement
0 0 0 0 0 0 0 0
0 4 1 1 3 0 0 0
0 4 2 6 6 0 0 0
0 0 7 7 5 0 0 0
0 0 0 0 0 0 0 0
0 0 0 0 0 0 0 0
Step 4: Total Score for the layout
Total score for a layout is the sum of the products
found by multiplying length of the shortest path
between all pairs of department times the numerical
closeness for the pair
Total score = Summation over all pairs (closeness
rating X length of the shortest path)
Path is calculated by the rectilinear distance from
the border of one department to the border of
another department. Therefore if 2 departments are
adjacent they will have common border. The path
will be zero
types of facility layout algorithm

types of facility layout algorithm

  • 1.
    Types of layoutAlgorithms Construction algorithms Improvement algorithms Graph-based method ALDEP CORELAP PLANET Pairwise exchange method CRAFT MCCRAFT MULTIPLE 1
  • 2.
    AUTOMATED LAYOUT DESIGNPROGRAM (ALDEP) • ALDEP is basically a construction algorithm, but it can also be used to evaluate two layouts • It uses basic data on facilities & builds a layout by successively placing the layout using relationship information between the departments • Data requirements • Area of Departments • REL Chart with A,E,I,O,U,X rankings • Sweep width • Minimum Department Preferences (MDP) • Ranking values: • A = 64, Absolutely necessary • E = 16, Especially important • I = 4, Important • O = 1, Ordinarily important • U = 0, Unimportant • X = -1024, Undesirable 2
  • 3.
    ALDEP Facility Representation FacilityLength FacilityWidth Discrete Representation Sweep Method Facility Length FacilityWidth
  • 4.
    ALDEP Facility Representation A A A A AA A A Facility Length FacilityWidth Dept. size = 8 squares Facility width = 6 squares Sweep width = 1 square C C C C C C C C C C C C C C Facility Length FacilityWidth Dept. size = 14 squares Facility width = 6 squares Sweep width = 2 squares
  • 5.
    Example Dept. Area(sq.m) 1 12,000 28000 3 6000 4 12,000 5 8000 6 12,000 7 12,000 A Timber Processing facility need to be located in a plot who’s Length is 360 meters Width is 200 meters. Create a layout using ALDEP to get a optimal facility Layout with sweep value is 2 & MDP=> E(16)
  • 6.
    Example Dept. Area 1 12,000 28000 3 6000 4 12,000 5 8000 6 12,000 7 12,000 From the above table we try to scale it down by considering common area value of 400 sq.m. We get number of squares. Departments 1,4,6,7 have same number of squares. Select any one Randomly Number of Squares 30 20 15 30 20 30 30
  • 8.
    Dept. Area 1 12,000 28000 3 6000 4 12,000 5 8000 6 12,000 7 12,000 Number of Squares 30 20 15 30 20 30 30 175 Facility Length=18 FacilityWidth=10 • One square is 400 sq.m • Length of square =20m • Width of square= 20m • Length of plot is 360m • Width of plot is 200m Length of layout matrix = 360/20=18 widthoflayoutmatrix 200/20=10
  • 9.
    • We randomlyselect Dept. 4 as first dept. in the layout matrix. • If a dept. is said to be fixed then start with that dept. or office. • Now sweep Value is 2. So fill the layout matrix accordingly. • Now compare Dept. 4 with our dept. to find which is nearer. • Dept. 4 ->1,2,3,5,6,7 • Dept. Rank ->I,E,U,I,U,U So E (Dept. 2) is selected
  • 10.
    • Now dept.2 is entered then its now compared with other Depts. • To find which is nearer to the Dept. 2 • Now compare Dept. 2 with other Depts. • Dept. 2 ->1,3,5,6,7 • Dept. Rank->E,U,I,I,U So E (Dept. 1) is selected
  • 11.
    The sequence ofselection is 4-2-1-6-5-7-3
  • 12.
    Scoring the layout Neighbouring Departments RelGrade Rel Value 4-2 E 16 4-1 I 4 2-1 E 16 1-6 U 0 6-5 A 64 6-7 E 16 5-7 I 4 7-3 U 0 120 Total scoring = 120*2=240 Since both the ways we can have neighbour pairs
  • 13.
    In class Exercise Dept.Area(sq.m) 1 12,000 2 8000 3 6000 4 12,000 5 8000 6 12,000 7 12,000 A Timber Processing facility need to be located in a plot who’s Length is 360 meters Width is 200 meters. Create a layout using ALDEP with Dept. 2 is fixed to get a optimal facility Layout with sweep value is 2 & MDP=> I(4)
  • 14.
    In class Exercise-Solution StepsDepts. Area(sq.m) Total scoring = 104*2=208 Since both the ways we can have neighbour pairs 1 2 Fixed 3 4 “I” with 1 2 1 “E” with 2 4 5 “I” with 1 5 6 “A” with 5 6 7 “E” with 6 7 3 Remaining
  • 15.
  • 16.
    CORELAP • Computerized relationshiplayout planning. • Computer algorithm was Developed by R.C.Lee. • Scale of layout is limited to a maximum dimension 40 X 40. • Input requirements of CORELAP: • no. of departments and their area • closeness relationship as given by REL chart. • weighted ratings for REL chart entries. • Optional input formation : • scale of output • building length to width ratio • department preassigned.
  • 17.
    Problem: • Create alayout using CORELAP.
  • 18.
    Step 1: Areaof Department and Scale Number of Squares is calculated using scale information If input for scale is not given corelap assumes 1 Squares = 6000 Sq. ft. For the first run usually scale is to be assumed by corelap. For improvement one can specify the scale suitably. Number of squares for each department is fixed by dividing the area by scale value and result is kept as integer. Care Should be taken to see that the total number of squares multiplied by the scale value equals approximately the total area.
  • 19.
  • 20.
    Step 2: Determinationof Placement order of departments For the purpose of finding the order of placing departments in the layout the following data is needed. 1. REL Chart 2. Closeness values for entries in the REL chart Closeness values: A- 6 E- 5 I- 4 O- 3 U- 2 X- 1 S – Refuse to diagonal
  • 21.
    Contd… REL CHART: 1 S 2E U 3 O U S 4 I E U S 5 O I U I S 6 U I O U A S 7 U U U U I E S 1 2 3 4 5 6 7
  • 22.
    Contd… • Using theREL Chart information total closeness rating is computed for all the departments  Total closeness rating (TCR) is the sum of the numerical values assigned to the closeness relationship between a department and all other department.
  • 23.
  • 24.
    Contd… • The followingsteps are carried out to select the placement order of departments • Step 1: Department with largest TCR is selected for first placement. In case of ties the department with the largest area is selected. For the example, department 5 is selected. Dept 5 has the largest TCR value 23
  • 25.
    Contd… Step 2: Review thecloseness relationship of dept.5 with other departments to find the department that has high closeness relationship with dept5. closeness of dept. 5 with : 1, 2, 3, 4, 6, 7 O, I, U, I, A, I Dept 6 has the highest closeness relationship with the first selected dept 5. Dept 6 is selected as second in placement order.
  • 26.
    Contd… • Step 3:Scan the REL chart for the closeness values for the unsigned departments with department 5. closeness of dept. 5 with : 1, 2, 3, 4, 6, 7 O, I, U, I, A, I None of the unassigned has an “A” closeness with dept 5 Check the closeness of unassigned department with dept 6 (next in the placement order) closeness of dept. 6 with :1, 2, 3, 4, 7 U, I, O, U, E None of the unassigned has an “A” closeness with dept 6 Check whether any of the unassigned dept has an “E” relationship with the departments already included in the placement order. None of the unassigned has “E” closeness with dept 5. Dept 7 has an “E” closeness with the dept 6. Dept 7 is included third in the order.
  • 27.
    Contd… Step 4: Repeatthe procedure of step 3 with the unassigned departments. 1, 2, 3, 4 With Dept 5 : O, I, U, I Dept 6: U, I, O, U Dept 7: U, U, U, U Dept 2 and 4 have an “I” closeness with dept 5. In the case of ties, select based on highest TCR. Dept 2 (TCR=22) is selected and included forth in the placement order  Repeat this until all departments are included. Placement order: 5,6,7,2,1,4,3
  • 28.
    Step 3: Placementof department in the layout 0 0 0 0 0 0 0 0 0 0 0 0 0 0 0 0 0 0 0 0 0 0 0 0 0 0 0 0 5 0 0 0 0 0 0 0 0 0 0 0 0 0 0 0 0 0 0 0 Step 1: the first department in the placement order (dept 5) is placed at the centre of the (40 X 40) layout.
  • 29.
    Contd… • Step 2:the second department from the list is placed adjacent to the first department. 0 0 0 0 0 0 0 0 0 0 0 0 0 0 0 0 0 0 0 6 6 0 0 0 0 0 0 0 5 0 0 0 0 0 0 0 0 0 0 0 0 0 0 0 0 0 0 0
  • 30.
    Contd… • Step 3:Department 7 is to be placed next in the layout. It can be seen that there are many arrangements in which dept 7 can be placed as an adjacent department to the layout. • To aid evaluation of different placing alternatives placing Rating (PR) is calculated. • Placing rating is the sum of the weighted closeness ratings between the entering department and its new neighbours.
  • 31.
    • CORELAP usesthe following weighted closeness rating values:
  • 32.
    Contd… • Dept 7has 2 squares. The following placements are possible 0 0 0 0 0 0 0 0 0 0 0 7 7 0 0 0 0 0 0 6 6 0 0 0 0 0 0 0 5 0 0 0 0 0 0 0 0 0 0 0 0 0 0 0 0 0 0 0 Dept7with6=E=81 PR=81
  • 33.
    • Option 2: 00 0 0 0 0 0 0 0 0 0 0 0 0 0 0 0 0 0 6 6 7 0 0 0 0 0 0 5 7 0 0 0 0 0 0 0 0 0 0 0 0 0 0 0 0 0 0 Dept7with6=E=81 with5=I=27 PR=108
  • 34.
    • Option 3: 00 0 0 0 0 0 0 0 0 0 0 0 0 0 0 0 0 0 6 6 0 0 0 0 0 7 7 5 0 0 0 0 0 0 0 0 0 0 0 0 0 0 0 0 0 0 0 Dept7with6=E=81 with5=I=27 PR=108
  • 35.
    Contd… • Select theOption 3 ( random between 2 and 3 ). Department 7 is placed as shown in figure below. 0 0 0 0 0 0 0 0 0 0 0 0 0 0 0 0 0 0 0 6 6 0 0 0 0 0 7 7 5 0 0 0 0 0 0 0 0 0 0 0 0 0 0 0 0 0 0 0
  • 36.
    Contd… Step 4: NowDept 2 is placed. Dept 2 has 1 square. the best location is to place dept 2 adjacent to two depts (dept 6 and dept 7) so that the PR can be maximized (PR =28). All other arrangement will have PR less than 28. 0 0 0 0 0 0 0 0 0 0 0 0 0 0 0 0 0 0 2 6 6 0 0 0 0 0 7 7 5 0 0 0 0 0 0 0 0 0 0 0 0 0 0 0 0 0 0 0  Repeat this procedure until all the departments are selected
  • 37.
    Final Arrangement 0 00 0 0 0 0 0 0 4 1 1 3 0 0 0 0 4 2 6 6 0 0 0 0 0 7 7 5 0 0 0 0 0 0 0 0 0 0 0 0 0 0 0 0 0 0 0
  • 38.
    Step 4: TotalScore for the layout Total score for a layout is the sum of the products found by multiplying length of the shortest path between all pairs of department times the numerical closeness for the pair Total score = Summation over all pairs (closeness rating X length of the shortest path) Path is calculated by the rectilinear distance from the border of one department to the border of another department. Therefore if 2 departments are adjacent they will have common border. The path will be zero