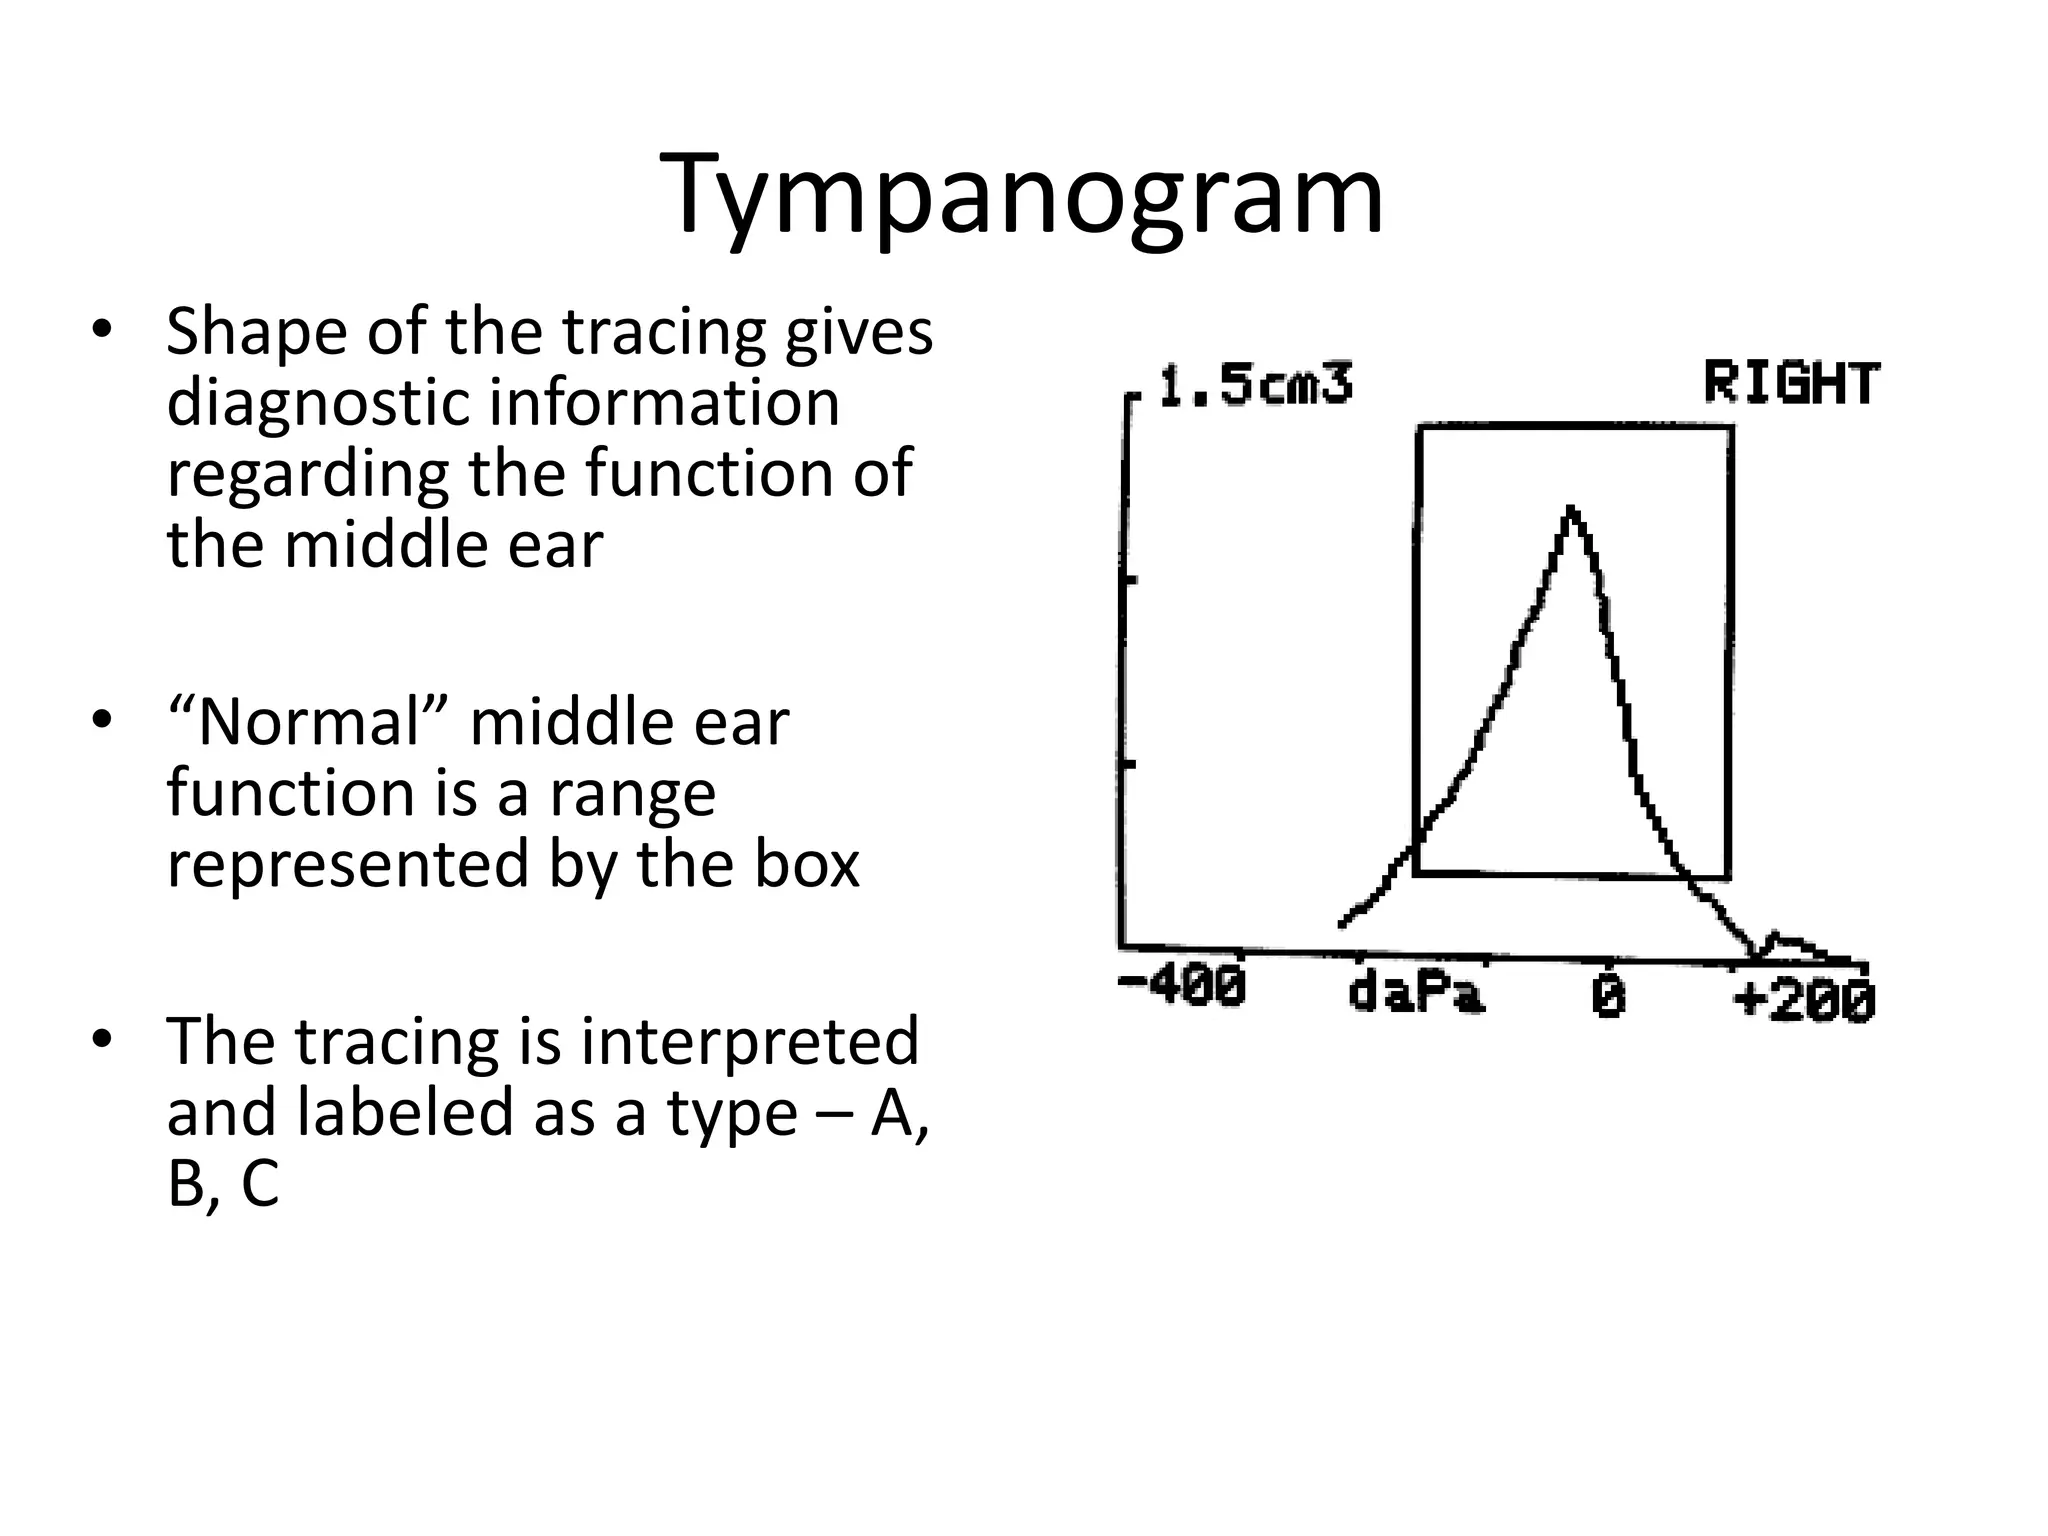
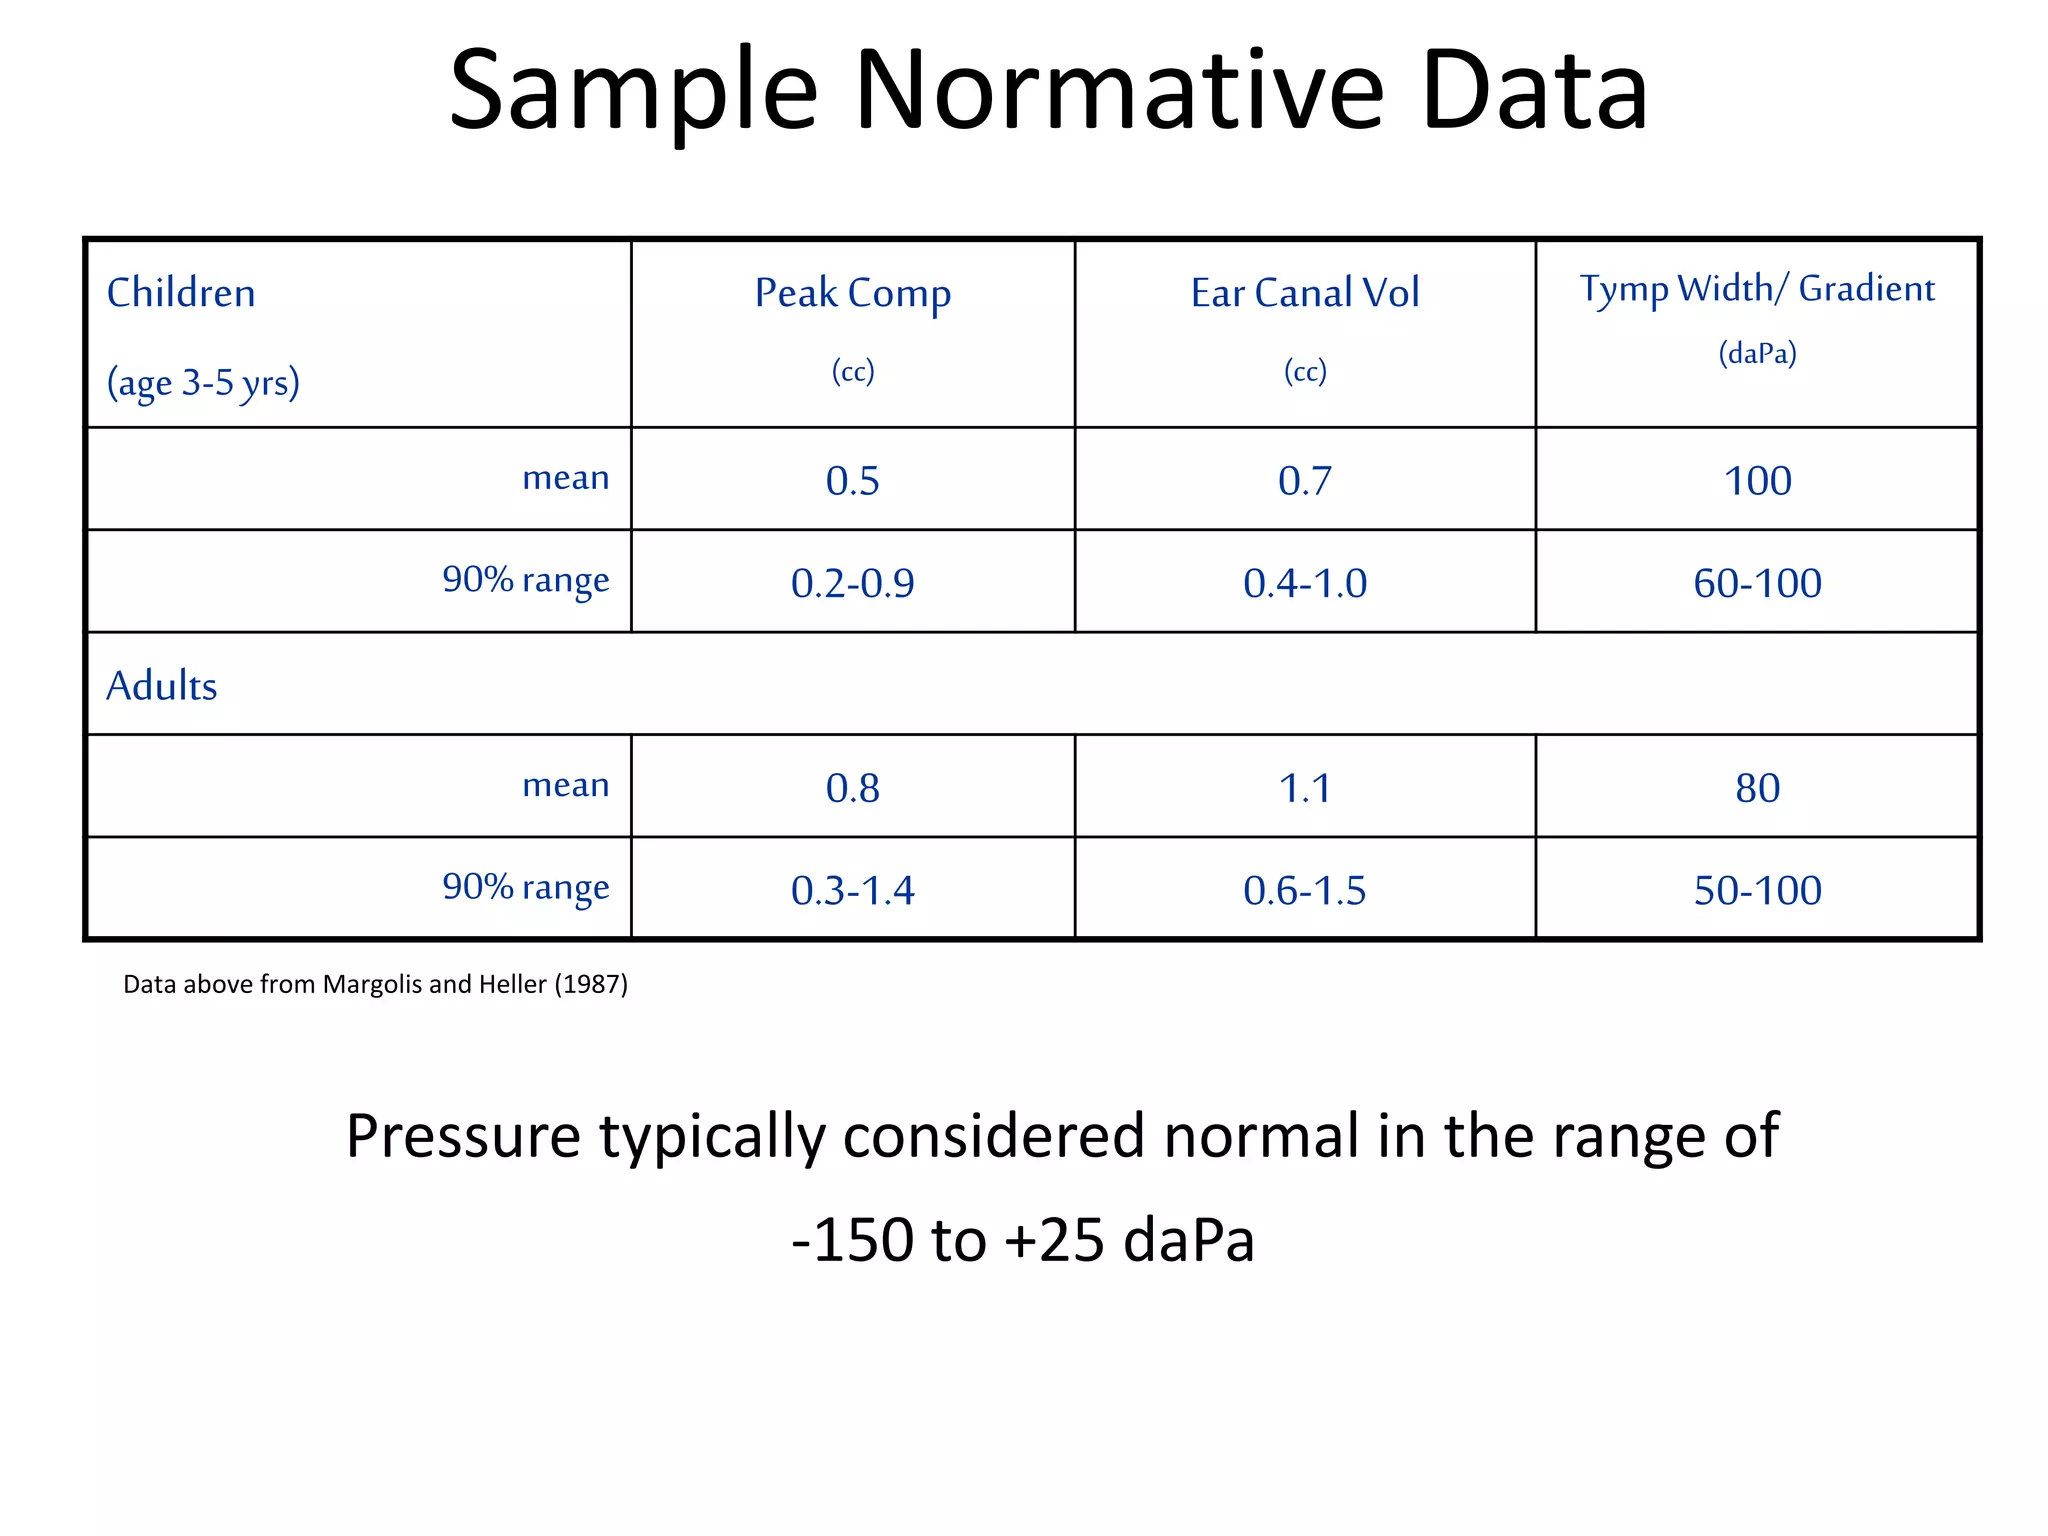
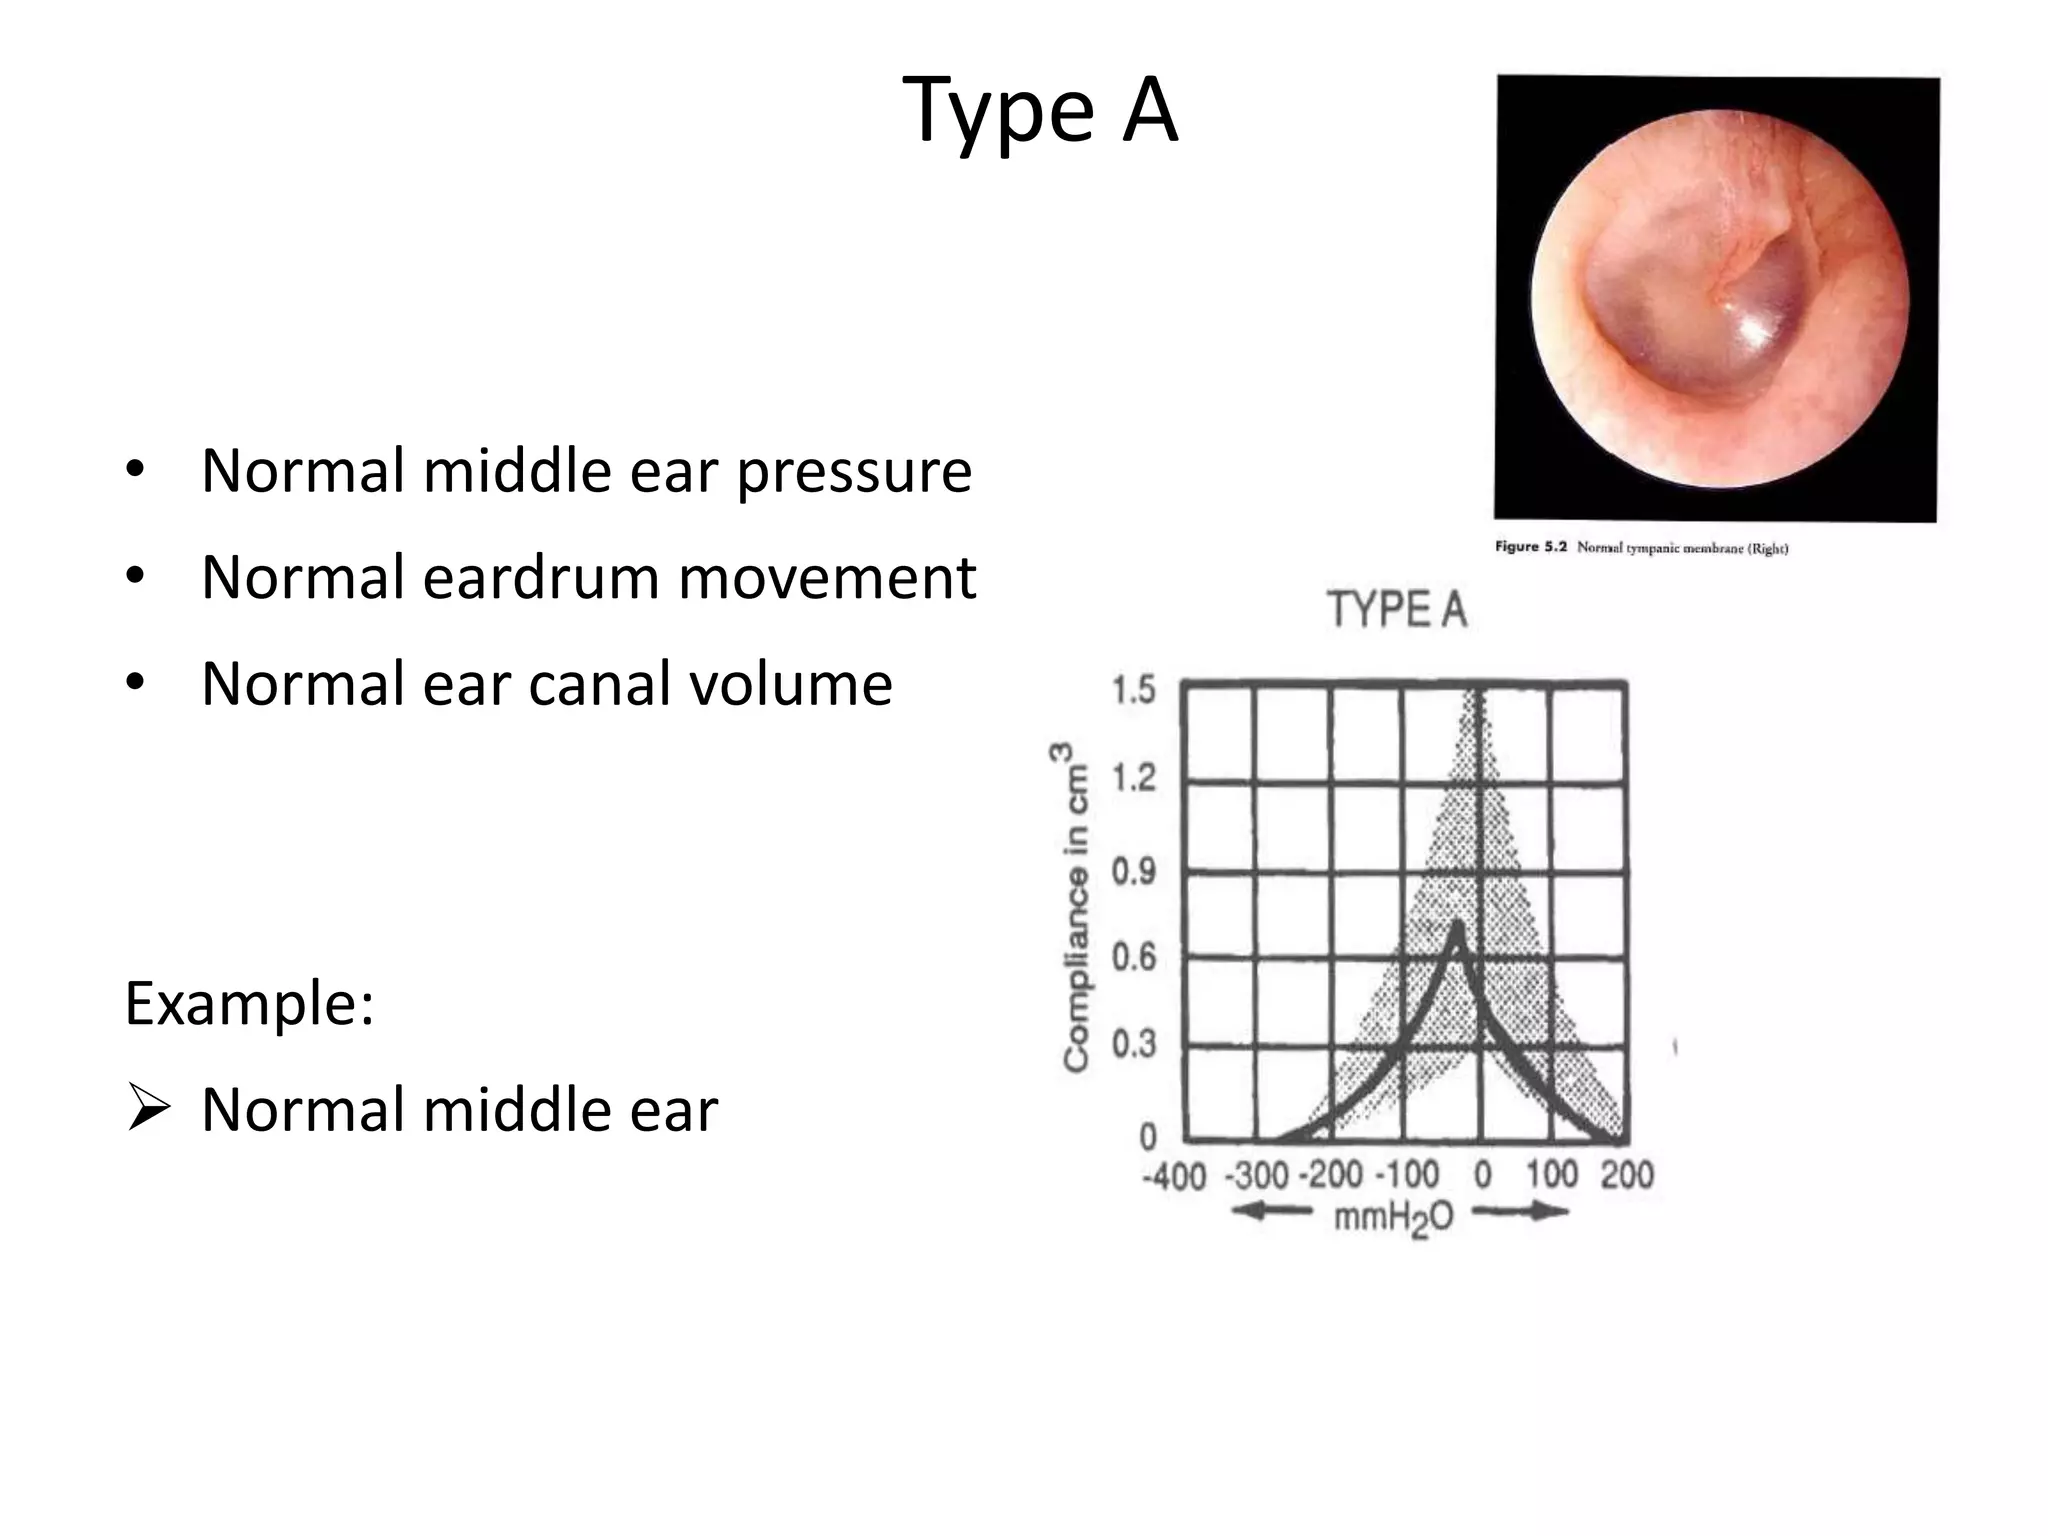
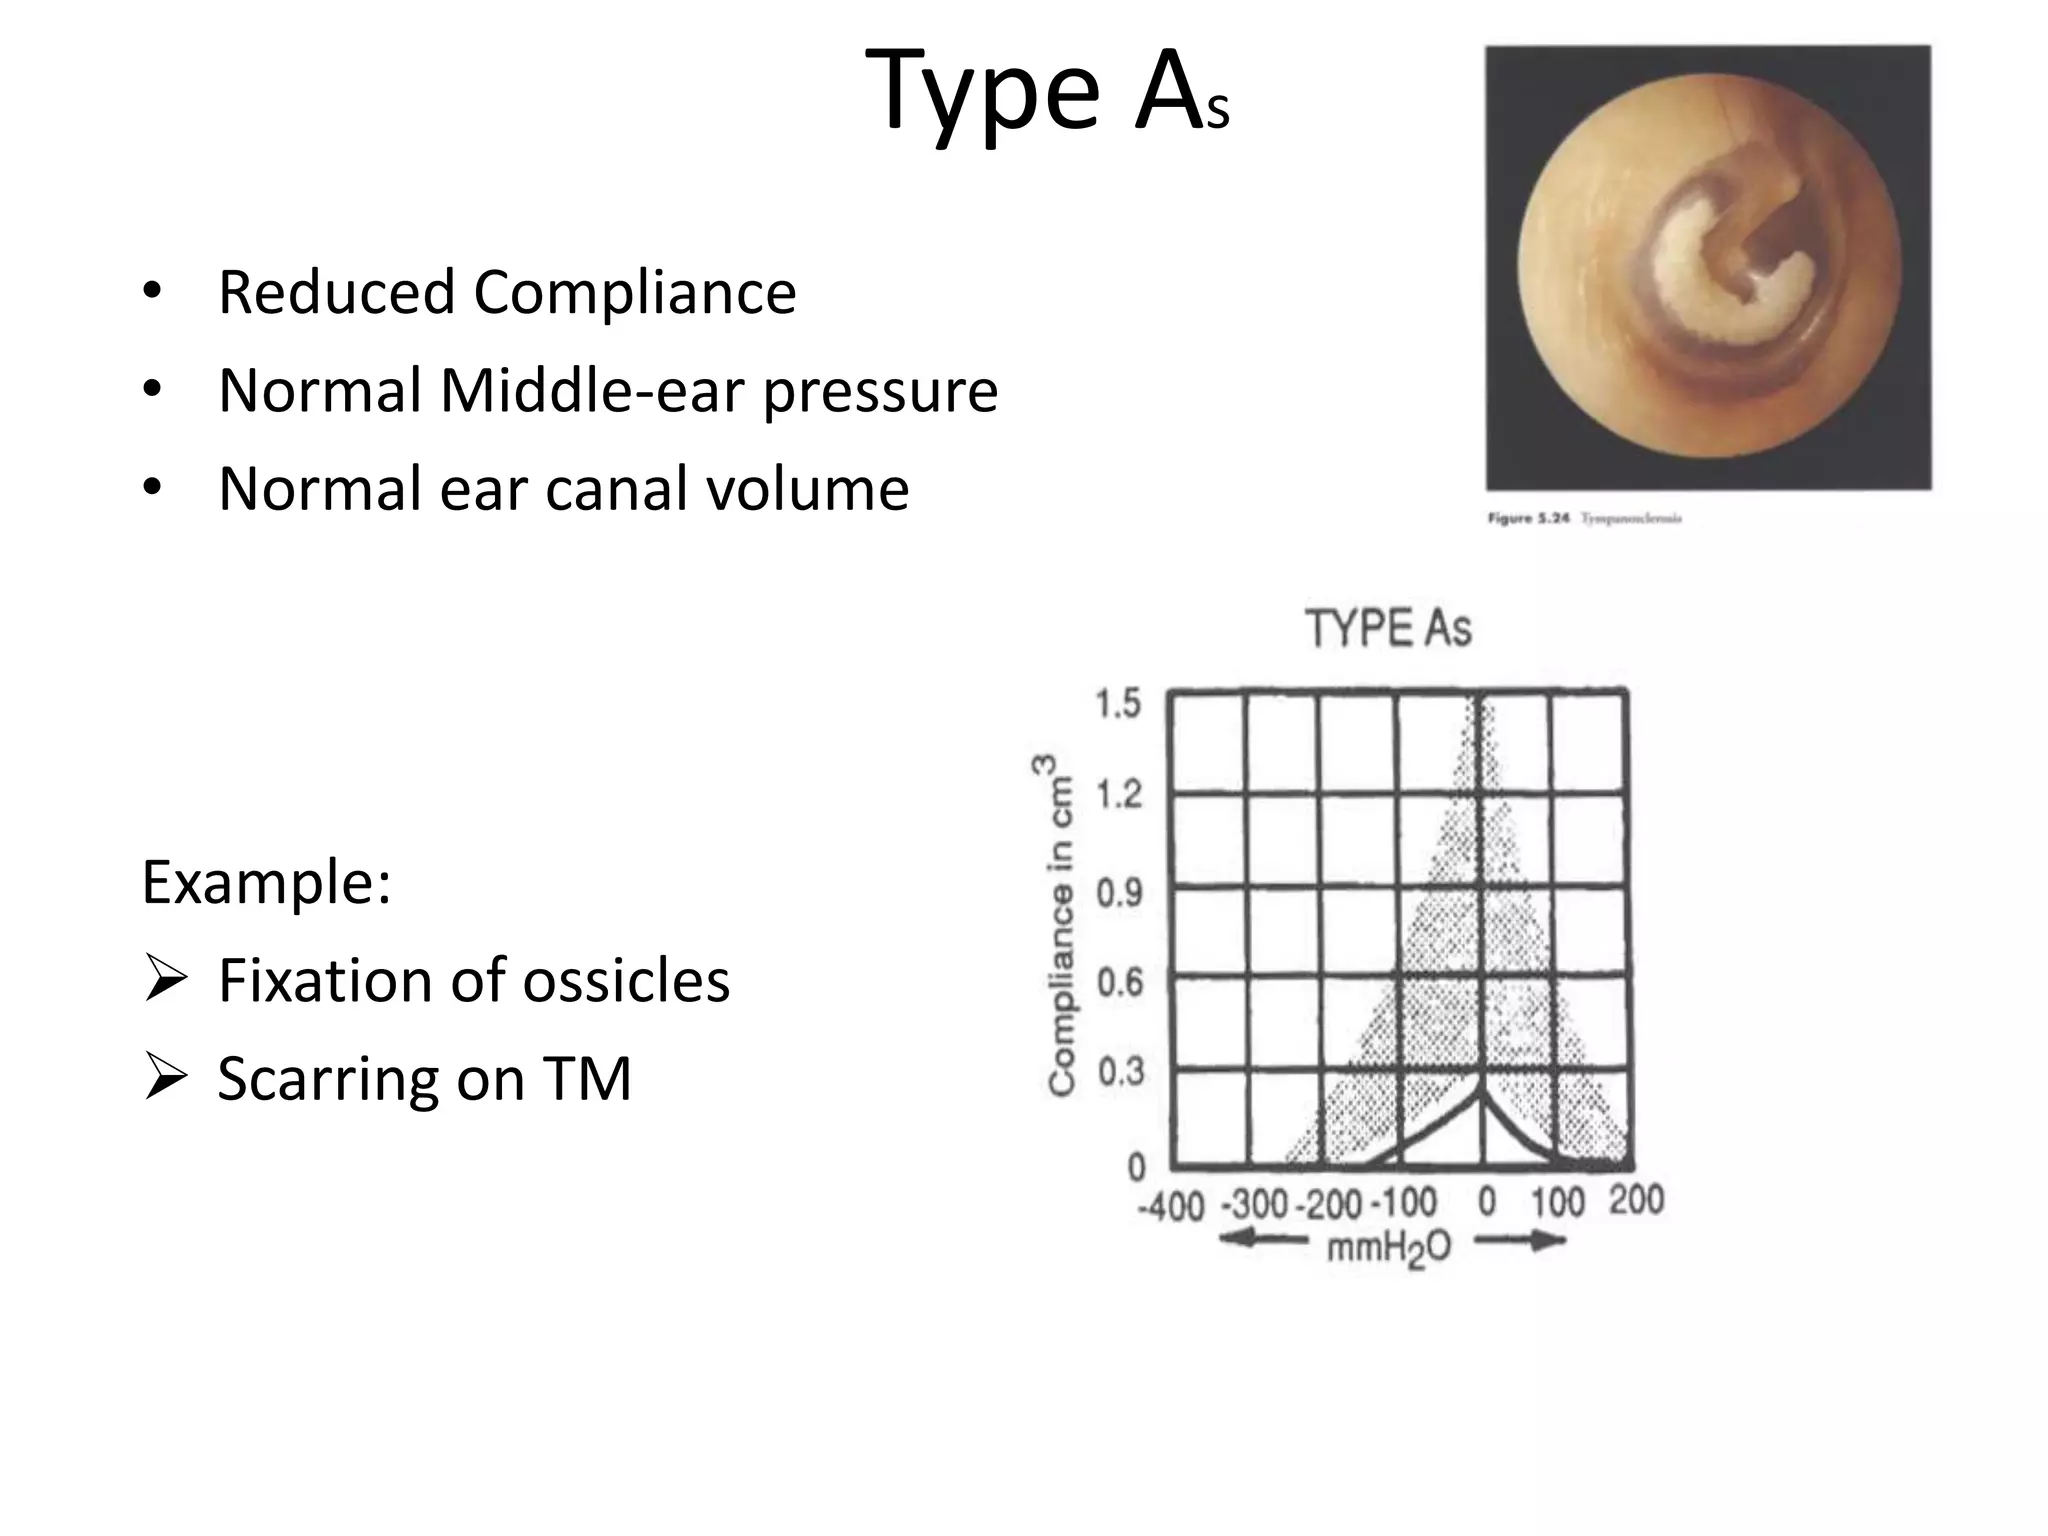
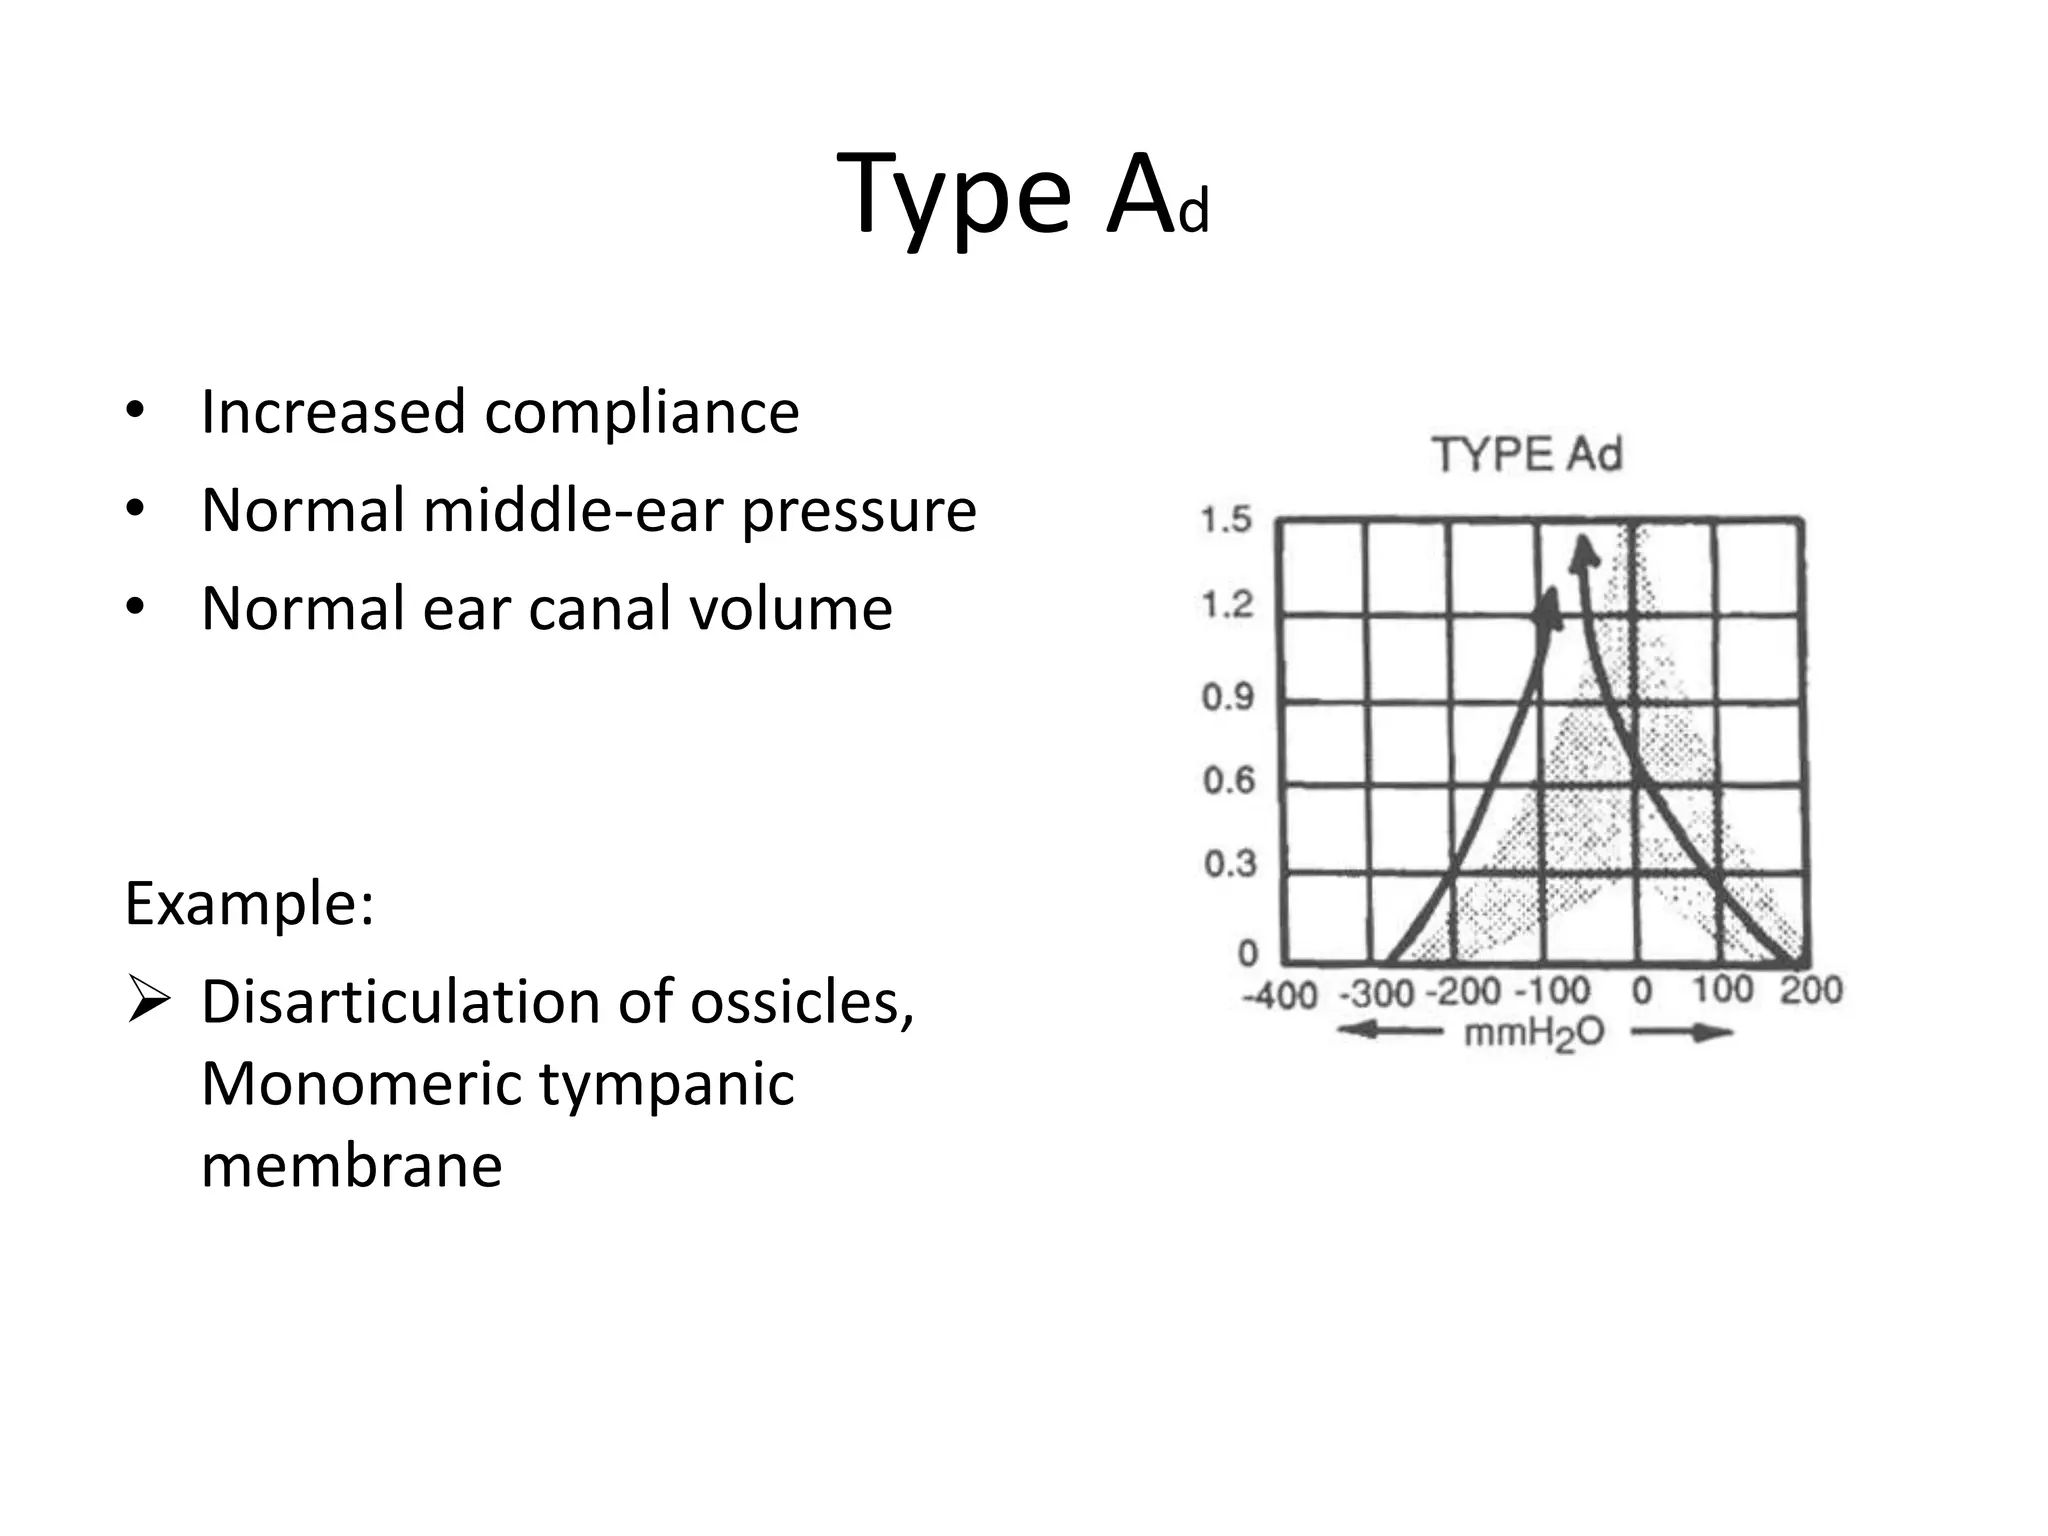
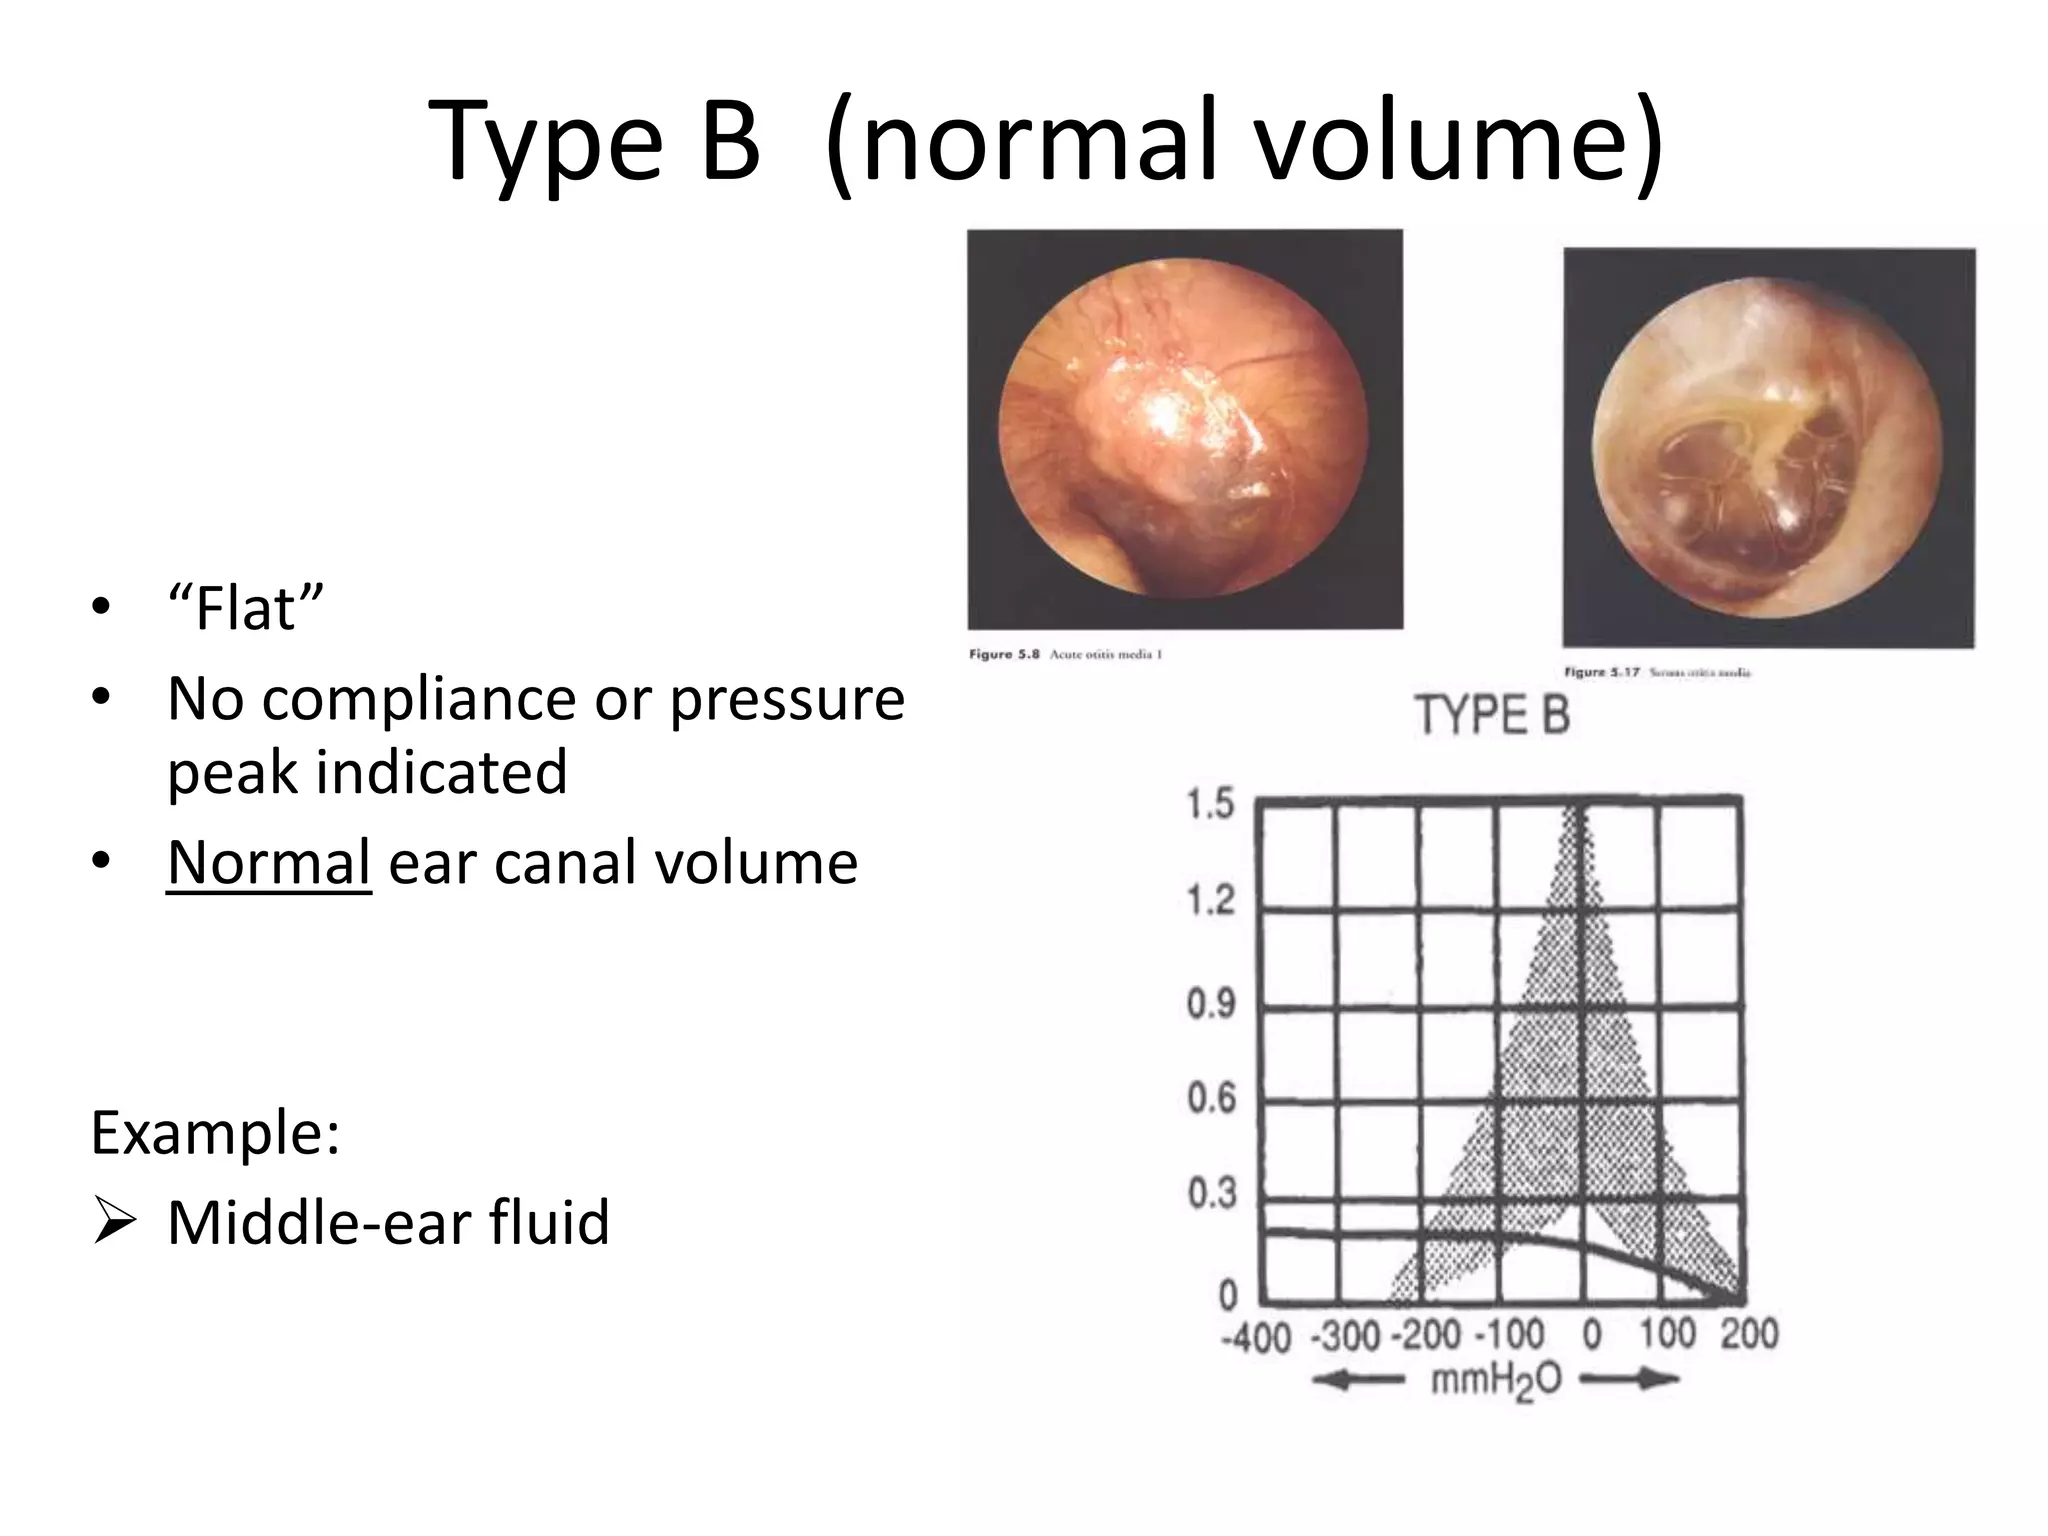
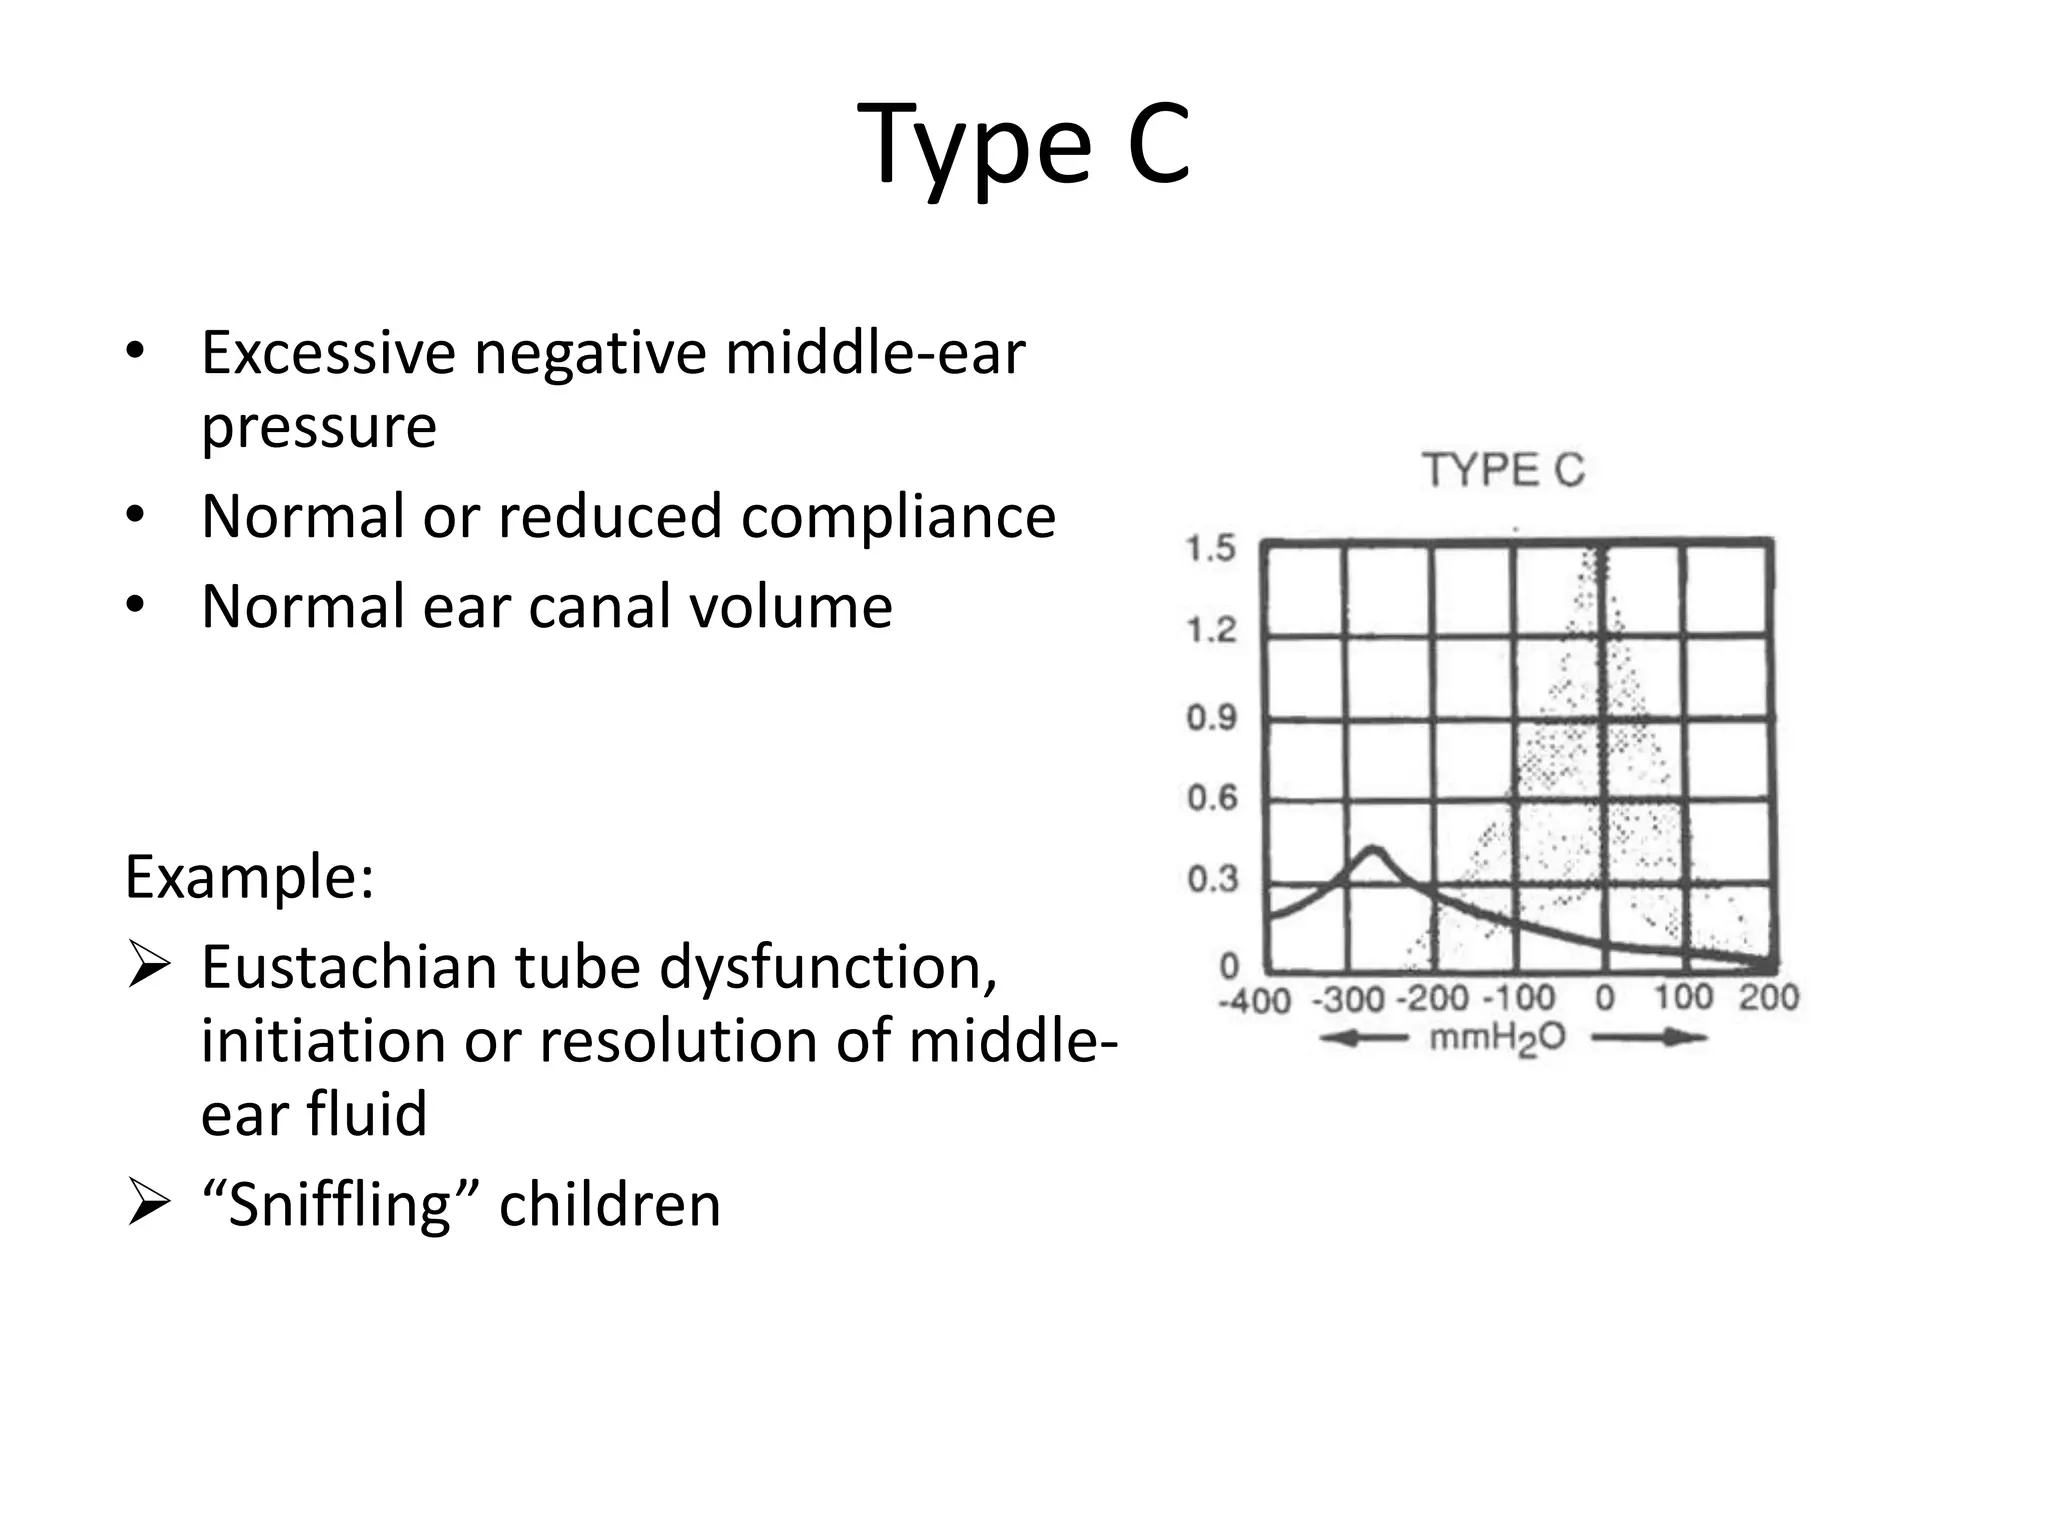
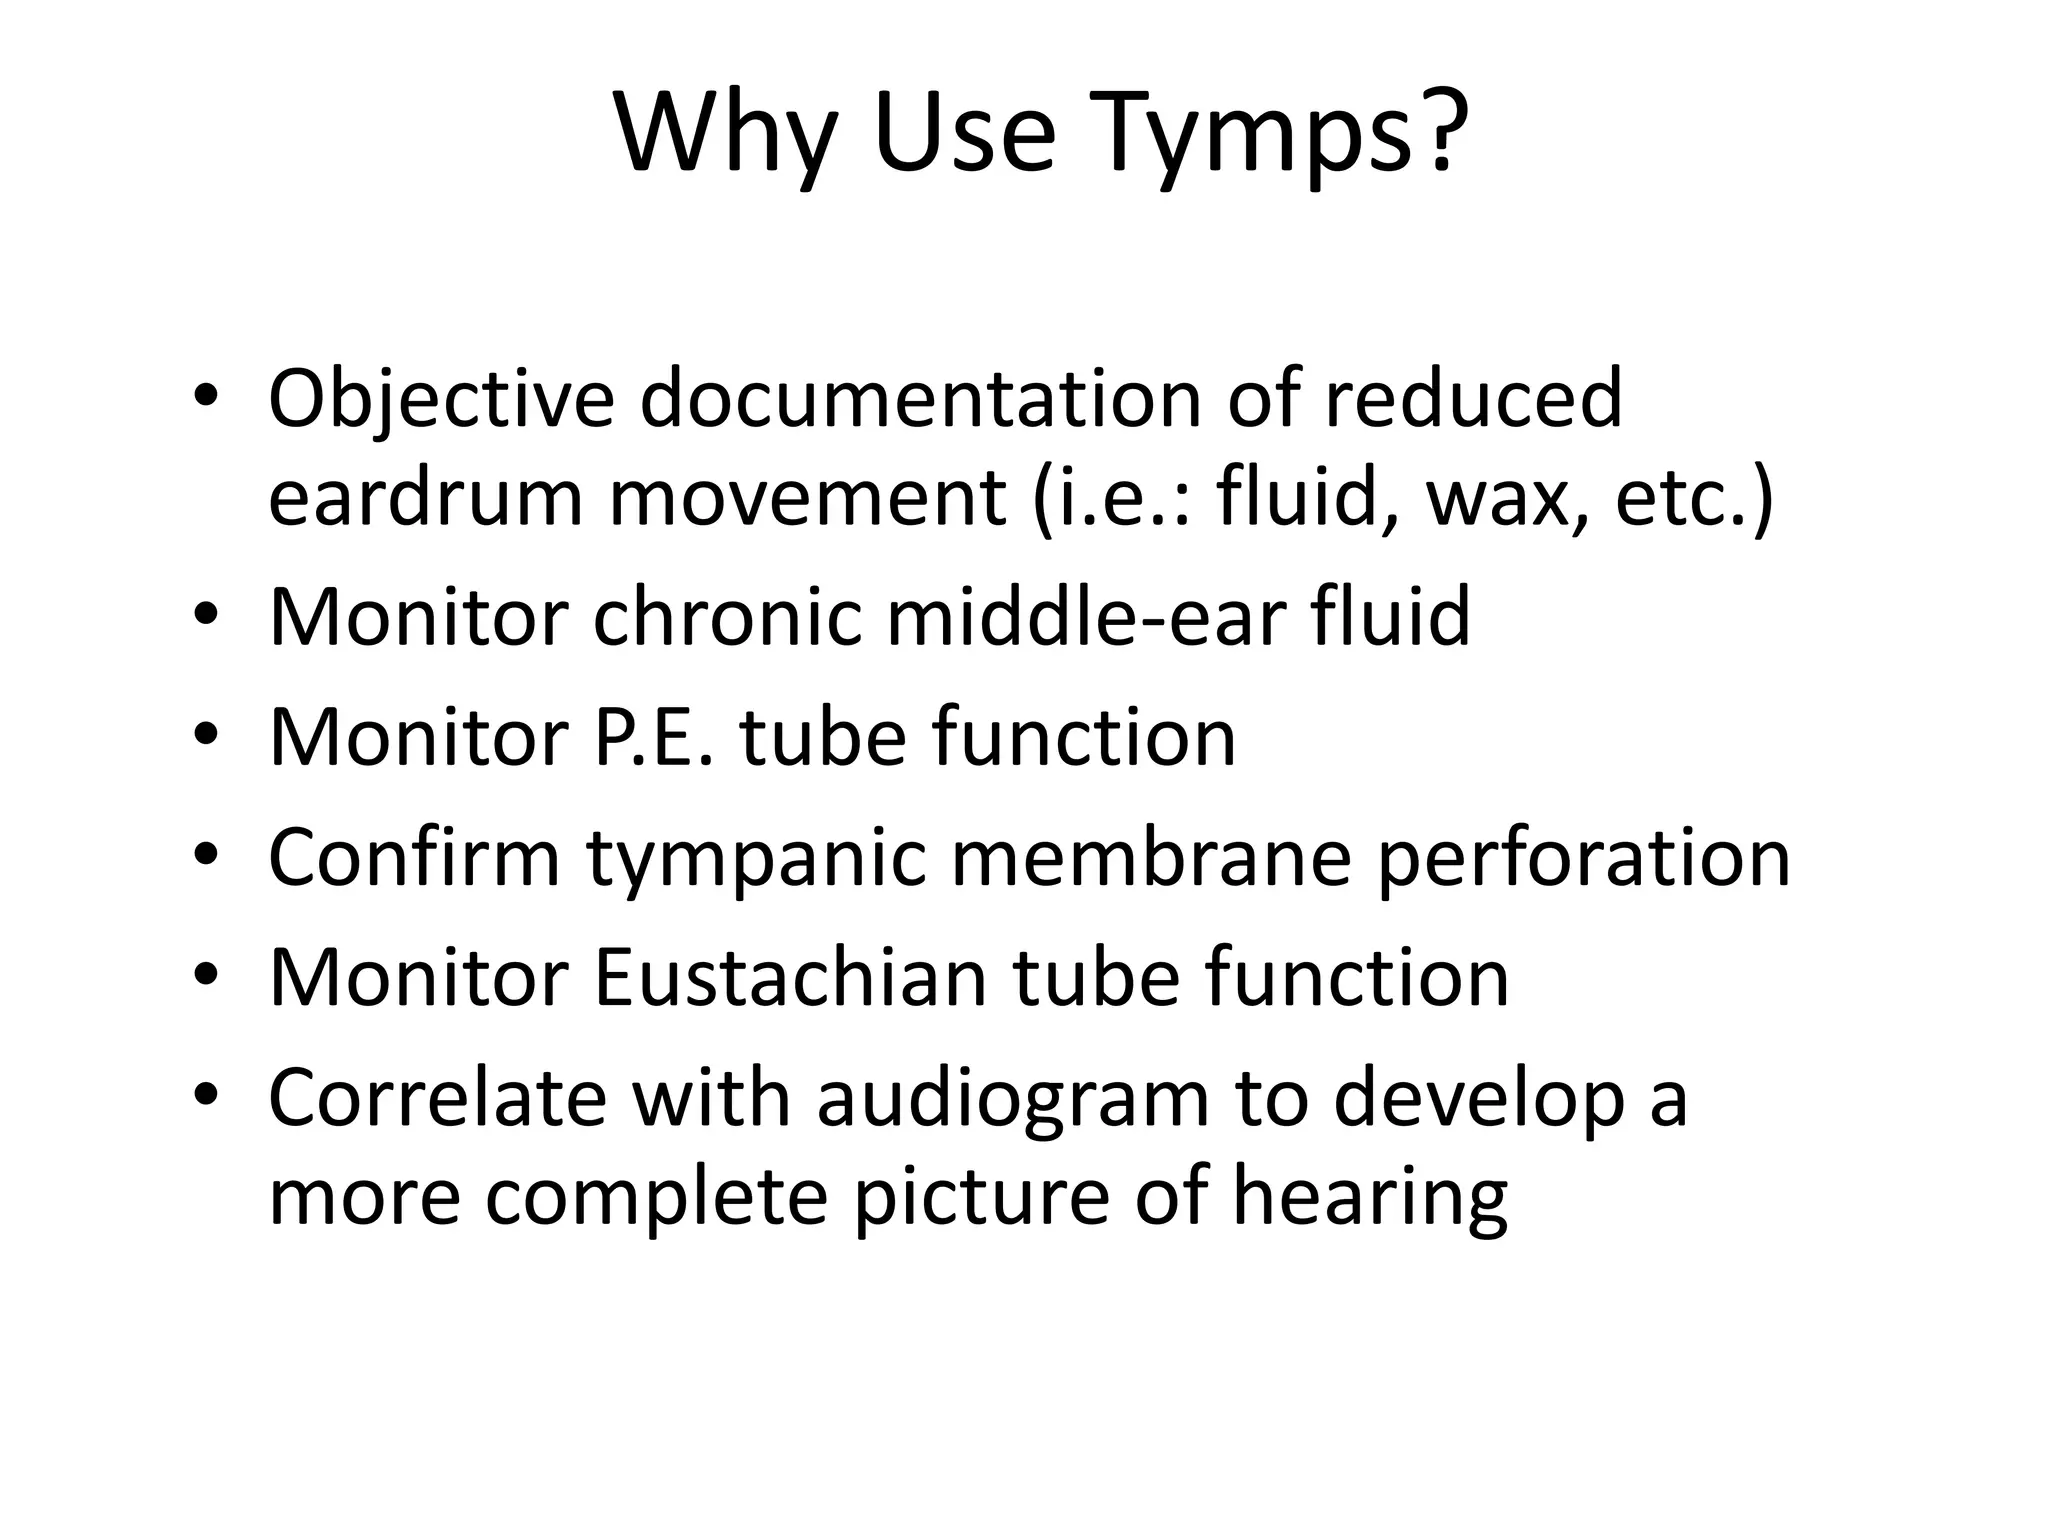
Tympanometry
Test of Middle Ear
BY
Daniel Akhtar
(Consultant Audiologist)
Tympanometry
• Objective measure of the middle-ear system
• “Not a hearing test”
• Graphic representation of ear compliance in
relation to the pressurization of the ear canal
• Objectively demonstrate the mechanical-acoustic
characteristics of the outer and middle ear
• Measures the ease in which energy flows through
the system
Tympanometry
• A probe is inserted in the ear canal that contains
a loudspeaker, a microphone, and a pump.
• A tone (226Hz) is delivered into the ear while the
pressure is changed within the sealed canal.
• Measurement taken at the probe - plots the
flexibility of the TM and the ossicles.
• Plot is displayed in a graph called the
tympanogram
So the Tympanogram tells us….
• Middle-ear pressure
(normally equal to
atmospheric pressure)
• Ear canal volume
• Compliance of middle-ear
system (eardrum
movement)
-300 -200 -100 0 +100
Pressure ( daPa )
1,2
2,0
1,6
0,8
0,4
0
Compliance(ml)
Tympanogram
(normal curve area is hatched)
Tympanogram
• Shape of the tracing gives
diagnostic information
regarding the function of
the middle ear
• “Normal” middle ear
function is a range
represented by the box
• The tracing is interpreted
and labeled as a type – A,
B, C
Sample Normative Data
Children
(age 3-5yrs)
PeakComp
(cc)
EarCanalVol
(cc)
TympWidth/ Gradient
(daPa)
mean 0.5 0.7 100
90%range 0.2-0.9 0.4-1.0 60-100
Adults
mean 0.8 1.1 80
90%range 0.3-1.4 0.6-1.5 50-100
Data above from Margolis and Heller (1987)
Pressure typically considered normal in the range of
-150 to +25 daPa
Types of Tympanograms
• Normal middle ear pressure
• Normal eardrum movement
• Normal ear canal volume
Example:
 Normal middle ear
Type A
• Reduced Compliance
• Normal Middle-ear pressure
• Normal ear canal volume
Example:
 Fixation of ossicles
 Scarring on TM
Type As
Type Ad
• Increased compliance
• Normal middle-ear pressure
• Normal ear canal volume
Example:
 Disarticulation of ossicles,
Monomeric tympanic
membrane
• “Flat”
• No compliance or pressure
peak indicated
• Normal ear canal volume
Example:
 Middle-ear fluid
Type B (normal volume)
• “Flat”
• No compliance or pressure
peak indicated
• Increased ear canal volume
Example:
 Perforated TM
 Patent P.E. Tubes
Type B (increased volume)
• “Flat”
• No compliance or pressure
peak indicated
• Decreased ear canal volume
Example:
 Occluding Wax
 Probe up against canal
wall??
Type B (decreased volume)
Type C
• Excessive negative middle-ear
pressure
• Normal or reduced compliance
• Normal ear canal volume
Example:
 Eustachian tube dysfunction,
initiation or resolution of middle-
ear fluid
 “Sniffling” children
The Infant Ear
• The anatomy of the infant ear is different to
the adult ear.
– Size of outer ear, middle ear and mastoid
– Mass changes of the middle ear due to bone
density, and mesenchyme (a tissue found in
organisms during development)
– Change of the membrane system
– Formation of the bony ear canal wall.
– Changes in Ossicular joints
Infant Ear continued…
• The infant ear is mass dominated.
• The infant ear has a lower resonance frequency, therefore
lower probe tones create complex patterns and more
notching.
• Classification scheme not consistent with pathology
» Example, Type A recorded with effusion
• Using a 1000Hz probe tone is optimal.
So for infants under 7 months….
• Using a 1000Hz probe-tone is optimal
– More consistent with Middle-Ear Effusion
• Look for any discernable peak
Advantages of Tympanometry
• Objective measure of middle-ear function
• Fast & Easy to perform
• Requires no response from the patient
• Can be performed on all ages, infant to adult
Why Use Tymps?
• Objective documentation of reduced
eardrum movement (i.e.: fluid, wax, etc.)
• Monitor chronic middle-ear fluid
• Monitor P.E. tube function
• Confirm tympanic membrane perforation
• Monitor Eustachian tube function
• Correlate with audiogram to develop a
more complete picture of hearing
THANK YOU

Tympanometry

  • 1.
    Tympanometry Test of MiddleEar BY Daniel Akhtar (Consultant Audiologist)
  • 2.
    Tympanometry • Objective measureof the middle-ear system • “Not a hearing test” • Graphic representation of ear compliance in relation to the pressurization of the ear canal • Objectively demonstrate the mechanical-acoustic characteristics of the outer and middle ear • Measures the ease in which energy flows through the system
  • 3.
    Tympanometry • A probeis inserted in the ear canal that contains a loudspeaker, a microphone, and a pump. • A tone (226Hz) is delivered into the ear while the pressure is changed within the sealed canal. • Measurement taken at the probe - plots the flexibility of the TM and the ossicles. • Plot is displayed in a graph called the tympanogram
  • 4.
    So the Tympanogramtells us…. • Middle-ear pressure (normally equal to atmospheric pressure) • Ear canal volume • Compliance of middle-ear system (eardrum movement) -300 -200 -100 0 +100 Pressure ( daPa ) 1,2 2,0 1,6 0,8 0,4 0 Compliance(ml) Tympanogram (normal curve area is hatched)
  • 5.
    Tympanogram • Shape ofthe tracing gives diagnostic information regarding the function of the middle ear • “Normal” middle ear function is a range represented by the box • The tracing is interpreted and labeled as a type – A, B, C
  • 6.
    Sample Normative Data Children (age3-5yrs) PeakComp (cc) EarCanalVol (cc) TympWidth/ Gradient (daPa) mean 0.5 0.7 100 90%range 0.2-0.9 0.4-1.0 60-100 Adults mean 0.8 1.1 80 90%range 0.3-1.4 0.6-1.5 50-100 Data above from Margolis and Heller (1987) Pressure typically considered normal in the range of -150 to +25 daPa
  • 7.
  • 8.
    • Normal middleear pressure • Normal eardrum movement • Normal ear canal volume Example:  Normal middle ear Type A
  • 9.
    • Reduced Compliance •Normal Middle-ear pressure • Normal ear canal volume Example:  Fixation of ossicles  Scarring on TM Type As
  • 10.
    Type Ad • Increasedcompliance • Normal middle-ear pressure • Normal ear canal volume Example:  Disarticulation of ossicles, Monomeric tympanic membrane
  • 11.
    • “Flat” • Nocompliance or pressure peak indicated • Normal ear canal volume Example:  Middle-ear fluid Type B (normal volume)
  • 12.
    • “Flat” • Nocompliance or pressure peak indicated • Increased ear canal volume Example:  Perforated TM  Patent P.E. Tubes Type B (increased volume)
  • 13.
    • “Flat” • Nocompliance or pressure peak indicated • Decreased ear canal volume Example:  Occluding Wax  Probe up against canal wall?? Type B (decreased volume)
  • 14.
    Type C • Excessivenegative middle-ear pressure • Normal or reduced compliance • Normal ear canal volume Example:  Eustachian tube dysfunction, initiation or resolution of middle- ear fluid  “Sniffling” children
  • 15.
    The Infant Ear •The anatomy of the infant ear is different to the adult ear. – Size of outer ear, middle ear and mastoid – Mass changes of the middle ear due to bone density, and mesenchyme (a tissue found in organisms during development) – Change of the membrane system – Formation of the bony ear canal wall. – Changes in Ossicular joints
  • 16.
    Infant Ear continued… •The infant ear is mass dominated. • The infant ear has a lower resonance frequency, therefore lower probe tones create complex patterns and more notching. • Classification scheme not consistent with pathology » Example, Type A recorded with effusion • Using a 1000Hz probe tone is optimal.
  • 17.
    So for infantsunder 7 months…. • Using a 1000Hz probe-tone is optimal – More consistent with Middle-Ear Effusion • Look for any discernable peak
  • 18.
    Advantages of Tympanometry •Objective measure of middle-ear function • Fast & Easy to perform • Requires no response from the patient • Can be performed on all ages, infant to adult
  • 19.
    Why Use Tymps? •Objective documentation of reduced eardrum movement (i.e.: fluid, wax, etc.) • Monitor chronic middle-ear fluid • Monitor P.E. tube function • Confirm tympanic membrane perforation • Monitor Eustachian tube function • Correlate with audiogram to develop a more complete picture of hearing
  • 20.