The document compares techniques for handling incomplete data when using decision trees. It investigates the robustness and accuracy of seven popular techniques when applied to different proportions, patterns and mechanisms of missing data in 21 datasets. The techniques include listwise deletion, decision tree single imputation, expectation maximization single imputation, mean/mode single imputation, and multiple imputation. The results suggest important differences between the techniques, with multiple imputation and decision tree single imputation generally performing better than the others. The choice of technique depends on factors like the amount and nature of the missing data.

![or unobserved for any number of reasons) is an important issue for classifier learning since incomplete
data in either the training data or test (unknown) data may not only impact interpretations of the data or
the models created from the data but may also affect the prediction accuracy of learned classifiers. Rates
of less than 1% missing data are generally considered trivial, 1-5% manageable. However, 5-15% require
sophisticated methods to handle, and more than 15% may severely impact any kind of interpretation
[Pyle, 1999].
There are two common solutions to the problem of incomplete data that are currently applied by
researchers. The first includes omitting the instances having missing values (i.e. listwise deletion),
which does not only seriously reduce the sample sizes available for analysis but also ignores the
mechanism causing the missingness. The problem with a smaller sample size is that it gives greater
possibility of a non-significant result, i.e., the larger the sample the greater the statistical power of the
test. The second solution imputes (or estimate) missing values from the existing data. The major
weakness of single imputation methods is that they underestimate uncertainty and so yield invalid tests
and confidence intervals, since the estimated values are derived from the ones actually present [Little
and Rubin, 1987].
The two most common tasks when dealing with missing values, thus, choosing a missing data
technique, are to investigate the pattern and mechanism of missingness to get an idea of the process that
could have generated the missing data, and to produce sound estimates of the parameters of interest,
despite the fact that the data are incomplete. In other words, the potential impact missing data can have
is dependent on the pattern and mechanism leading to the nonresponse. In addition, the choice of how to
deal with missing data should also be based on the percentage of data that are missing and the size of
the sample.
Robustness has twofold meaning in terms of dealing with missing values when using decision trees.
The toleration of missing values in training data is one, and the toleration of missing data in test data is
the other. Although the problem of incomplete data has been treated adequately in various real world
datasets, there are rather few published works or empirical studies concerning the task of assessing
learning and classification accuracy of missing data techniques (MDTs) using supervised ML
algorithms such as decision trees [Breiman et al., 1984; Quinlan, 1993].
The following section briefly discusses missing data patterns and mechanisms that lead to the
introduction of missing values in datasets. Section 3 presents details of seven MDTs that are used in this
paper. Section 4 empirically evaluates the robustness and accuracy of the eight MDTs on twenty one
machine learning domains. We close with a discussion and conclusions, and then directions for future
research.
2. PATTERNS AND MECHANISMS OF MISSING DATA
The pattern simply defines which values in the data set are observed and which are missing. The three
most common patterns of nonresponse in data are univariate, monotonic and arbitrary. When missing
values are confined to a single variable we have a univariate pattern; monotonic pattern occurs if a
subject, say Y j , is missing then the other variables, say Yj 1 ,..., Yp , are missing as well or when the data
matrix can be divided into observed and missing parts with a “staircase” line dividing them; arbitrary
patterns occur when any set of variables may be missing for any unit.
2](https://image.slidesharecdn.com/twala2007doc2204/85/Twala2007-doc-2-320.jpg)
![The law generating the missing values seems to be the most important task since it facilitates how the
missing values could be estimated more efficiently. If data are missing completely at random (MCAR) or
missing at random (MAR), we say that missingness is ignorable. For example, suppose that you are
modelling software defects as a function of development time. If missingness is not related to the missing
values of defect rate itself and also not related on the values of development time, such data is considered
to be MCAR. For example, there may be no particular reason why some project managers told you their
defect rates and others did not. Furthermore, software defects may not be identified or detected due to a
given specific development time. Such data are considered to be MAR. MAR essentially says that the
cause of missing data (software defects) may be dependent on the observed data (development time) but
must be independent of the missing value that would have been observed. It is a less restrictive model
than MCAR, which says that the missing data cannot be dependent on either the observed or the missing
data. MAR is also a more realistic assumption for data to meet, but not always tenable. The more relevant
and related attributes one can include in statistical models, the more likely it is that the MAR assumption
will be met. For data that is informatively missing (IM) or not missing at random (NMAR) then the
mechanism is not only non-random and not predictable from the other variables in the dataset but cannot
be ignored, i.e., we have non ignorable missingness [Little and Rubin, 1987; Schafer, 1997]. In contrast
to the MAR condition outlined above, IM arise when the probability that defect rate is missing depends
on the unobserved value of defect rate itself. For example, software project managers may be less likely
to reveal projects with high defect rates. Since the pattern of IM data is not random, it is not amenable to
common MDTs and there are no statistical means to alleviate the problem.
MCAR is the most restrictive of the three conditions and in practice it is usually difficult to meet the
MCAR assumption. Generally you can test whether MCAR conditions can be met by comparing the
distribution of the observed data between the respondents and non-respondents. In other words, data can
provide evidence against MCAR. However, data cannot generally distinguish between MAR and IM
without distributional assumptions, unless the mechanisms is well understood. For example, right
censoring (or suspensions) is IM but is in some sense known. An item, or unit, which is removed from a
reliability test prior to failure or a unit which is in the field and is still operating at the time the
reliability of these units is to be determined is called a suspended item or right censored instance.
3. DECISION TREES AND MISSING DATA TECHNIQUES
Decision trees (DTs) are one of the most popular approaches for both classification and regression type
predictions. They are generated based on specific rules. A DT is a classifier in a tree structure. A leaf
node is the outcome obtained and it is computed with respect to the existing attributes. A decision node is
based on an attribute, which branches for each possible outcome for that attribute. One approach to create
a DT is to use the entropy, which is a fundamental quantity in information theory. The entropy value
determines the level of uncertainty. The degree of uncertainty is related to the success rate of predicting
the result. Often the training dataset used for constructing a DT may not be a proper representative of the
real-life situation and may contain noise and the DT is said to over-fit the training data. To overcome the
over-fitting problem DTs use a pruning strategy that minimizes the output variable variance in the
validation data by not only selecting a simpler tree than the one obtained when the tree building
algorithm stopped, but one that is equally as accurate for predicting or classifying "new" instances.
3](https://image.slidesharecdn.com/twala2007doc2204/85/Twala2007-doc-3-320.jpg)

![the instance, then the best guess is used in place of the missing value. 2.) In the M-step, once all the
sums have been collected, the covariance matrix can simply be calculated. This two step process
continues until the change in covariance matrix from one iteration to the next becomes trivially small.
Details of the EM algorithm for covariance matrices are given in [Dempter et al., 1977; Little and
Rubin, 1987]. EM requires that data are MAR. As mentioned earlier, the EM algorithm (and its
simulation cased variants) could be utilised to impute only a single value for each missing value, which
from now on we shall call EM single imputation (EMSI). The single imputations are drawn from the
predictive distribution of the missing data given the observed data and the EM estimates for the model
parameters. A DT is then grown using the complete dataset. The tree obtained depends on the values
imputed.
3.2.1.3 Mean or Mode
Mean or more single imputation (MMSI) is one of the most common and extremely simple method of
imputation of missing values. In MMSI, whenever a value is missing for one instance on a particular
attribute, the mean (for a continuous or numerical attribute) or modal value (for a nominal or categorical
attribute), based on all non-missing instances, is used in place of the missing value. Although this
approach permits the inclusion of all instances in the final analysis, it leads to invalid results. Use of
MMSI will lead to valid estimates of mean or modal values from the data only if the missing value are
MCAR, but the estimates of the variance and covariance parameters (and hence correlations, regression
coefficients, and other similar parameters) are invalid because this method underestimates the
variability among missing values by replacing them with the corresponding mean or modal value. In
fact, the failure to account for the uncertainty behind imputed data seems to be the general drawback for
single imputation methods
3.2.2 Multiple Imputation
Multiple imputation (MI) is one of the most attractive methods for general purpose handling of missing
data in multivariate analysis. Rubin (1987) described MI as a three-step process. First, sets of plausible
values for missing instances are created using an appropriate model that reflects the uncertainty due to
the missing data. Each of these sets of plausible values can be used to “fill-in” the missing values and
create a “completed” dataset. Second, each of these datasets can be analyzed using complete-data
methods. Finally, the results are combined. For example, replacing each missing value with a set of five
plausible values or imputations would result to building five DTs, and the predictions of the five trees
would be averaged into a single tree, i.e., the average tree is obtained by multiple imputation.
There are various ways to generate imputations. Schafer (1997) has written a set of general purpose
programs for MI of continuous multivariate data (NORM), multivariate categorical data (CAT), mixed
categorical and continuous (MIX), and multivariate panel or clustered data (PNA). These programs
were initially created as functions operating within the statistical languages S and SPLUS [SPLUS,
2003]. NORM includes and EM algorithm for maximum likelihood estimation of means, variance and
covariances. NORM also adds regression-prediction variability by a procedure known as data
augmentation [Tanner and Wong, 1987]. Although not absolutely necessary, it is almost always a good
idea to run the EM algorithm before attempting to generate MIs. The parameter estimates from EM
provide convenient starting values for data augmentation (DA). Moreover, the convergence behaviour
5](https://image.slidesharecdn.com/twala2007doc2204/85/Twala2007-doc-5-320.jpg)
![of EM provides useful information on the likely convergence behaviour of DA. This is the approach we
follow in this paper, which we shall for now on call EMMI.
3.3 Machine Learning Techniques
ML algorithms have been successfully used to handling incomplete data. The ML techniques
investigated in this paper involve the use of decision trees [Breiman et al., 1984; Quinlan, 1993]. These
non-parametric techniques deal with missing values during the training (learning) or testing
(classification) process. A well-known benefit of nonparametric methods is their ability to achieve
estimation optimality for any input distribution as more data are observed, a property that no model
with a parametric assumption can have. In addition, tree-based models do not make any assumptions on
the distributional form of data and do not require a structured specification of the model, and thus not
influenced by data transformation, nor are they influenced by outliers [Breiman et al., 1984].
3.3.1 Fractional Cases
Quinlan (1993) borrows the probabilistic complex approach by Cestnik et al., (1987) by “fractioning”
cases or instances based on a priori probability of each value determined from the cases at that node that
have specified values. Quinlan starts by penalising the information gain measure by the proportion of
unknown cases and then splits these cases to both subnodes of the tree.
The learning phase requires that the relative frequencies from the training set be observed. Each case of,
say, class C with an unknown attribute value A is substituted. The next step is to distribute the unknown
examples according to the proportion of occurrences in the known instances, treating an incomplete
observation as if it falls down all subsequent nodes. For example, if an internal node t has ten known
examples (six examples with t L and four with t R ), then we would say the probability of t L = 0.6, and
the probability of t R is 0.4. Hence, a fraction of 0.6 of instance x is distributed down the branch for t L
and a fraction 0.4 of instance x to t R . This is carried out throughout the tree construction process. The
evaluation measure is weighted with the fraction of known values to take into account that the
information gained from that attribute will not always be available (but only in those cases where the
attribute value is known). During training, instance counts used to calculate the evaluation heuristic
include the fractional counts of instances with missing values. Instances with multiple missing values can
be fractioned multiple times into numerous smaller and smaller “portions”.
For classification, Quinlan (1993)‟s technique is to explore all branches below the node in question and
then take into account that some branches are more probable than others. Quinlan further borrows
Cestnik et al.‟s strategy of summing the weights of the instance fragments classified in different ways at
the leaf nodes of the tree and then choosing the class with the highest probability or the most probable
classification. Basically, when a test attribute has been selected, the cases with known values are divided
on the branches corresponding to these values. The cases with missing values are, in a way, passed down
all branches, but with a weight that corresponds to the relative frequency of the value assigned to a
branch. Both strategies for handling missing attribute values are used for the C4.5 system.
Despite its strengths, the fractional cases technique can be quite a slow, computationally intensive
process because several branches must do the calculation simultaneously. So, if K branches do the
6](https://image.slidesharecdn.com/twala2007doc2204/85/Twala2007-doc-6-320.jpg)


![each missing value at each iteration) nearly always converges in fewer iterations than EM. Therefore, EM
estimates of the parameters were computed and then recorded the number of iterations required, say t.
Then, we performed a single run of data augmentation algorithm of length tM using the EM estimates as
starting values, where M is the number of imputations required. The convergence of the EM algorithm is
linear and is determined by the fraction of missing information. Thus, when the fraction of missing
information was large, convergence was very slow due to the number of iterations required. However, for
small missing value proportions convergence was obtained much more rapidly with less strenuous
convergence criteria. We used the completed datasets from iterations 2t, 4t, …, 2Mt. In our experiments
we used MI with M=5, and averaged the predictions of the 5 resulting trees.
Due to the limit of the dynamic memory in S-PLUS for Windows [S-PLUS, 2003] when using the EM
approach, all the big datasets were partitioned into subsets, and S-PLUS run on one subset at a time.
Our partitioning strategy was to put variables with high correlations with close scales (for continuous
attributes) into the same subset. This strategy made the convergence criteria in the iterative methods
easier to set up and very likely to produce more accurate results. The number of attributes in each subset
depended on the number of instances and the number of free parameters to be estimated in the model,
which included cell probabilities, cell means and variance-covariances. The number of attributes in each
subset was determined in such a way that the size of the data matrix and the dynamic memory
requirement was under the S-PLUS limitation and the number of instances was large relative to the
number of free parameters. Separate results from each subset were then averaged to produce an
approximate EM-based method which are substituted for (and continue to call) EM in our investigation.
To measure the performance of methods, the training set/test set methodology is employed. For each
run, each dataset is split randomly into 80% training and 20% testing, with different percentages of
missing data (0%, 15%, 30%, and 50%) in the covariates for both the training and testing sets. A
classifier was built on the training data and the predicted accuracy is measured by the smoothed error
rate of the tree, and was estimated on the test data.
Trees on complete training data were grown using the Tree function in S-PLUS [Becker et al., 1988,
Venables and Ripley, 1994]. The function uses the GINI index of impurity [Breiman et al., 1984] as a
splitting rule and cross validation cost-complexity pruning as pruning rule. Accuracy of the tree, in the
form of a smoothed error rate, was predicted using the test data.
4. EXPERIMENTS
4.1. Experimental Set-Up
The objective of this paper is to investigate the robustness and accuracy of methods for tolerating
incomplete data using tree-based models. This section describes experiments that were carried out in
order to compare the performance of the different approaches previously proposed for handling missing
values in both the training set and test (unseen) set. The effects of different proportions of missing
values when building or learning the tree (training) and when classifying new instances (testing) are
further examined, experimentally. Finally, the impact of the nature of different missing data
mechanisms on the classification accuracy of resulting trees is examined. A combination of small and
large datasets, with a mixture of both nominal and numerical attribute variables, was used for these
9](https://image.slidesharecdn.com/twala2007doc2204/85/Twala2007-doc-9-320.jpg)

![quintile was estimated. Then all the instances were examined and whenever the A X attribute has a value
lower than the 2k quintile a missing value on A Y is imputed with probability 0, and 1 otherwise. More
formally, P(AY miss | A X 2k) 0 or P(AY miss | A X 2k) 1 . This technique generates a missing value
template which is then multiplied with A Y . Once again, the attribute chosen to have missing values was
the one highly correlated with the class variable. Here, the same levels of missing values are kept. For
multi-attributes, different pairs of attributes were used to generate the missingness. Each attribute is
paired with the one it is highly correlated to. For example, to generate missingness in half of the attributes
for a dataset with, say, 12 attributes (i.e., A1 ,... A 12 ) , the pairs (A1 , A 2 ) , (A3 , A 4 ) and (A5 , A 6 ) could be
utilised. We assume that A1 is highly correlated with A 2 ; A 3 highly correlated with A 4 , and so on.
In contrast to the MAR situation outlined above where data missingness is explainable by other measured
variables in a study, IM data arise due to the data missingness mechanism being explainable, and only
explainable by the very variable(s) on which the data are missing. For conditions with data IM, a
procedure identical to MAR was implemented. However, for the former, the missing values template was
created using the same attribute variable for which values are deleted in different proportions.
For consistency, missing values were generated on the same attributes for each of the three missing data
mechanisms. This was done for each dataset. For split selection, the impurity approach was used. For
pruning, a combination of 10-fold cross validation cost complexity pruning and 1 Standard Error (1-SE)
rule (Breiman et al. 1984) to determine the optimal value for the complexity parameter was used. The
same splitting and pruning rules when growing the tree were carried out for each of the twenty one
datasets.
It was reasoned that the condition with no missing data should be used as a baseline and what should be
analysed is not the error rate itself but the increase or excess error induced by the combination of
conditions under consideration. Therefore, for each combination of method for handling incomplete
data, the number of attributes with missing values, proportion of missing values, and the error rate for
all data present was subtracted from each of the three different proportions of missingness. This would
be the justification for the use of differences in error rates analysed in some of the experimental results.
All statistical tests were conducted using the MINITAB statistical software program (MINITAB, 2002).
Analyses of variance, using the general linear model (GLM) procedure [Kirk, 1982] were used to
examine the main effects and their respective interactions. This was done using a 4-way repeated
measures designs (where each effect was tested against its interaction with datasets). The fixed effect
factors were the: missing data techniques; number of attributes with missing values (missing data
patterns); missing data proportions; and missing data mechanisms. A 1% level of significance was used
because of the many number of effects. The twenty one datasets used were used to estimate the
smoothed error. Results were averaged across five folds of the cross-validation process before carrying
out the statistical analysis. The averaging was done as a reduction in error variance benefit. A summary
of all the main effects and their respective interactions are provided in the Appendix in the form of
Analysis of Variance (ANOVA) table.
11](https://image.slidesharecdn.com/twala2007doc2204/85/Twala2007-doc-11-320.jpg)
![4.2. Datasets
This section describes the twenty one datasets that were used in the experiments to explore the impact
of missing values on the classification accuracy of resulting decision trees. All twenty one datasets were
obtained from the Machine Learning Repository maintained by the Department of Information and
Computer Science at the University of California at Irvine [Murphy and Aha, 1992]. They are
summarized in Table 1.
Table 1 Datasets used for the experiments
Attributes
Dataset Instances Classes
Ordered Nominal
Two classes:
german 1000 7 13 2
glass (G2) 163 9 0 2
heart-statlog 270 13 0 2
ionosphere 351 31 1 2
kr-vs-kp 3196 0 36 2
labor 57 8 8 2
pima-indians 768 8 0 2
sonar 208 60 0 2
More than two classes:
balance scale 625 4 0 3
iris 150 4 0 3
waveform 5000 40 0 3
lymphography 148 3 15 4
vehicle 846 18 0 4
anneal 898 6 32 5
glass 214 9 0 6
satimage 6435 36 0 6
image 2310 19 0 7
zoo 101 1 15 7
LED 24 1500 0 24 10
vowel 990 10 3 11
letter 20000 16 0 26
The first eight involve datasets with only two classes and the last thirteen involve datasets with more
than two classes.
As shown in Table 1, the selected twenty one datasets cover a comprehensive range for each of the
following characteristics:
the size of datasets, expressed in terms of the number of instances ranges between 57 and
20000
the number of attributes ranges between 4 and 6
12](https://image.slidesharecdn.com/twala2007doc2204/85/Twala2007-doc-12-320.jpg)

![statistical power of hypothesis tests. This may also result in misleading conclusions drawn from a
research study and limit generalizability of the research findings.
Significant advances have been made in the past few decades regarding methodologies which handle
responses to problems and biases which can be caused by incomplete data. Unfortunately, these
methodologies are often not available to many researchers for a variety of reasons (for example, lack of
familiarity, computational challenges) and researchers often resort to ad-hoc approaches to handling
incomplete data, ones which may ultimately do more harm than good [Little and Rubin, 1987; Schafer
and Graham, 2002]. Several researchers have examined various techniques to solve the problem of
incomplete data. One popular approach includes discarding instances with missing values and
restricting the attention to the completely observed instances, which is also known as listwise deletion
(LD). This is the default in commonly used statistical packages [Little and Rubin, 1987]. Another
common way uses imputation (estimation) approaches that fill in a missing value with an efficient
single replacement value, such as the mean, mode, hot deck (using data from other observations in the
sample at hand), and approaches that take advantage of multivariate regression and k-nearest neighbour
models. Another technique for treating incomplete data is to model the distribution of incomplete data
and estimate the missing values based on certain parameters. Specific results are discussed below.
Lakshminarayan et al. (1999) performed a simulation study comparing two ML methods for missing
data imputation. Their results show that for the single imputation task, the supervised learning
algorithm C4.5 [Quinlan, 1993], which utilizes the fractional cases (FC) strategy, performed better than
Autoclass [Cheeseman et al., 1988], a strategy based on unsupervised Bayesian probability. For the
multiple imputation (MI) task, both methods perform comparably.
Kalousis and Hilario (2000) evaluated seven classification algorithms with respect to missing values: two
rule inducers (C5.0-rules and Ripper), one nearest neighbour method, one orthogonal (C5.0-tree), one
oblique decision tree algorithm, a naïve Bayes algorithm and a linear discriminant. Various patterns and
mechanisms of missingness (MCAR and MAR) in current complete datasets were simulated. Their
results indicate that naïve Bayes (NB) is most resilient to missing values while the k-nearest neighbour
single imputation (kNNSI) and FC are more sensitive to missing values. Their results further show that
for a given proportion of missing values, the distribution of missing values among attributes is at least as
important as the mechanism of missingness.
Another comparative study of LD, MMSI, similar response pattern imputation (SRPI) and full
information maximum likelihood (FIML) in the context of software cost estimation was carried out by
Myvreit et al. (2001). The simulation study was carried out using 176 projects. Their results show
FIML performing well for missing completely at random (MCAR) data. Also, LD, MMSI and SRPI are
shown to yield biased results for other missing data mechanisms other than MCAR.
Fujikawa and Ho (2002) evaluated theoretically several methods of dealing with missing values. The
methods evaluated were MMSI, linear regression, standard deviation method, kNNSI, DTSI, auto-
associative neural network, LD, lazy decision tree, FC and SVS. kNNSI and DTSI showed good results.
In terms of computation cost, MMSI and FC were found to be reasonably good.
Batista and Monard (2003) investigated the effects of four methods of handling missing data at different
proportions of missing values. There methods investigated were kNNSI, MMSI, and internal algorithms
used by FC and CN2 to treat missing data. Missing values were artificially simulated in different rates
17](https://image.slidesharecdn.com/twala2007doc2204/85/Twala2007-doc-17-320.jpg)
![and attributes into the datasets. kNNSI imputation showed a superior performance compared with MMSI
when missing values were in one attribute. However, both methods compared favourably when missing
values were in more than one attribute. Otherwise, FC achieved a performance as good as kNNSI.
Song and Shepperd (2004) evaluated kNNSI and class mean imputation (CMI) for different patterns and
mechanisms of missing data. Their results show kNNSI slightly outperforming CMI with the missing
data mechanisms having no impact on either of the two imputation methods.
Twala et al. (2005) evaluates the impact of seven MDTs (LD, EMSI, kNNSI, MMSI, EMMI, FC and
SVS) on 8 industrial datasets by artificially simulating three different proportions, two patterns and
three mechanisms of missing data. Their results show EMMI achieving the highest accuracy rates with
other notably good performances by methods such as FC and EMSI. The worst performance was by
LD. Their results further show MCAR data as easier to deal with compared with IM data. Twala (2005)
found missing values as more damaging when they are in the test sample than in the training sample.
According to the above studies, among the single imputation techniques, the results are not so clear,
especially for small amounts of missing data. However, the performance of each technique differs with
increases in the amount of missing data. Also, despite the fact that the LD procedure involves an
efficiency cost due to the elimination of a large amount of valuable data, most researchers have
continued to use it due to its simplicity and ease of use. There are other problems caused by using the
LD technique. For example, elimination of instances with missing information decreases the error
degrees of freedom in statistical tests such as the student t distribution. This decrease leads to reduced
statistical power (i.e. the ability of a statistical test to discover a relationship in a dataset) and larger
standard errors. Other researchers have shown that randomly deleting 10% of the data from each
attribute in a matrix of five attributes can easily result in eliminating 59% of instances from analysis
[Kim and Curry, 1977]. Furthermore, MI, which overcomes limitations of single imputation seem not to
have been widely adopted by researchers even though it has been shown to be flexible and software for
creating multiple imputations is available and some downloadable free of charge from the Methodology
Centre website at the Penn State University http://methodology.psu.edu/. A great deal of past research
on the effectiveness of MDTs to overcome missing data problems has utilized data that is missing
randomly. Finally, results from previous studies suggest that results achieved using simulated data are
very sensitive to the MAR assumption. Hence, if there is a reason to believe that if the MAR
assumption does not hold, alternative methods should be used.
The research questions asked which MDTs yielded the least amount of average error when using tree-
based models.
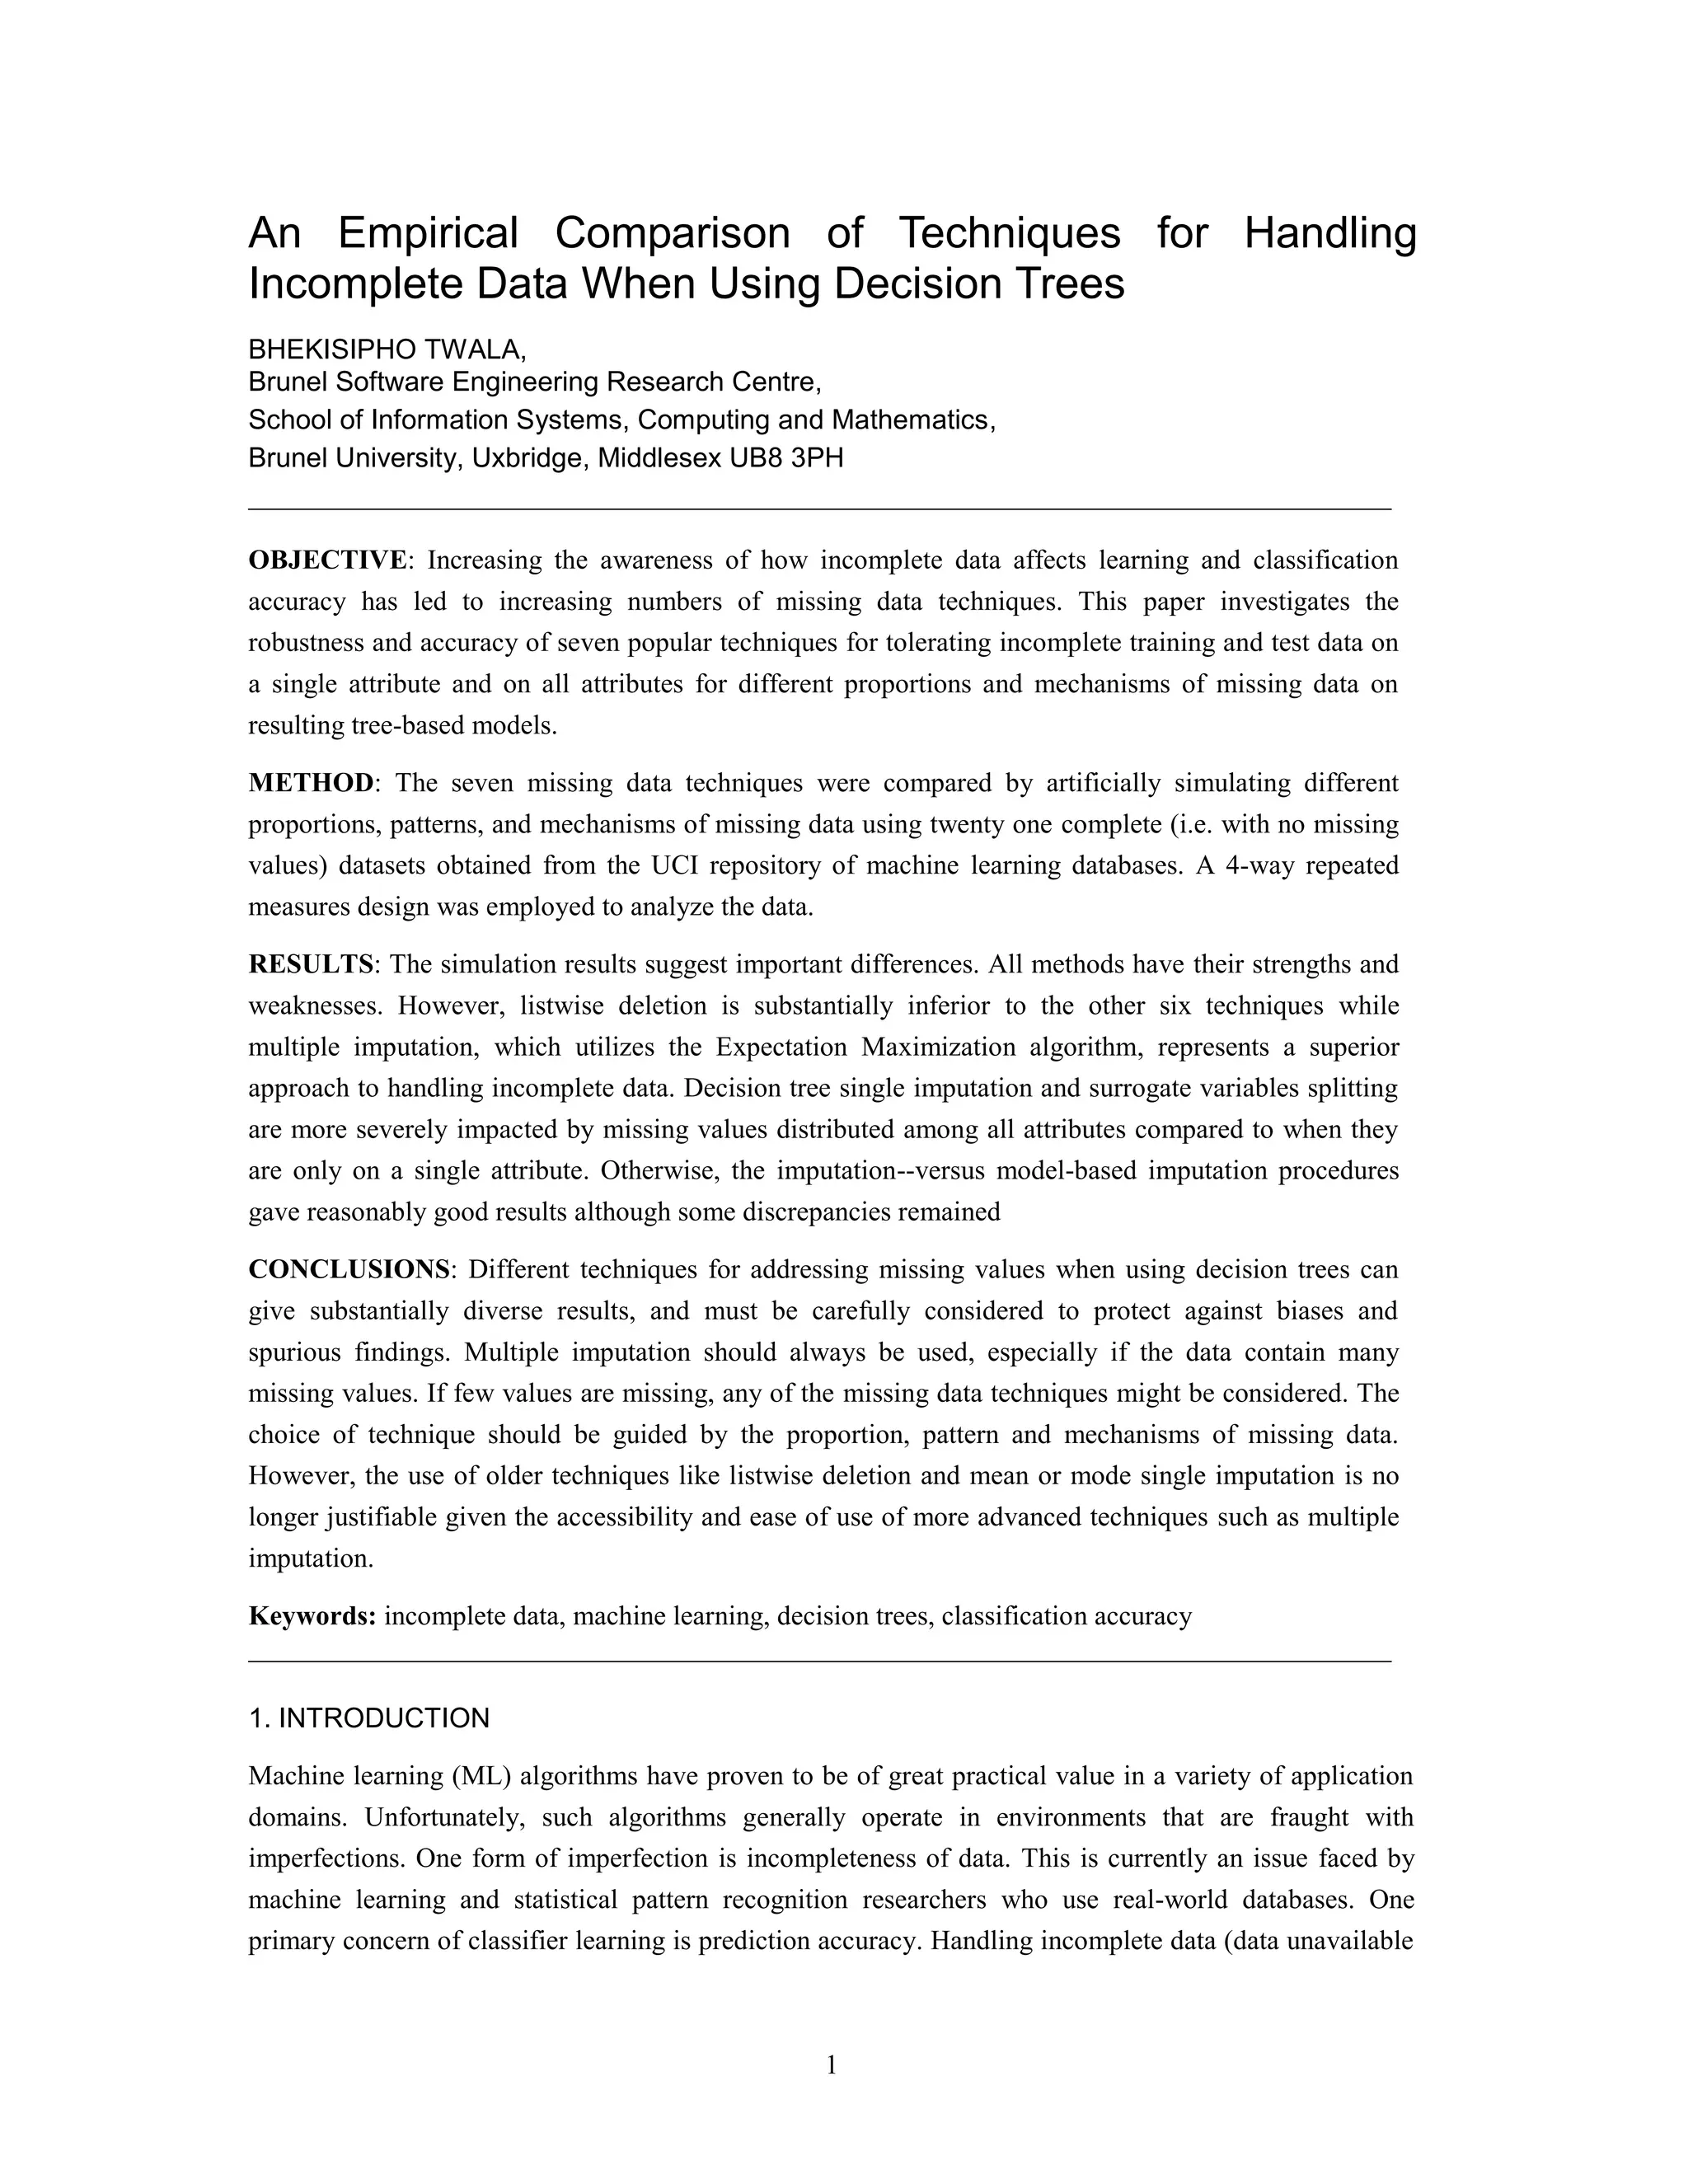
The results of the simulation study show that the proportion of missing data, the missing data
mechanism, the pattern of missing values, and the design of database characteristics (especially the type
of attributes) all have effects on the performance of any MDT.
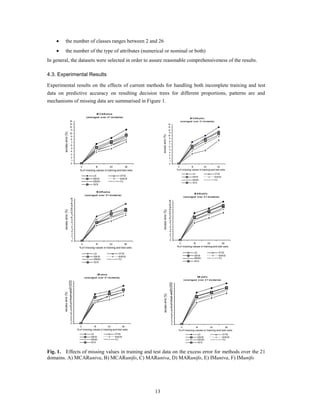
The effects of missing data have been found to adversely affect DT learning and classification
performance, and this effect is positively correlated with the increasing fractions of missing data.
Another point of discussion is the significance of having missing values in only one attribute, on the
one hand, and allowing missing values in all the attributes, on the other hand. The idea was to see the
impact of pattern over mechanism, or vice versa, at both lower levels and higher levels of missing
18](https://image.slidesharecdn.com/twala2007doc2204/85/Twala2007-doc-18-320.jpg)
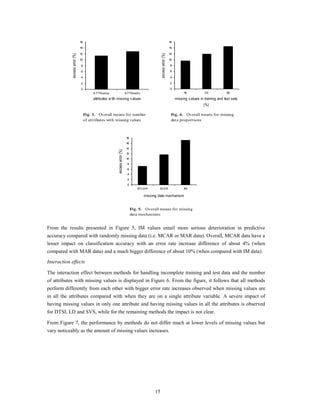
![values. Our results show the impact on the performance of methods being caused by the pattern and
mechanism of missing values, especially at lower levels of missingness. However, as the proportion of
missing values increases the major determining factor on the performance of methods is how the
missing values are distributed among attributes. All methods yield lower accuracy rates when missing
values are distributed among all the attributes (MCARunifo, MARunifo and IMunifo) compared with
when missing values are on a single attribute (MCARuniva, MARuniva and IMuniva).
The worse performance achieved by methods are for IM data, followed by MAR and MCAR data,
respectively. This is in accordance with statistical theory which considers MCAR easier to deal with
and IM data as very complex to deal with since it requires assumptions that cannot be validated from
the data at hand [Little and Rubin, 1987]. In addition, in many settings the MAR assumption is more
reasonable than the MCAR. In fact, an MAR method is valid if data are MCAR or MAR, but MCAR
methods are valid only if data are MCAR. This could have attributed to the superior performance of
EMMI (an MAR method) and the substantially inferior performance of LD (an MCAR method).
The results also show that the performance of methods depends on whether missing values are in the
test or training set or in both the training and test sets. Training methods appear to achieve superior
performances compared with testing methods. An explanation for such behaviour will be given later in
the section.
With this experimental set-up, it is easy to say with conviction that from the eight current techniques
investigated that EMMI is the overall best method for handling both incomplete training and test data.
However, there are competitors like FC and DTSI which performed reasonably well. One important
advantage of FC over DTSI is that it can handle missing values in both the training and test sets while
DTSI struggles as a technique for handling incomplete test data and when all attributes have missing
values. The heavily dependence of DTSI on strong correlations among attributes might have attributed
to its poor performance as correlations among attributes for some of the datasets were not strong.
However, DTSI performs better when missing values are on a single attribute – a very serious
restriction. The results also indicate that LD is the worst method for handling incomplete data. In
general, it can be seen that model-based methods have better performance than ad hoc methods.
Furthermore, probabilistic methods seem to outperform non-probabilistic methods.
There are several dimensions on which learning methods of handling incomplete data using tree-based
models can be compared. Also, combinations of methods for handling incomplete data while varying
the number of attributes with missing values were not tried. However, prediction accuracy rates of
estimation methods like the EMMI were very impressive. The improvement in accuracy of EMMI over
single imputation methods (CCSI, DTSI, EMSI and MMSI) and other methods (LD, SVS and FC)
could be as a result of a reduction in variance resulting from averaging the number of trees like is done
in bagging (Breiman, 1996). Even though EMMI emerges as the overall best of the eight techniques, it
has come under fire by critics claiming that proper imputations, necessary for valid inferences, are
difficult to produce, especially in data where multiple factors are deficient (Schafer, 1997), and even
then EMMI is biased in some cases [Robins and Wang, 2000]. Another argument against EMMI is that
it is much more difficult to implement than some of the techniques mentioned. One potential problem
that was encountered in this research is convergence of the EM algorithm [Wu, 1983], especially for big
datasets and datasets with more than 30 attribute variables.
19](https://image.slidesharecdn.com/twala2007doc2204/85/Twala2007-doc-19-320.jpg)

![Another point of discussion is why missing values are more damaging when they are in the test sample
than training sample. If you have a lot of training data then missing values do not make much impact on
the parameter estimates but missing data in the test set refers to only individual cases. That is, the
training data yield statistical summaries, but the test data are concerned with individuals. In other
words, missing data will tend to cancel each other out when training the model. On a new test case, the
investigator must still suffer accuracy affects though, inevitably. What is really happening here is that
the increased error in test cases is to be expected and the significantly reduced error when training is a
pleasant surprise and this is due to the averaging.
Furthermore, it is worthwhile mentioning that the performance of some methods could have been
slightly affected by other factors like errors in some datasets. For example, the Pima Indians diabetes
database had quite a number of observations with "zero" values, which are most likely to indicate
missing values although the data was described as being complete. Nonetheless, the prediction that the
impact of certain types of missing data mechanisms on both the testing and training cases should differ
by dataset, by mechanism and by the proportion of missing values is confirmed.
Some experimental results from Section 4.3 support previous findings in the literature and other results
extend the literature. The relative superiority of model-based methods over ad hoc methods is consistent
with past results [Kim and Curry, 1977; Little and Rubin, 1987; Rubin, 1987].
Overall, the performance of each MDT under more complex forms of systematic missingness is
unknown and likely to be problematic [Little and Rubin, 1987]. Systematic missingness in this
simulation was always based on the variables that were in the model rather than unmeasured variables
or combinations of variables. In addition, it is impossible, in practice, to demonstrate whether data are
MAR versus IM, because the values of the missing data are not available for comparison. IM is still a
problem for the methods reviewed here.
While this study confirms statistical insight on the importance of the pattern of missingness, it also
reveals that the distribution of unknown values among the predictors plays an equally (if not more)
decisive role, depending on the percentage of missing data. In a subsequent study we plan to distribute
missing values over as many attributes as possible (other than being restricted to one).
So far, we have restricted our experiments to only tree-based models. It would be interesting to carry
out a comparative study of tree based models with other (non-tree) methods which can handle missing
values. Furthermore, it would be possible to explore the different patterns and levels of missing values.
This paper also addresses the problem of tolerating missing values in both the training and test set.
Breiman et al., (1984) argue that missing values have more impact when they occur in the test set. An
interesting topic would be to assess the impact of missing values when they only occur in either the
training or test set.
We leave the above issues to be investigated in the future.
In sum, this paper provides the beginnings of a better understanding of the relative strengths and
weaknesses of MDTs and using decision trees as their component classifier. It is hoped that it will
motivate future theoretical and empirical investigations into incomplete data and decision trees, and
perhaps reassure those who are uneasy regarding the use of imputed data in prediction.
21](https://image.slidesharecdn.com/twala2007doc2204/85/Twala2007-doc-21-320.jpg)

![KERRY, J.O. AND CURRY, J. (19770. The treatment of missing data in multivariate analysis.
Sociological methods & Research, 6, 215-241.
KIM, J.-O. AND CURRY, J. (1977). The treatment of missing data in multivariate analysis.
Sociological Methods and Research, 6, 215-240.
KIRK, R.E. (1982). Experimental design (2nd Ed.). Monterey, CA: Brooks, Cole Publishing Company.
LAKSHMINARAYAN, K., HARP, S.A., AND SAMAD, T. (1999). Imputation of Missing Data in
Industrial Databases. Applied Intelligence, 11, 259-275.
LITTLE, R.J.A. AND RUBIN, D.B. (1987). Statistical Analysis with missing data. New York: Wiley.
MINITAB. (2002). MINITAB Statistical Software for Windows 9.0. MINITAB, Inc., PA, USA.
MULTIPLE IMPUTATION SOFTWARE. Available from <http:/www.stat.psu.edu/jls/misoftwa.html,
http:/methcenter.psu.edu/EMCOV.html>
MUTHÉN, L.K AND MUTHÉN, B.O. (1998). Mplus user’s guide. Los Angeles: Muthén & Muthén.
MURPHY, P. AND AHA, D. (1992). UCI Repository of machine learning databases [Machine-
readable data repository]. University of California, Department of Information and Computer
Science, Irvine, CA.
MYRTVEIT, I., STENSRUD, E., AND OLSSON, U. (2001). Analyzing Data Sets with Missing Data:
An Empirical Evaluation of Imputation Methods and Likelihood-Based Methods. IEEE Transactions
on Software Engineering, 27 (11), 1999-1013.
PYLE, D. (1999). Data Preparation for Data Mining. Morgan Kauffman, San Francisco.
QUINLAN, JR. (1993). C.4.5: Programs for machine learning. Los Altos, California: Morgan
Kauffman Publishers, INC.
ROBINS, D.B. AND WANG, N. (2000). Inference for imputation estimators. Biometrika, 87, 113-124.
RUBIN, D.B. (1987). Multiple Imputation for Nonresponse in Surveys. New York: John Wiley and Sons.
RUBIN, D.B. (1996). Multiple Imputation After 18+ Years. Journal of the American Statistical
Association, 91, 473-489.
SCHAFER, J.L. (1997). Analysis of Incomplete Multivariate Data. Chapman and Hall, London.
SCHAFER, J.L. AND OLSEN, M.K. (1998). Multiple Imputation for multivariate missing data
problems: a data analyst‟s perspective. Multivariate Behavioral Research, 33 (4): 545-571.
SCHAFER, J.L. AND GRAHAM, J.W. (2002). Missing data: Our view of the state of the art.
Psychological Methods, 7 (2), 147-177.
SENTAS, P., LEFTERIS, A., AND STAMELOS, I. (2004). Multiple Logistic Regression as Imputation
method Applied on Software Effort prediction. In Proceedings of the 10th International Symposium
on Software Metrics, Chicago, 14-16 September 2004.
STRIKE, K., EL-EMAM, K.E., AND MADHAVJI, N. (2001). Software Cost Estimation with
Incomplete Data. IEEE Transaction on Software Engineering, 27 (10), 890-908.
23](https://image.slidesharecdn.com/twala2007doc2204/85/Twala2007-doc-23-320.jpg)