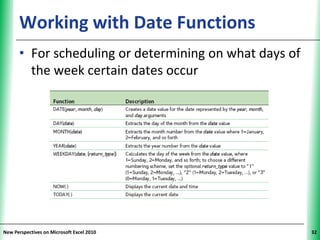
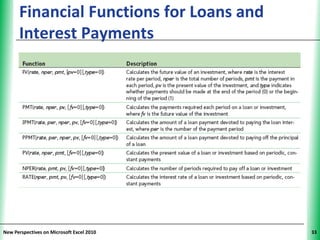
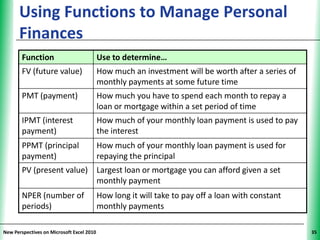
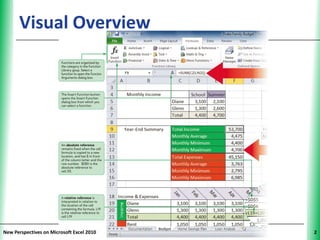
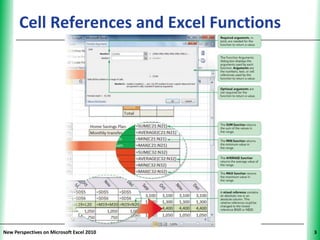
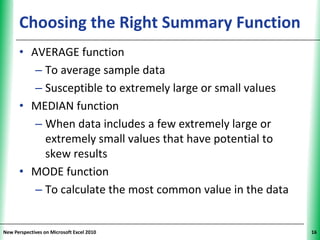
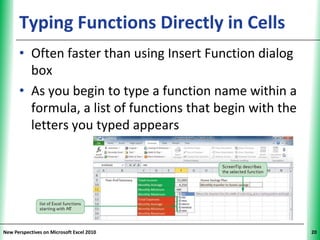
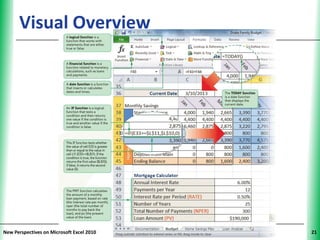
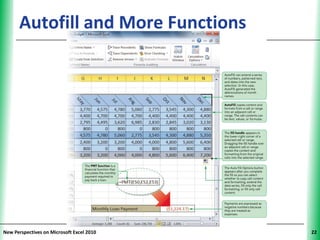
This document provides an overview of working with formulas and functions in Microsoft Excel. It discusses cell references, different types of references like relative, absolute, and mixed references. It also covers a variety of functions including financial, logical, and date functions. Examples are provided for how to use functions like PMT to calculate loan payments. The document emphasizes entering data and formulas using AutoFill for efficiency.
This document provides an overview of formatting worksheets in Microsoft Excel 2010. It discusses formatting cell text, applying fonts and colors, formatting calculated values such as numbers and dates, formatting individual cells and ranges using borders, alignment and styles. It also covers copying and pasting formats, using themes, applying conditional formatting, hiding data, and formatting worksheets for printing. The goal is to enhance readability, appearance and interpretation of data in worksheets.
Tutorial 8: Developing an Excel Applicationcios135
This document provides an overview of developing Excel applications, including defining names, validating and protecting data, inserting comments, automating tasks with macros, and customizing the ribbon interface. Key aspects covered are assigning names to cells and ranges, creating validation rules, protecting worksheets and workbooks, recording and running macros, and saving workbooks with macros enabled. The document offers guidance on building custom Excel applications with essential functions.
Tutorial 7: Advanced Functions and Conitional Formatingcios135
This document discusses advanced functions and conditional formatting in Microsoft Excel 2010. It covers topics like logical functions (IF, AND, OR), inserting calculated columns, creating Excel tables, lookup tables and functions like VLOOKUP and HLOOKUP, handling errors with IFERROR, and conditional formatting using rules, COUNTIF, SUMIF, and AVERAGEIF. The document contains visual examples and step-by-step explanations of how to use these functions and features in Excel.
This document provides an overview of performing what-if analyses in Microsoft Excel 2010. It discusses cost-volume-profit analysis, comparing expenses and revenue, determining break-even points, and using tools like data tables, scenarios, goal seek, and Solver to analyze how changes to inputs impact outputs. It also covers creating reports from these analyses and saving Solver models.
Tutorial 6: Multiple Worksheets and Workbookscios135
This document provides an overview of managing multiple worksheets and workbooks in Microsoft Excel 2010. It discusses how to group worksheets so formatting and formula changes can be applied to all at once. It also covers using 3D references to summarize data across worksheets, linking workbooks to share updated data, and creating hyperlinks and templates to navigate within and between workbooks. The document concludes with information on saving workbooks to SkyDrive and using the Excel Web App for online editing.
Pie charts are very useful for comparing values to each other in a data series. Pie charts have five elements that are common to most charts. You can select and format any chart element individually or you can apply a built-in style or chart layout to format all of these elements at once.
This document provides an overview of connecting Excel to external data sources, including:
1) Importing data from text files using the Text Import Wizard which determines file formats and allows formatting data.
2) Connecting to databases using queries to retrieve specific data from multiple tables.
3) Creating web queries to import portions of web pages or retrieve online data.
4) Linking PivotTables and PivotCharts to external data sources to create dynamic reports.
This document provides an overview of key Excel concepts and tasks for beginners, including:
- What Excel is used for and the different types of sheets (worksheets and chart sheets)
- How to plan a workbook by defining its goal, data requirements, formulas, and appearance
- How to enter text, numbers, and formulas into cells
- How to modify column and row sizes, insert new columns and rows, and select cell ranges
- Common functions like SUM and how to enter them automatically
- Different worksheet views for editing, layout, and printing
- How to preview and print worksheets while viewing formulas
This document provides an overview of the key skills and concepts covered in an Excel 2010 tutorial, including: understanding spreadsheets and the Excel interface; navigating, entering data, and formatting worksheets; working with formulas and functions; managing multiple worksheets; previewing and printing workbooks; and viewing worksheet formulas. The tutorial objectives are to learn the basics of using Excel to create, edit, analyze, and share spreadsheet data.
Tutorial 5: Excel Tables, PivotTables, and Pivot Chartscios135
This document provides an overview of working with Excel tables, PivotTables, and PivotCharts. It discusses how to structure data in Excel tables, create PivotTables to analyze and summarize table data, filter and rearrange PivotTables, and create PivotCharts to visualize PivotTable data. The document also covers sorting and filtering table data, calculating subtotals, and refreshing PivotTables when the source data is updated.
This document covers working with formulas and functions in Microsoft Excel 2010. It discusses how to create complex formulas using multiple arithmetic operators, insert and type functions, copy and move cell entries, and understand relative and absolute cell references. Functions allow performing complex calculations easily and the ROUND function is demonstrated for rounding values. Relative and absolute cell references are explained in the context of copying formulas.
This document outlines an agenda and presentation for an MS Excel 2007 training session for business managers and professionals. The agenda covers topics such as Excel introduction and history, techniques like named ranges and lookups, tips and tricks, templates, pivot tables, formulas, sorting and filtering, connecting Excel to databases and the web, macros, and VBA. It also provides overviews of some key Excel concepts like the ribbon interface and absolute vs. relative references. Hands-on exercises are included to reinforce topics like creating invoices from templates and using formulas with different reference types.
This chapter discusses different types of charts that can be used to visualize quantitative data in Excel. It covers basic chart types like line, column, and pie charts, as well as more advanced types like radar and bubble charts. The chapter also explores chart sub-types and how to combine multiple chart types into a single dashboard chart to analyze business data. The objectives are to determine the appropriate chart type for different situations, modify charts effectively, and create advanced visualizations like management dashboards.
This document provides an overview of Chapter 2 which discusses using statistical analysis tools to solve problems. It introduces statistical functions that can determine values, structure data, and count/total data based on criteria. These functions include AVERAGE, AVERAGEIF, COUNTIF, LARGE, MEDIAN, MODE.SNGL, RAND, RANDBETWEEN, RANK.EQ, ROUND, SMALL, STDEV.S, and SUMIF. The chapter also covers performing what-if analysis, goal seek, simulation, and custom formatting. Level 1 objectives focus on understanding basic statistics and using functions to calculate mean, median, mode and standard deviation. Level 2 objectives involve evaluating data rankings, extremes, and counts/
This document provides an overview of working with formulas and functions in Microsoft Excel 2010. It discusses:
1) The different types of cell references - relative, absolute, and mixed - and when to use each.
2) How to enter functions using the Function Library, Insert Function dialog box, or by directly typing them.
3) How to use the AutoFill feature to quickly fill in formulas and complete series.
4) Examples of logical, date, and financial functions like IF, TODAY, PMT, and how to use them.
5) Tips for presenting and explaining a personal budget.
This document discusses various ways to enhance charts in Microsoft Excel 2007, including customizing data series, formatting chart axes, adding data tables, rotating charts, using WordArt, adding pictures, and identifying data trends. Specifically, it covers changing data sources and adding data labels, formatting the different axes in 2D and 3D charts, adding a data table to the bottom of a chart, rotating 3D charts to improve visibility, enhancing charts with formatted WordArt text, and adding pictures to different parts of a chart. The overall goal is to illustrate how to customize and enhance charts in Excel 2007.
This document provides information about a two-day advanced Excel 2010 workshop, including details about the course facilitator and rules of the workshop. It also includes an exercise for participants to rate their Excel skills and get started with the training. The workshop will provide advanced training on features in Excel 2010/2013, including slicers, chart styles, conditional formatting, and the quick analysis tool. It discusses new capabilities in Excel like sparklines, pivot table slicers and formatting options, and 64-bit processing. The goal is to help participants analyze and visualize data more efficiently in Excel.
This document provides an overview of productivity tools in Microsoft Excel 2010 and Microsoft Word 2010. It discusses various functions in Excel like AVERAGE, CONCATENATE, SUM, and IF, as well as features of Word 2010 like the universal ribbon interface, Backstage view, paste preview, online Office Web Apps, increased number of themes, and new screenshot and photo editing tools. The document is intended to help users learn to utilize formulas and functions in Excel and features in Word 2010.
Spreadsheet software allows users to manipulate data in rows and columns of cells. Formulas can reference values in other cells, and values are automatically recalculated when referenced cells change. Spreadsheet uses include tracking grades, finances, statistics, and business data like payroll. The MS Excel window includes tools for working with formulas, functions, sorting/filtering data, formatting worksheets, conditional formatting, and creating pivot tables to summarize and analyze large data sets.
The document is about a workshop on Microsoft Excel 2007 and 2010 held by CA Aditya Singhal. It discusses the goals of the workshop which are to work between Excel 2010 and earlier versions, complete basic tasks like formatting, and learn advanced functions. It then compares features of Excel 2003 and earlier versions to Excel 2007/2010 such as increased number of rows and columns, new charting and pivot table features, and stability issues. The rest of the document outlines the workshop agenda covering basic commands, analysis, and other functions and tools in Excel 2007/2010. It concludes by thanking participants and providing contact information.
This document provides an overview of how to use Microsoft Excel 2007. It discusses key Excel concepts like workbooks, worksheets, cells, rows, columns, formulas, and functions. It also provides instructions for common Excel tasks like navigating cells, entering and editing data, using autofill, sorting and filtering data, creating formulas, charts, and pivot tables. The document is intended to help new Excel users learn the basics of the program.
This document provides tips and tricks for using various Excel functions and formulas. It includes 23 tips covering functions such as DATEDIF, SUMIF, MATCH, INDEX, DSUM, IF, AND, COUNTIF and RANDBETWEEN. Each tip explains how to use the function, includes an example formula, and step-by-step instructions for applying the formula. The tips cover a wide range of functionality including calculating months of service, custom formatting, auditing dependencies, finding maximum values, combining text, lookups, adding criteria to sums, and more.
This document outlines a training overview for a Microsoft Excel extended introduction course. The course consists of 6 classes covering topics like terminology, navigation, formatting, functions, macros, importing data, and charts. Each class is scheduled for a different date and includes the topics that will be covered, such as formatting, sorting, filtering, and different types of functions like date, logical, and statistical functions.
This document provides an overview of the menus in Microsoft Excel. It discusses the main functions of the Home, Insert, Page Layout, Formulas, Data, Review, and View menus. It also demonstrates how to insert and format charts using built-in Excel functions. Additional topics covered include PivotTables, removing duplicate entries, conditional formatting, and some commonly used Excel formulas. The overall purpose is to help users better understand the Excel interface and utilize key tools and features.
Microsoft Excel 2016 Basics Course contentsAnil Kumar
Microsoft Excel 2016 Basics course for Beginners
Objective: This is free Microsoft Excel 2016 Basics course. In this course, you will learn about working with Microsoft Excel 2016.
After completion of this course, you will be familiar to work with Microsoft Excel 2016.
Microsoft Excel 2016 Basics Course Contents
1. Introduction to Microsoft Excel 2016
2. Microsoft Excel 2016 New Features
3. Microsoft Excel 2016 Application Interface
4. Data Entry in Excel, Cells and Ranges
5. Formatting Data and Conditional Formatting
6. Introduction to Tables
7. Saving Workbooks in Multiple Formats
8. Basic Functions in Excel
9. Creating Charts
10. Printing Options in Excel 2016
check out more details about this course from http://msofficeguru.in (Anil Kumar Devarasetti)
This document provides an overview of formatting options in Excel, including formatting text, numbers, dates, cells, tables, conditional formatting, printing, and more. The objectives are to format workbooks to enhance readability and appeal by defining fonts, styles, colors, graphical effects, and applying number formats. Formatting tools like themes, styles, borders, fonts, fill colors, and alignment are demonstrated to customize the visual presentation and layout without changing the underlying data.
This document provides an overview of working with formulas and functions in Excel. It covers topics such as copying formulas, using relative, absolute and mixed cell references, understanding function syntax, inserting functions using the Insert Function dialog box or by typing them directly, using AutoFill to copy formulas across cells or create a series, working with logical and date functions like IF and TODAY, and calculating monthly loan payments using the PMT financial function.
This document provides an overview of working with formulas and functions in Excel. It discusses how to copy formulas, use relative, absolute and mixed cell references, understand function syntax, insert functions using the Insert Function dialog box or by typing them directly, autofill formulas into a series, use logical IF functions and date and financial functions like PMT. Examples are provided for each topic to demonstrate how to properly structure formulas and functions in Excel.
Data in Excel is in the form of rows and columns. Excel is commonly used to record and analyze data, perform mathematical operations, and visualize structured data in charts and graphs. Finally, another important application of Excel is that it helps in automating tasks through excel macros.
To perform the tasks mentioned above quickly, Excel has a set of shortcuts. Various operations can be achieved with a few simple keyboard strokes. Let’s dive deep into the Excel shortcuts that can help us work better on an Excel spreadsheet.
Need for Excel Shortcuts
Excel supports a plethora of keyboard shortcuts that help you work efficiently and increase productivity. Instead of accessing the toolbar with a mouse, two or three keystrokes are used to perform significant functions. Isn’t that easier and time-saving? Using Excel shortcuts drastically increases the speed, and thus reduces work-time.
Now the question is, if you have to memorize these shortcuts, the answer is no. However, it would be an advantage if you can remember a few of them. With regular practice, you will be able to remember most of the common Excel shortcuts.
Let’s now look at the Excel shortcuts cheat sheet, which you should know when working on Microsoft Excel. In this article, we have categorized 50 Excel shortcuts based on their operations. First, we will look at the workbook shortcut keys.
50 Excel Shortcuts That You Should Know in 2023
By Shruti M
Last updated on May 29, 20231788344
50 Excel Shortcuts Key That You Should Know in 2023
Table of Contents
What is Microsoft Excel? Need for Excel ShortcutsWorkbook Shortcut KeysCell Formatting Shortcut KeysRow and Column Formatting Shortcut KeysView More
Microsoft Excel is extensively used across the globe to store and analyze data. Despite various new data analytics tools in the market, Excel remains the go-to product for working with data. It has numerous in-built features, which makes it easier for you to organize your data.
The shortcut keys in Excel help you work on your data in a jiffy. In this article, we’ll be discussing the various Excel shortcuts. These keyboard shortcuts are used to perform tasks faster and effectively.
Have a look at the video below that explains worksheet related shortcuts, row and column shortcuts, and pivot table shortcut keys.
What is Microsoft Excel?
Although many of you are already aware of Excel, let’s have a small introduction anyways. Microsoft Excel is an application developed by Microsoft that is used to record, analyze, and visualize data. Excel, a spreadsheet application, was developed by Microsoft in 1985.
excel
Fig: Microsoft Excel Spreadsheet
Data in Excel is in the form of rows and columns. Excel is commonly used to record and analyze data, perform mathematical operations, and visualize structured data in charts and graphs. Finally, another important application of Excel is that it helps in automating tasks through excel macros.
To perform the tasks mentioned above quickly, Exce
This document provides an overview of working with formulas and functions in Excel. It discusses how to copy formulas, use relative, absolute and mixed cell references, understand function syntax, insert functions using the Insert Function dialog box or by typing them directly, autofill formulas into a series, use logical IF functions and date and financial functions like PMT. Examples are provided for each topic to demonstrate how to properly structure formulas and functions in Excel.
This document provides an overview of working with formulas and functions in Excel. It discusses how to copy formulas, use relative, absolute and mixed cell references, understand function syntax, insert functions using the Insert Function dialog box or by typing them directly, autofill formulas into a series, use logical, date and financial functions like IF, TODAY and PMT. Specific topics covered include using relative and absolute references, understanding function syntax, inserting functions, filling a series with autofill, and using the PMT function to calculate monthly loan payments.
Tutorial Excel: Working with Formulas and FunctionsFaridah Mohamad
This document provides an overview of working with formulas and functions in Excel. It discusses how to copy formulas, use relative, absolute and mixed cell references, understand function syntax, insert functions using the Insert Function dialog box or by typing them directly, autofill formulas into a series, use logical IF functions and date and financial functions like PMT. Examples are provided for each topic to demonstrate how to properly structure formulas and functions in Excel.
This document provides an overview and tutorial on getting started with Microsoft Excel 2010. It covers the basics of navigating and formatting worksheets, entering text, numbers and formulas, inserting and modifying columns and rows, and printing worksheets. The objectives are to understand spreadsheets and Excel, learn the parts of the Excel window, and learn basic tasks like entering data, formatting cells, and printing.
This document provides an overview and tutorial on getting started with Microsoft Excel 2010. It covers the basics of Excel including understanding worksheets and workbooks, entering and formatting data, using formulas and functions, navigating and formatting worksheets, and printing workbooks. The objectives are to learn the Excel interface, enter and format text, numbers and dates, use formulas and functions, navigate between and format worksheets, and preview and print workbooks.
This document provides instructions on using Excel tables, PivotTables, and PivotCharts to analyze and summarize data. It discusses how to structure data as an Excel table, create PivotTables from that data, and generate PivotCharts for visualization. Key topics covered include creating and formatting Excel tables, sorting and filtering table data, calculating summaries, inserting subtotals, building PivotTables with different fields, filtering PivotTables with slicers, and refreshing PivotTables when the source data changes. The goal is to help users leverage these tools to gain insights from their structured data.
The chapter discusses tools for logical decision making in Excel including Boolean logic, relational operators, and functions like AND, OR, and IF. It covers comparing data and applying conditional formatting based on criteria. More advanced topics include nesting functions to evaluate multiple criteria and using logical constructs like "none of" and "only" to solve complex problems.
The document discusses guidelines for designing databases in Microsoft Access, including identifying necessary fields, organizing data into tables, determining primary keys, and avoiding redundancy. It also covers creating and modifying tables, defining fields and field properties, importing data from Excel and text files, and defining relationships between tables.
The document discusses using functions in Excel. It defines what functions are and their key parts. It explains the different types of functions including mathematical, statistical, financial, logical, and text functions. It also outlines how to enter formulas with functions using the Insert Function dialog box or directly in cells.
This document provides an overview of key concepts for getting started with Microsoft Excel 2010, including understanding spreadsheet software and worksheets, touring the Excel window, entering labels and values, using formulas, switching between worksheet views, and setting print options. The objectives cover topics such as understanding formulas, editing cell entries, creating simple formulas, and choosing appropriate print settings.
This document discusses various formulas and functions in Microsoft Excel, including:
1) Using text functions to format data, SUMIF to sum a range based on conditions, and CONCATENATE to join strings.
2) Consolidating data using 3D references and formulas.
3) Checking for errors using IFERROR and identifying circular references.
4) Constructing logical formulas using IF, AND, and comparison operators and calculating payments with PMT.
The document discusses formulas and functions in Microsoft Excel. It covers how to create complex formulas using multiple arithmetic operators and order of precedence. It also describes how to insert and type functions, copy and move cell entries, and understand relative and absolute cell references. Functions allow performing complex calculations with predefined formulas. Copying formulas requires understanding relative and absolute references and how they affect formulas when copied to new cells. The document provides examples of rounding values using functions.
Similar to Tutorial 3 Working with Formulas and Functions (20)
LAND USE LAND COVER AND NDVI OF MIRZAPUR DISTRICT, UPRAHUL
This Dissertation explores the particular circumstances of Mirzapur, a region located in the
core of India. Mirzapur, with its varied terrains and abundant biodiversity, offers an optimal
environment for investigating the changes in vegetation cover dynamics. Our study utilizes
advanced technologies such as GIS (Geographic Information Systems) and Remote sensing to
analyze the transformations that have taken place over the course of a decade.
The complex relationship between human activities and the environment has been the focus
of extensive research and worry. As the global community grapples with swift urbanization,
population expansion, and economic progress, the effects on natural ecosystems are becoming
more evident. A crucial element of this impact is the alteration of vegetation cover, which plays a
significant role in maintaining the ecological equilibrium of our planet.Land serves as the foundation for all human activities and provides the necessary materials for
these activities. As the most crucial natural resource, its utilization by humans results in different
'Land uses,' which are determined by both human activities and the physical characteristics of the
land.
The utilization of land is impacted by human needs and environmental factors. In countries
like India, rapid population growth and the emphasis on extensive resource exploitation can lead
to significant land degradation, adversely affecting the region's land cover.
Therefore, human intervention has significantly influenced land use patterns over many
centuries, evolving its structure over time and space. In the present era, these changes have
accelerated due to factors such as agriculture and urbanization. Information regarding land use and
cover is essential for various planning and management tasks related to the Earth's surface,
providing crucial environmental data for scientific, resource management, policy purposes, and
diverse human activities.
Accurate understanding of land use and cover is imperative for the development planning
of any area. Consequently, a wide range of professionals, including earth system scientists, land
and water managers, and urban planners, are interested in obtaining data on land use and cover
changes, conversion trends, and other related patterns. The spatial dimensions of land use and
cover support policymakers and scientists in making well-informed decisions, as alterations in
these patterns indicate shifts in economic and social conditions. Monitoring such changes with the
help of Advanced technologies like Remote Sensing and Geographic Information Systems is
crucial for coordinated efforts across different administrative levels. Advanced technologies like
Remote Sensing and Geographic Information Systems
9
Changes in vegetation cover refer to variations in the distribution, composition, and overall
structure of plant communities across different temporal and spatial scales. These changes can
occur natural.
How to Setup Warehouse & Location in Odoo 17 InventoryCeline George
In this slide, we'll explore how to set up warehouses and locations in Odoo 17 Inventory. This will help us manage our stock effectively, track inventory levels, and streamline warehouse operations.
How to Add Chatter in the odoo 17 ERP ModuleCeline George
In Odoo, the chatter is like a chat tool that helps you work together on records. You can leave notes and track things, making it easier to talk with your team and partners. Inside chatter, all communication history, activity, and changes will be displayed.
This presentation was provided by Steph Pollock of The American Psychological Association’s Journals Program, and Damita Snow, of The American Society of Civil Engineers (ASCE), for the initial session of NISO's 2024 Training Series "DEIA in the Scholarly Landscape." Session One: 'Setting Expectations: a DEIA Primer,' was held June 6, 2024.
How to Fix the Import Error in the Odoo 17Celine George
An import error occurs when a program fails to import a module or library, disrupting its execution. In languages like Python, this issue arises when the specified module cannot be found or accessed, hindering the program's functionality. Resolving import errors is crucial for maintaining smooth software operation and uninterrupted development processes.
বাংলাদেশের অর্থনৈতিক সমীক্ষা ২০২৪ [Bangladesh Economic Review 2024 Bangla.pdf] কম্পিউটার , ট্যাব ও স্মার্ট ফোন ভার্সন সহ সম্পূর্ণ বাংলা ই-বুক বা pdf বই " সুচিপত্র ...বুকমার্ক মেনু 🔖 ও হাইপার লিংক মেনু 📝👆 যুক্ত ..
আমাদের সবার জন্য খুব খুব গুরুত্বপূর্ণ একটি বই ..বিসিএস, ব্যাংক, ইউনিভার্সিটি ভর্তি ও যে কোন প্রতিযোগিতা মূলক পরীক্ষার জন্য এর খুব ইম্পরট্যান্ট একটি বিষয় ...তাছাড়া বাংলাদেশের সাম্প্রতিক যে কোন ডাটা বা তথ্য এই বইতে পাবেন ...
তাই একজন নাগরিক হিসাবে এই তথ্য গুলো আপনার জানা প্রয়োজন ...।
বিসিএস ও ব্যাংক এর লিখিত পরীক্ষা ...+এছাড়া মাধ্যমিক ও উচ্চমাধ্যমিকের স্টুডেন্টদের জন্য অনেক কাজে আসবে ...
ISO/IEC 27001, ISO/IEC 42001, and GDPR: Best Practices for Implementation and...PECB
Denis is a dynamic and results-driven Chief Information Officer (CIO) with a distinguished career spanning information systems analysis and technical project management. With a proven track record of spearheading the design and delivery of cutting-edge Information Management solutions, he has consistently elevated business operations, streamlined reporting functions, and maximized process efficiency.
Certified as an ISO/IEC 27001: Information Security Management Systems (ISMS) Lead Implementer, Data Protection Officer, and Cyber Risks Analyst, Denis brings a heightened focus on data security, privacy, and cyber resilience to every endeavor.
His expertise extends across a diverse spectrum of reporting, database, and web development applications, underpinned by an exceptional grasp of data storage and virtualization technologies. His proficiency in application testing, database administration, and data cleansing ensures seamless execution of complex projects.
What sets Denis apart is his comprehensive understanding of Business and Systems Analysis technologies, honed through involvement in all phases of the Software Development Lifecycle (SDLC). From meticulous requirements gathering to precise analysis, innovative design, rigorous development, thorough testing, and successful implementation, he has consistently delivered exceptional results.
Throughout his career, he has taken on multifaceted roles, from leading technical project management teams to owning solutions that drive operational excellence. His conscientious and proactive approach is unwavering, whether he is working independently or collaboratively within a team. His ability to connect with colleagues on a personal level underscores his commitment to fostering a harmonious and productive workplace environment.
Date: May 29, 2024
Tags: Information Security, ISO/IEC 27001, ISO/IEC 42001, Artificial Intelligence, GDPR
-------------------------------------------------------------------------------
Find out more about ISO training and certification services
Training: ISO/IEC 27001 Information Security Management System - EN | PECB
ISO/IEC 42001 Artificial Intelligence Management System - EN | PECB
General Data Protection Regulation (GDPR) - Training Courses - EN | PECB
Webinars: https://pecb.com/webinars
Article: https://pecb.com/article
-------------------------------------------------------------------------------
For more information about PECB:
Website: https://pecb.com/
LinkedIn: https://www.linkedin.com/company/pecb/
Facebook: https://www.facebook.com/PECBInternational/
Slideshare: http://www.slideshare.net/PECBCERTIFICATION
Exploiting Artificial Intelligence for Empowering Researchers and Faculty, In...Dr. Vinod Kumar Kanvaria
Exploiting Artificial Intelligence for Empowering Researchers and Faculty,
International FDP on Fundamentals of Research in Social Sciences
at Integral University, Lucknow, 06.06.2024
By Dr. Vinod Kumar Kanvaria
2. Visual Overview XP
New Perspectives on Microsoft Excel 2010 2
3. Cell References and Excel Functions XP
New Perspectives on Microsoft Excel 2010 3
4. Understanding Cell References XP
• To record and analyze data
– Enter data in cells in a worksheet
– Reference the cells with data in formulas
that perform calculations on that data
• Types of cell references
– Relative
– Absolute
– Mixed
New Perspectives on Microsoft Excel 2010 4
5. Using Relative References XP
• Cell reference as it appears in worksheet (B2)
• Always interpreted in relation (relative) to the
location of the cell containing the formula
• Changes when the formula is copied to
another group of cells
• Allows quick generation of row/column totals
without revising formulas
New Perspectives on Microsoft Excel 2010 5
6. Formulas Using a Relative Reference XP
New Perspectives on Microsoft Excel 2010 6
7. Using Absolute References XP
• Cell reference that remains fixed when the
formula is copied to a new location
• Have a $ before each column and row
designation ($B$2)
• Enter values in their own cells; reference the
appropriate cells in formulas in the worksheet
– Reduces amount of data entry
– When a data valued is changed, all formulas
based on that cell are updated to reflect the
new value
New Perspectives on Microsoft Excel 2010 7
8. Formulas Using an Absolute Reference
XP
New Perspectives on Microsoft Excel 2010 8
9. Using Mixed References XP
• Contain both relative and absolute references
• “Lock” one part of the cell reference while the
other part can change
• Have a $ before either the row or column
reference ($B2 or B$2)
New Perspectives on Microsoft Excel 2010 9
10. Using a Mixed Reference XP
New Perspectives on Microsoft Excel 2010 10
11. When to Use Relative, Absolute, and XP
Mixed References
• Relative references
– Repeat same formula with cells in different
locations
• Absolute references
– Different formulas to refer to the same cell
• Mixed references
– Seldom used other than when creating tables of
calculated values
• Use F4 key to cycle through different types of
references
New Perspectives on Microsoft Excel 2010 11
12. Working with Functions XP
• Quick way to calculate summary data
• Every function follows a set of rules (syntax)
that specifies how the function should be
written
• General syntax of all Excel functions
• Square brackets indicate optional arguments
New Perspectives on Microsoft Excel 2010 12
14. Excel Functions XP
New Perspectives on Microsoft Excel 2010 14
15. Working with Functions XP
• Advantage of using cell references:
– Values used in the function are visible to
users and can be easily edited as needed
• Functions can also be placed inside another
function, or nested (must include all
parentheses)
New Perspectives on Microsoft Excel 2010 15
16. Choosing the Right Summary Function
XP
• AVERAGE function
– To average sample data
– Susceptible to extremely large or small values
• MEDIAN function
– When data includes a few extremely large or
extremely small values that have potential to
skew results
• MODE function
– To calculate the most common value in the data
New Perspectives on Microsoft Excel 2010 16
17. Inserting a Function XP
• Three possible methods:
– Select a function from a function category
in the Function Library
– Open Insert Function dialog box to search
for a particular function
– Type function directly in cells
New Perspectives on Microsoft Excel 2010 17
18. Using the Function Library to Insert aXP
Function
• When you select a function, the Function
Arguments dialog box opens, listing all
arguments associated with that function
New Perspectives on Microsoft Excel 2010 18
19. Using the Insert Function Dialog Box XP
• Organizes all functions by category
• Includes a search feature for locating
functions that perform particular calculations
New Perspectives on Microsoft Excel 2010 19
20. Typing Functions Directly in Cells XP
• Often faster than using Insert Function dialog
box
• As you begin to type a function name within a
formula, a list of functions that begin with the
letters you typed appears
New Perspectives on Microsoft Excel 2010 20
21. Visual Overview XP
New Perspectives on Microsoft Excel 2010 21
22. Autofill and More Functions XP
New Perspectives on Microsoft Excel 2010 22
23. Entering Data and Formulas with XP
AutoFill
• Use the fill handle to copy a formula and
conditional formatting
– More efficient than two-step process of
copying and pasting
• By default, AutoFill copies both content and
formatting of original range to selected range
New Perspectives on Microsoft Excel 2010 23
24. Entering Data and Formulas with XP
AutoFill
New Perspectives on Microsoft Excel 2010 24
25. Entering Data and Formulas with XP
AutoFill
• Use Auto Fill Options button to specify what is
copied
New Perspectives on Microsoft Excel 2010 25
26. Entering Data and Formulas with XP
AutoFill
• Use AutoFill to create a series of numbers,
dates, or text based on a pattern
• Use Series dialog box for more complex
patterns
New Perspectives on Microsoft Excel 2010 26
27. Entering Data and Formulas with XP
AutoFill
New Perspectives on Microsoft Excel 2010 27
28. Entering Data and Formulas with XP
AutoFill
New Perspectives on Microsoft Excel 2010 28
29. Working with Logical Functions XP
• Logical functions
– Build decision-making capability into a
formula
– Work with statements that are either true
or false
• Excel supports many different logical
functions, including the IF function
New Perspectives on Microsoft Excel 2010 29
30. Working with Logical Functions XP
• Comparison operator
– Symbol that indicates the relationship
between two values
New Perspectives on Microsoft Excel 2010 30
31. Using the IF Function XP
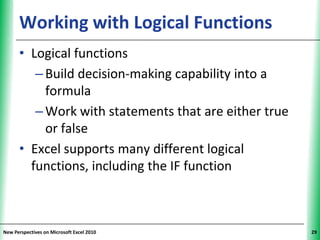
• Returns one value if a statement is true and
returns a different value if that statement is
false
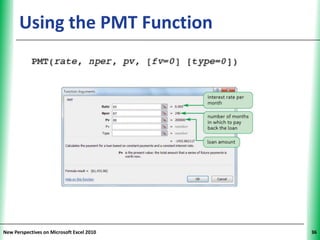
• IF (logical_test, [value_if_true,] [value_if_false])
New Perspectives on Microsoft Excel 2010 31
32. Working with Date Functions XP
• For scheduling or determining on what days of
the week certain dates occur
New Perspectives on Microsoft Excel 2010 32
33. Financial Functions for Loans and XP
Interest Payments
New Perspectives on Microsoft Excel 2010 33
34. Working with Financial Functions XP
• Cost of a loan to the borrower is largely based
on three factors:
– Principal: amount of money being loaned
– Interest: amount added to the principal by
the lender
• Calculated as simple interest or as
compound interest
– Time required to pay back the loan
New Perspectives on Microsoft Excel 2010 34
35. Using Functions to Manage Personal XP
Finances
Function Use to determine…
FV (future value) How much an investment will be worth after a series of
monthly payments at some future time
PMT (payment) How much you have to spend each month to repay a
loan or mortgage within a set period of time
IPMT (interest How much of your monthly loan payment is used to pay
payment) the interest
PPMT (principal How much of your monthly loan payment is used for
payment) repaying the principal
PV (present value) Largest loan or mortgage you can afford given a set
monthly payment
NPER (number of How long it will take to pay off a loan with constant
periods) monthly payments
New Perspectives on Microsoft Excel 2010 35
36. Using the PMT Function XP
New Perspectives on Microsoft Excel 2010 36
37. Using the PMT Function XP
New Perspectives on Microsoft Excel 2010 37
38. Presenting a Budget XP
• Plan the budget around a few essential goals
• Pick out a few important measures that can
convey whether the proposed budget will
meet your goals
• Look at your financial history to aid you in
creating budget projections
• When explaining the budget, describe the
results in terms of everyday examples
New Perspectives on Microsoft Excel 2010 38