The document discusses three common ways to improve performance of a MySQL database that is experiencing high load:
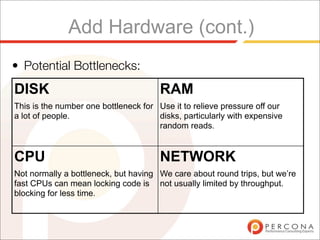
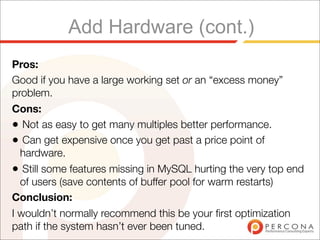
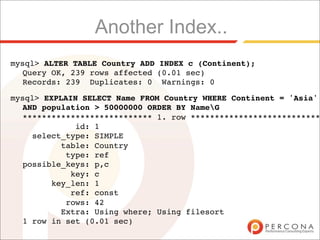
1. Upgrade hardware by adding more RAM, faster disks, or more powerful CPUs. This provides a temporary fix but can become exponentially more expensive and does not address underlying issues.
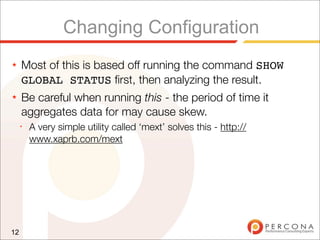
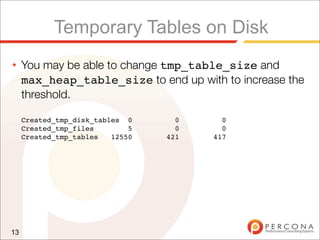
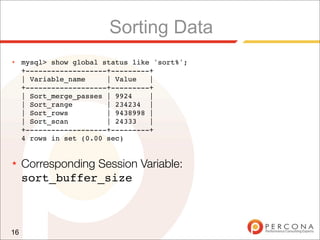
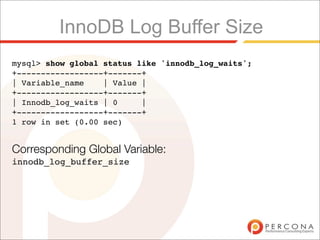
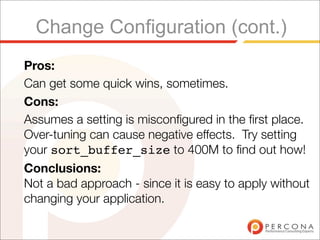
2. Change MySQL configuration settings like tmp_table_size or sort_buffer_size to optimize for specific bottlenecks shown in global status variables, but there are no "silver bullets" and misconfigurations must be addressed.
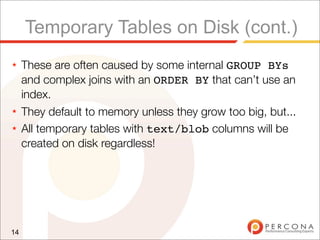
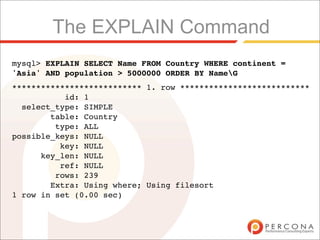
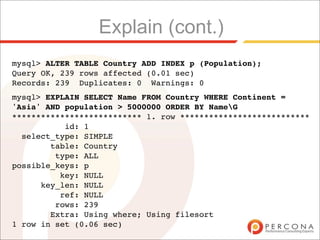
3. Improve indexing and tune queries by addressing issues like temporary tables on disk, full table scans, and lack of indexes causing full joins or sorting, which can have long term benefits over simply adding resources


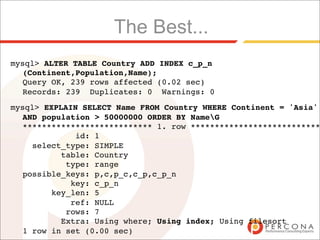
![When this technique really works:
• You had good performance when all of your working
set[1] of data fitted in main memory.
• As your working set increases, you just increase the
size of memory[2].
[1] Working set can be between 1% and 100% of database size. On poorly
indexed systems it is often a higher percentage - but the real value depends on
what hotspots your data has.
[2] The economical maximum for main memory is currently 128GB. This can be
done for less than $10K with a Dell server.](https://image.slidesharecdn.com/highload-perf-tuning-091012025855-phpapp02/85/Highload-Perf-Tuning-9-320.jpg)


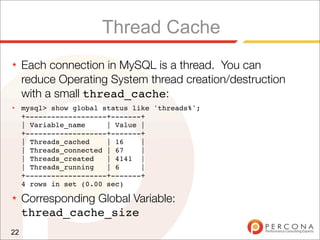


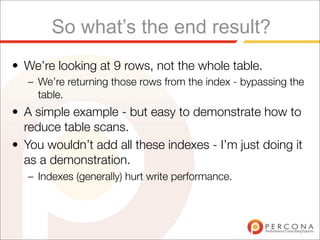


![Finding bad queries
• MySQL has a feature called the slow query log.
• We can enable it, and then set the long_query_time
to zero[1] seconds to find a selection of our queries.
[1] Requires MySQL 5.1 or patches MySQL 5.0 release.](https://image.slidesharecdn.com/highload-perf-tuning-091012025855-phpapp02/85/Highload-Perf-Tuning-51-320.jpg)
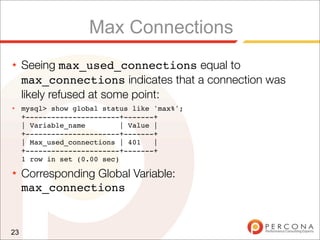
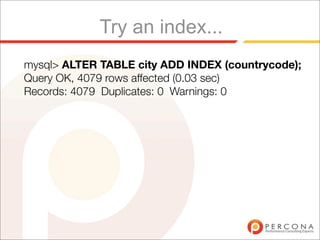
![..
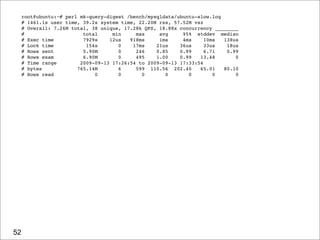
# Query 1: 655.60 QPS, 4.28x concurrency, ID 0x813031B8BBC3B329 at byte 518466
# This item is included in the report because it matches --limit.
# pct total min max avg 95% stddev median
# Count 3 274698
# Exec time 22 1794s 12us 918ms 7ms 2ms 43ms 332us
# Lock time 0 0 0 0 0 0 0 0
# Rows sent 0 0 0 0 0 0 0 0
# Rows exam 0 0 0 0 0 0 0 0
# Users 1 [root]
# Hosts 1 localhost
# Databases 1 tpcc
# Time range 2009-09-13 17:26:55 to 2009-09-13 17:33:54
# bytes 0 1.57M 6 6 6 6 0 6
# Query_time distribution
# 1us
# 10us ###
# 100us ################################################################
# 1ms ##
# 10ms ##
# 100ms #
# 1s
# 10s+
commitG
53](https://image.slidesharecdn.com/highload-perf-tuning-091012025855-phpapp02/85/Highload-Perf-Tuning-53-320.jpg)
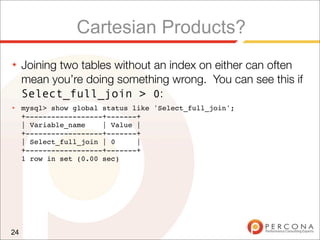
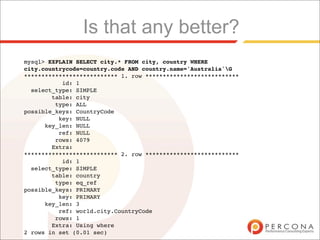
![..
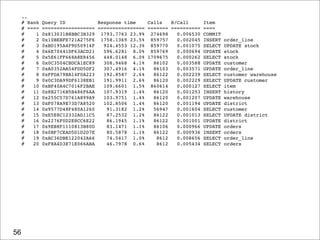
# Query 2: 2.05k QPS, 4.20x concurrency, ID 0x10BEBFE721A275F6 at byte 17398977
# This item is included in the report because it matches --limit.
# pct total min max avg 95% stddev median
# Count 11 859757
# Exec time 22 1758s 64us 812ms 2ms 9ms 9ms 224us
# Lock time 17 27s 13us 9ms 31us 44us 26us 28us
# Rows sent 0 0 0 0 0 0 0 0
# Rows exam 0 0 0 0 0 0 0 0
# Users 1 [root]
# Hosts 1 localhost
# Databases 1 tpcc
# Time range 2009-09-13 17:26:55 to 2009-09-13 17:33:54
# bytes 22 170.52M 192 213 207.97 202.40 0.58 202.40
# Query_time distribution
# 1us
# 10us #
# 100us ################################################################
# 1ms ############
# 10ms ###
# 100ms #
# 1s
# 10s+
# Tables
# SHOW TABLE STATUS FROM `tpcc` LIKE 'order_line'G
# SHOW CREATE TABLE `tpcc`.`order_line`G
INSERT INTO order_line (ol_o_id, ol_d_id, ol_w_id, ol_number, ol_i_id, ol_supply_w_id,
ol_quantity, ol_amount, ol_dist_info) VALUES (3669, 4, 65, 1, 6144, 38, 5, 286.943756103516,
'sRgq28BFdht7nemW14opejRj')G
54](https://image.slidesharecdn.com/highload-perf-tuning-091012025855-phpapp02/85/Highload-Perf-Tuning-54-320.jpg)
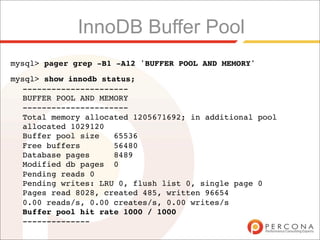
![..
# Query 4: 2.05k QPS, 1.42x concurrency, ID 0x6E70441DF63ACD21 at byte 192769443
# This item is included in the report because it matches --limit.
# pct total min max avg 95% stddev median
# Count 11 859769
# Exec time 7 597s 67us 794ms 693us 467us 6ms 159us
# Lock time 12 19s 9us 10ms 21us 31us 25us 19us
# Rows sent 0 0 0 0 0 0 0 0
# Rows exam 0 0 0 0 0 0 0 0
# Users 1 [root]
# Hosts 1 localhost
# Databases 1 tpcc
# Time range 2009-09-13 17:26:55 to 2009-09-13 17:33:54
# bytes 7 56.36M 64 70 68.73 65.89 0.30 65.89
# Query_time distribution
# 1us
# 10us #
# 100us ################################################################
# 1ms #
# 10ms #
# 100ms #
# 1s
# 10s+
# Tables
# SHOW TABLE STATUS FROM `tpcc` LIKE 'stock'G
# SHOW CREATE TABLE `tpcc`.`stock`G
UPDATE stock SET s_quantity = 79 WHERE s_i_id = 89277 AND s_w_id = 51G
# Converted for EXPLAIN
# EXPLAIN
select s_quantity = 79 from stock where s_i_id = 89277 AND s_w_id = 51G
55](https://image.slidesharecdn.com/highload-perf-tuning-091012025855-phpapp02/85/Highload-Perf-Tuning-55-320.jpg)


![Introduction to MySQL Query Tuning for Dev[Op]s](https://cdn.slidesharecdn.com/ss_thumbnails/qtdevops-191005204425-thumbnail.jpg?width=640&height=640&fit=bounds)