Dr Pepper Snapple Group (DPS) is the third largest distributor of non-alcoholic beverages in North America. It operates popular brands like Dr Pepper, Snapple, 7 Up, and Sunkist. DPS stock trades on the NYSE under the ticker DPS. The company focuses on packaged beverages in the US, Canada, and Latin America. It has set ambitious environmental goals like reducing solid waste by 90% and increasing energy efficiency by 30% to become more sustainable. DPS dominates its categories and remains a leader in the beverage industry.
Dr Pepper Snapple Group Branding presentationAMA_SanAntonio
Presented by Melissa Mohr of Dr Pepper Snapple Group, this deck discusses not only Dr Pepper's family of brands but also explores some of the differences between Dr Pepper, Pepsi and Coke and how the smaller company competes on a grand scale.
As a student at the University of Houston, I developed a fully-integrated media plan for Dr Pepper with a focus on both a national target, as well as a local target. This plan, as well as the presentation was awarded first place in a a media plan competition at the University.
Prepared by:
Abdul Hadi Anwar Siddiqui
I am luck that I share this Presentation with you because this is My best Presentation I prepared till now,
thanks........
For more information please follow me at,
Gmail: abdulhadianwar9998@gmail.com
facebook: https://www.facebook.com/innocent.hadi.733
Gestión pública y sistemas funcionales: De símbolos y signos.Gobernaphenom
La tarea de analizar y reducir el problema complejo del Estado es similar al que enfrenta un matemático al cual se le pide resolver un conjunto de algoritmos que configuran la identidad de un problema económico, bajo condición que resulte en una solución con sentido explicativo económico, no simplemente funcional. Por ello, se analiza el fenómeno de los Sistemas Funcionales que resultan en variable dependiente de la Gestión Pública, con el Poder Ejecutivo como variable independiente, que configura una relación Estado-Gobierno; y es motivado por la observación del ejercicio real de funciones por los Sectores (cuya definición formal –o legal- espera su turno) y su relación con las políticas públicas (que en conjunto contiene a las nacionales) y de ambas, con el funcionamiento del Estado, resultando evidente que el cumplimiento de políticas públicas que requieren la participación de todas o varias entidades del Estado, se sujeta el cumplimiento de las funciones primordiales del Estado (objetivos, metas), que depende del ejercicio de las funciones sustantivas de los Ministerios y Entidades Públicas, que conforman el Poder Ejecutivo, que es un diseño que los matemáticos llaman “recursivo ”, y los políticos, “Circulo de Poder”.
Cal Poly Pomona 2014 CFA Institute Research Challenge Equity Research Report ...Michael Lovett
This is the equity research report that my CPP teammates and I prepared for our entry into the CFA Institute Research Challenge. We analyzed and performed a valuation on a publicly traded company, and presented our results to a panel of CFA charter holder's. We had the honor of winning our local level challenge, hosted by the CFA society of Orange County. Please take a look at our work!
2011 ANNUAL REPORTInnovating for Everyday Life$82..docxeugeniadean34240
2011 ANNUAL REPORT
Innovating for Everyday Life
$82.6
$78.9
$76.7
$79.3
$72.4
11
09
08
07
10
Net Sales ($ billions)
30%
4%
19%
9%
14%
24%
By business segment
Beauty
Grooming
Health Care
Snacks & Pet Care
Fabric Care & Home Care
Baby Care & Family Care
2011 Net Sales
9%
14%
16%
41%
20%
By geographic region
North America
Western Europe
Central & Eastern Europe,
Middle East & Africa
Latin America
Asia
35% 65%
By market maturity
Developed
Developing
$13.2
$16.1
$14.9
$15.0
$13.4
11
09
08
07
10
Operating Cash Flow ($ billions)
$3.93
$4.11
$4.26
$3.64
$3.04
11
09
08
07
10
Diluted Net Earnings (per common share)
Contents
Letter to Shareholders................................. 1
Leadership Brands.......................................9
Innovating for Everyday Life...................... 14
Gillette Guard ........................................ 16
Brazil...................................................... 18
Crest 3D White ......................................20
Gain Dishwashing Liquid ........................22
Head & Shoulders ..................................24
Old Spice ...............................................26
Disaster Relief ...........................................28
Financial Contents ....................................29
Global Leadership Council......................... 75
Board of Directors..................................... 75
Financial Summary.................................... 76
Company and Shareholder Information..... 78
Financial Highlights (unaudited)
Amounts in millions, except per share amounts 2011 2010 2009 2008 2007
Net Sales $82,559 $78,938 $76,694 $79,257 $72,441
Operating Income 15,818 16,021 15,374 15,979 14,485
Net Earnings 11,797 12,736 13,436 12,075 10,340
Net Earnings Margin from Continuing Operations 14.3% 13.9% 13.9% 14.2% 13.3%
Diluted Net Earnings per Common Share from Continuing Operations $3.93 $3.53 $3.39 $3.40 $2.84
Diluted Net Earnings Per Common Share 3.93 4.11 4.26 3.64 3.04
Dividends Per Common Share 1.97 1.80 1.64 1.45 1.28
Dear Shareholders,
Last year, I described P&G’s Purpose-inspired Growth Strategy, which is to
touch and improve more consumers’ lives in more parts of the world more
completely. I told you that we intend to deliver total shareholder return
that consistently ranks P&G among the top third of our peers — the best-
performing consumer products companies in the world. To do this, we
must deliver the Company’s long-term annual growth goals, which are to:
Grow organic sales 1% to 2% faster than
market growth in the categories and countries
where we compete
Deliver core earnings per share (core EPS) growth
of high single to low double digits
Generate free cash flow productivity of
90% or greater
Robert A. McDonald
Chairman of the Board, President and
Chief Executive Officer
We made meaningful progress toward these long-term goals
for fiscal 2011, despite significant external chal.
Procter & Gamble is one of the fastest and largest growing consumer market.
Case Study examines journey of P&G for Light Duty liquid Detergents in various aspects like promotion and development.
1Running head MARKETING PLAN AND SALES STRATEGY2Running hea.docxdrennanmicah
1
Running head: MARKETING PLAN AND SALES STRATEGY
2
Running head: MARKETING PLAN AND SALES STRATEGY
Marketing Plan and Sales Strategy
Amy E. Guy
Dr. Andrea Banto
Business 599
November 11, 2018
MARKETING PLANThe situation of the Existing Market
There exist different types and brands of beverages in Youngsville which are strong in their own way. Different types of people have different tastes of beverages they want which includes, but is not limited to the calorie levels and alcohol percentages whereas others are more sensitive about the side effects which might be caused by these beverages.
The current market situation in Youngsville, North Carolina is very competitive due to the existence of many giant non-alcoholic beverages companies which have colonized an enormous market share posing a threat to startups. These challenges elevate when these famous companies realize that a growing company has started to become a big competitor to them, hence channeling hefty resources to fight back.
Venturing into a market that is well established and full of giants such as is not an easy task. This will require the adoption of a well-founded marketing strategy that will enable us to maneuver through the unfair competition experienced in Youngsville.Target market
The total population of Youngsville, North Carolina is 18,336. Our company is targeting consumers of ages above 10 (This is about 95% of the total population) who want a life full of health. Our brands will serve as a suitable substitute to the existing but much expensive beverages enriched with vitamins and refreshing taste containing calorie and costly energy. The average income per household in Youngsville is $61,104, hence we have made our products considering the different existing economic strength of the people. Engineered with an immense level of quality to promote a healthier living, our products appeal greatly to people who want to support and be part of our company.Demographic Description
Age range: Any person above the age of 10.
Income Range: Persons with income above $ 1000.
Gender: Male, Female.
Social Class: Students, Working Class, Middle Class, Upper Class, Elite Class.
Lifestyle: Modern, Sports, Healthy Persons. Competition Assessment
We are a non-alcoholic beverage production company, a much-crowded venture, so our major competitors are giant companies such as PepsiCo, Nestle and Coca-Cola Company. Other competitors include Red bull and Dr. Pepper Snapple. The existing giant companies have wide market shares which they guard jealously hence they will not allow any other product to pose a threat against their products hence they will dedicate their effort and resources in suffocating their competitors in the market (Porter & E, 1989).
We have made our products to affordable, a way to pull the market since the same companies that offer similar bever.
Similar to Tricia Kubair Dr Pepper Snapple Group Corporation (20)
1Running head MARKETING PLAN AND SALES STRATEGY2Running hea.docx
Tricia Kubair Dr Pepper Snapple Group Corporation
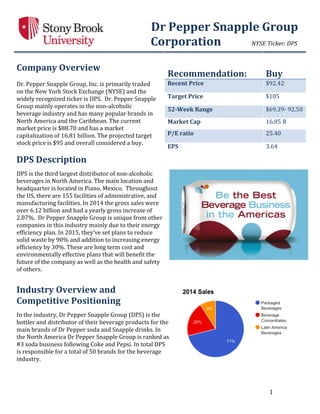
1. Dr
Pepper
Snapple
Group
Corporation
NYSE
Ticker:
DPS
1
Company
Overview
Dr.
Pepper
Snapple
Group,
Inc.
is
primarily
traded
on
the
New
York
Stock
Exchange
(NYSE)
and
the
widely
recognized
ticker
is
DPS.
Dr.
Pepper
Snapple
Group
mainly
operates
in
the
non-‐alcoholic
beverage
industry
and
has
many
popular
brands
in
North
America
and
the
Caribbean.
The
current
market
price
is
$88.70
and
has
a
market
capitalization
of
16.81
billion.
The
projected
target
stock
price
is
$95
and
overall
considered
a
buy.
DPS
Description
DPS
is
the
third
largest
distributor
of
non-‐alcoholic
beverages
in
North
America.
The
main
location
and
headquarter
is
located
in
Piano,
Mexico.
Throughout
the
US,
there
are
155
facilities
of
administrative,
and
manufacturing
facilities.
In
2014
the
gross
sales
were
over
6.12
billion
and
had
a
yearly
gross
increase
of
2.07%.
Dr
Pepper
Snapple
Group
is
unique
from
other
companies
in
this
industry
mainly
due
to
their
energy
efficiency
plan.
In
2015,
they’ve
set
plans
to
reduce
solid
waste
by
90%
and
addition
to
increasing
energy
efficiency
by
30%.
These
are
long
term
cost
and
environmentally
effective
plans
that
will
benefit
the
future
of
the
company
as
well
as
the
health
and
safety
of
others.
Industry
Overview
and
Competitive
Positioning
In
the
industry,
Dr
Pepper
Snapple
Group
(DPS)
is
the
bottler
and
distributor
of
their
beverage
products
for
the
main
brands
of
Dr
Pepper
soda
and
Snapple
drinks.
In
the
North
America
Dr
Pepper
Snapple
Group
is
ranked
as
#3
soda
business
following
Coke
and
Pepsi.
In
total
DPS
is
responsible
for
a
total
of
50
brands
for
the
beverage
industry.
Recommendation:
Buy
Recent
Price
$92.42
Target
Price
$105
52-‐Week
Range
$69.39-‐
92.50
Market
Cap
16.85
B
P/E
ratio
25.40
EPS
3.64
2. Dr
Pepper
Snapple
Group
Corporation
NYSE
Ticker:
DPS
2
The
segments
operating
in
the
industry
focuses
on
packaged
and
concentrated,
beverages,
and
direct
Latin
American
beverages.
The
main
sales
of
70%
are
generated
in
the
US
and
Canada.
An
additional
20%
of
sales
are
generated
through
the
branded
concentrates
and
syrup
markets.
The
remaining
10%
in
sales
are
accounted
for
in
Latin
America.
Dominating
the
Industry
Although
competitors
such
as
the
1st
and
2nd
ranking
are
popular
beverage
drinks,
Dr
Pepper
and
Snapple
group
are
the
#1
flavored
carbonated
soft
drinks.
DPS’s
ginger
ale,
Canada
Dry,
is
ranked
as
the
#1
the
second
main
brand,
7
Up
is
ranked
2nd
best
lemon
lime
carbonated
drink,
the
famous
A&W
root
beer
is
ranked
#1
and
lastly
DPS’s
popular
orange
carbonated
drink,
Sunkist,
is
ranked
#1
in
the
US.
Investment
Summary
Dr
Pepper
Snapple
Group
has
done
exceedingly
well
compared
to
industry
averages.
This
company
is
the
third
leader
in
the
industry
following
Coca-‐Cola
and
PepsiCo.
The
current
stock
price
for
DPS
is
at
the
all
time
highest
since
the
IPO
in
2008.
Although
the
company
is
not
as
expansive
as
its
competitors,
DPS
is
popular
and
well
known
in
three
areas,
US,
Canada
and
Mexico.
By
focusing
on
certain
locations,
DPS
has
formed
a
niche
in
the
market
by
creating
specific
brands
for
different
cultures.
For
net
profit
margin,
DPS
is
higher
at
11.5%
compared
to
the
industry
average
of
6%.
Environmental
Awareness
Dr
Pepper
Snapple
is
a
leader
in
reducing
CO2
emission
in
the
beverage
industry.
For
2015
the
goal
in
manufacturing
is
to
reduce
CO2
emissions
by
10%
per
gallon
of
finished
product.
To
be
more
effective
with
the
resources
such
as
fuel,
DPS
is
increasing
product
shipments
by
20%
for
every
gallon
of
fuel
used.
Additionally,
DPS
is
investing
in
energy
efficiency
by
replacing
60,000
vending
machines
and
coolers
to
use
30%
less
energy.
Also,
this
beverage
company
is
concerned
about
water
and
waste
discharge
so
it
has
committed
to
reducing
water
use
and
wastewater
by
10%
per
gallon
of
product.
Another
astounding
goal
for
2015
is
to
recycle
90%
of
manufacturing
solid
waste.
3. Dr
Pepper
Snapple
Group
Corporation
NYSE
Ticker:
DPS
3
Financial
Analysis
Revenue
and
Dividend
Growth
Compared
to
competitors,
DPS
has
performed
extremely
well
in
revenue
growth.
In
the
last
12
months,
Dr
Pepper
Snapple
Group
has
shown
a
positive
performance
in
growth.
Along
with
revenue
growth,
DPS
continues
to
have
the
highest
12-‐month
dividend
growth
amongst
its
top
two
competitors.
In
the
last
year,
Dr
Pepper
Snapple
Group
has
grown
dividends
by
43.4%.
Fundamental
Analysis
Liquidity
With
a
current
ratio
of
1.17,
Dr
Pepper
Snapple
group
has
an
acceptable
short-‐term
obligation.
The
current
ratio
is
also
lower
compared
to
the
industry
average
ratio
of
1.82
indicating
efficient
use
of
their
resources
in
working
capital.
DPS
has
increased
their
current
ratio
every
year.
From
2013,
the
current
ratio
was
1.09
and
increased
by
7%
in
2014.
The
quick
ratio
for
DPS
in
2014
is
0.97,
which
is
similar
to
its
two
top
competitors.
Net
working
capital
from
2013
to
2014
has
increased
by
94%
from
103
to
173.
DPS
has
improved
from
the
past
by
having
more
assets
compared
to
liabilities.
Compared
to
its
competitors,
Dr
Pepper
Snapple
Group,
is
expanding
their
market
and
assets,
and
projects
to
have
another
increase
in
net
working
capital
at
the
end
of
the
fiscal
year.
4. Dr
Pepper
Snapple
Group
Corporation
NYSE
Ticker:
DPS
4
Account
Receivable
Turnover
Account
receivables
turnover
ratio
indicates
how
the
company
uses
their
assets.
Account
receivable
manages
the
credit
that
is
issued
to
its
customers.
Since
this
credit
is
interest
free,
the
higher
the
ratio,
signifies
the
debt
is
paid
in
an
adequate
amount
of
time.
Compared
to
the
industry
average
of
10.38,
Dr
Pepper
Snapple’s
average
is
slightly
lower
at
9.92.
For
year
over
year
change,
DPS
stays
within
the
9.3-‐
9.9
range.
To
determine
the
number
of
accounts
receivable
DPS
receives
per
year,
365
days
is
divided
by
the
account
receivable
turnover
ratio
of
9.92,
which
gives
on
average
37
accounts.
Inventory
turnover
The
turnover
ratio
is
determined
by
dividing
the
sales
by
inventory.
The
inventory
turnover
for
the
industry
is
16.90.
In
2014
DPS
turnover
ratio
was
30.
Compared
to
the
industry
average,
DPS
is
showing
a
higher
ratio,
which
indicates
stronger
sales.
In
other
words,
DPS
indicates
a
turnover
exceedingly
higher
compared
to
the
industry.
Regarding
year
over
year
change,
DPS
has
shown
an
increase
in
inventory
turnover
from
2010
to
2011
at
21%.
The
years
following
2011
have
remained
constant
with
a
ratio
around
30.
5. Dr
Pepper
Snapple
Group
Corporation
NYSE
Ticker:
DPS
5
Day
Sales
Outstanding
The
day
sales
outstanding
measures
how
many
days
it
takes
the
firm
to
receive
revenue
after
the
sale
has
been
made.
To
calculate
the
ratio,
accounts
receivable
is
divided
by
the
total
credit
sales
and
multiplied
by
365.
The
day
sale
outstanding
for
the
beverage
industry
is
37
days.
For
DPS,
the
ratio
is
also
37
compared
to
the
industry
average.
It
takes
37
days
for
DPS
to
receive
the
revenue
after
making
the
sale.
The
lower
the
ratio,
the
less
time
a
company
waits
between
sale
and
payment.
Although
DPS
has
a
ratio
comparable
to
the
industry
average,
it
is
in
the
best
interest
of
the
company
to
lower
the
day
sale
outstanding
ratio.
The
lower
the
ratio
the
higher
the
flow
of
cash
within
the
company.
Total
Asset
Turnover
Total
asset
turnover
is
a
company’s
indication
for
how
much
sales
and
revenue
is
generated
from
assets.
If
a
company
has
a
high
ratio,
they
are
receiving
a
sufficient
amount
in
returns
for
the
assets
they
own.
The
industry
average
for
asset
turnover
is
1.37.
For
DPS
the
company
is
less
than
the
industry
average
with
a
ratio
of
0.74.
However,
over
the
last
5
years
DPS
has
increased
their
asset
turnover
by
16%.
6. Dr
Pepper
Snapple
Group
Corporation
NYSE
Ticker:
DPS
6
To
Debt
to
Asset
Ratio
Dr
Pepper
Snapple
has
a
debt
to
asset
ratio
of
0.72.
The
industry
average
is
slightly
lower
at
0.66.
DPS
exhibits
a
higher
debt
to
asset
ratio
showing
that
72%
of
assets
are
leveraged,
leaving
limited
financial
flexibility.
The
reason
behind
the
seemingly
high
ratio
can
be
argued
that
the
company
is
relatively
larger
compared
to
its
competitors
in
the
industry.
Compared
to
the
two
top
competitors,
Coca
Cola
(COKE)
and
PepsiCo
(PEP),
DPS
has
a
similar
yet
lower
debt
to
asset
ratio.
Net
Profit
and
Gross
Profit
Margins
The
net
profit
margin
is
the
revenue
minus
cost
of
goods
sold,
operating
expenses,
interest
and
taxes.
The
beverage
industry
average
for
net
profit
margin
is
6%
Dr
Pepper
Snapple’s
net
profit
margin
is
almost
double
the
industry
average
at
11.5%.
DPS.
The
gross
profit
margin
is
an
indicator
to
determine
a
company’s
financial
health.
If
the
gross
profit
does
not
fluctuate,
it
indicates
a
stable
profit
within
a
company.
DPS
has
shown
a
relatively
stable
gross
profit
margin
hovering
around
59%.
The
beverage
industry
has
an
average
of
39%
for
gross
profit
margin.
DPS’s
margin
of
59%
signifies
that
the
company
receives
59%
of
revenue
after
deducting
COGS
related
expenses.
Their
margin
is
relatively
higher
than
most
in
the
industry
suggesting
DPS
has
lower
COGS
compared
to
other
companies.
7. Dr
Pepper
Snapple
Group
Corporation
NYSE
Ticker:
DPS
7
P/E
ratio
The
price
to
earnings
ratio
measure’s
a
company’s
current
share
price
relative
to
its
earnings.
The
industry
average
is
35.95
and
DPS’s
is
25.47.
The
low
P/E
ratio
of
DPS
is
an
indication
that
the
company
is
undervalued.
The
year
over
year
change
for
P/E
ratio
has
increased
by
27%
from
2013
to
2014.
This
the
largest
increase
in
the
past
five
years
for
DPS.
Technical
Analysis
Beta
Beta
is
used
to
measure
systematic
risk
for
a
stock.
When
beta
is
equal
to
1,
the
price’s
security
will
move
with
the
market’s
rate
of
risk.
If
beta
is
less
than
one,
then
the
company
is
less
volatile
compared
to
the
market.
If
beta
is
greater
than
1,
this
is
an
indicator
that
the
stock’s
security
price
is
more
volatile
than
the
market.
The
industry
average
beta
is
0.83
and
Dr
Pepper
Snapple
Group’s
beta
is
0.79,
which
indicates
less
volatility
compared
to
the
market.
8. Dr
Pepper
Snapple
Group
Corporation
NYSE
Ticker:
DPS
8
Institutional
holdings
Dr
Pepper
Snapple
Group
has
total
of
631
institutions
holding
shares
that
make
up
95%
of
holdings.
The
top
shareholder
is
Vanguard
Group,
Inc.
with
16,
874,198
shares
valued
for
$1,333,905,402.
The
second
largest
holder
is
Cedar
Rock
Capital
Limited
with
12,143,197
shares
valued
at
$
959,943,474.
The
third
largest
holder
is
JP
Morgan
Chase
&
Company
with
8,722,884
valued
at
689,544,006.
Short
Interest
%
of
Float
Short
percentage
is
the
ratio
of
tradable
shares
that
are
shorted
to
shares
in
the
market,
otherwise
known
as
float.
To
find
the
percentage
the
total
the
shares
outstanding
divide
amount
of
shares
shorted.
The
industry
average
across
several
different
beverage
companies
express
short
ratio
of
3%.
The
current
short
percentage
of
float
for
DPS
is
3.5%.
Although
DPS
has
a
higher
percentage,
overall
the
industry
and
Dr
Pepper
Snapple
have
a
relatively
low
short
percentage.
Having
a
low
percentage
indicates,
there
is
less
likely
a
chance
this
stock
will
fall
drastically.
9. Dr
Pepper
Snapple
Group
Corporation
NYSE
Ticker:
DPS
9
50
and
100-‐Day
Moving
Average
The
moving
average
shows
then
trend
on
past
prices.
For
DPS
both
the
50-‐day
and
100-‐day
moving
average
show
a
clear
indication
the
stock
price
will
continue
to
rise.
In
the
last
month
the
stock
prices
has
been
higher
than
the
50
day
moving
average
which
has
also
been
higher
than
the
100
day
moving
average.
The
Relative
Strength
Index
(RSI)
is
currently
64.
In
the
last
several
weeks,
the
RSI
has
fluctuated
due
to
the
recent
increase
in
stock
price.
However,
since
the
RSI
is
approaching
the
70
level,
the
stock
may
experience
a
decrease
in
price.
Given
DPS’s
stock
price
has
exceeded
the
52-‐week
high;
this
is
considered
a
breakout
since
it
is
above
the
level
of
resistance.
-‐-‐-‐-‐
50
day
-‐-‐-‐-‐
100
day
-‐-‐-‐-‐
DPS
50
and
100-‐Day
Moving
Average
10. Dr
Pepper
Snapple
Group
Corporation
NYSE
Ticker:
DPS
10
Valuation
Dividend
Discount
Model
The
valuation
of
the
current
stock
prices
was
found
by
using
the
Dividend
Discount
Model.
The
dividend
payout
ratio
was
analyzed
by
dividing
the
current
dividend
by
the
calculated
EPS.
The
dividend
payout
ratio
of
52%
indicates
that
this
percentage
of
net
income
is
paid
to
stockholders
in
dividends.
The
growth
rate
of
14.7%
was
calculated
by
analyzing
the
ROE*
(1-‐
dividend
payout).
Then,
to
determine
the
expected
rate
of
return
the
current
dividend
was
divided
by
the
stock
price
and
added
to
the
growth
rate.
The
high
expected
rate
of
return
is
16.8%.
To
determine
the
estimated
valuation
per
share
of
a
stock,
the
discounted
value
of
all
future
dividends
is
evaluated.
The
dividend
period
was
found
by
using
the
current
dividend
multiplied
by
1
plus
the
growth
rate.
Current
dividend
is
$1.92
multiplied
by
(1+
.41712).
The
compounded
dividend
for
one
period
is
$2.20.
To
find
the
estimated
value
using
the
discounted
value
of
all
future
dividends
the
compounded
dividend
($2.20)
is
dividend
by
the
difference
of
the
expected
rate
of
return
(0.168)
and
the
growth
rate
(0.147).
The
estimated
value
per
share
of
stock
is
valued
~
$105.48.
Summary
The
recommendation
for
this
stock
is
buy.
The
beta
is
lower
than
1
specifically,
0.79.
The
stock
price
is
above
the
50
and
100-‐day
moving
averages.
11. Dr
Pepper
Snapple
Group
Corporation
NYSE
Ticker:
DPS
11
Appendix
Figure
1
Historical
Income
Statement
Figure
2
Financial
Ratios
12. Dr
Pepper
Snapple
Group
Corporation
NYSE
Ticker:
DPS
12
Figure
3
Stock
Industry
Average