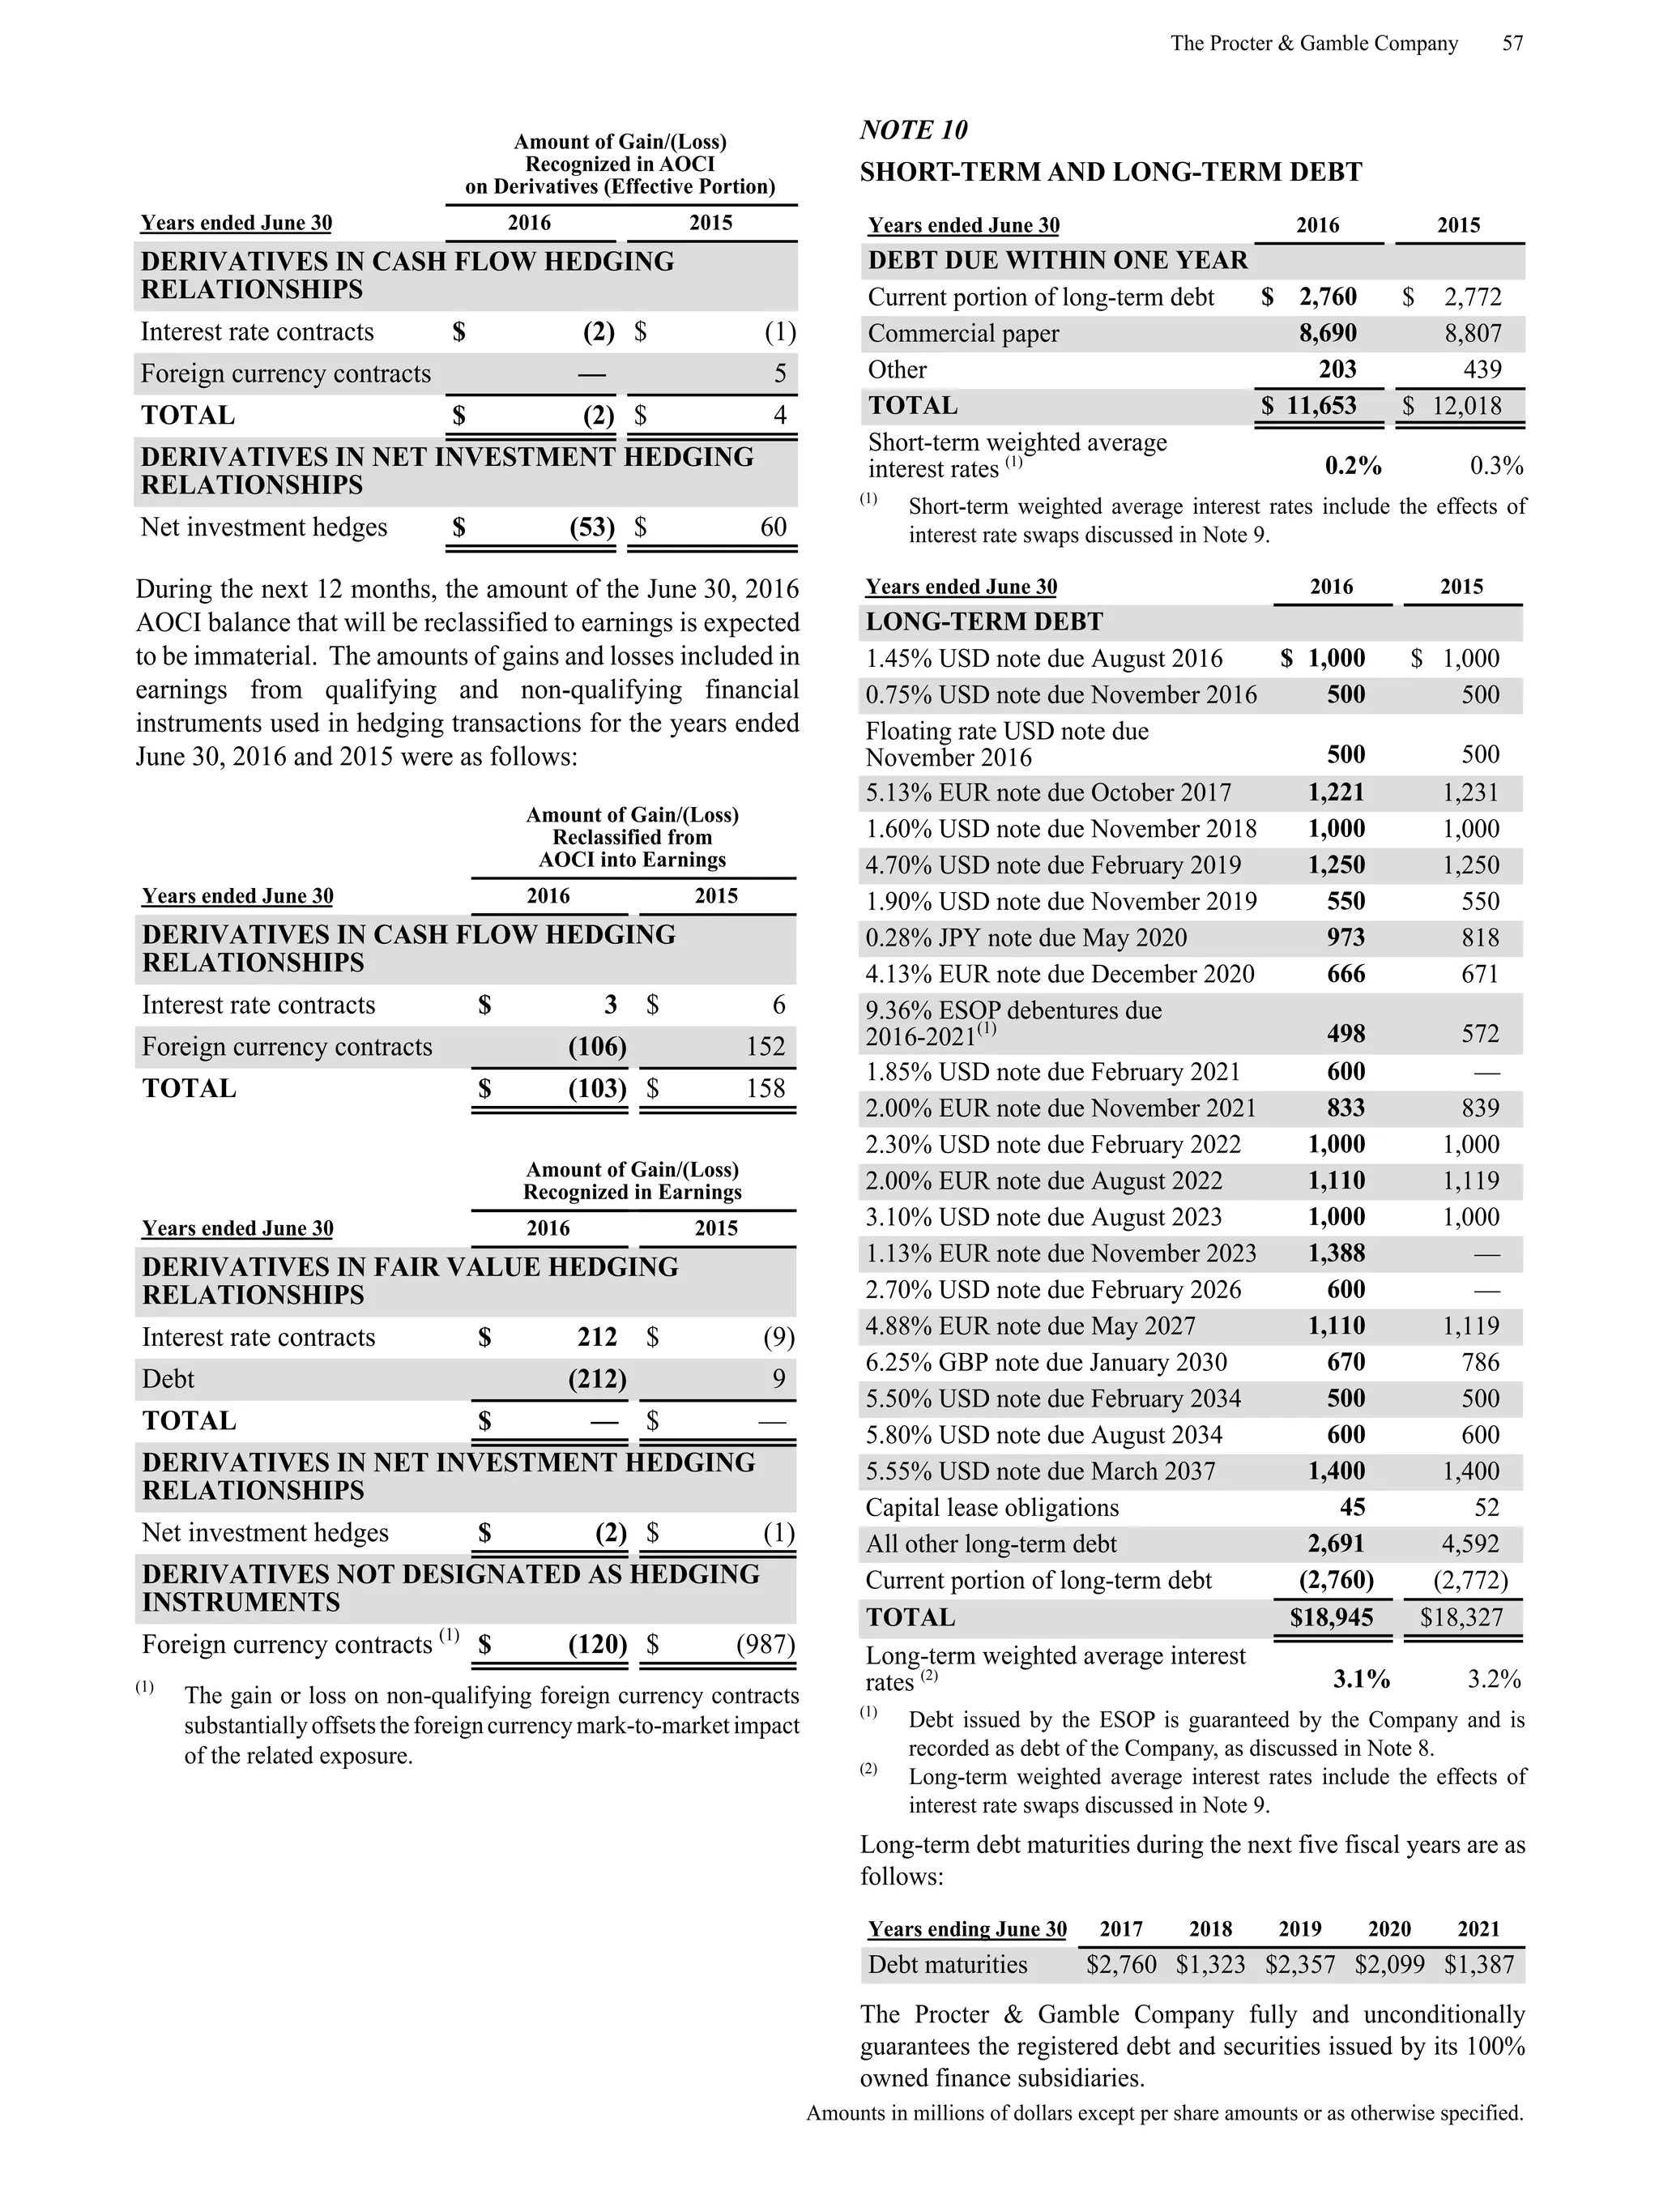
Download to read offline


![UNITED STATES SECURITIES AND EXCHANGE COMMISSION
Washington, D.C. 20549
Form 10-K
(Mark one)
[x] ANNUAL REPORT PURSUANT TO SECTION 13 OR 15(d) OF THE SECURITIES EXCHANGE ACT OF 1934
For the Fiscal Year Ended June 30, 2016
OR
[ ] TRANSITION REPORT PURSUANT TO SECTION 13 OR 15(d) OF THE SECURITIES EXCHANGE ACT OF
1934
For the transition period from to
Commission File No. 1-434
THE PROCTER & GAMBLE COMPANY
One Procter & Gamble Plaza, Cincinnati, Ohio 45202
Telephone (513) 983-1100
IRS Employer Identification No. 31-0411980
State of Incorporation: Ohio
Securities registered pursuant to Section 12(b) of the Act:
Title of each class Name of each exchange on which registered
Common Stock, without Par Value New York Stock Exchange, NYSE Euronext-Paris
Indicate by check mark if the registrant is a well-known seasoned issuer, as defined in Rule 405 of the Securities Act. Yes No
Indicate by check mark if the registrant is not required to file reports pursuant to Section 13 or 15(d) of the Act. Yes No
Indicate by check mark whether the registrant (1) has filed all reports required to be filed by Section 13 or 15(d) of the Securities Exchange
Act of 1934 during the preceding 12 months (or for such shorter period that the registrant was required to file such reports), and (2) has
been subject to such filing requirements for the past 90 days. Yes No
Indicate by check mark whether the registrant has submitted electronically and posted on its corporate website, if any, every Interactive
Data File required to be submitted and posted pursuant to Rule 405 of Regulation S-T (§232.405 of this chapter) during the preceding
12 months (or for such shorter period that the registrant was required to submit and post such files). Yes No
Indicate by check mark if disclosure of delinquent filers pursuant to Item 405 of Regulation S-K is not contained herein, and will not be
contained, to the best of registrant's knowledge, in definitive proxy or information statements incorporated by reference in Part III of this
Form 10-K or any amendment to this Form 10-K.
Indicate by check mark whether the registrant is a large accelerated filer, an accelerated filer, a non-accelerated filer or a smaller reporting
company (as defined in Rule 12b-2 of the Exchange Act).
Large accelerated filer Accelerated filer Non-accelerated filer Smaller reporting company
Indicate by check mark whether the registrant is a shell company (as defined in Rule 12b-2 of the Exchange Act). Yes No
The aggregate market value of the voting stock held by non-affiliates amounted to $215 billion on December 31, 2015.
There were 2,668,751,125 shares of Common Stock outstanding as of July 31, 2016.
Documents Incorporated by Reference
Portions of the Proxy Statement for the 2016 Annual Meeting of Shareholders which will be filed within one hundred and twenty days
of the fiscal year ended June 30, 2016 (2016 Proxy Statement) are incorporated by reference into Part III of this report to the extent
described herein.](https://image.slidesharecdn.com/pg-170101081259/75/P-amp-g-13-2048.jpg)


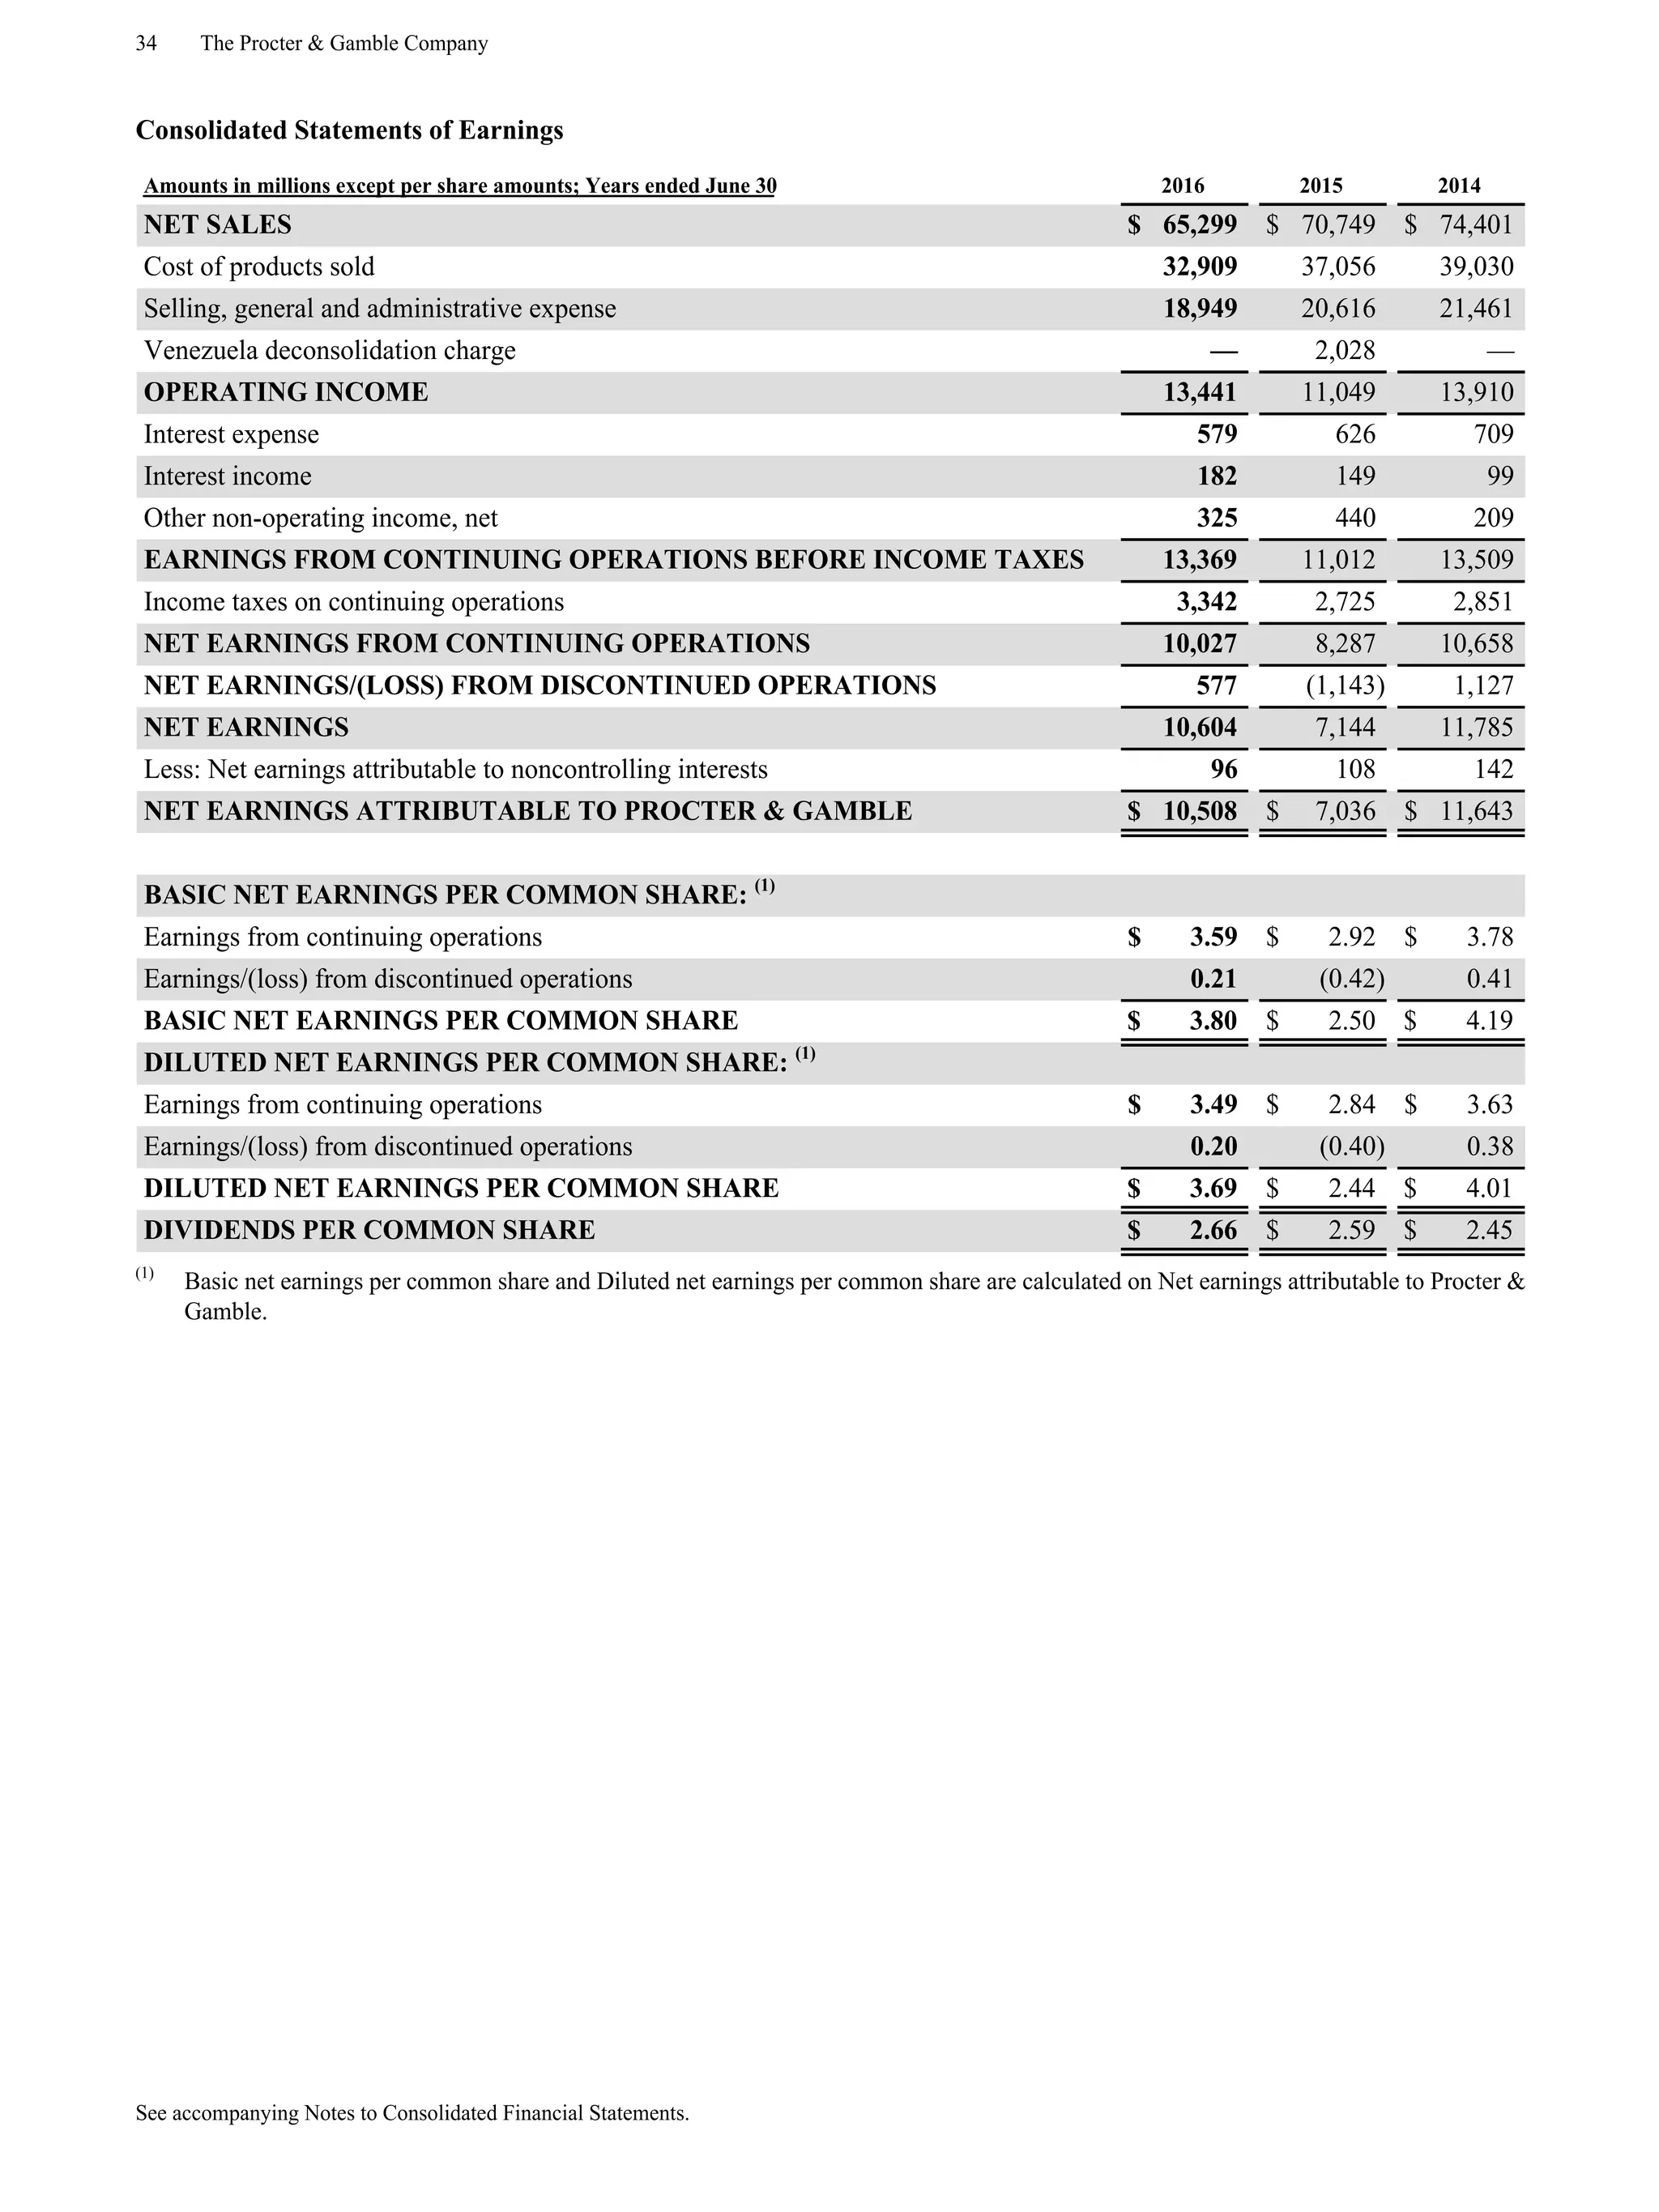

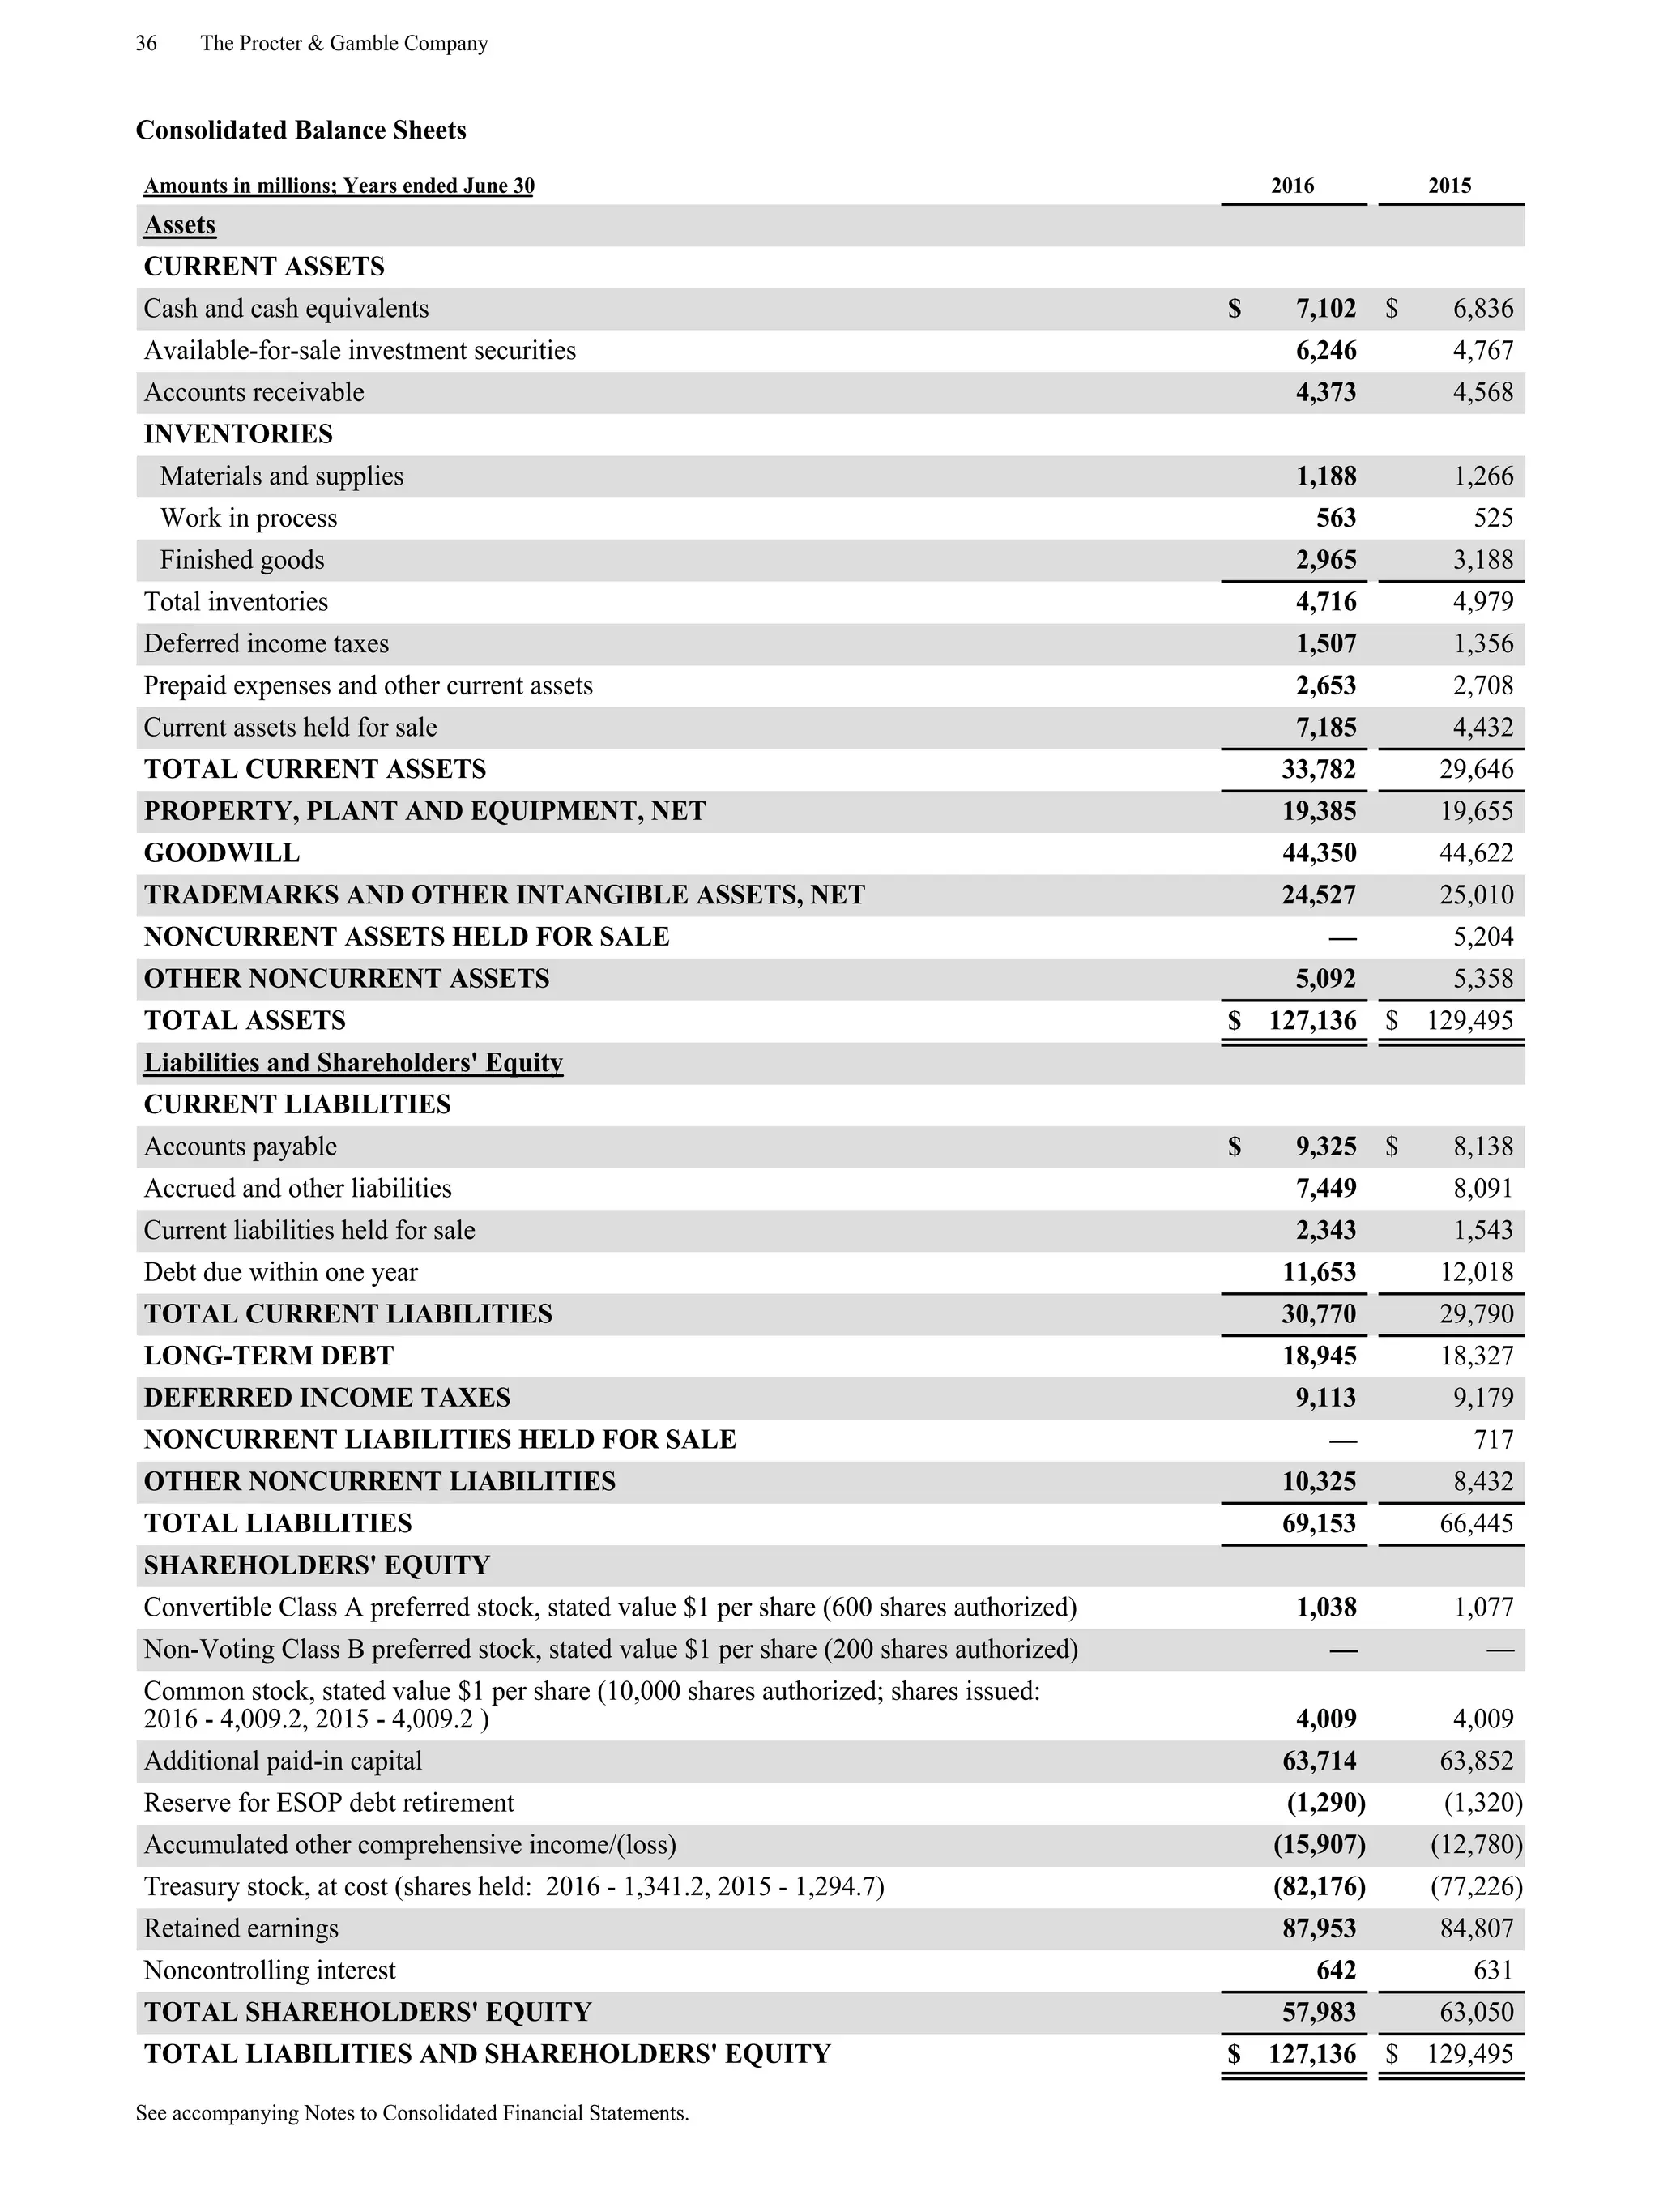


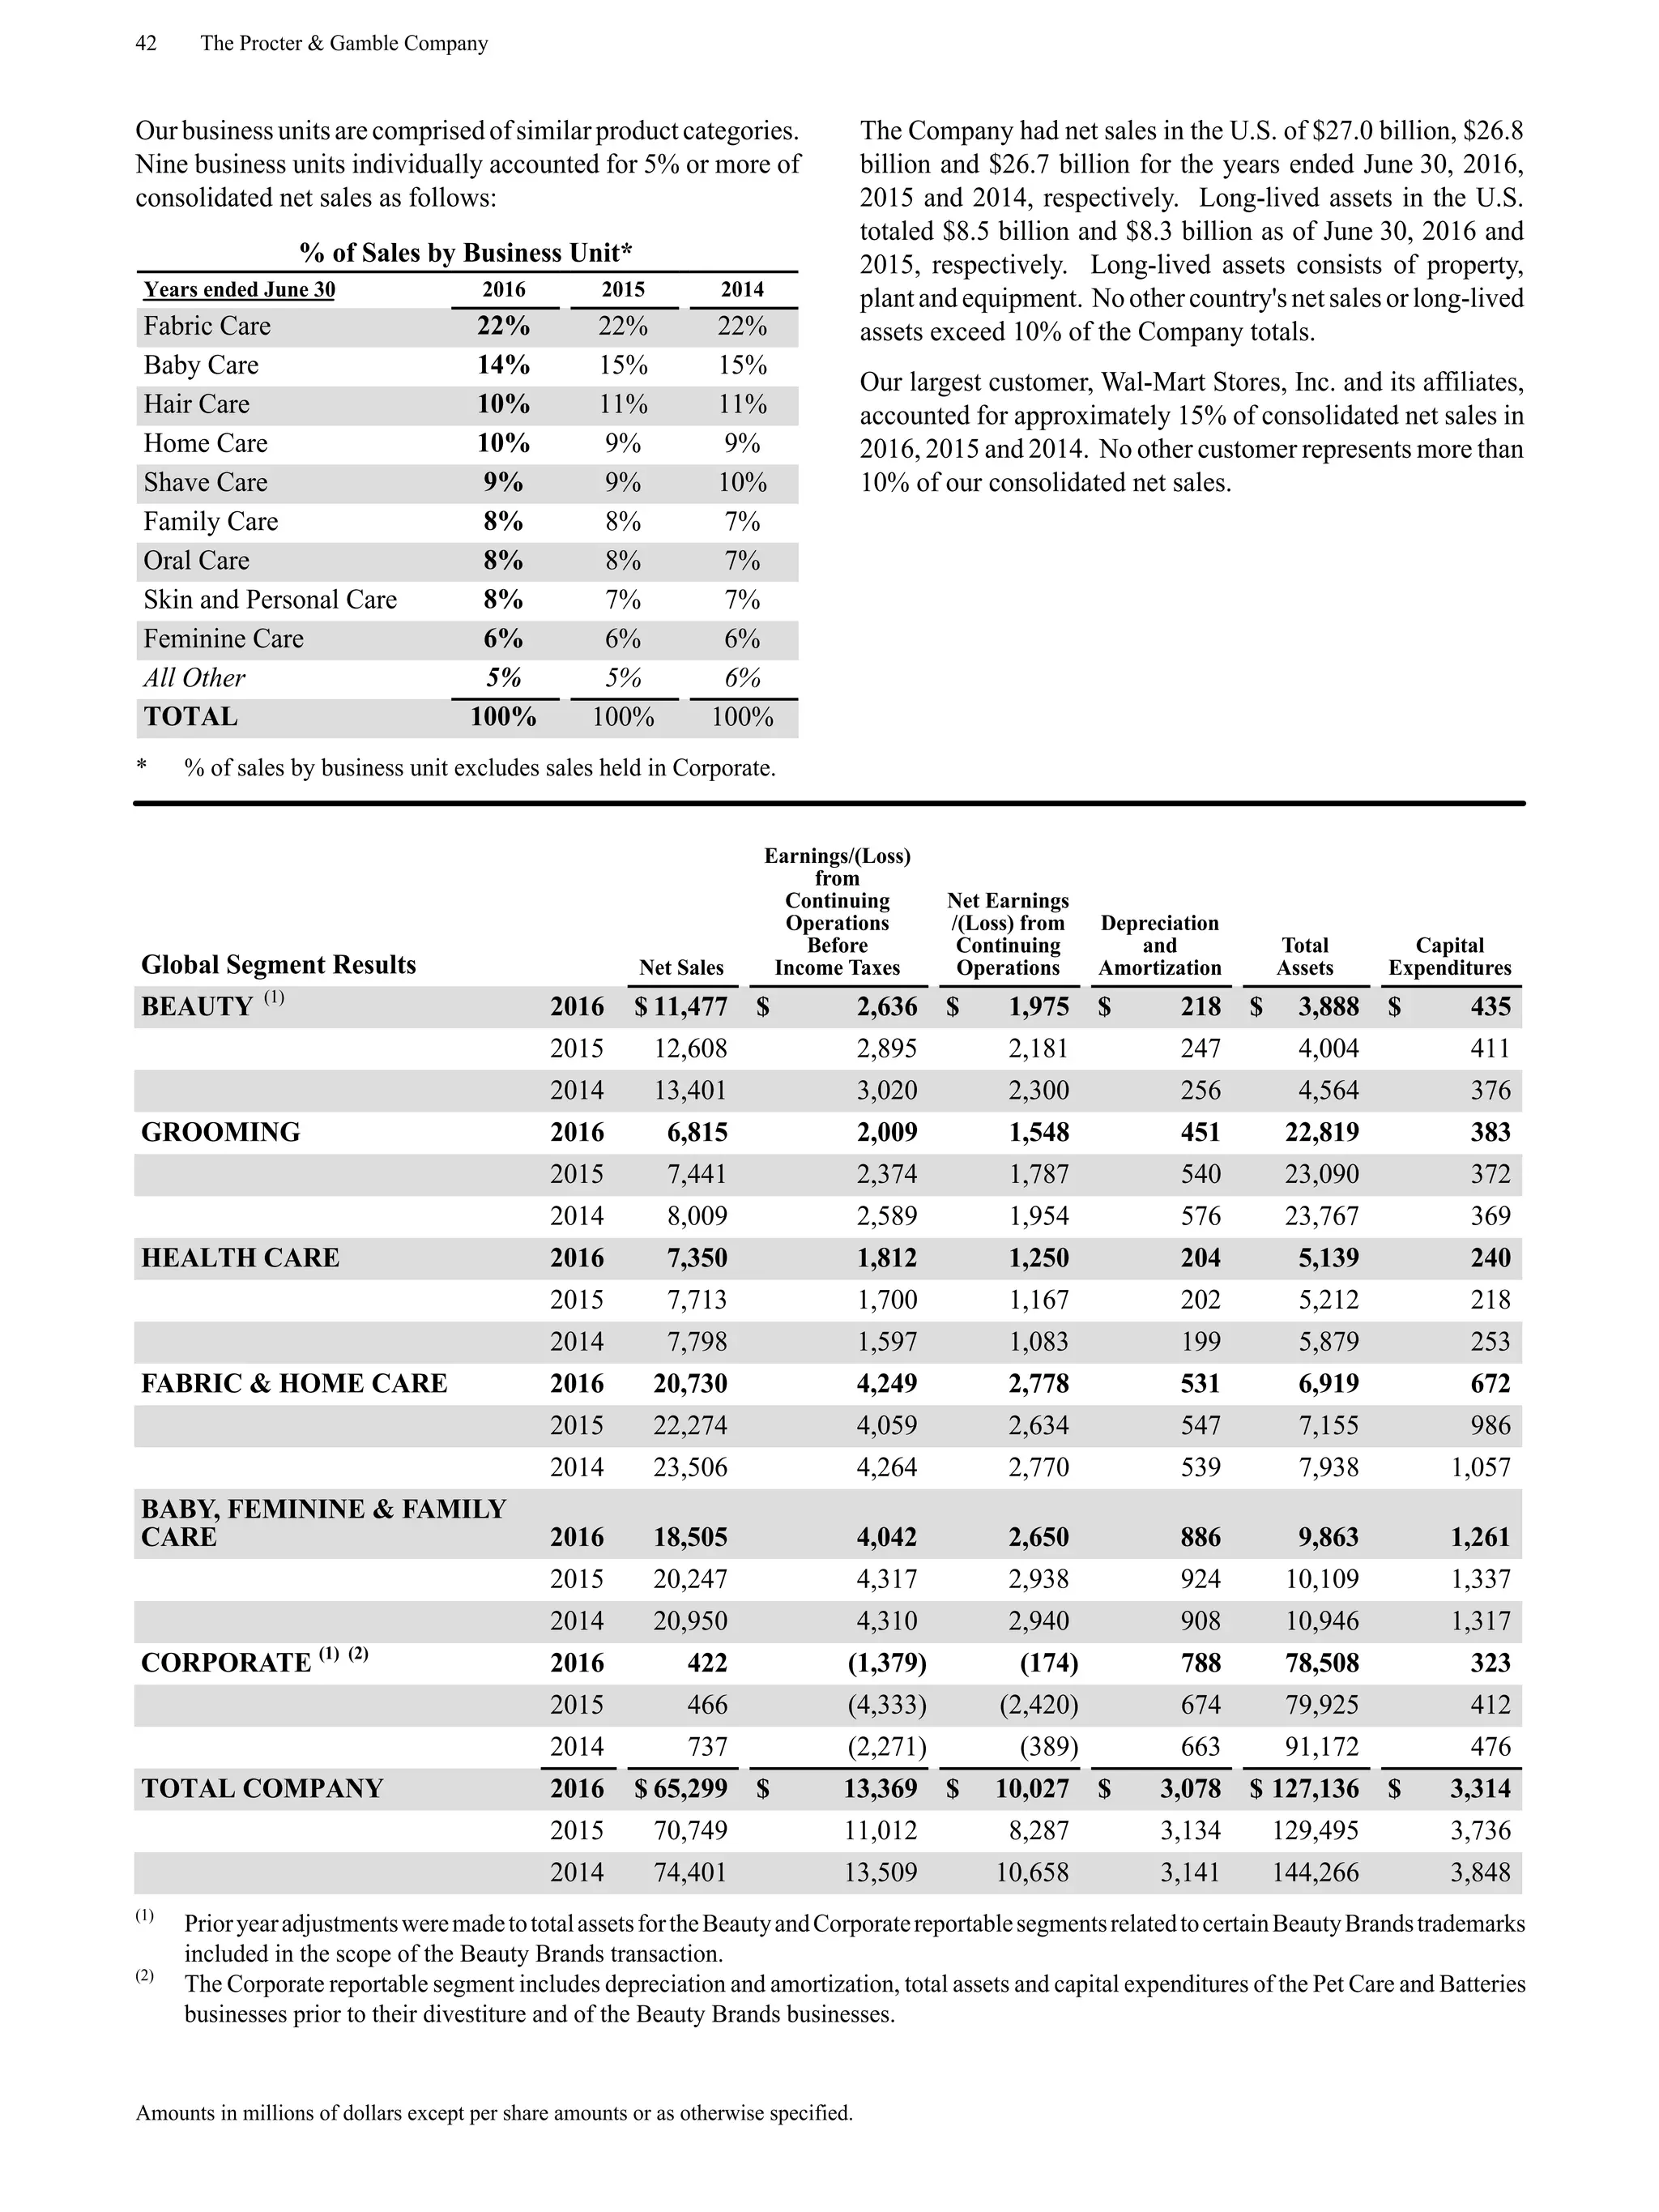


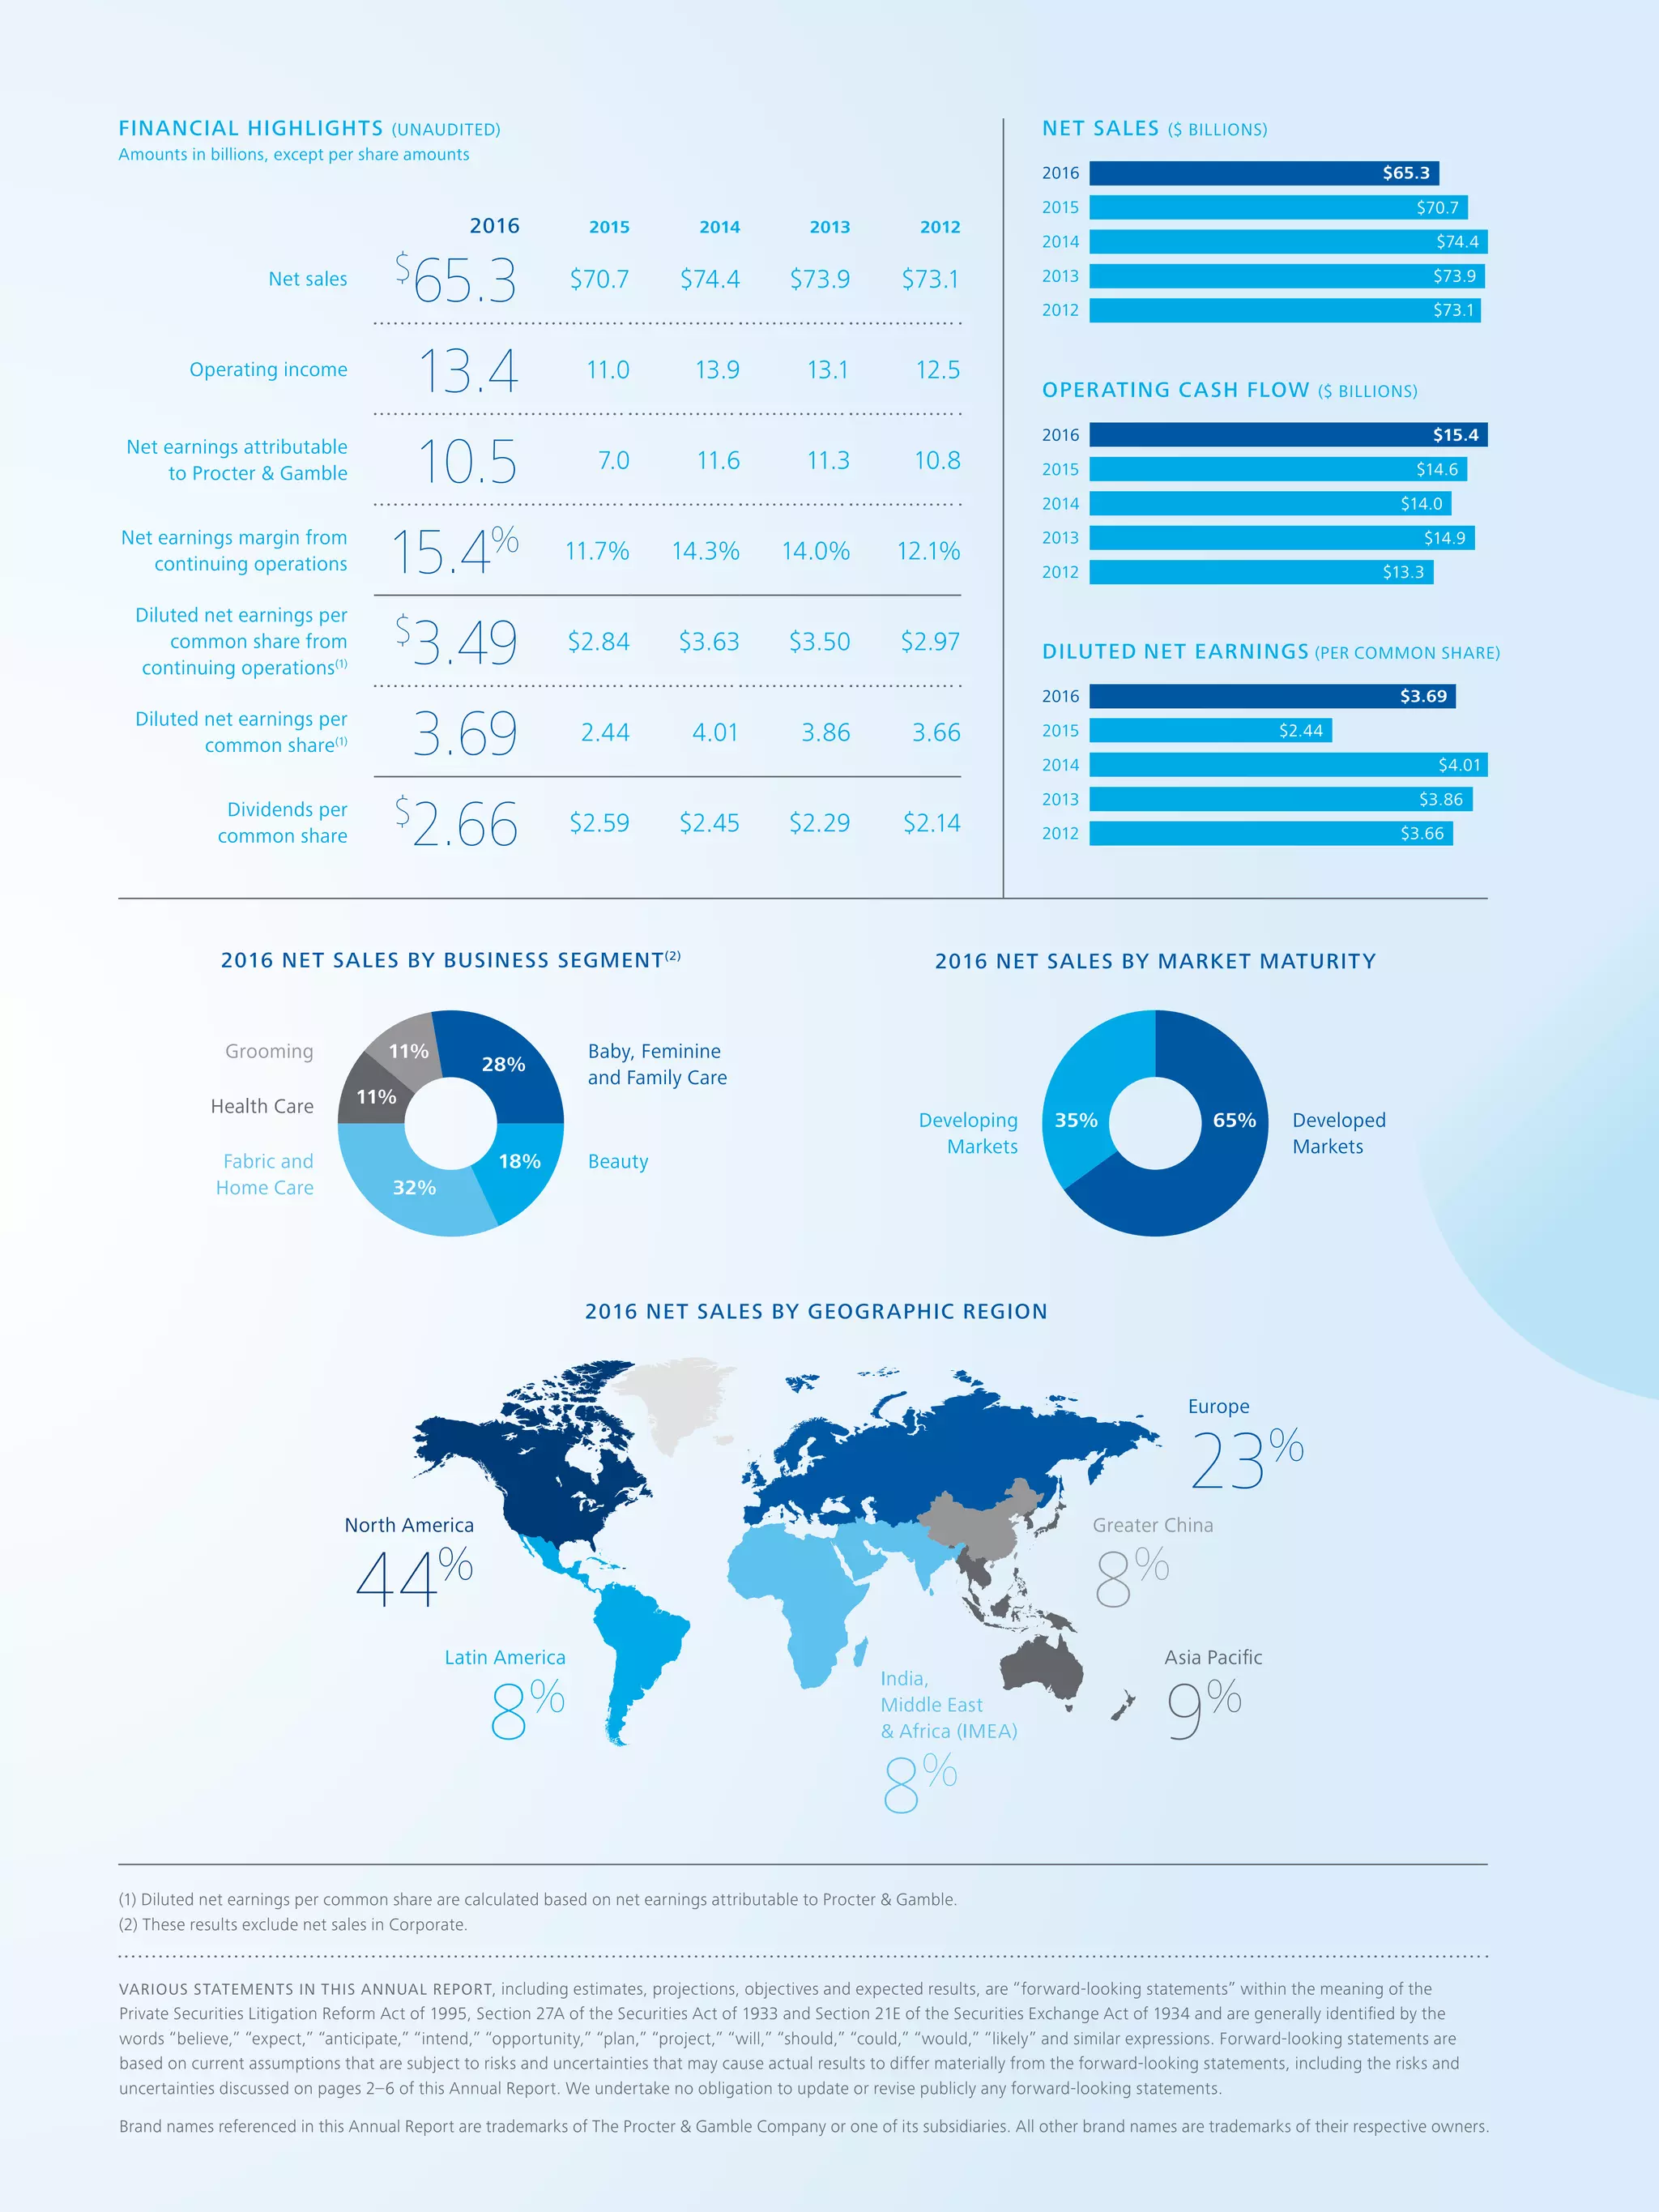
P&G's 2016 annual report provides financial highlights and discusses progress and challenges over the fiscal year. Net sales declined 8% to $65.3 billion due to divestitures and foreign exchange impacts, while core earnings per share declined slightly. The report discusses steps taken to streamline products, improve productivity and costs, and invest in growth. These include exiting unprofitable product lines, reducing overhead costs, and delivering over $10 billion in savings over 5 years. Progress was made in a difficult environment with foreign exchange headwinds, but more work is needed to strengthen growth and performance.