Downloaded 80 times


![well as its content. The immediate goal was to see" how disk space was being used. The
research goal was to nd a better way to browse large hierarchical data spaces.
1.2 Contribution
The primary objective of this research is the e ective visualization of large bodies of hier-
archically structured information. E ective visualizations of large bodies of hierarchically
structured information can help users gain insight into relevant features of the data, construct
accurate mental models of the information, and search for regions of particular interest.
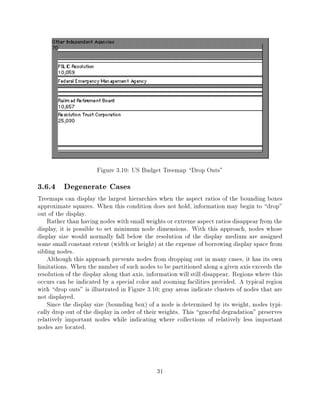
Current hierarchical display techniques scale poorly and are poor tools for dealing with
large hierarchical data sets. In addition to scaling poorly existing techniques have generally
not been designed to deal with multi-dimensional data sets. The algorithms have generally
been designed to represent small static hierarchies on pieces of paper. They have not been
designed as interactive presentation techniques for large, complex data sets.
The major contributions of this dissertation are the:
Development of a uni ed theory of containment based hierarchical visualization,
Implementation of interactive treemaps, and
Controlled evaluation of interactive treemaps.
Part of my contribution and a good deal of my motivation have been related to giving
treemaps a solid foundation. Establishing the treemap concept as legitimate new child in the
evolution of data graphics has provided a uni ed encapsulation of many previously existing
techniques.
The idea of representing hierarchy via partitioned rectangles has been extended into a
general glyph based multi-variate hierarchical visualization technique capable of partitioning
display spaces of arbitrary dimensionality in any coordinate system.
With combinations of partitioning dimensions, extrusions, o sets, weights, and rendering
geometries the generalized treemap algorithm developed in this dissertation can generate:
outlines, node and link tree diagrams, bar charts, stacked bar charts (XDU Dyk91]), pie
charts, hierarchical pie charts, drum trees CZP93], cone trees RMC91], cam trees , venn Di-
agrams, standard 2-D treemaps JS91] Shn92] Joh92], 2+D treemaps TJ92], 3-D treemaps,
and N-dimensional treemaps.
This dissertation consists of two major pieces (and contributions). The rst develops the
basic treemap concept and provides an algorithmic foundation for a grand uni ed theory
of hierarchical visualization. The second provides experimental validation of the bene ts of
treemaps as an interactive visualization tool. These two pieces show the depth of the graph-
ical presentations treemaps are capable of generating and the breadth of their applicability
to the challenges facing today's computer users.
3](https://image.slidesharecdn.com/1993brianjohnsondissertation-1311918672257-phpapp02-110729005208-phpapp02/85/Treemaps-Visualizing-Hierarchical-and-Categorical-Data-23-320.jpg)


![Chapter 2
Literature Review
For thousands and thousands of years people have been accumulating informa-
tion - written and drawn records - on tangible media in visible locations. Yet
now we have billions upon billions of records stored in an invisible way on media
that in many cases are also invisible to their users...
Even in the short history of the computer itself, however, the rise of huge in-
formational data bases is a recent one. The computer was originally seen as a
device for performing calculations, and the roots of these devices can be traced
back hundreds of years..."
Vei88]
The presentation of hierarchy has a long tradition, stretching back to family trees tracking
royal lineage and tree-structured graphs in mathematical texts. A vibrant but much newer
eld is that of computational visualization, presenting dynamic data coded via color, shape,
sound and other visual or auditory properties. The rich literature concerning human factors
and human-computer interaction can help bind the presentation of data to the needs of those
for whom the data holds meaning. The treemap drawing and tracking algorithms add to the
body of research concerning the graphic presentation of data.
2.1 Depicting Hierarchy
Presentations of hierarchical information range from those methods based entirely on text,
to methods based almost entirely on graphics. A rich body of literature concerning outlines,
tables of contents, and tree drawing already exists.
With the advent of powerful graphically based computers it is now possible to interac-
tively present complicated data visualizations on personal computers. Treemaps are less
reliant on textual feedback than most previous methods, and lie on the graphic visualization
end of the text/graphic spectrum.
6](https://image.slidesharecdn.com/1993brianjohnsondissertation-1311918672257-phpapp02-110729005208-phpapp02/85/Treemaps-Visualizing-Hierarchical-and-Categorical-Data-26-320.jpg)
![2.1.1 Textual Hierarchy Presentations
Textual presentations of hierarchy deal primarily with outlines and tables of contents, but
include full text listing as well. A recent example of research concerning the browsing of
large tables of contents is that of CWMS93].
2.1.2 Graphic Hierarchy Presentations - Tree Diagrams
Graphic presentations of hierarchy have been primarily concerned with the drawing and
navigation of traditional node and link tree diagrams. Drawing concerns are based on com-
putation time and visual appeal. The research strives to quickly draw tree diagrams which
are aesthetically appealing BKW89] Moe90] WS79] RT81] SR83]. More recent work has
also dealt with the drawing of dynamic trees Moe90].
Bruggeman and Wood build on the work of Reingold and Tilford. They make the point
that, It is a common understanding in book design that aesthetics and readability do not
necessarily coincide", and that readability is more important since conveying information is
the primary goal BKW89]. Their presentations are capable of making the structure of the
tree more obvious to the human eye, possibly at the expense of aesthetic pleasantness.
Large tree diagrams are often drawn on a virtual plane much larger than the display
device. Beard and Walker deal with the problem of 2-D navigation BI90]. A key feature
of their work is an experimental analysis of human performance using two similar direct-
manipulation techniques. Experimental analysis is generally lacking in most visualization
work. Researchers often simply proclaim the expected bene ts of their technique, without
bene t of user testing. Robertson, Mackinlay and Card deal with the problem of limited
display space via the addition of a third dimension, extending the traditional planar tree
diagram to 3-D cone trees RMC91]. Kaugars deals with limited display space by selective
node display and compression of portions of the tree Kau92].
Treemaps deal with a limited display space via space- lling approaches to the presentation
of hierarchy discussed in detail in this dissertation and in JS91] Shn92] TJ92]. Rectangular
Structure Charts (RSC's) are a text-based space- lling mosaic approach to drawing abstract
hierarchical structures Rit91].
2.1.3 Other Graphic Data Presentations
Data graphics is a broad eld of research. This section discusses some general presentation
approaches as well as presentations tailored to the domains of data structures and hypertext.
The section concludes with a brief survey of current visualization work. Card, Robertson,
and Mackinlay's information visualizer ideas embrace the concept of rooms containing related
information. Cone trees and perspective walls are two innovative concepts for the presen-
tation of hierarchical and linear data respectively CRM91] Cla91] MRC91], RMC91]. In
Shn91] Shneiderman discusses visual user interfaces for information exploration, the ideas
presented here include graphical approaches to Boolean query formulation , dynamic query
facilities for data bases, and treemaps for the presentation of hierarchical information WS93]
7](https://image.slidesharecdn.com/1993brianjohnsondissertation-1311918672257-phpapp02-110729005208-phpapp02/85/Treemaps-Visualizing-Hierarchical-and-Categorical-Data-27-320.jpg)
![Shn91] JS91] Shn92] TJ92]. Chimera extends the concept of treemaps and space- lling
visualization to one dimensional value bars" Chi92].
In Mac88] Mackinlay discusses the opportunities high-quality graphic displays provide,
along with the obligation they place on user interface designers. Cole highlights one of these
opportunities as he explains how computer graphics make mental models easier to form
and easier to explore" in the medical domain Col86].
Fitter and Green lists requirements for good diagrammatic notations as well as explaining
why designers cannot turn to behavioral science for detailed guidance, but must make use of
empirical evaluations FG79]. Prior to these general diagrammatic observations Green and
Fitter dealt with the particular case of ow-charts as structured diagrams GF78]. Nassi
and Shneiderman extend ow charts towards a more compact space- lling representation in
NS73]. In large or complex diagram detail in the neighborhood surrounding the current
focal point is often far more important than information further away, which is presumably
less relevant. Furnas explores this idea in his seminal work on sheye views" Fur86].
2.2 Fisheye Views
No one wants to miss seeing the forest for the trees." Fisheye views are a graphical approach
to emphasizing the interesting" features of large data set Fur86] HCMM89] Kau92] SB92]
SZB+92] Noi93]. Typically the degree of interest function is based on a geographic notion
of distance from a focal point.
Fisheye views of abstract data are based on the simple, fundamental idea of making
prominent data items visually prominent by allocating display real estate in a weighted
manner. Treemaps can be thought of as adopting a distributed degree of interest function
applied to each node and based only on local properties of the node.
2.3 Data Structures
Kamada provides a framework for mapping abstract objects and relations to graphical objects
and relations via user-de ned mapping rules Kam88]. Translating domain data to display
data is a visualization technique discussed in greater detail in Chapter 5. Ding and Mateti
provide a framework for the automated drawing of data structure diagrams in DM90]. They
collect the various rules and factors of aesthetics that go into the drawing of data structures as
distilled from a variety of textbooks, and formulate these subjective factors into computable
objectives. Radack and Desai describe a system for graphically displaying data structures
during program execution RD88].
A users mental model may depend on their current interests, as such there is not always a
best" interface structure for a given data set. In HH91] HH92], Henry and Hudson present
exible interface techniques for providing user controlled views of data-rich applications and
graph layouts. Karrer and Scacchi KS90] describe a extensible tree/graph editor tool kit for
the rapid creation of editors as user-interfaces to information domains.
8](https://image.slidesharecdn.com/1993brianjohnsondissertation-1311918672257-phpapp02-110729005208-phpapp02/85/Treemaps-Visualizing-Hierarchical-and-Categorical-Data-28-320.jpg)
![Large graphs are di cult to draw and understand. A variety of algorithms for drawing
large graphs are presented in HH90] MRH91] SM91]. Of particular interest is the work of
Henry and Hudson, which provides hierarchical layouts of graphs and allows user interaction
to guide the nal form of the display. Sarkar SB92] provides some extensions to earlier
sheye views of graphs.
2.4 Mosaic Displays of Statistical Contingency Tables
Statistician's have long been concerned with the presentation of data. Mosaic displays of
contingency tables are a close cousins have been developed for the graphical display of tabular
statistical contingency data HK81] Wan85] HK84].
Mosaic displays are based on the hierarchical decomposition of categorical data sets. This
work overlaps signi cantly with the material presented in Chapter 6 on categorical treemaps,
although the two bodies of work were developed independently from di erent points of view.
2.5 Hypertext
When discussing hypertext systems one often hears of the lost in space" problem. Navigat-
ing through graphs is an inherently di cult task for most users. The cognitive aspects of
hypertext navigation are discussed by Dillon, McKnight, and Richardson in DMR90], and
by Edwards and Hardman in EH89]. A variety of researchers including BRS92] Tra89]
have approached this problem by creating hierarchical displays of the backbone" of the
hypertext graph. Lesk stresses interactive solutions, which seem more promising than trying
to get detailed queries right the rst time Les89].
Other innovative approaches include the generation of mazes for users to navigate through
Lm91] and displays of nested boxes Tra89]. Travers use of nested boxes is particularly
interesting as the displays are very similar to small treemaps . In particular, The intricate
structure of the knowledge base is conveyed by a combination of position, size, color, and
font cues" Tra89].
2.6 Visualization
We graphicists choreograph colored dots on a glass bottle so as to fool the eye and mind into
seeing desktops, spacecraft, molecules, and worlds that are not and never can be." Bro88]
It has been argued for a long time the representation of a problem is of crucial impor-
tance to understanding and solving it. Equally accepted is the fact that the human visual
processing system is an incredible resource which can be applied directly to information
processing tasks given the right representation. In the past few systems taken advantage of
these insights. BFN86]
The concerns of visualization are not those of computer graphics, nor are they those of
the ne arts, although both of these are relevant elds . Visualization is concerned with
9](https://image.slidesharecdn.com/1993brianjohnsondissertation-1311918672257-phpapp02-110729005208-phpapp02/85/Treemaps-Visualizing-Hierarchical-and-Categorical-Data-29-320.jpg)
![the use of computer images to convey information, and hence foster understanding BC90]
Cox90], Ell90]. The visual display of quantitative information Tuf83] still comprises a large
portion of the eld, but the visualization of abstract objects and relations is equally important
important. Treemap visualization combines features of both quantitative visualization as well
as the visualization of objects and their relations. Brooks envision virtual-worlds research as
interactive graphics serving science, allowing users to grasp reality through illusion Bro88].
Exploratory data analysis is exactly that { exploratory. A colleague occasionally likes
to ask if treemaps are a solution looking for a problem. This is easy to answer as treemaps
were motivated by the very practical problem of full hard disk drives (with hierarchical le
systems). But suppose the initial motivation were not so clear, are innovative visualization
techniques rst-class citizens if they nd solutions before they nd problems. The answer of
course is yes, and to see why one need only read Owen's Answers First, Then Questions"
ND].
By giving users a unique view of reality visualization interfaces can provide users with
answers for which they must then determine the right question. Just as a person walking
in the woods may not be looking for a beehive, but upon noticing many bees may ask why,
and determine that a beehive is nearby. A person looking at a treemap may notice a cluster
of large light boxes, ask why, and determine that newly hired employees in a particular
department are highly paid. 3-D treemap worlds may become one of these worlds that can
never be, but that nevertheless help us grasp the reality of our data through illusion.
2.7 Human Factors
The rst commandment of interface development is Know Thy User." Without a thorough
understanding of the intended users of a system, developers can not hope to create an inter-
face that suits their needs. In Wic88], Wickens discusses the basics of human information
processing, decision-making, and cognition. Whereas Lohse takes on the task of modeling
a particular domain, the underlying perceptual and cognitive processes that people use to
decode information in a graph Loh91]. Butler attempts to determine the e ect of spatial
ability on the subsequent navigation of a hierarchical data base. While Furnas makes the
case that: (1)some graphical interfaces are easy to learn and use, (2) special cognitive pro-
cesses are possible, and (3) perhaps (1) and (2) are related, i.e. perhaps graphical interfaces
are useful because they engage graphical reasoning Fur91].
The design of quality graphic interfaces is a di cult process discussed in Hel87] RM90]
SM90] Tul88]. In LR90], Langen discusses a development environment which supports an
iterative design process. End user exibility is discussed by Garneau and Holynski in their
work on interactively adapting graphic displays GH89]. Whereas Leung, and Kitakaze and
Kasahara focus on the more narrowly de ned domains of interfaces for map based diagrams
and CRT text blinking, respectively Leu89] KK87].
Building a new interface is only half the battle, unfortunately it is the only half that
many new interfaces see. The other half is the evaluation of the interface JMWU91]. Lan-
dauer provides an overview of research methods in human-computer interaction. Explaining
10](https://image.slidesharecdn.com/1993brianjohnsondissertation-1311918672257-phpapp02-110729005208-phpapp02/85/Treemaps-Visualizing-Hierarchical-and-Categorical-Data-30-320.jpg)
![the di culties confronting developers of complex systems using formal tools of behavioral
research while emphasizing the need for analysis and iterative testing Lan88]. Shneiderman
also emphasizes the basics of human factors research, while also placing the glorious burden
of making the world a better place on the backs of computer professionals Shn80] Shn87]
Shn90].
The ip side of objective interface evaluation is subjective interface evaluation. Malone
tries to determine what makes computer games fun Mal81], while LaLomia and Sidowski,
and Chin, Diehl, and Norman discuss how to measure user satisfaction LS90] CDN88].
2.8 Color and Sound
Color can be used in graphical layouts to emphasize structure, encode domain information,
call attention to certain aspects of the layout, or simply for aesthetic reasons. Color can be a
potent tool for conveying information if applied thoughtfully, if applied poorly it can greatly
distract the user Hoa90] Liv92] Mac90] MMN88] Mei88] Ric91] RLS90]. Of particular
interest are the experimental studies of Hoadley, and of McDonald, Molander, and Noel.
Hoadley's results indicate that color improves time performance for tables, pie charts, and
bar graphs, and accuracy performance for pie charts and line graphs" Hoa90]. In contrast,
the results of McDonald et al. fail to nd advantages for color in categorical menu layouts.
There is no reason to limit the information emanating from the computer side of the
human-computer interface to a purely visual domain. A good deal of research concerns the
use of auditory cues and auditory information for exploratory data analysis BNG89] Gav89]
GS90] Jon89] MHK89] SBG90] Sor87]
A panel at CHI'85 moderated by Buxton BBF+85] dealt with the issues of auditory
cues and auditory representations of data that is di cult to represent and/or understand
visually. Of particular interest are the use of auditory stimuli for visually impaired users and
the asynchronous, background quality of audio cues. Future interfaces may allow the users
to act within a data space instead of looking at a data space, in which case recent advances
in 3-D virtual acoustic may come into play WWK91].
2.9 Search Algorithms
Point location is one of the fundamental problems of computational geometry EGS86]
Pre81] PT88], ST86] Ull92]. The problem is de ned as follows, given a planar graph with n
vertices and m edges, and a point p, identify the region which contains the point p. Treemaps
are of course a special case of planar graphs and point locations algorithms are particularly
relevant to tracking the location of the users current focal point (mouse tracking).
11](https://image.slidesharecdn.com/1993brianjohnsondissertation-1311918672257-phpapp02-110729005208-phpapp02/85/Treemaps-Visualizing-Hierarchical-and-Categorical-Data-31-320.jpg)
![Chapter 3
Treemap Origins
One of the more tantalizing promises of visual information systems is the ability
to spark understanding, insight, imagination, and creativity through the use of
graphic representations and arrangements. Especially in cases where the visual
arrangement shows relationships that we might not have thought of before, there
is the potential for evoking creative processes similar to those eeting moments
of instant understanding that `just come' to us. A major power of visual display
is its ability to cause us to say, `Now I see'.
If creative thinking is `seeing' things in a new or di erent light, for example, a
system that can help assemble these new or di erent `pictures,' or juxtaposings
of information, may indeed represent a dramatic change in the capabilities of
information systems.
In other words, original and creative thinking, in the sciences as well as the arts,
has stemmed from the individual ability to imagine things and relationships, or
to see something in the mind's eye. The very fact that we use a visual metaphor
to express this reveals the close connection this has to physically seeing things.
Obviously, we have no proof that a computerized system that creates pictures of
conceptual relationships would be able to help initiate creativity and insight, but
we do have the experience often enough of reaching a new conclusion because of
a singular visual impression."
Vei88]
The treemap visualization method maps hierarchically structured data to display spaces
of any dimension in a space- lling manner, allowing for e cient use of the display space if
desired. Interactive control allows users to specify the presentation of both structural and
content information.
This is in contrast to traditional static methods of displaying hierarchically structured
information, which are generally in exible, make poor use of display space, and hide content
from users. With the treemap method, sections of the hierarchy containing more important
information can be allocated more display space while portions of the hierarchy which are
less important to the speci c task at hand can be allocated less space Fur86] HH90].
12](https://image.slidesharecdn.com/1993brianjohnsondissertation-1311918672257-phpapp02-110729005208-phpapp02/85/Treemaps-Visualizing-Hierarchical-and-Categorical-Data-32-320.jpg)
![Treemaps are related to many other data graphic tools, including Venn diagrams, bar
charts, pie charts, and tree diagrams. Indeed the general treemap model is capable of
generating these existing presentations, as well as many more. In this chapter only the
original 2-D treemap will be discussed. Chapter 4 will discuss the treemap algorithms in a
more general N-Dimensional context.
3.1 Origin of the Treemap Concept
The original concept of partitioning a rectangular area to present hierarchical data is due to
Prof. Ben Shneiderman. Nassi and Shneiderman are the originators of Nassi-Shneiderman
Diagrams NS73], a clever tiling of rectangular display spaces showing the structure of ow
charts. Pondering the problem of our full hard disk drives Ben sketched out a plan on the
faculty lounge white board for partitioning a rectangular display in order to represent the
space usage of a hierarchical le system.
This was the origin of the treemap concept. From this seed treemaps have grown into
forest of visualization techniques whose origins can be found distributed throughout the
science and graphics literature.
The original 2-D algorithm Shn92] did not nest successive levels in the hierarchy. It was
sometimes di cult to parse out the structure of the hierarchy and there existed a many-
to-one mapping from data to display. Adding nesting o sets emphasized the structure of
the hierarchy and allowed a one-to-one mapping between data and display. This led to a
realization the treemaps were just" large weighted Venn diagrams. Collectively nesting
sibling nodes created treemaps which were just" nested collections of relative bar charts.
Time, experience, and persistence have shown that treemaps are not a single idea or
inspiration but rather the core of an entire family of hierarchical visualization techniques.
The con uence of graphic design sophistication and raw computing power have created an
atmosphere ripe for the advancement of powerful graphical displays and interface techniques.
This dissertation lls that void for hierarchical data.
3.2 Existing Techniques
It is useful to place treemaps in the context of other related tools. People typically deal
with large bodies of information by categorizing the bits and pieces of information and
constructing abstractions - hierarchies. A great deal of information is hierarchically organized
and dealt with on a daily basis by legions of computer users. Hierarchies are a standard way
of dealing with data complexity.
Traditional methods of dealing with hierarchies are ne for small hierarchies, small being
de ned as less than 100 items (nodes in the hierarchy). These traditional methods include
full text listings, outlines, Venn diagrams, bar charts, pie charts, and tree diagrams. It
is di cult for people to extract information from large hierarchical information structures
13](https://image.slidesharecdn.com/1993brianjohnsondissertation-1311918672257-phpapp02-110729005208-phpapp02/85/Treemaps-Visualizing-Hierarchical-and-Categorical-Data-33-320.jpg)
![Figure 3.1: Visual Properties of Presentations
using currently available methods as the navigation of the structure is a great burden and
content information is often hidden But90] VHW87] JS91] TJ92].
Treemaps alleviate the following limitations of traditional presentations of hierarchical
data:
Poor use of display space
Di cult navigation
Lack of a global perspective
Di culty in presenting content and structure information simultaneously
Treemaps provide an overall view of the entire hierarchy, making the navigation of large
hierarchies much easier. Displaying the entire information structure at once also allows
users to move to rapidly to any location in the data space. As Beard states in his paper on
navigating large two-dimensional spaces BI90],
If the two-dimensional information space ts completely onto a display screen,
there is no navigation problem ... Users are never lost because they can see the
complete information space."
Treemaps are capable of statically mapping entire hierarchical data spaces with thousands
of items onto 2-D display screens.
Existing hierarchical presentation techniques can be classi ed as ranging from primarily
text based to primarily graphically based. Some techniques are completely text based, some
text based with overlaid graphics, and some graphically based with overlaid text. Few
systems are exclusively graphic, with little or no text. Treemaps lie nearer the graphical end
of this range as a graphically based technique with overlaid text.
14](https://image.slidesharecdn.com/1993brianjohnsondissertation-1311918672257-phpapp02-110729005208-phpapp02/85/Treemaps-Visualizing-Hierarchical-and-Categorical-Data-34-320.jpg)

![of features...
Hod70]
The lack of adequate tools for browsing and visualizing (mapping) large le hierarchies
(thousands of les) originally motivated this research.
The following methods are widely available today:
Command Line Listing (e.g. UNIX ls, DOS dir)
Outlines (e.g. UNIX du, Macintosh Finder, Microsoft Windows)
Windowing (e.g. Macintosh Finder, Microsoft Windows)
Tree Drawings (e.g. OpenWindows File Manager)
XDU, an X-Windows implementation of the UNIX du command is the only approach
which provides a visual representation of the relative sizes of les and directories Dyk91].
Outlines, tree drawings, and XDU can all be generated by the treemap algorithm, they are
simply speci c instantiations of the general treemap algorithm.
Even moderately sized directory trees are di cult to visualize using standard operating
system interfaces. With command line interfaces such as UNIX ls or DOS dir, only the
immediate children of any directory are listed. An overall view of the directory tree must
be pieced together by traversing the various paths and listing the immediate children of the
currently active directory.
Desktop metaphors and their windowing strategies are another alternative. One of the
problems with windows is that they often obscure each other, and users may spend much of
their time may be spent arranging windows. Also, the tree structure is not apparent unless
windows have been carefully placed. Desktop icons generally show only the type of the le.
Much richer visual mappings are possible but are generally not available.
A small 26 node hierarchy labeled with the letters of the alphabet and random weights
(degrees of interest) will be used for illustrative purposes and hereafter referred to as the A-Z
hierarchy. This small hierarchy will appear in a number of gures in order to demonstrate
the wide variety of presentations that can be used depict even a simple hierarchical data set.
The A-Z depicted in Figures 3.5 through 3.9 contains 26 nodes, of these 6 are internal nodes
and 20 are les leaf nodes. This tree is structured so that among siblings nodes, leaf nodes
always precede internal nodes.
3.2.2 Listings and Outlines
The most textually oriented and least graphical presentation is the full text listing. In its
most basic form a full text listing need not have any visual organization other than a purely
linear string of characters. Figure 3.3 is an example of such listing.
Listings are capable of providing detailed content information, but are generally very poor
at presenting structural information. Listings can provide structural information, but require
16](https://image.slidesharecdn.com/1993brianjohnsondissertation-1311918672257-phpapp02-110729005208-phpapp02/85/Treemaps-Visualizing-Hierarchical-and-Categorical-Data-36-320.jpg)
![(A 100 (B 5) (C 10) (D 4) (E 6) (F 35 (H 1) (I 6) (J 18) (K 10 (L 2 ) (M 2) (N 2) (O 2) (P
2))) (G 40 (Q 8) (R 2) (S 30 (T 2) (U 4) (V 24 (W 3) (X 6) (Y 5) (Z 10)))))
Figure 3.3: A-Z Full Text Representation
users to parse path information to arrive at a mental model of the structure. Alternatively,
many operating systems allow users to list each internal node of the hierarchy separately
(UNIX ls, Dos dir), but this requires users to manually traverse the hierarchy to determine
its structure.
Structured text moves us up one level on this scale of visual organization. With structured
text the position of the text provides additional visual cues about the structure of the
hierarchy.
In Figure 3.4 we see an outline view similar to the presentations provided by PCShell
under DOS, the UNIX command du, the Macintosh Finder, or Microsoft Windows. This
presentation requires 26 lines a structure with 1000 nodes would require 1000 lines.
Outlines are an example of textual presentation moving towards a graphical presentation
via the structure and placement of the text. With nested outlines the position of text on
the line indicates the depth of the node in the hierarchy. This reduces visual clutter with no
loss of information.
Redundant graphical cues can be added to outlines with little additional visual clutter,
resulting in a rudimentary form of graphic tree diagrams. These outline methods explicitly
provide both structural and content information, but since the structure (indentation) can
only be viewed a few lines at a time (one display page), it is often inadequate CWMS93].
The number of display lines required to present a hierarchy with outline methods is
linearly proportional to the number of nodes in the hierarchy. These methods are often
inadequate for structures containing more than a few hundred nodes. A great deal of ef-
fort is required to achieve an mental model of the structure in large hierarchies using this
method. Interactive outlining techniques can dramatically extend the range of structured
text presentations.
3.2.3 Tree Diagrams
A richer degree of graphic organization brings us to the traditional tree diagram of Figure
3.5. This type of diagram is a hybrid of text and graphics, using text for content display and
graphics for the display of structure. Nodes are usually separated on a 2-D planar display
space and the structure of the hierarchy is often of primary interest.
Tree drawing algorithms have traditionally sought e cient and esthetically pleasing meth-
ods for the layout of node and link diagrams. These layouts are based on static presentations
and are common in texts dealing with graph theory and data structures. They are excellent
visualization tools for small trees BKW89] HH90] HH91] Knu73] RMC91].
However, these traditional node and link tree diagrams make poor use of the available
display space. In a typical tree drawing only 10-20% of the available pixels might be used to
17](https://image.slidesharecdn.com/1993brianjohnsondissertation-1311918672257-phpapp02-110729005208-phpapp02/85/Treemaps-Visualizing-Hierarchical-and-Categorical-Data-37-320.jpg)

![Figure 3.5: A-Z Tree Diagram
draw the diagram, the remaining pixels constitute the background. For small tree diagrams
this poor use of space is acceptable, and traditional layout methods produce excellent results.
But for large trees, traditional node and link diagrams can not be drawn adequately in a
limited display space. Attempts to provide zooming and panning are only partially successful
BI90] HH90].
Another problem with tree diagrams is the lack of content information typically each
node has only a simple text label. More comprehensive node labeling quickly overwhelms
the display space for trees with more than a few nodes.
The presentation of content information in current hierarchical presentation techniques
is usually text based. Although graphic presentations (such as tree diagrams) are capable
of making use of graphic representation techniques such as size, shape, and color. Unfor-
tunately, global views of large node and link tree diagrams require small nodes, so there is
often little space in which to provide graphic visual cues to node content.
Figure 3.5 represents a weighted hierarchy, the data attributes for each node include
a label and weight. Take a moment to locate the largest leaf node in Figure 3.5. Most
traditional diagrams do not adequately support global browsing. The correct answer is node
J with weight 18. Now page ahead to Figures 3.6 { 3.9 and ask yourself the same question.
It is easy to see that J is the largest leaf in these presentations.
19](https://image.slidesharecdn.com/1993brianjohnsondissertation-1311918672257-phpapp02-110729005208-phpapp02/85/Treemaps-Visualizing-Hierarchical-and-Categorical-Data-39-320.jpg)

![We have been moving towards more graphically oriented presentation techniques in the
text $ informal graphic presentation space of Figure 3.1. As the degree of textual parsing
required has dropped, so to has the textual clutter in the presentations. But although
the presentation of hierarchy has become cleaner and more immediately comprehensible in
many respects, improved visual organizations have thus far not greatly expanded our ability
to present greater quantities of information.
Both text labels and graphic layout have thus far constrained the size of hierarchies that
may be presented in a xed space. The full utilization of graphical display attributes and the
space- lling layouts of treemaps allow the presentation of much larger hierarchies. Treemaps
extend the trend of progressively less emphasis on text and more emphasis on graphical
presentation
3.3 Treemaps
...which is repeated according to a particular system, always bearing in mind
the principle that there may not be any 'empty spaces'..."
M.C. Escher, his life and complete graphic work, p.55
The original treemap is a method for presenting large hierarchical information spaces on
planar display areas of limited size JS91] Shn92]. 2-D treemaps are generated by recur-
sively slicing the display space into rectangular bounding boxes to convey global structure
(hierarchy) within each bounding box, individual node information is presented through
display attributes such as size and color. Treemaps combine features of multivariate coding
and display layout to present hierarchies in a richly visual environment which fosters relative
comparison of structures in the hierarchy.
Figure 3.7 is a treemap which illustrates a more e cient use of space and is an excellent
tool for the visualization of small hierarchies. But even the small degree of nesting present
in this technique can render it unsuitable for the presentation of large hierarchies.
Figure 3.9 eliminates the nesting o set used to separate objects at each level. The size
of each node in the treemap presentation of Figure 3.9 is strictly proportional to its weight.
This weight-proportionate distribution of display space is an important feature of treemaps.
3.4 Visualizing Hierarchy
In other words, every act of seeing is a visual judgment. Judgments are some-
times thought to be the monopoly of the intellect. But visual judgments are not
contributions of the intellect, added after seeing is done. They are immediate
and indispensable ingredients of the act of seeing itself...
There has been a tendency among scientists to describe the experience of vision
in analogy to the physical process. As far as seeing is concerned, the mind
was assumed to perform much like a photographic camera. But if, instead of
21](https://image.slidesharecdn.com/1993brianjohnsondissertation-1311918672257-phpapp02-110729005208-phpapp02/85/Treemaps-Visualizing-Hierarchical-and-Categorical-Data-41-320.jpg)


![assuming things, scientists observe the facts with an unpredjudiced mind, they
discover that vision is anything but a mechanical recording device. First of all,
vision is not mere passive reception. The world of images does not simply imprint
itself upon a faithfully sensitive organ. Rather, in looking at an object, we reach
out for it. With an invisible nger we move through the space around us, go
out to the distant places where things are found, touch them, catch them, scan
their surfaces, trace their borders, explore their texture. It is an eminently active
occupation."
Arn69]
Treemap visualizations make use of 100% of the available display space, mapping the
full hierarchy onto a rectangular display space in a space e cient manner. This e cient
use of space allows very large hierarchies to be displayed in their entirety and facilitates the
presentation of semantic information.
E ective visualizations of large data sets can help users gain insight into relevant features
of the data, construct accurate mental models of the information, and locate regions of
particular interest. Treemaps let users see the forest AND the trees by providing local detail
in the context of a global overview.
The main objectives of the treemap design are:
Comprehension: The presentation method and its interactive feedback must facili-
tate the rapid extraction of information with low perceptual and cognitive loads,
E cient Space Utilization: E cient use of space is essential for the presentation
of large information structures,
User Control: Interactive control over the presentation of information and real time
feedback are essential.
Displaying a large hierarchy while fully utilizing space and conveying structural infor-
mation in a visually appealing and low cognitive load manner is a di cult task, as these
are often opposing goals. An interactive approach to drawing hierarchies allows users to
determine how the hierarchy is displayed. This control is essential, as it allows users to set
display properties (presentation variations, colors, borders, etc.) maximizing the utility of
the drawing based on their particular task.
Treemaps provide a visually engaging environment in which to analyze and search data
spaces. Expanding the bandwidth of the human-computer interface by allowing users to
explore and manipulate large hierarchical and categorical data spaces.
Sections 3.4.1 and 3.4.2 discuss the visualization of hierarchy structure and node content,
respectively.
25](https://image.slidesharecdn.com/1993brianjohnsondissertation-1311918672257-phpapp02-110729005208-phpapp02/85/Treemaps-Visualizing-Hierarchical-and-Categorical-Data-45-320.jpg)
![3.4.1 Structural Information: Planar Partitionings of the Dis-
play Space
Tessellate to lay out, inlay, or pave in a mosaic pattern of small, square blocks { adj.
arranged in a mosaic pattern tessellated.
Gur86]
Hierarchical information structures contain two kinds of information: structural informa-
tion associated with the organization of the hierarchy, and content information associated
with each node. Interactive nesting o sets provide explicit control over the trade-o s involved
in emphasizing structure vs_ ontent.
c
Bounding Regions
The treemap approach to the visualization of hierarchical structures partitions the display
space into collections of rectangular bounding boxes of decreasing size based on the structure
of the hierarchy. Treemaps create a mosaic of the nodes in the hierarchy, tiling (tesselatting)
a planar surface. Treemaps are based on the property of containment, the bounding box
of every node in the hierarchy always contains its children and is contained by its parent.
Sibling nodes do not overlap.
Treemap displays look similar to the partition diagrams of quad-trees and k-D trees. The
key di erence is the direction of the transformation. Quad-trees create hierarchical struc-
tures to store 2-D images e ciently Ben75] Sam89] while 2-D treemaps present hierarchical
information structures e ciently on 2-D display surfaces.
Treemaps require that a weight be assigned to each node, this weight is used to determine
the size of a nodes bounding box. The weight may represent a single domain property (such
as disk usage or le age for a directory tree), or a combination of domain properties (subject
to Property 4 below). A nodes weight (bounding box) determines its display size and can
be thought of as a measure of importance or degree of interest Fur86]. Unweighted"
hierarchical presentations can be generated by assigning identical weights to all leaf nodes.
The following relationships between the structure of the hierarchy and the structure of
its treemap drawing always hold:
Properties
1. If Node1 is an ancestor of Node2, then the bounding box of Node1 completely encloses,
or is equal to, the bounding box of Node2.
2. The bounding boxes of two nodes intersect i one node is an ancestor of the other.
3. Nodes occupy a display area strictly proportional to their weight 1.
1Nested presentations borrow" space for o sets at the expense of strict proportionality. The space is
borrowed" from leaf nodes and used to display the parent node within which they are nested. Sibling
nodes are always proportional (local comparisons), but comparisons between nodes at di erent levels or with
di erent parents may not be strictly proportional
26](https://image.slidesharecdn.com/1993brianjohnsondissertation-1311918672257-phpapp02-110729005208-phpapp02/85/Treemaps-Visualizing-Hierarchical-and-Categorical-Data-46-320.jpg)
![4. The weight of a node is greater than or equal to the sum of the weights of its children.
Nesting
Structural information is implicitly presented via the partitioning of the space. Explicit
structural information can be provided via visually nested boxes, links between bounding
boxes, and other rendering techniques. The actual bounding boxes may not be rendered to
the display, depending on the parameters chosen by the user.
Nesting provides for the direct selection of all nodes, both internal and leaf. Although the
space required for nesting reduces the number of nodes which can be drawn in a given display
space, and hence reduces the size of the trees that can be adequately displayed compared to
non-nested drawings JS91] Tra89].
A non-nested display explicitly provides direct selection only for leaf nodes, but tracking
feedback can provide detailed location and content information as well as further selection
facilities. Non-nested presentations cannot unambiguously depict internal nodes in degen-
erate linear sub-paths, as the bounding boxes of the internal nodes in the sub-path will be
identical (see Section 4.10.4). Tasks dependent on long chains of single child nodes require
nesting presentations or special treatments.
3.4.2 Content Information: Mapping Content to the Display
Treemaps are a glyph based visualization technique. Mapping data attributes to the display
properties of the glyphs (individually rendered nodes in the hierarchy) allows for the shifting
of cognitive load to the perceptual system. Shifting search e orts to the perceptual system
capitalizes on a well developed human visual processing capabilities. Appropriate coding of
the domain attributes can greatly improve comprehension, providing rapid visual searching,
sorting, and comparison on a global scale.
Nodes may have a variety of types of associated content information, in which case
a rich set of mappings exists between content information (node attributes) and display
properties. The rendering of individual nodes within their bounding boxes determines the
content information statically presented in a treemap.
Since human perception imposes an upper bound on the complexity of graphic
representations, only a small number of relations can be shown." Kuh90]
The number and variety of domain properties that can be statically coded in any graphic
presentation is limited. People typically have di culty remembering more than a half-dozen
separate variables simultaneously, although the working set of variables can be changed at
will. Interactive control of the drawing is therefore critical because the mapping of content
information to the display will vary depending on the information the user requires. Dy-
namic feedback can provide detailed information about the content of items in the display,
showing attributes not visible in the presentation as well as con rming attributes coded in
the presentation.
27](https://image.slidesharecdn.com/1993brianjohnsondissertation-1311918672257-phpapp02-110729005208-phpapp02/85/Treemaps-Visualizing-Hierarchical-and-Categorical-Data-47-320.jpg)
![Once the bounding box of a node is set, a variety of display properties determine how
the node is rendered within this bounding box. Visual display properties such as color (hue,
saturation, brightness), texture, shape, border, blinking, etc. are of primary interest, but
users are not limited to purely visual (and perceptually parallel) properties DM90]. Auditory
properties are generally presented serially in a dynamic fashion, they are especially useful
as redundant feedback to reinforce visual cues BNG89] Gav89] GS90] Jon89] MHK89]
SBG90] Sor87].
Color is the most important of the visual display properties (after size, which is deter-
mined via partitioning), and it can be an important aid to fast and accurate decision making
Hoa90] Mac90] Ric91]. Visual properties may be statically presented in parallel.
Display Properties:
Size: Single most important visual attribute,
Color: Hue, Saturation, Value,
Other: Shape, Border, Texture, Pattern, Audio.
In a le hierarchy for example, les could have weights (display size) proportional to
their creation date, hue dependent on le type, color saturation dependent on their last
modi cation date, and pitch (tone heard while crossing border) based on size. Using this
scheme it is easy to locate old applications which have changed recently, and as the cursor
crosses into their bounding box a deep tone tells users that the le is large even before they
read the information displayed for le.
3.5 Tasks
Treemaps basically answer the question, How have resources been distributed?", or more
speci cally, How are the values of a given attribute distributed throughout the hierarchy?"
Fortunately this is often an interesting and important question to have answered!
From a data analytic perspective we are interested in what tasks or questions about hi-
erarchical data treemaps support. Treemaps allow users to easily locate the most interesting
nodes anywhere in a tree, in context, while making rapid visual judgments. This is exactly
the sort of questions users might have about les on a computer or items in a budget: where
are the interesting (large, old, percent change, etc.) nodes, how interesting are they, and
what portion of the whole do they consume.
Traditional displays show depth, but give little insight into totals or fractions.
The challenge now is to gure out what questions it treemaps] answers well and
what questions other techniques answer better. Then for any particular example
you can decide what tool best extracts the information that the data analysts
needs." Eic93]
28](https://image.slidesharecdn.com/1993brianjohnsondissertation-1311918672257-phpapp02-110729005208-phpapp02/85/Treemaps-Visualizing-Hierarchical-and-Categorical-Data-48-320.jpg)

![Table 3.1: Binary Tree Display Resolution
of interest) is user controlled, presumably the nodes with the greatest weights are of greatest
interest and the nodes with the smallest weights are of least interest.
3.6.3 Treemap Display Limitations
All static hierarchy presentations have limits as to the quantity of data they are capable of
presenting on a nite screen display. When these limits are reached, navigational techniques
such as scrolling or panning must be used, creating the potential for loss of context BI90].
Common character-based applications use a set number of lines to display the hierarchy.
Graphical tree diagrams have more leeway: depending upon the drawing algorithm and the
size of the display space, a hundred or so nodes can be adequately represented on screen
without the need for panning or zooming techniques.
More recent graphical diagrams such as cone trees RMC91] increase the display limit
through the use of a virtual third dimension at the expense of increased navigation (in this
case, rotation).
The number of nodes that can be displayed by a treemap can be an order of magnitude
greater than traditional graphical tree diagrams. This is the result of the tiled approach,
which packs the display space. Treemaps, though, have limits as well as with previous
presentation methods, zooming, panning, and animation can extend these limits.
Table 3.1 indicates display limits for binary trees with non-overlapping nodes using tree-
maps and node-link tree diagrams . The formulas for node and link tree diagrams assume no
horizontal separation space for nodes on the leaf level and also assume enough vertical space
to display all tree levels. The treemap gures assume that all leaf node weights are equal,
which will generate square bounding boxes for this example. The italicized entries in Table
3.1 are smaller than the practical minimum node size they are included for completeness.
Table 3.1 shows that treemaps (without o sets) are capable of statically displaying hier-
archies an order of magnitude larger than traditional node and link tree diagrams. It should
be noted that without o sets only the leaf nodes appear in the display. For example, Fig-
ure 3.9 illustrates the same tree as Figure 3.7 with o sets removed. The maximum size of
representable hierarchies decreases as o set size increases.
30](https://image.slidesharecdn.com/1993brianjohnsondissertation-1311918672257-phpapp02-110729005208-phpapp02/85/Treemaps-Visualizing-Hierarchical-and-Categorical-Data-50-320.jpg)
![these algorithms to existing techniques, and provides variations, extensions, and generaliza-
tions to the fundamental algorithms.
With combinations of partitioning dimensions, extrusions, o sets, weights, and rendering
geometries the generalized treemap algorithm can generate:
1. Outlines,
2. Node and Link Tree Diagrams,
3. Bar Charts,
4. Stacked Bar Charts (XDU Dyk91]),
5. Pie Charts,
6. Hierarchical Pie Charts,
7. Drum, Cone, and Cam Trees CZP93] RMC91],
8. Venn Diagrams,
9. Standard 2-D Treemaps, and
10. 2+D , 3-D, and N-Dimensional Treemaps.
These are only a few of the labeled points in the current design space of graphic hier-
archical presentations. Combinations of parameters and extensions to the general treemap
algorithm are capable of generating much more.
Algorithms are given to partition the display space and track pointer location. The
algorithms are computationally e cient partitioning the display space in single traversal of
the hierarchy (O(n)). Cursor tracking is proportional to the depth of the hierarchy (O(logn)).
Extensions to the basic algorithms deal with alternate partitionings, categorical data sets
(Chapter 6), nesting o sets and extrusions, zooming, dynamic data sets, animation, and
non-planar presentations.
4.1 Chapter Content
This chapter leads the reader through a series of re nements and extensions to the basic
treemap algorithms, weaving together the big picture of containment based hierarchical
visualization along the way. An overview of the chapter will help these pieces drop into
place.
The primary topics are partitioning the display space, cursor tracking, and graphic ren-
dering. These topics are interdependent, display space partitioning and graphic node render-
ing are often varied simultaneously to achieve speci c visualizations, cursor tracking always
follows.
The basic layout of the chapter is as follows:
34](https://image.slidesharecdn.com/1993brianjohnsondissertation-1311918672257-phpapp02-110729005208-phpapp02/85/Treemaps-Visualizing-Hierarchical-and-Categorical-Data-54-320.jpg)

![Figure 4.2: Cartesian Treemap, Initial Partitioning of the A-Z Hierarchy
This numeric weight is important and can be thought of as a degree of interest. This
concept of emphasizing degree of interest is similar to the sheye concept Fur86], though
there are multiple distributed points of interest in treemaps. The pie and bar charts of
Figures 4.1 and 4.2 are examples of how treemaps use the weights of a collection of items as
a distributed degree of interest in a graphical representation.
Along with the structure of the hierarchy, node weights will be used in the treemap
algorithms to partition the display space. In general the mapping of content information to
the display is independent of the basic structure of the diagram and will be covered separately
in Chapter 5.
4.3 Partitioning
Subdivision is of the greatest biological value because on it depends the capacity
to see objects. Goethe has observed the `Erscheinung und entzweien sind syn-
onym' more explicitly, 'What comes into appearance must segregate in order to
appear.'
In the visual arts subdivision is an essential means of composition. It takes place
at di erent levels, which in every work of art are organized in a hierarchy. A
primary segregation establishes the main features of the work. The larger parts
are again subdivided into smaller ones, and it is the task of the artist to adapt the
degree and kind of the segregation and connections to the meaning he is trying
to convey."
This principle asserts that the degree to which parts of the pattern resemble each
other in some perceptual quality will help determine the degree to which they
are seen as belonging together."
Arn69]
36](https://image.slidesharecdn.com/1993brianjohnsondissertation-1311918672257-phpapp02-110729005208-phpapp02/85/Treemaps-Visualizing-Hierarchical-and-Categorical-Data-56-320.jpg)

![Figure 4.3: Treemap of A-Z Hierarchy Leaf Nodes as a Relative Bar Chart
Figure 4.4: Treemap of A-Z Hierarchy as a Relative Bar Chart
of the tree to the node associated with a given point in the display can be found in time
proportional to the depth of the node.
We can expect this search to be of O(log n) on average assuming roughly balanced trees
of bounded degree. Even on a personal computer, as implemented in TreeVizTM on the
Apple Macintosh, the tracking algorithm is blindingly fast in comparison to human motor
movements for any hierarchy that can adequately be displayed.
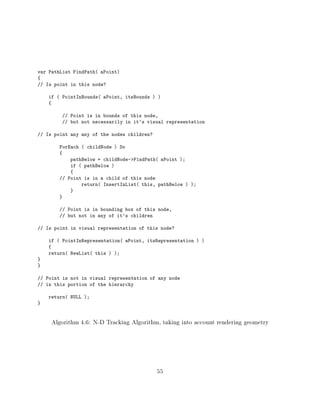
The N-D tracking algorithm (Algorithm 4.1) returns a path through the hierarchy from
the root to the node containing the given display point. It assumes the existence of a
generalized PointInBounds function which returns true if the given N-dimensional point is
inside the given N-dimensional bounding box.
The N-D tracking algorithm (Algorithm 4.1) is the heart of treemap cursor tracking.
Extensions must deal with tracking behaviors, whether or not certain classes of nodes are
visible, rendering of nodes within their bounding boxes, etc.
4.5 One Dimensional Partitioning
One dimensional partitioning is the simplest application of the treemap partitioning al-
gorithms. The display space (a line segment) is partitioned into successively smaller line
segments based on the structure of the hierarchy being represented. The 1-D partitioning
algorithm of (Algorithm 4.2) partitions the display space such that the line segment of every
node in the hierarchy overlaps the line segments of all of its children but none of it's siblings.
Algorithm 4.2 generates Figure 4.3, whose appearance is similar to a relative bar chart
(or Value Bar Chi92]) of the leaves of the A-Z hierarchy. From a conceptual point of view
38](https://image.slidesharecdn.com/1993brianjohnsondissertation-1311918672257-phpapp02-110729005208-phpapp02/85/Treemaps-Visualizing-Hierarchical-and-Categorical-Data-58-320.jpg)

![Main()
{
root->SetBounds( GetBounds( display) )
root->Partition()
}
Partition()
{
currentSide = itsBounds 1].start
cumulativeWeight = 0
ForEach ( childNode ) Do
{
childNode->SetBounds( itsBounds )
childNode->CalculateBounds( currentSide, cumulativeWeight )
childNode->Partition()
}
}
CalculateBounds( var currentSide, var cumulativeWeight )
{
itsBounds 1].start = currentSide
cumulativeWeight = cumulativeWeight + itsWeight
parentExtent = itsParent->GetEnd() - itsParent->GetStart()
itsBounds 1].end = itsParent->GetStart() +
parentExtent * cumulativeWeight /
itsParent->GetStart()
currentSide = itsDimension 1].end
}
Algorithm 4.2: 1-D Partitioning Algorithm
40](https://image.slidesharecdn.com/1993brianjohnsondissertation-1311918672257-phpapp02-110729005208-phpapp02/85/Treemaps-Visualizing-Hierarchical-and-Categorical-Data-60-320.jpg)
![the width of this treemap has been partitioned in 1-D and extruded into the 2nd dimension
(height). Without nesting o sets or translucent leaf nodes the internal nodes in the hierarchy
are hidden by the leaf nodes in a treemap of any dimension.
The TreeVizTM application which generated Figures 4.3 { 4.5, while only partitioning the
horizontal dimension, actually generates 2-D bounding boxes for every node in the hierarchy.
The partitioning has been extruded into a second dimension, which accounts for the nesting
o sets in the vertical dimension ( see Section 4.13.4). For this example we can view extrusion
into a second dimension as simply decreasing the height of a nodes line segment based on
the depth of the node in the hierarchy.
Algorithm 4.2 presents only the heart of the treemap concept, the soul consists of the
endless variety of extensions which generate modi ed graphical representations such as the
nested bounding boxes of Figure 4.4 with the superimposed traditional tree diagram.
4.5.1 Top-Down
The top-down treemap is an instantiation of this general 1-D partitioning algorithm with
the 1-D elements extruded into 2-D areas. Development of the 1-D top-down algorithm was
motivated by the desire to preserve the structure (and user familiarity) of traditional tree
diagrams.
Figure 4.4 illustrates a traditional tree structure overlaid on its top-down representation.
O sets are used to emphasize the hierarchy structure. The area in each bounding box
is determined by the weight attribute. For example, if the hierarchy in Figure 4.4 was an
organization chart with size representing salary, large boxes (leaves) would indicate employees
who are well paid.
This approach to tiling planar areas limits recursive division to one dimension, and ac-
ceptable results are produced only for hierarchies of limited size. Hierarchies larger than 100
nodes overwhelm the top-down algorithm on typical displays. For example, the hierarchy
used in the treemap experiment by Turo contained 120 nodes in two-levels TJ92]. This hier-
archy could not be displayed using the general top-down algorithm due to limited horizontal
resolution a modi ed top-down approach solved this by partitioning the vertical axis at the
nal level. This modi ed algorithm works well for hierarchies that are of a uniform, xed
depth.
The main bene t of the 1-D partitionings is their ability to conform to traditional tree
diagram conventions. With small hierarchies, traditional tree diagrams may be used in
conjunction with top-down treemaps as in Figure 4.4, which fosters comparative analysis
while preserving traditional diagrammatic notation.
4.6 Two Dimensional Partitioning
The great disadvantage of the proportional bar method is the very limited range
of values it can accommodate. To cope with even a moderately large range some
of the bars would have to be so long that they would occupy a disproportionate
41](https://image.slidesharecdn.com/1993brianjohnsondissertation-1311918672257-phpapp02-110729005208-phpapp02/85/Treemaps-Visualizing-Hierarchical-and-Categorical-Data-61-320.jpg)
![amount of space ... The use of two-dimensional symbol s] allows a vastly increased
range of values to be accommodated ... The major disadvantage of proportional
symbols is the di culty of estimating their value visually...."
Hod70]
Planar treemaps partitioned in two dimensions are the most useful case of the general
treemap concept. 2-D planar treemaps are a perfect t for the 2-D windows on today's
computing platforms. 1-D linear treemaps do not e ciently use the area of a 2-D display
and higher dimension partitionings have other problems (see Section 4.7).
The 2-D algorithm partitions the planar display area along both its dimensions JS91].
Figure 3.8 displays the same hierarchy as in Figure 4.4, only drawn using the 2-D slice-and-
dice algorithm.
The 2-D treemap partitioning algorithm applies the 1-D partitioning algorithm on alter-
nating dimensions at each level, producing a diagram similar to a collection of nested bar
charts or, if nodes are nested individually, a Venn diagram (see Chapter 3).
This slice-and-dice treemap is very useful for presenting large hierarchies. Hierarchies
with more than 1000 nodes can be drawn on a 640x480 pixel display using 2-D slice-and-dice
partitioning (Figure 3.2).
4.7 N Dimensional Partitioning
If an exceptionally wide range of data has to be dealt with it may be necessary
to introduce a third dimension and to use proportional spheres or cubes. In this
case, the volumes of the symbols are proportional to the values they represent.
... The use of volumetric symbols has a severe drawback in the extreme di culty
of obtaining any kind of visual impression of comparative values."
Hod70]
The basic algorithms provide all of the exibility needed to construct treemaps (and track
a moving point) in a generalized N-Dimensional space. Algorithm 4.1 allows for the tracking
of a moving point in a collection of nested hypercubes in spaces of arbitrary dimension.
Algorithm 4.3 provides for the construction of treemaps (a nested collection of hyperboxes)
in any dimension simply by changing the value of the variable maxDimension to the desired
dimensionality.
Treemaps partitioned on more than 2 dimensions do not allow users to step out of the
dimensionality of the treemap and look down" on the graphic representation from a separate
dimension.
Since we live in a 3-D world our point of view is necessarily within" the partitioning
space of higher dimension treemaps (3 or more partitioning dimensions). Higher dimension
treemaps require transparent or translucent nodes in order to make internal partitions visible
from external points of view. Point of view can be interactively controlled and users can
42](https://image.slidesharecdn.com/1993brianjohnsondissertation-1311918672257-phpapp02-110729005208-phpapp02/85/Treemaps-Visualizing-Hierarchical-and-Categorical-Data-62-320.jpg)
![Main()
{
root->SetBounds( GetBounds( display) )
root->Partition( 0 )
}
Partition( partitionDimension )
{
currentSide = itsBounds partitionDimension].start
cumulativeWeight = 0
ForEach ( childNode ) Do
{
childNode->SetBounds( itsBounds )
childNode->CalculateBounds( partitionDimension, currentSide,
cumulativeWeight )
childNode->Partition( (partitionDimension + 1) mod maxDimension)
}
}
CalculateBounds( partitionDimension, var currentSide, var cumulativeWeight )
{
pStart = itsParent->GetStart( partitionDimension )
pEnd = itsParent->GetEnd( partitionDimension )
itsBounds partitionDimension].start = currentSide
cumulativeWeight = cumulativeWeight + itsWeight
parentExtent = pEnd - pStart
itsBounds partitionDimension].end = pStart +
parentExtent * cumulativeWeight /
pStart
currentSide = itsBounds partitionDimension].end
}
Algorithm 4.3: 2-D Partitioning Algorithm
43](https://image.slidesharecdn.com/1993brianjohnsondissertation-1311918672257-phpapp02-110729005208-phpapp02/85/Treemaps-Visualizing-Hierarchical-and-Categorical-Data-63-320.jpg)
![y" through 3-D partitionings but global perspectives require external views of the entire
hierarchy.
Looking at a 3-D cubic treemap from a 3-D perspective is similar to looking at a 2-
D maze of hedges from the 2-D perspective of a walking visitor. An excellent treatment of
dimensionality and point of view is provided by Edwin Abbot in Flatland , his classic account
of geometric gures living in 2-D planar world Abb52].
2+D extruded" planar treemaps show promise as they also allow the user to look into
the partitioned 2-D planar display from a somewhat separate third dimension (covered in
Section 4.13.5).
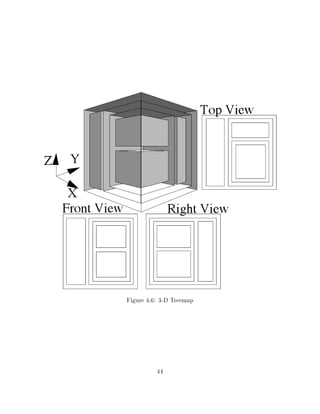
Figure 4.6 is an example of a treemap partitioned in 3 dimension with a small o set { a
true 3-D treemap. Note that the two boxes stacked in the Z dimension at the right, front edge
of the cube can not be detected in the top view projection. Nevertheless such constructs are
quite interesting and perhaps as experience with 3-D interfaces grows they may become more
attractive. Virtual reality interfaces to partitioned 3-D hierarchical visualizations similar to
treemaps are currently being implemented and evaluated RG93].
Although we primarily discuss treemaps partitioned on fewer than 3 dimensions in this
dissertation, it should be noted that in general the ideas are applicable to treemaps of
arbitrary dimensionality.
4.8 Treemap Dimensionality
It is useful to make a distinction between the cardinality of the display space and the cardi-
nality of partitioning space. Often the cardinality of these two spaces will be di erent, i.e.
partition < display (it is always the case that
partitioning display).
When fewer dimensions are used for partitioning than are available in the display space,
it is possible to extrude/extend the partitioned space into the remaining dimensions. Thus a
1-D linear partitioning can be extruded into 2-D nested bar chart, a 2-D planar partitioning
can be extruded into a 3-D city-scape", and a 1-D angular (polar coordinate) partitioning
can be extended into 2-D pie chart or a 3-D Drum Tree CZP93].
Diagrams generated via extensions to the basic algorithms can be classi ed based on
coordinate system (e.g. cartesian or polar), dimensionality of the partitioning space, and
dimensionality of the display space.
4.9 Parallel Algorithms
The treemap partitioning algorithms are ideally suited to parallelization in both compu-
tation and display. The bounding box of any node in the hierarchy can be thought of as
the root of a new sub-hierarchy. Hence partitioning computations and graphic display of the
sub-hierarchy are independent of other portions of the hierarchy. In fact the graphic par-
titionings of the treemap display itself provides a graphic presentation of how computation
can be partitioned and encapsulated.
45](https://image.slidesharecdn.com/1993brianjohnsondissertation-1311918672257-phpapp02-110729005208-phpapp02/85/Treemaps-Visualizing-Hierarchical-and-Categorical-Data-65-320.jpg)
![Partition( partitionDimension )
{
currentSide = itsBounds partitionDimension].start
cumulativeWeight = 0
ForEach ( childNode ) Do
{
childNode->SetBounds( itsBounds )
childNode->CalculateBounds( partitionDimension, currentSide,
cumulativeWeight )
}
ParallelForEach ( childNode ) Do
{
childNode->Partition( (partitionDimension + 1) mod maxDimension)
}
}
Algorithm 4.4: N-D Parallel Partitioning Algorithm
Parallel computations may be forked o for each node of the hierarchy in a top-down
traversal. Algorithm 4.4 shows the minor modi cations necessary to provide for this massive
parallelization. Visualizations in which each node in the hierarchy is assigned to a node a
parallel processing architecture could provide a model for real-time visualization. In addition
to parallel computation, such a model would also need to provide e cient access to the
display device.
4.10 O sets
Nesting bounding regions within one another emphasizes the structure of the hierarchy. The
magnitude of the o sets is directly proportional to the display area allocated to the internal
nodes of the hierarchy and inversely proportional to the display area allocated to leaf nodes.
Nesting o sets must be calculated by the treemap algorithm at partition time. Nodes
can be rendered graphically in many ways but must remain within their bounding regions
(see Figure 4.17 for an example of failed containment). For this reason adding o sets at
rendering time is only an alternative for leaf nodes in the hierarchy, the nested bounding
regions of internal nodes are required for the partitioning of their children.
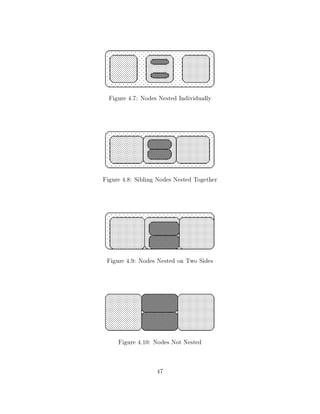
4.10.1 Individual O sets
The simplest nesting algorithm o sets all sides of a nodes bounding region as illustrated in
Figures 4.7 and 4.11. In 1-D this sets in both sides, in 2-D all four sides, and in N-D all 2N
sides. Extrusions into non-partitioning dimensions can also be o set as in Figure 4.4, whose
1-D partitioning has been extruded into 2-D. Nesting every node individually produces 2-D
squared-o Venn diagrams (Figure 3.7).
46](https://image.slidesharecdn.com/1993brianjohnsondissertation-1311918672257-phpapp02-110729005208-phpapp02/85/Treemaps-Visualizing-Hierarchical-and-Categorical-Data-66-320.jpg)


![Partition( partitionDimension )
{
ApplyOffset( itsBounds )
currentSide = itsBounds partitionDimension].start
cumulativeWeight = 0
ForEach ( childNode ) Do
{
childNode->SetBounds( itsBounds )
childNode->CalculateBounds( partitionDimension, currentSide,
cumulativeWeight )
childNode->Partition( (partitionDimension + 1) mod maxDimension)
}
RetractOffset( itsBounds )
}
ApplyOffset( var nodeBounds )
{
Apply offsets to desired sides
}
RetractOffset( var nodeBounds )
{
if ( Nesting Children as Collective Blocks )
Retract previously appled offsets
}
Algorithm 4.5: Nesting Algorithm
51](https://image.slidesharecdn.com/1993brianjohnsondissertation-1311918672257-phpapp02-110729005208-phpapp02/85/Treemaps-Visualizing-Hierarchical-and-Categorical-Data-71-320.jpg)


![(background) between nodes. This would also be the case in a traditionally rendered node
and link tree diagram.
4.12 Building on a Treemap Foundation
The treemap method of hierarchical visualization, at its core, is based on the property of
containment. This is a fundamental idea which powerfully encapsulates many of our reasons
for constructing information hierarchies. The following portions of this chapter show how a
variety of traditional diagrams and their novel but systematic extensions can be created via
simple treemap transformations.
Simple treemap transformations can be used to generate bar charts (and XDU), out-
lines, traditional 2-D node and link diagrams, and Manhattanesque city-scapes. By simply
changing to polar coordinates and partitioning along an angular dimension, treemap trans-
formations yield pie charts and 3-D angular node and link diagrams (e.g. Cone, Cam, and
Drum Trees RMC91] CZP93]). In addition to generating the standard traditional hierar-
chical diagrams, treemaps provide a means to extend non-hierarchical techniques such as bar
and pie charts into the domain of hierarchical presentation.
The goal here is not only to demonstrate that the treemap approach can generate ex-
isting diagrams, but to show the power and ease with which alternative presentations can
be generated once this technique has been adopted. Treemaps are based on containment,
relative partitioning, and mapping data attributes to display attributes (Chapter 5). These
are simple, fundamental ideas, but they are the building blocks with which an entire world
of unique and exciting visualizations can be built.
4.13 Cartesian Coordinate Extensions
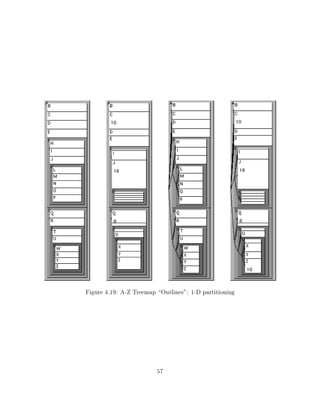
4.13.1 Outlines
Outlines are simple 1-D treemaps partitioned on the vertical dimension, with uniform weights
and o sets applied to the top and left sides of every internal node. The treemaps of Figure
4.19 show:
1. An outline,
2. A weighted outline,
3. An outline with an overlaid node and link tree diagram, and
4. A weighted outline with an overlaid node and link tree diagram.
56](https://image.slidesharecdn.com/1993brianjohnsondissertation-1311918672257-phpapp02-110729005208-phpapp02/85/Treemaps-Visualizing-Hierarchical-and-Categorical-Data-76-320.jpg)
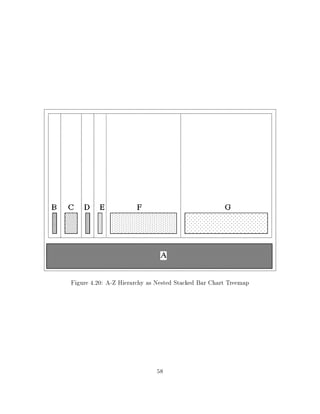


![Figure 4.23: Treemap of A-Z Hierarchy as Node-Link Tree Diagram
4.13.2 Stacked Bar Charts
Stacked bar charts are simple 1-D treemaps partitioned on either the horizontal of vertical
dimension, non-uniform weights produce relative stacked bar charts.
The treemap algorithms can be used to generate a variety of extensions to traditional
bar charts. These range from relative bar charts which do not show the hierarchy, such as
Figures 4.2 and 4.3, to those which do show the hierarchical organization such as Figures
4.4, 4.5, 4.21, and 4.22. These are all 1-D partitionings of the horizontal dimension, which
have been extruded into the vertical dimension. Note that only the extent (width or height -
not area) of the data glyphs in the partitioned dimension is proportional to the node weight.
Figures 4.4 and 4.5 are a hybrid treemaps, similar to both relative bar charts as well as
node and link diagrams. For these 1-D treemap presentations a node-link diagram has been
overlaid on a relative bar chart, technically speaking the nodes have been inset on all four
sides and links have been drawn between the bounding regions of parent nodes and their
children.
The stacked relative bar chart" treemaps of Figures 4.21, 4.22, 4.4 are presentations
similar to those of the UNIX X Window tool XDU. XDU displays the output of the UNIX
du command as a series of relative bar charts in graphics window Dyk91]. Using the 1-D
partitioning algorithm, the hierarchy is partitioned along the horizontal dimension and nodes
are extruded into the second (vertical) dimension and rendered as xed height rectangles
sitting at the bottom of their bounding regions. Here again, it is essential that the tracking
algorithm track only the rendered rectangles and not the nodes bounding regions for these
stacked bar chart" treemaps.
4.13.3 2-D Node and Link Diagrams
Node and link diagrams are simple 1-D treemaps partitioned on either the horizontal of
vertical dimension, extruded into a 2nd dimension, with links drawn between parent nodes
and their children.
By simply choosing an edge of the bounding hyperbox to call the origin, a traditional
node an link tree diagram can be drawn within the bounding boxes of a 1-D nested treemap
extruded into 2-D (see Section 4.5.1). The diagram is partitioned on either the horizontal or
vertical axis and either the top or left hand side (respectively) is extruded into the second
61](https://image.slidesharecdn.com/1993brianjohnsondissertation-1311918672257-phpapp02-110729005208-phpapp02/85/Treemaps-Visualizing-Hierarchical-and-Categorical-Data-81-320.jpg)


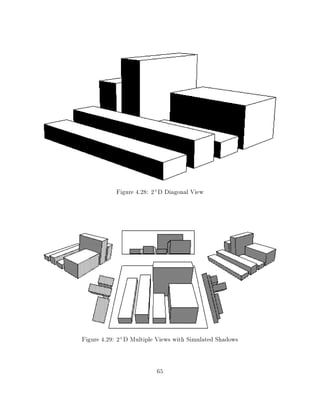

![Figure 4.31: Cartesian Coordinate Bar Chart Top View
Figure 4.32: Cartesian)Polar Coordinate Bar/Pie Chart Top View
variable (typically node weight), and glyph height, location of the apex, apex skew, and the
four sides (colors and textures) can code additional properties (similar to datajacks Cox90]).
Figure 4.30 illustrates such a 2+D treemap. True 3-D treemaps are volumes partitioned on
all 3 dimensions (see Section 4.7 and Figure 4.6).
4.14 Polar Coordinates
Although discussions thus far have dealt with cartesian coordinates, the N-D partitioning
and tracking algorithms discussed in Section 4.7 are applicable to any coordinate system
(cartesian, cylindrical, spherical, ...).
For example, in the transformation from 2-D cartesian to 2-D polar coordinates, the axes
(x1, x2) simply refer to angle and radius instead of width and height. Informally, all the
images presented thus far can be converted into polar coordinates by simply squeezing one
edge in to a point, and swinging the adjacent edges out, up, and around until they meet
while letting the remaining edge stretch (see Figures 4.31, 4.32, and 4.33).
4.14.1 Hierarchical Pie Charts
67](https://image.slidesharecdn.com/1993brianjohnsondissertation-1311918672257-phpapp02-110729005208-phpapp02/85/Treemaps-Visualizing-Hierarchical-and-Categorical-Data-87-320.jpg)
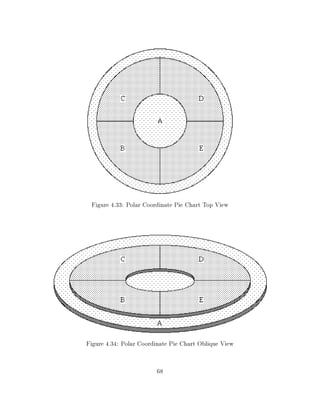
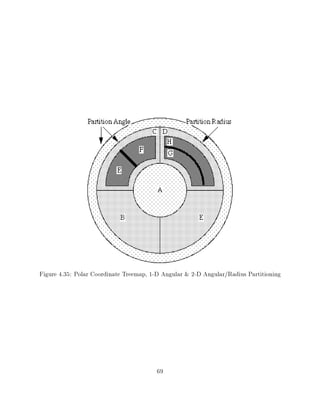
![Treemap based polar coordinate visualization enable the construction of pie chart" treemaps
which show the relative distribution of resources (as with traditional pie charts) as well as
the structure of the hierarchy. The relative weights of the nodes are represented by the
angle subtended by the node, and the extrusion (and nesting) in the 2nd radial dimension
reinforce the structural layout of the hierarchy. Polar treemaps are exactly analogous to
cartesian coordinate treemaps and discussions of nesting, etc., will not be repeated.
4.14.2 Rendering Hierarchical Pie Charts
Rendering variations can greatly increase (or decrease) the legibility of any treemap pre-
sentation. Figures 4.36 - 4.39 show a series of rendering variations - progressing from the
equivalent of stacked pie charts to the hollowed out (and arguably most legible) polar treemap
of Figure 4.39.
Rich Potter created the rst pierarchy," similar to Figure 4.36, by nesting pie charts
generated in a spreadsheet program. Rich's fondness for his pierarchy" creation, and the
interesting cone, cam, and drum tree work at Xerox PARC RMC91] and the Univ. of Toronto
CZP93] led to the extension of this treemap work into polar coordinates, motivating the
grand" uni ed theory of containment based hierarchical visualization (treemaps) presented
in this chapter.
4.14.3 Polar Node and Link Diagrams
The node and link diagrams in cartesian and polar coordinates (Figures 4.40 and 4.41)
can be generated by applying 1-D partitioning algorithm in either the horizontal or angular
dimensions, respectively. Figure 4.42 represents a slight polar coordinate system variation to
the 1-D partitioning algorithm which simply resets the angular partitioning on each recursive
call. These 1-D partitionings have all been extruded into a second dimension.
4.14.4 3-D Polar Node and Link Diagrams
Cone (Figure 4.44), Cam (Figure 4.45 RMC91]), and Drum (Figure 4.43 CZP93]) trees
can be generated by simply extruding these 2-D polar node and link diagrams into a third
dimension. Figure 4.46 is an example of how the bounding region might be calculated and
rendered in 3-D polar coordinates.
4.15 Conclusion
Containment based treemap algorithms are powerful enough to generate most existing hi-
erarchical representations as well as a great many new representations. In addition the
algorithms have been designed for interactive control and are exible enough to allow inter-
active manipulation.
70](https://image.slidesharecdn.com/1993brianjohnsondissertation-1311918672257-phpapp02-110729005208-phpapp02/85/Treemaps-Visualizing-Hierarchical-and-Categorical-Data-90-320.jpg)

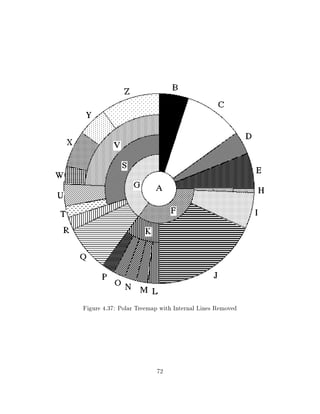


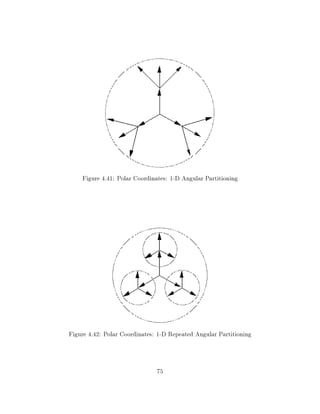
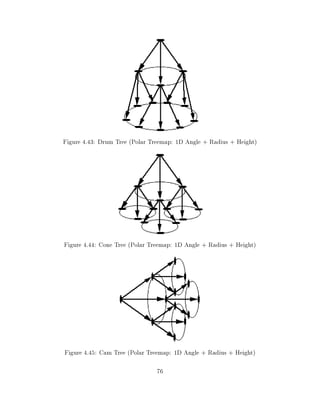
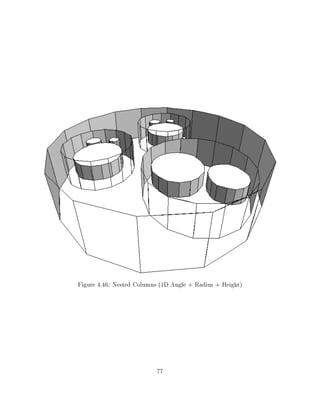

![Chapter 5
Interface Design
It is often said, for example, that creativity stems from the ability to formulate
mentally new and di erent associations, often in a nonlogical and even subcon-
scious process. If information systems can not only present stored information
visually but also dynamically rearrange and reassociate items in a visual way, we
might `see' things we might not have otherwise seen...
Information maps, for example, should provide several arrangements of the same
information, as the power of the computer has released stored information from
the restrictions of physical proximity. They also must provide a complete overview,
or world map, of all the information that is available through the system, which
can be enormous, as well as the detail necessary to navigate to a chosen spot.
It is quite likely that information maps will have some hierarchical properties or
relative detail, as we are used to using maps that have varying levels of resolu-
tion."
Vei88]
Static treemap presentations of hierarchy subsume many current hierarchical presentation
techniques (and their algorithms) and are capable of generating a great variety of new and
interesting presentations. But the real power of treemap based visualizations, from a users
point of view, is the ability to interactively mold and shape presentations based on changing
requirements. The principles discussed in this chapter are applicable to many information
visualization situations.
This chapter presents some of the issues and requirements of a glyph based visualization
interfaces, and treemaps in particular. The appropriateness of some of the most fundamental
properties of the treemap interface developed here are evaluated in the studies discussed in
Chapters 7 & 8.
The major topics covered are:
Mapping data attributes to the display,
Interface operations and feedback,
79](https://image.slidesharecdn.com/1993brianjohnsondissertation-1311918672257-phpapp02-110729005208-phpapp02/85/Treemaps-Visualizing-Hierarchical-and-Categorical-Data-99-320.jpg)
![Figure 5.1: TreeVizTM Menus
Dynamic manipulations of the data, and the
Design of the TreeVizTM application.
5.1 Data Glyphs
Finally, there was a wholesome lesson in the discovery that vision is not a me-
chanical recording of elements but the grasping of signi cant structural patterns
... In other words, here was scienti c support for the growing conviction that
images of reality could be valid even though far removed from `realistic' sem-
blance."
Arn69]
Data glyphs provide an elegant and powerful basis for graphic data visualizations Cox90].
Data glyphs are especially useful when creating visualizations of abstract data spaces which
have no physically based analog. Although even physically based direct visualizations, such
as atmospheric pressures in jet engine exhaust can be modeled as glyph based visualizations,
where the layout of the glyphs (individual pixels in the display) correspond to physical sensor
locations and a single variable (pressure) is mapped to a single display property (color).
80](https://image.slidesharecdn.com/1993brianjohnsondissertation-1311918672257-phpapp02-110729005208-phpapp02/85/Treemaps-Visualizing-Hierarchical-and-Categorical-Data-100-320.jpg)

![The location the pyramid apex in the glyphs of Figure 4.30 can be used as an example of
locating features of the data glyph based on data attributes. For example, glyphs in a stock
portfolio visualization with higher rates of return might lean (location of apex) progressively
to the right while those with low rates of return might lean progressively farther to the left.
Nodes with average rates of return might stand straight up. Even physically remote regions
can be grouped together if they share common features (color, geometry, ...).
Color
Color is a complex aspect of human perception but it can be a very e ective if the palette
is well chosen. Quanti able attributes (placed on a numeric scale) work well with di erent
luminosity levels of the same hue (maintaining constant saturation). If a non-quanti able
attribute is to be displayed, the approach of assigning distinct hues to each attribute is
e ective. TreeVizTM utilizes evenly separated hues while maintaining constant saturation
and luminosity to depict di erent le types.
User control over the color is of primary concern as color preference varies by task and
individual. Aesthetically pleasing color schemes can be preselected and accompanied by a
color key or chart for user reference Cox90]. One area of color control addresses the problem
of color de ciencies and monochrome monitors: providing a transformation to gray scales or
patterns alleviates the problem. Gray scale diagrams Fee91] show that even when distinct
hues are eliminated, information can be conveyed via gray scale.
Text
Text labels can be used to further orient the user if space is available. Small nodes may not
have space to include textual strings however, nodes that can provide textual signposts are
useful landmarks in a sea of boxes. TreeVizTM gives an indication of how text labels may
be utilized in a treemap application. In Figures 5.4 and 5.5 nodes in the diagram have text
labels (name and weight) in the upper left corner.
Shape
Shape is one of the essential characteristics of objects grasped by the eyes. It
refers to the spatial aspects of things, excepting location and orientation."
Arn69]
Glyph shapes are constrained by the partitioning algorithm bounding regions and the
size of the data set. Rectilinear glyph shapes are generally preferred for large data sets
partitioned into rectilinear bounding regions. Rectangles pack well and extremely compact
representations can be achieved.
Within these constraints a variety of variations are possible, for example, node-link dia-
grams can be thought of as treemaps in which internal nodes glyphs are simply lines. Glyphs
may also be rendered as pyramids, ovals, or a variety of other shapes.
83](https://image.slidesharecdn.com/1993brianjohnsondissertation-1311918672257-phpapp02-110729005208-phpapp02/85/Treemaps-Visualizing-Hierarchical-and-Categorical-Data-103-320.jpg)
![Texture
Mapping texture (bumps, waves) to individual glyphs is generally not useful for small glyphs,
which is generally the case for large data sets. The arrangement of the glyphs themselves
can create texture on a global scale SBG90].
Sound
Hearing is an inherently linear process. The visual display properties that have been dis-
cussed rely on the inherent parallel aspects of the human visual processing system.
Sound is well-suited to the linear process of tracking the users focal point (cursor). Data
attributes can be coded by audio cues when a data glyph is rst selected, while the glyph
remains selected, and when the glyph is deselected.
Audio cues are particularly well suited to redundant codings of data attributes. While
only a few shades of any color can be distinguished accurately, 50-60 di erent tones can be
distinguished. Sound can be very rich (tone, pitch, attack, decay, timbre, ...) and users can
make quite ne distinctions between audio cues generated (tracked) in sequence.
TreeVizTM allows users to (see Sound&Light" menu in Figure 5.1) use sound to redun-
dantly code color properties. Simple use of 30 tones (notes) above and below middle C allow
users to make quite ne distinctions in attributes such as le modi cation times that can
not be distinguished via color properties alone.
Other Properties
The variety of visual properties available is dependent on the types of glyphs being generated.
Glyphs can be skewed, lean, rotate, curve, etc... Figure 4.30 is one such example, in which
the individual glyphs are wave shaped pyramids in which the area of the base, height, apex
location, apex curvature, apex directionality, and properties of each side (color, texture) can
be used to code data attributes.
5.1.2 Variable Transformations
It may often be the case that original expressions of variables in the data domain are not well
suited to the visualization domain. In such cases the variables can be recoded or transformed
as they are mapped to the visualization domain.
Function based attribute mapping allows the values in the data domain to be modi ed as
they are passed through to the display domain. Inversion is an example of one of the simplest
functions, which allows users to simply ip the domain attribute emphasis: instead of sales
people with the largest pro ts one might be interested in sales people with the smallest
pro ts.
Logarithmic or power functions, analogous to log-scales in plots, have proven useful for
enhancing weighted degrees of interest in data sets and alleviating large discrepancies in wide
ranging data sets. Mathematically complex concepts such as mapping attributes through
84](https://image.slidesharecdn.com/1993brianjohnsondissertation-1311918672257-phpapp02-110729005208-phpapp02/85/Treemaps-Visualizing-Hierarchical-and-Categorical-Data-104-320.jpg)
![non-linear transformations in order to emphasize features of the data set can be treated
super cially (by providing an degree of interest slider for example) but knowledgeable users
deserve, and will demand, a more thorough treatment Tur93].
5.1.3 Aspect Ratio
Treemaps use a single numeric weight to determine the enclosed display region of a node
in the hierarchy. Perceptual di culties arise when comparisons are made between nodes
of di ering extents (e.g. height and width), as users cannot accurately gauge ne area
di erences between regions di ering in more than one dimension. The uniformly weighted
treemap of Figure 5.5 illustrates this problem { all of the leaf nodes have the same weight
(area), but their heights and widths di er.
When representing node weights (a single dimension) in display spaces of 2, 3, or higher
dimensions there is an explicit perceptual tradeo between accuracy (aspect ratio variations)
and the range of magnitude covered.
2-D representations are poor for comparing linear values that are similar, but they can
show greater ranges, a bene t in the case of le sizes which can range over six orders of
magnitude. Users may use display area to rapidly locate nodes of interest, which can then
be compared in detail via mouse tracking and dialog boxes.
5.1.4 O sets
Nesting o sets provide an explicit trade-o between seeing the forest (structure) and the
trees (individual glyphs).
Treemaps convey structure via containment (nesting and grouping) in the same fashion as
Venn diagrams JS91] Tra89]. Nesting o sets give users control over the allocation of display
space between internal and leaf nodes. Larger o sets put greater emphasis on internal nodes
and hence the structure of the hierarchy smaller o sets emphasize leaf nodes. Without
o sets only leaf nodes are directly visible the internal structure of the hierarchy must be
inferred from text labels and the grouping of leaf nodes.
Users viewing new hierarchies often need o sets in order to become familiar with the
global structure of the hierarchy. This allows for a broad overview of the structure of the
hierarchy while still allowing the most interesting leaves to show through.
After a short period of use users generally prefer smaller o sets (0, 2, or 4 pixels), as
noted in the two experiments and by users of TreeVizTM . Small o sets provide a degree of
global context while still maximizing the display space available for the display of leaf nodes.
Hierarchies are often used as grouping tools. Since treemaps always group sibling nodes
together it is not uncommon for users to eliminate nesting o sets entirely when they are
interested in content based questions, such as the properties of les in a le hierarchy.
85](https://image.slidesharecdn.com/1993brianjohnsondissertation-1311918672257-phpapp02-110729005208-phpapp02/85/Treemaps-Visualizing-Hierarchical-and-Categorical-Data-105-320.jpg)
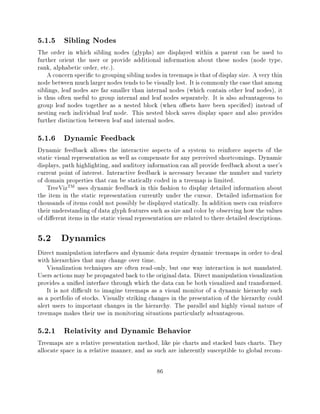
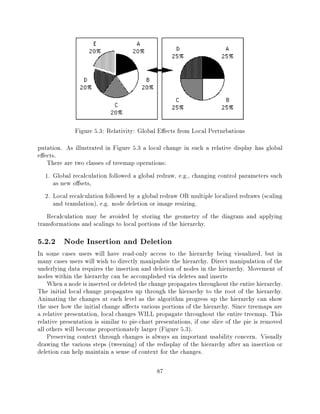

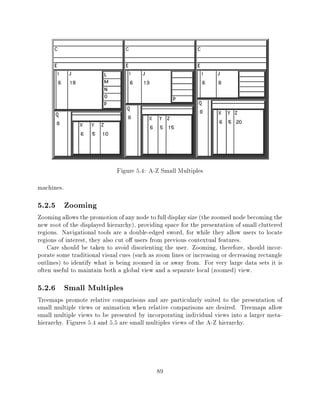
![Figure 5.5: A-Z Small Multiples, equally weighted nodes
5.2.7 Animation
Motion is the strongest visual appeal to attention ... Motion implies a change
in the conditions of the environment, and change may require reaction."
Arn69]
Animation with treemaps is one approach to visualizing relative changes over time. To-
day's graphics hardware makes it possible to visualize relative change on a global scale in
real time.
Fast, smooth, real-time animation between views can solve some of the loss of context
problems currently associated with dynamic manipulations. For example, smooth real-time
navigation provides a continuous context shift rather than the abrupt loss of the context
currently experienced by users CRM91]. Animation can also help locate trends over time,
from the dynamics of government spending over the last 100 years to the dynamics of the
stock market this week.
It is important to note once again that treemaps are a relative presentation technique.
As such items in an animation which appear to change may actually remain constant in an
absolute sense, as it may be that other items in the presentation are changing relative to the
item of interest.
5.2.8 Filtering & Linking
Filtering nodes allows users to concentrate on features of interest. Users may wish to see only
those nodes satisfying certain properties. Examples include: internal nodes, leaf nodes, spec-
90](https://image.slidesharecdn.com/1993brianjohnsondissertation-1311918672257-phpapp02-110729005208-phpapp02/85/Treemaps-Visualizing-Hierarchical-and-Categorical-Data-110-320.jpg)
![i ed branches of the hierarchy, nodes of certain depths or nodes with a particular attribute
(for example, all text les).
Multiple linked views can provide insight not provided by any single view. At the very
least users should be able to simultaneously view the raw data used to generate the cur-
rently selected data glyph. Cursor tracking and the dynamic text display provide this basic
functionality.
Providing multiple linked visualizations of the data set provides the capability necessary
to correlate di erent features of the data set. Selecting the glyphs with a common data
feature in one view might simultaneously select only glyphs correlated via some other data
feature in a separate view. For example, selecting expensive, warm points in a scatter plot
of national home prices might simultaneously highlight homes in southern California and
Hawaii in a separate map view BMMS91].
Dynamic Queries
Dynamic queries are the direct manipulation extension of textual database queries. Direct
manipulation widgets allow users to pose multiple, rapid, and reversible interactive queries,
tailoring their search based on the updates of the display. Dynamic queries are an instantia-
tion of general linked views, in which one of the views is typically an interface control widget
(button, slider, ...) which controls the presentation of data in the main view.
For example, a user looking at a nancial portfolio containing 1000 bond issues could
easily manipulate a slider highlighting bonds in the display based on their rate of return.
With such a tool, trends in the data could be visualized by manipulating the slider and
watching the highlighting patterns uctuate across the display. In a similar vein, a direct
manipulation widget could be used to prune the data space. Perhaps this same hypothetical
user is interested only in bonds whose quality rating lies within a certain range. Instead of
zooming in on a particular region of the display the user could lter out all of the nodes
outside of the selected range.
A capability that would allow users to specify queries and have the results shown by
highlighting or blinking matching bounding boxes is the most prevalent request. Issues here
relate to appropriate highlighting mechanisms and feedback to users WS92] BMMS91].
5.3 TreeVizTM Design and Development
The TreeVizTM application is quite general and was used to generate the majority of the
gures in this dissertation. TreeVizTM is available to the public and has been in use for 3
years (see Appendix C for details).
The general principles underlying treemaps and the TreeVizTM implementation are dis-
cussed throughout the dissertation. This section discusses some of the speci c details of the
TreeVizTM implementation.
91](https://image.slidesharecdn.com/1993brianjohnsondissertation-1311918672257-phpapp02-110729005208-phpapp02/85/Treemaps-Visualizing-Hierarchical-and-Categorical-Data-111-320.jpg)
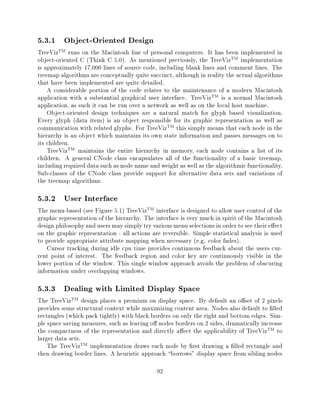
![to avoid dropping small ( 1 pixel) nodes out of the display. Nodes whose width or height
<
is a single pixel are drawn with a dashed border to allow the ll color to show through. In
practice, groups of small nodes often occur in clumps" and this strategy allows the general
color of the collection to show through the stippled borders.
5.3.4 Multiple Data Sets
The design of the application is data driven, there is one window for each separate data set.
The data is either scanned directly from the hard disk or read in from a data le. Data
les may represent the hierarchy either explicitly via a list of lists format, or implicitly via
a at le categorical data. In the case of a at le, the hierarchy is built via a hierarchical
decomposition of the data set based on categorical variables speci ed in the le header.
Macintosh File Hierarchies
TreeVizTM directly supports the visualization of le hierarchies on the Macintosh. Users
may select a folder from the standard Macintosh Open File" dialog box and TreeVizTM
will scan the le hierarchy below the selected folder directly from the hard disk and create
a treemap visualization (see Figure 3.2).
TreeVizTM provides explicit support for mapping Macintosh le sizes, creation dates, and
modi cation dates to node weights, color saturations, and tones in the representation. By
default node weights represent le size and the color key shows le types. To free up space on
a full hard disk, for example, a user might map le sizes to node weights and fade node colors
(reduced saturation) based on le modi cation dates. This would quickly show space usage
(node sizes) on the disk while providing an indication of le type (hue) and age (saturation).
5.4 Conclusion
Direct control over constructions of the visualization can provide users with a deeper under-
standing of the presentation and improve their con dence in the information being presented
HH90]. As with any interface, novice users should be able to work their way slowly and
gradually into the degree of control and complexity they are comfortable with.
Tools are merely a means to an end. Treemaps are a exible interactive tool that provide
a means to extract usable information from large bodies of hierarchical data.
People use tools to solve problems. Creating interactive tools that t people makes sense.
We will never achieve the best t, but interactive visualization tools such as treemaps are
a step in the right direction, providing people with dynamic control over high-bandwidth
communications.
93](https://image.slidesharecdn.com/1993brianjohnsondissertation-1311918672257-phpapp02-110729005208-phpapp02/85/Treemaps-Visualizing-Hierarchical-and-Categorical-Data-113-320.jpg)
![Chapter 6
Categorical Data
Treemaps are an e ective and e cient visualization technique not just for hierarchical data
spaces, but for any data space to which hierarchical decompositions can be applied. Hierar-
chically decomposable data spaces for which grouping and categorization are of interest have
quite natural treemap representations. These types of data spaces include tables, multi-way
tables, spreadsheets and databases.
6.1 Related Work
Statisticians have developed mosaic displays of contingency tables which are close cousins to
the treemap HK81] Wan85] HK84]. Mosaic displays are a graphic technique for displaying
the hierarchical decomposition of statistical variability typically presented in tabular contin-
gency tables. Although the focus is somewhat di erent and the two techniques were derived
independently, mosaic displays and categorical treemaps are largely equivalent.
6.2 Hierarchical Decomposition
When confronted with vast quantities of data people must organize their thoughts in order to
make sense of the information contained in the data. One way people organize their thoughts
is to organize their data, reorganize their data, and then re ne their reorganizations. A com-
mon and powerful organizing scheme often employed is that of categorization, or hierarchical
decomposition of the data into groups related by common features. Categorization in such
a fashion leads directly into the domain of treemaps - hierarchically structured data.
Organizing data is the rst step of envisioning the information contained in the data,
holding the data in the minds eye and seeing what distinguishes di erent portions of the
data from one another, grasping the trends and exceptions. By categorizing and grouping
data we move from a sea of unique particulars into more abstract views of the data. Upon
arriving at the correct level of abstraction relevant decisions can be made.
A key feature of treemaps is that when looking at a forest of abstractions and noting
global trends, the unique particulars are not lost.
94](https://image.slidesharecdn.com/1993brianjohnsondissertation-1311918672257-phpapp02-110729005208-phpapp02/85/Treemaps-Visualizing-Hierarchical-and-Categorical-Data-114-320.jpg)
![Interactive visualizations allow users to permute the groupings they imposed on the data,
looking for trends and anomalies. Interactive decompositions may support the categorization
and abstraction inherent in decision making
Presented with a collection of data records each of which contains n attributes, their are
n! possible partionings of this data corresponding to the n! treemaps views.
For example, if we have 3 attributes such as Vehicle, Age, and Sex, there are 6 unique
orderings of these attributes (e.g. VAS, VSA, AVS, ASV, SVA, SAV).
Partitioning data in this manner results in uniform depth hierarchies if data points exist
in all categories. This standardization of the hierarchy is desired as the quantity of data and
the complexity of the layout demand that the user be able to rely on transferring assumptions
uniformly throughout the diagram.
Tours of the Data
When number of partition dimension for hierarchical decomposition is small it is possible
to automatically generate tours of all possible presentations. For complex data sets tech-
niques similar to multi-dimensional statistical grand tours may be used, where a series of
interesting" decompositions are automatically generated for the user BA86].
Automatic permutations of multi-dimensional data are especially relevant to data spaces
of high dimensionality, as these data spaces are especially roomy" and users are unlikely to
stumble across interesting projections of the data by chance.
6.3 Tabular" Treemaps
Tables are excellent tools for looking up precise values but they are poor tools for making
global comparisons.
Which cell in a table contains the largest value? This value can often be discovered by
the longest number in the table, which often makes its cell proportionately darker than most
of the other cells.
Given any 2-D table, how can we pump up" the visual presentation of each cell to
accurately represent the value that it contains? Treemaps are one way to achieve this goal.
6.3.1 Tra c Accidents Victims, in France, in 1958
Information can have 2, 3, ... n, components, and n can be quite large.
It is su cient that one of the components be common to all of the
data.
Consider the following example:
Analysis of highway accidents in France.
INVARIANT|an accident victim.
95](https://image.slidesharecdn.com/1993brianjohnsondissertation-1311918672257-phpapp02-110729005208-phpapp02/85/Treemaps-Visualizing-Hierarchical-and-Categorical-Data-115-320.jpg)
![Table 6.1: Tra c Accidents by Vehicle Type
J. Bertin, Semiology of Graphics
Treemaps can be quite easily extended to present tabular data. A simple table with only
two organizing variables (rows and columns) can be thought of as being divided rst based
on one variable (e.g. row) and then divided one the other (e.g. column). This is equivalent
to a simple hierarchy split rst by row and then by column.
An example will best illustrate this idea. The data in Tables 6.1, 6.3, 6.4, and 6.5
represent Tra c Accident Victims Ber83]. The graphs of Figures 6.1, 6.3, 6.5, and 6.7 for
this data have been taken directly from Ber83]. Treemap Figures 6.2, 6.4, 6.6, and 6.8 have
been constructed to mirror the layout of the cells in Tables 6.1-6.5. It should be noted that
these tables are multi-category tables, standard row by column tables are a simple subcase
with 2 categories.
6.3.2 Tra c Accidents Victims, in France, in 1958, by Vehicle
Type
Table 6.1 groups individual tra c accident victims based on their mode of transport. We
see that motorcycles are responsible for the largest proportion of tra c accident victims.
We also see that bicycles account for the fewest tra c accident victims. With a little mental
calculation we see that there were roughly 2/3 (.6) as many bicycle tra c accident victims
as pedestrian tra c accident victims.
Numeric tables are an excellent tool for presenting precise values but comparisons between
groups require numeric calculations. For this simple data set, position judgments CM84]
are most e cient for comparisons between groups. The simple bar graph of Figure 6.1 is
an example where users need only compare the positions of the tops of the bars in order to
make comparative judgments.
A slightly less e ective method for presenting this data requires users to make judgments
of length, such as in a stacked bar or the treemap of Figure 6.2. The treemap of Figure
6.2 requires only length judgments as the vertical dimension is xed and only horizontal
extents vary. Although users are free to make comparisons based on areas, in the case of
sibling treemap nodes which share one common dimension, simple length judgments on the
non-common dimension are more accurate. Graphic data presentations such as graphs and
treemaps facilitate rapid comparisons at the expense of precise but mentally challenging
numeric calculations.
Figure 6.2 is the simplest realistic case of a categorical treemap. In Figure 6.2 the
hierarchy being portrayed is given by the outline of Table 6.2.
96](https://image.slidesharecdn.com/1993brianjohnsondissertation-1311918672257-phpapp02-110729005208-phpapp02/85/Treemaps-Visualizing-Hierarchical-and-Categorical-Data-116-320.jpg)
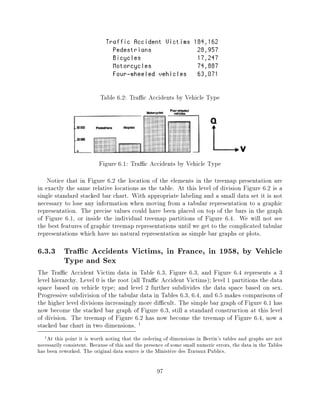
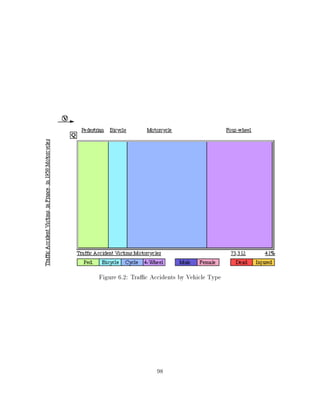

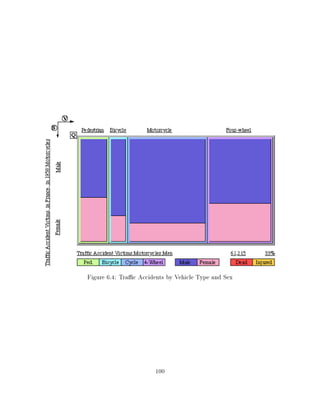


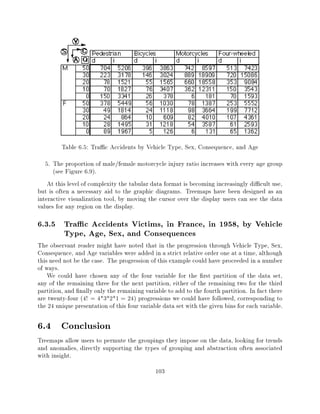
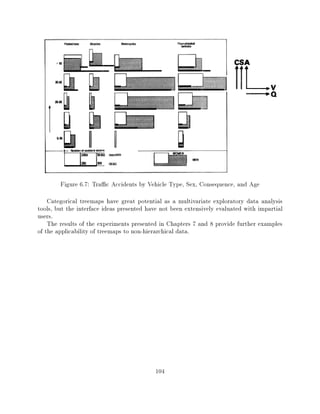
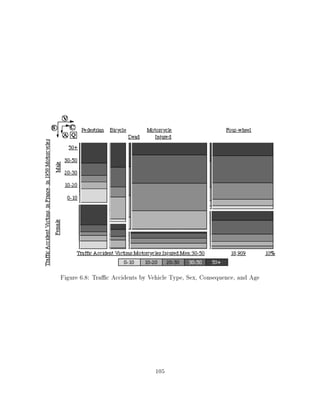
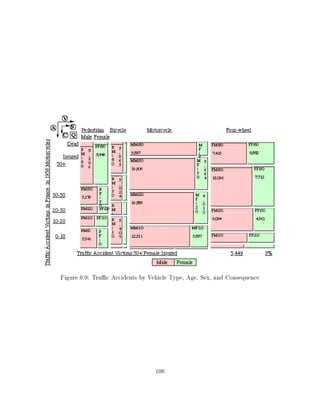


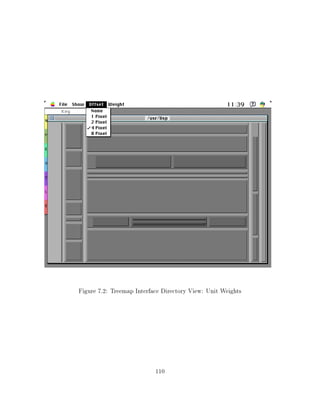

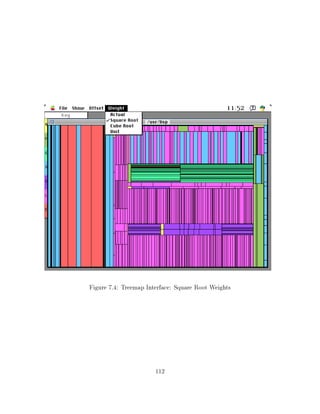
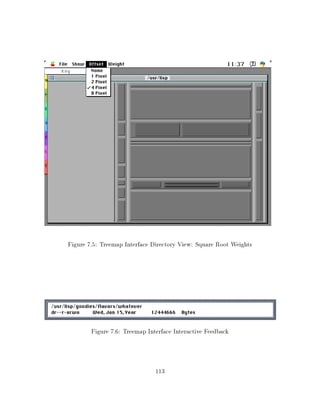
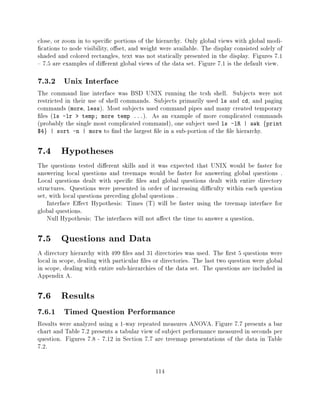

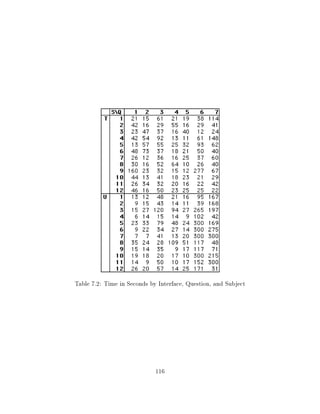
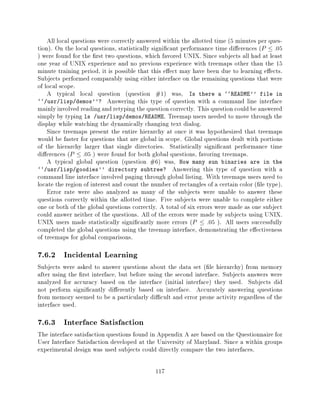

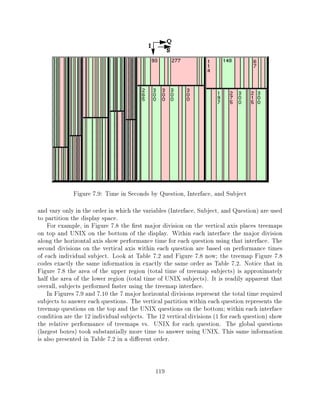
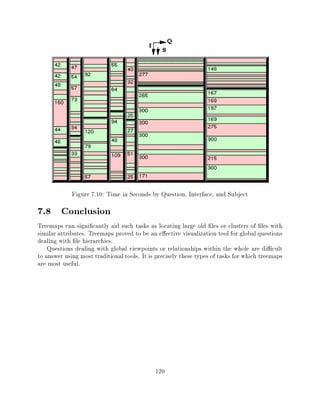
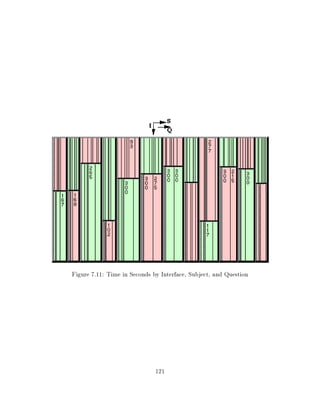

![Chapter 8
US Budget Experiment
The evidence supporting the notion that visual information systems may be
a substantial improvement over textbased information systems is at the same
time obvious and tenuous. On the obvious side, pictures have a long-standing
reputation for encapsulating concepts that would take many words to explain.
A well-conceived data graph, particularly, can quickly show the relationships of
thousands and even millions of data points or observations. As Edward Tufte
aptly demonstrated, `No other method for the display of statistical information
is so powerful.' " Vei88]
One must be careful not to fall into a conceptual trap by adopting accuracy as
a criterion. We are not saying that the primary purpose of a graph is to convey
numbers with as many decimal places as possible. We agree with Ehrenberg
(1975) that if this were the only goal, tables would be better. The power of a
graph is its ability to enable one to take in the quantitative information, organize
it, and see patterns and structure not readily revealed by other means of studying
the data." CM84]
8.1 Introduction
Our approach to visualization with treemaps relies on both theory and experimentation. This
chapter provides conclusive evidence that treemaps are an e ective hierarchical visualization
technique. This comparative study builds on the results of the rst treemap experiment
presented in Chapter 7, which con rmed that treemaps are valuable data presentation tools
for global location and comparison questions.
This nal experiment has been designed to be simple, clear, and convincing in both the
experimental methods employed and the results achieved. The data set (1992 US Budget)
is an ideal real world testbed for treemaps. There are 357 nodes in this budget hierarchy
and dollar values (weight or degree of interest") for each line item in the budget vary quite
dramatically. With larger data sets treemaps should prove to be even more advantageous.
In answer to the question Compared to what?" Treemaps are compared to a very
e ective dynamic outline interface provided in a popular spreadsheet application. This
123](https://image.slidesharecdn.com/1993brianjohnsondissertation-1311918672257-phpapp02-110729005208-phpapp02/85/Treemaps-Visualizing-Hierarchical-and-Categorical-Data-143-320.jpg)

![2. The contiguous layout of local" portions of the hierarchy, and
3. O sets, text labels, and a dynamic position based dialogs which provide both local
(dialog) and global (labels and o sets) location information.
Treemaps have the great advantage of presenting large hierarchies compactly. This allows
users to rapidly shift the focus of their attention to di erent portions of the data set. The
compact representation also maximizes the data glyph area (foreground) and minimizes
background. Great expanses of background (white space) are not needed to carry the data
signal (glyphs) as the glyphs are both the carrier and the signal.
Value
The location tasks for this experiment deal primarily with the location of high-value items
in the hierarchy. This is not as restrictive as it may seem, recall that the assignment of value
(or degree of interest) to items in the hierarchy is a powerful tool that can be interactively
controlled by the user (but was not for this experiment).
Treemaps graphically represent the value (or degree of interest) of each item in the
hierarchy. 2-D treemaps code value by the total area of a rectangular glyph. Thus the
location of high-value items in the hierarchy is transformed into the perceptual task of
locating the rectangular glyphs with the largest areas. When an item of interest is found its
absolute value is a number which must be read by the user from the display.
Experiments dealing with the ordering of elementary perceptual tasks indicate that there
are a number of methods superior to area for encoding values, such as position along a
common scale, position on non-aligned scales, length, and direction CM84] SH87]. Unfor-
tunately most alternative graphical representations of value are not congruent with our goal
of presenting data glyphs compactly and in context.
Comparison and Proportion
Encoding item values by the area of the data glyphs fosters relative comparisons. Judgments
of proportion have been transformed from a numeric task into a perceptual task. Rough
judgments in proportion are quite rapid perceptual tasks but ne distinctions continue to
rely on numeric values, as area comparisons between rectangles with varying aspect ratios
is di cult.
Distribution
Seeing the forest and the trees, or presenting a global view of the distribution of values in the
hierarchy is perhaps the single greatest bene t of treemaps. Unfortunately it is very di cult
to measure the gestalt impression provided by a particular presentation in a controlled ex-
periment. Treemaps a ord very low-risk browsing but this is a di cult hypothesis to test as
by their very de nition speci c tasks must be speci c. A well controlled experiment makes
questions and answers including words such as most" di cult.
125](https://image.slidesharecdn.com/1993brianjohnsondissertation-1311918672257-phpapp02-110729005208-phpapp02/85/Treemaps-Visualizing-Hierarchical-and-Categorical-Data-145-320.jpg)


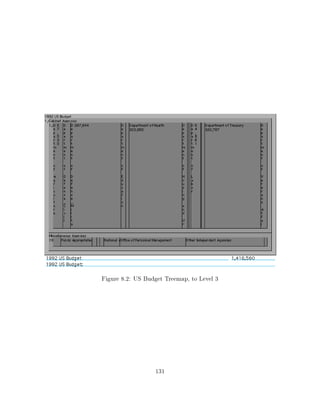


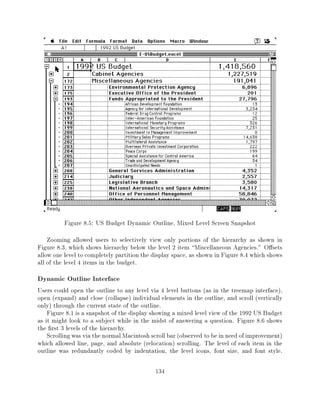


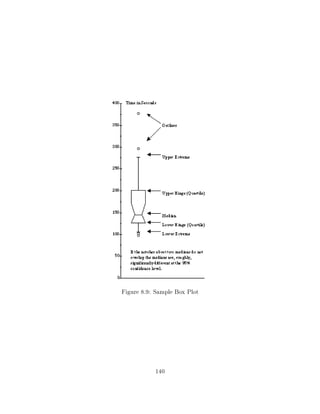


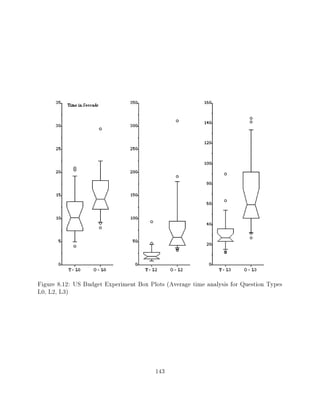
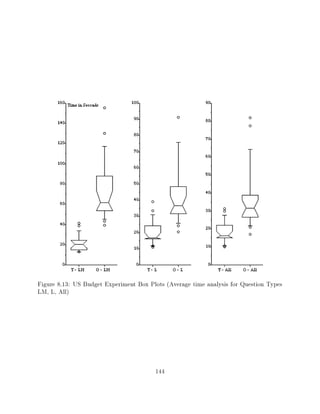


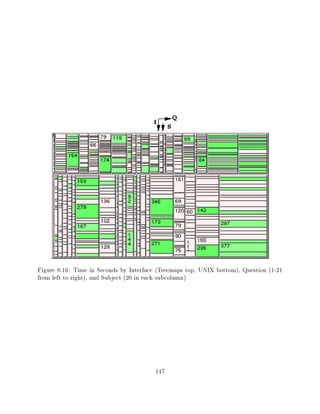
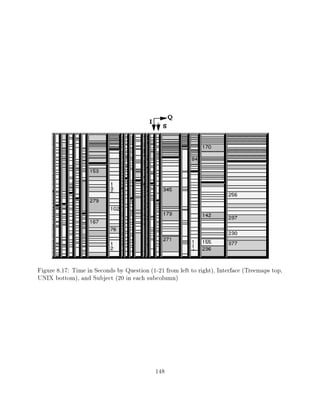

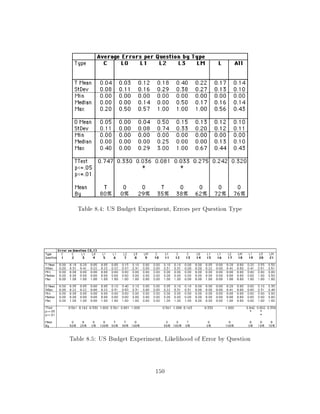
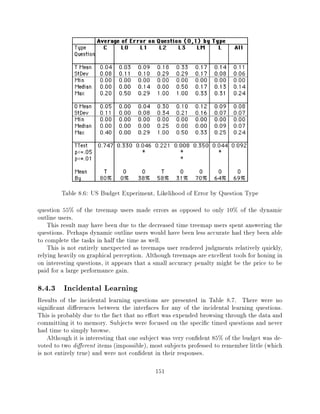


![values, overwhelming (!) number of boxes." This subject was very fast, taking on
average only 10 seconds per question!]
I thought it was confusing at rst with the zoom and o set features but then became
very comfortable with the interface. I would make the screen bigger so that the small
boxes will be bigger."
I like the way the value changed with every movement of the mouse. The fact that bud-
get items were displayed by their value was very helpful (value as percent of screen)."
The use of boxes with varying height and width is confusing..."
Very fast and responsive. Proportionality of windows made it easy to tell which was
larger, but only in largest windows of each level. Di cult to read text in smaller
windows. Would be easier to use with larger screen. Puts lots of information within
easy reach and enables you to easily discern relationships between di erent boxes (but
only for larger boxes). The smallest boxes (level 4) seemed to get in the way at times."
The interface may have been a little easier to follow had it been a) in color and b)
actually layed out in tree-format. However, I think the fact that everything was always
on the screen (i.e. no scroll bars) gives a user con dence in knowing where everything
is and not wasting time going back and forth over a screen. Otherwise, the system
seems quite easy to learn with minimal instruction and very exible to use. The fact
that minimal commands are required is, I think, a very outstanding feature."
Proportional areas for item values are good for visual comparison."
Most interesting thing about the system is not its ability to help you nd a speci c
info. Rather the relationships between the sizes of speci c categories and ??] the
structure of the categories. Found getting to speci c item #'s tedious. I liked the
Big picture. I wanted to get an even Bigger more detailed Picture and surf around.
Perhaps a 3D display." This subject was the fastest treemap user.]
In general, I liked the system a lot and learned something about the US budget, which
has always been a mystery to me. The interface was easy to use (just 1 or 2 clicks
on the mouse) and after about 10 minutes training with the investigator showing me
alternate ways to look up data in the hierarchy, I was to go to the real Budget (the
US Budget). After this experiment, I am more likely to use a mouse interface since
it is becoming more natural to me with practise, and I do usually prefer visual data
(pictures and words) to reams of tables of data. The proportional sizing of the boxes
(items in budget) helped me to estimate visually the largest to smallest before looking
at the value in the box. Room for improvement: use a larger screen (e.g., 14'-19') if it
doesn't] mess the graphics aspect of your program so that, more values and titles of
the smaller boxes can be seen."
155](https://image.slidesharecdn.com/1993brianjohnsondissertation-1311918672257-phpapp02-110729005208-phpapp02/85/Treemaps-Visualizing-Hierarchical-and-Categorical-Data-175-320.jpg)


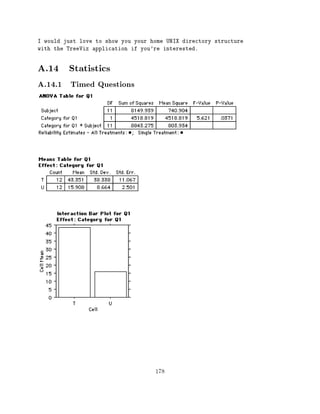


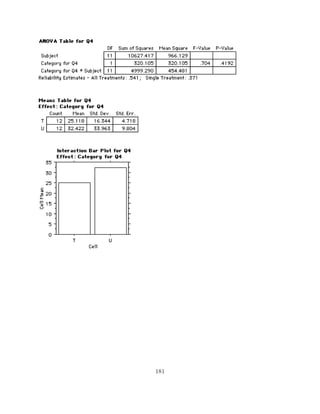


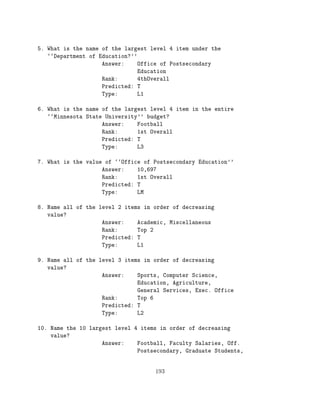
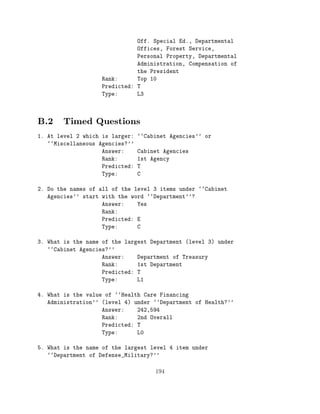


![task once you have started working on a question.
You do not need hurry between questions.
If you have any further questions please ask the administrator
now.
B.13 US Budget Experiment Observations
This section contains the textual data gathered in during the US Budget experiment. Subject
comments have been entered verbatim, including subjects grammar and spelling errors. At
times editorial comments have been enclosed e.g, like this] in square brackets. The data is
presented by subject, with the data for subjects in each interface grouped together in order
to foster comparisons between the interfaces. The format of the data is as follows:
Subject XY where X indicates the interface condition (T-treemap, O-dynamic outline)
and Y is the subject number]
Administrator Comments:
Observations of the administrator.
Subject Budget Comments:
1. Subjects were asked to write down 5 things about the 1992 US Budget
2. from memory. Subjects completed this portion of the experiment after
3. the Incidental Learning questions. They were asked to write down
4. whatever they remembered.
5. - indicates an empty entry
Subject Interface Comments:
These are the subjects comments on the interface. Subjects often wrote quite long com-
mentaries with very little prompting.
B.13.1 Treemap Observations
Subject T1
Administrator Comments:
Quite and careful. CS grad
Subject Budget Comments:
210](https://image.slidesharecdn.com/1993brianjohnsondissertation-1311918672257-phpapp02-110729005208-phpapp02/85/Treemaps-Visualizing-Hierarchical-and-Categorical-Data-230-320.jpg)
![1. It had a mis. part.
2. It had military defense.
3. It had civil defense.
4. It had a treasury.
5. It had departments.
Subject Interface Comments:
It was ne, easy to learn and use
Subject T3
Administrator Comments:
Quite, CS ugrad?
Subject Budget Comments:
1. Interest on the national debt is larger than I thought.
2. hadn't thought of the Department of Defense having a civilian component.
3. Didn't know there were that many miscellaneous agencies."
4. Didn't know the Treasury Department was such a large component of the budget.
5. I thought defense spending would be higher
Subject Interface Comments:
I seemed to heave the most problems with questions involving level 4. The greyscale was
helpful sometimes but a color interface would probably be more user friendly. I liked the
paths for each area of information and the double-click zoom was helpful on more than one
occasion. I was shown the areas in separated form before I started the practice question.
That format should be permanent. The o set feature would be more helpful if the boxes
were not centered inside an area. For example gure with only top-left o set] would allow
more room for text than centered gure with o set on all 4 sides].
Subject T5
Administrator Comments:
Knows quad trees from Samet's course.
Subject Budget Comments:
1. Military budget is very high relative to other areas.
2. Overall, the budget is lower than I had expected.
211](https://image.slidesharecdn.com/1993brianjohnsondissertation-1311918672257-phpapp02-110729005208-phpapp02/85/Treemaps-Visualizing-Hierarchical-and-Categorical-Data-231-320.jpg)


![4. That there are so many di erent programs.
5. That the numbers are not higher ed. values were in millions of $'s].
Subject Interface Comments:
I thought it was confusing at rst with the zoom and o set features but then became
very comfortable with the interface. I would make the screen bigger so that the small boxes
will be bigger.
Subject T15
Administrator Comments:
Impatient & hyperactive with the mouse.
Subject Budget Comments:
1. Military spending very large.
2. Civil Agencies about 70% of budget.
3. Civilians in Military spending high.
4. Didn't see congressional salaries (senators, congressman, president, etc.).
5. Dept. of Transportation is budgeted about middle-of-the-road.
Subject Interface Comments:
I like the way the value changed with every movement of the mouse. The fact that budget
items were displayed by their value was very helpful (value as percent of screen).
Subject T17
Administrator Comments:
-
Subject Budget Comments:
1. I thought a higher percentage of the budget would have been Military.
2. It was not as complex as I expected.
3. I don't recall seeing a budget for the Pres. or Congressmen.
4. The department of the Treasury was larger than I expected.
5. No disaster relief was immediately evident.
214](https://image.slidesharecdn.com/1993brianjohnsondissertation-1311918672257-phpapp02-110729005208-phpapp02/85/Treemaps-Visualizing-Hierarchical-and-Categorical-Data-234-320.jpg)


![Subject Interface Comments:
The interface may have been a little easier to follow had it been a) in color and b) actually
layed out in tree-format. However, I think the fact that everything was always on the screen
(i.e. no scroll bars) gives a user con dence in knowing where everything is and not wasting
time going back and forth over a screen. Otherwise, the system seems quite easy to learn
with minimal instruction and very exible to use. The fact that minimal commands are
required is, I think, a very outstanding feature.
Subject T27
Administrator Comments:
Older, responsible for PC site system maintenance. Wants monitor at eye level (he's tall)
and items shaded by size.
Subject Budget Comments:
1. Damn little, sorry.
2. -
3. -
4. -
5. -
Subject Interface Comments:
Defaulting to Alphabetic organization is restrictive - user should be able to specify other
ordering. 14" screen ok, larger w?? recommended for deep trees. User should be able to
shade terms at will. Q 4.5 QUIS] implys user exploration, little point to this if test format
begins with complete overview. Screen height and angle was xed which bothered this tall
subject.
Subject T29
Administrator Comments:
Psych Ph.D. Black text on dark background is hard to read. Colons do not adequately
delimit the path string.
Subject Budget Comments:
1. Admin expenses were such a high % of Dept of Defense Military."
2. Interest on the Public Debt" was a rather large item.
3. Dept of Defense was divided into Civilian" & Military."
4. There were many small items that I don't even remember the names of.
217](https://image.slidesharecdn.com/1993brianjohnsondissertation-1311918672257-phpapp02-110729005208-phpapp02/85/Treemaps-Visualizing-Hierarchical-and-Categorical-Data-237-320.jpg)

![1. Huge amount of public debt.
2. The procurement in Dept of Defense Military seems large within defense budget.
3. -
4. -
5. -
Subject Interface Comments:
Vertical words are hard to read. Switching up (see graphs) & down (see names) take
time. Displaying names on the top of the screen should be an option provided to users.
Alphabetical ordering might not be the best arrangement. hot set - allowing users to choose
some items, not all of items to display at a time. Might be a useful option (i.e. the hierarchy
should not be too broad). 4-level depth seems good, have you tried 3-level depth, or 5-level
depth. The area proportion display has no use for small amounts of items compared to their
neighbors. color, graying seemed to me improvable.
Subject T35
Administrator Comments:
CS Ph.D. Hyperactive mouser.
Subject Budget Comments:
1. Di erentiation between DOD Civ and DOD Mil.
2. Size of Dept of Health.
3. RTC in Misc Agencies, not Treasury.
4. Size of Debt Relative to other expenditures at Dept of Treasury.
5. The large portion of the budget that is at Cabinet level agencies.
Subject Interface Comments:
Most interesting thing about the system is not its ability to help you nd a speci c info.
Rather the relationships between the sizes of speci c categories and ??] the structure of the
categories. Found getting to speci c item #'s tedious. I liked the Big picture. I wanted to
get an even Bigger more detailed Picture and surf around. Perhaps a 3D display.
Subject T37
Administrator Comments:
No CS experience (husband a CS grad). Slow double click. Non-mac users have a lot
of trouble with double clicks - perhaps I should have made zoom a single click for this
experiment.
Subject Budget Comments:
219](https://image.slidesharecdn.com/1993brianjohnsondissertation-1311918672257-phpapp02-110729005208-phpapp02/85/Treemaps-Visualizing-Hierarchical-and-Categorical-Data-239-320.jpg)


![Subject Interface Comments:
Pretty straightforward and easy to use.
Subject O16
Administrator Comments:
CS Ph.D. Used level 3 to nd large level 4 items.
Subject Budget Comments:
1. Dept. of Defense is broken down into 2 items DOD Civil and DOD Military.
2. There is a 250,000 budget item that is not Interest on Debt of Military Spending ed.
Health Care].
3. DOD Military spends so little on soldier salary.
4. Such a high percentage of the budget goes to cabinet agencies.
5. Interest on the Public Debt is handled by Treasury Dept.
Subject Interface Comments:
The system was easy to move around in. I would have preferred to have been able to
remove level 4 items from the screen.
Subject O18
Administrator Comments:
English. A little trouble with the scroll bar.
Subject Budget Comments:
1. Interior on the Public debt 290,000
2. Procurement 29,000
3. Employment and personnel 10,000
4. Heat care and resources 50,000
5. NASA 100,000
Subject Interface Comments:
The interface should be encouraged to make more development, but it can involve more
functions, i.e. sorting, cutting. The scrolling of long screen sometimes is not easy to be
feedback.
Subject O20
Administrator Comments:
-
Subject Budget Comments:
224](https://image.slidesharecdn.com/1993brianjohnsondissertation-1311918672257-phpapp02-110729005208-phpapp02/85/Treemaps-Visualizing-Hierarchical-and-Categorical-Data-244-320.jpg)


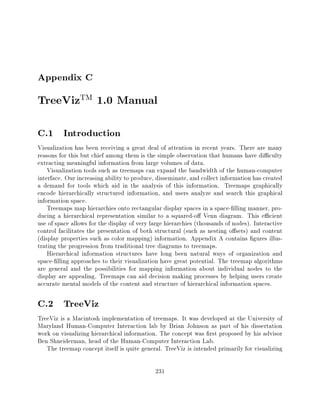

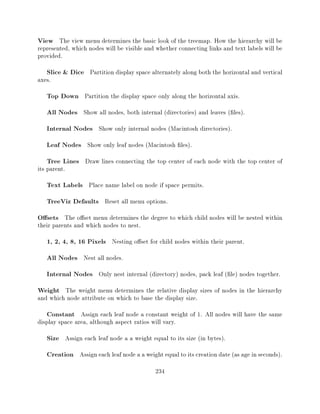


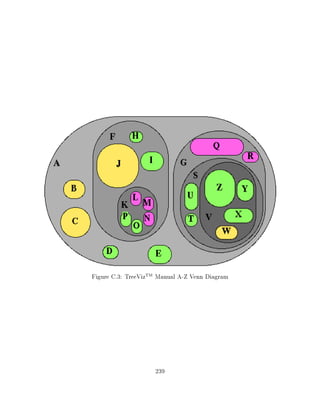
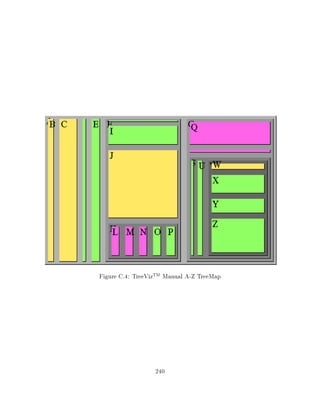


![Bibliography
Abb52] Edwin A. Abbott. Flatland. Dover Publications, Inc., New York, NY, 1952.
Arn69] Rudolf Arnheim. Art and Visual Perception. University of California Press,
Berkeley, California, 1969.
BA86] Andreas Buja and Daniel Asimov. Grand tour methods: An outline. In D.M.
Allen, editor, Computing Science and the Interface: Proceedings of the17th Sym-
posium on the Interface, pages 63{67. Elsevier Science Publishers B.V. (North-
Holland), 1986.
BBF+85] William Buxton, Sara A. Bly, Steven P. Frysinger, David Lunney, Douglass L.
Mansur, Joseph J. Mezrich, and Robert C. Morrison. Communicating with
sound. In Proceedings of the ACM Conference on Human Factors in Computing
Systems, 1985.
BC90] Judith R. Brown and Steve Cunningham. Visualization in higher education.
Academic Computing, page 24, March 1990.
Ben75] J. L. Bentley. Multidimensional binary search trees used for associative search-
ing. Communications of the ACM, 18(9):509{517, September 1975.
Ber83] Jacques Bertin. The Semiology of Graphics. University of Wisconsin Press,
Madison, Wisconsin, 1983.
BFN86] Heinz-Dieter Bocker, Gerhard Fischer, and Helga Nieper. The enhancement
of understanding through visual representations. In Proceedings of the ACM
Conference on Human Factors in Computing Systems, pages 44{50, 1986.
BI90] David V. Beard and John Q. Walker II. Navigational techniques to improve the
display of large two-dimensional spaces. Behavior & Information Technology,
9(6):451{466, 1990.
BKW89] A. Bruggemann-Klein and D. Wood. Drawing trees nicely with tex. Electronic
Publishing, 2(2):101{115, July 1989.
243](https://image.slidesharecdn.com/1993brianjohnsondissertation-1311918672257-phpapp02-110729005208-phpapp02/85/Treemaps-Visualizing-Hierarchical-and-Categorical-Data-263-320.jpg)
![BMMS91] Andreas Buja, John Alan McDonald, John Michalak, and Werner Stuetzle. In-
teractive data visualization using focusing and linking. In Proceedings of the
IEEE Conference on Visualization, pages 156{163, 1991.
BNG89] Megan L. Brown, Sandra L. Newsome, and Ephraim P. Glinert. An experiment
into the use of auditory cues to reduce visual workload. In Proceedings of the
ACM Conference on Human Factors in Computing Systems, pages 339{346,
1989.
Bro88] Frederick P. Brooks, Jr. Grasping reality through illusion - interactive graphics
serving science. In Proceedings of the ACM Conference on Human Factors in
Computing Systems, Plenary Address, pages 1{11, 1988.
BRS92] Rodrigo A. Botafogo, Ehud Rivlin, and Ben Shneiderman. Structural analysis
of hypertexts: Identifying hierarchies and useful metrics. ACM Transaction on
Information Systems, 10(2):142{180, April 1992.
But90] Scott A. Butler. The e ect of method of instruction and spatial visualization
ability on the subsequent navigation of a hierarchical data base. Technical Re-
port CAR-TR-488, CS-TR-2398, Human-Computer Interaction Lab, Dept. of
Computer Science, Univ. of Maryland at College Park, February 1990.
CDN88] John P. Chin, Virginia A. Diehl, and Kent L. Norman. Development of an
instrument measuring user satisfaction of the human-computer interface. In
Proceedings of the ACM Conference on Human Factors in Computing Systems,
1988.
Chi92] Richard Chimera. Value bars: An information visualization and navigation tool
for multi-attribute listings and tables. In Proceedings of the ACM Conference
on Human Factors in Computing Systems, pages 293{294, October 1992.
Cla91] Mark A. Clarkson. An easier interface. BYTE, pages 277{282, February 1991.
CM84] William S. Cleveland and Robert McGill. Graphical perception: Theory, exper-
imentation, and application to the development of graphical methods. Journal
of the American Statistical Association, 79(387):531{554, September 1984.
Col86] William G. Cole. Medical cognitive graphics. In Proceedings of the ACM Con-
ference on Human Factors in Computing Systems, pages 91{95, 1986.
Cox90] Donna J. Cox. The art of scienti c visualization. Academic Computing, page 20,
March 1990.
CRM91] Stuart K. Card, George G. Robertson, and Jock D. Mackinlay. The information
visualizer, an information workspace. In Proceedings of the ACM Conference on
Human Factors in Computing Systems, pages 181{188, 1991.
244](https://image.slidesharecdn.com/1993brianjohnsondissertation-1311918672257-phpapp02-110729005208-phpapp02/85/Treemaps-Visualizing-Hierarchical-and-Categorical-Data-264-320.jpg)
![CWMS93] Richard Chimera, Kay Wolman, Sharon Mark, and Ben Shneiderman. Eval-
uation of three interfaces for browsing hierarchical tables of contents. ACM
Transaction on Information Systems, 1993. to appear.
CZP93] M. Chignell, S. Zuberec, and F. Poblete. An exploration in the design space
of three dimensional hierarchies. In Proceedings of the Human Factors Society,
1993.
DM90] Chen Ding and Prabhaker Mateti. A framework for the automated draw-
ing of data structure diagrams. IEEE Transactions on Software Engineering,
16(5):543{557, May 1990.
DMR90] Andrew Dillon, Cli McKnight, and John Richardson. Navigation in hypertext:
A critical review of the concept. In Human-Computer Interaction { INTERACT,
pages 587{592, 1990.
Dyk91] Phillip Dykstra. Xdu - display the output of du in an x window. included in
the MIT X11R5 distribution, September 1991. Version 1.0.
EGS86] Herbert Edelsbrunner, Leonidas J. Guibas, and Jorge Stolf. Optimal point
location in a monotone subdivision. SIAM Journal of Computing, 15(2):317{
340, May 1986.
EH89] Deborah M Edwards and Lynda Hardman. lost in hyperspace": Cognitive
mapping and navigation in a hypertext environment. In booktitle?, chapter 7,
pages 105{125. pub?, 1989.
Ehr75] A. S. C. Ehrenberg. Data Reduction: Analyzing and Interpreting Statistical
Data. John Wiley, 1975.
Eic93] Steve Eick. Personal communication. eick@research.att.com, 1993.
Ell90] Richard Ellson. Visualization at work. Academic Computing, page 26, March
1990.
Fee91] William R. Feeney. Gray scale diagrams as business charts. In Proceedings of
the IEEE Conference on Visualization, pages 140{147, 1991.
FG79] M. Fitter and T. R. Green. When do diagrams make good computer languages?
International Journal of Man-Machine Studies, 11:235{260, 1979.
Fur86] George W. Furnas. Generalized sheye views. In Proceedings of the ACM Con-
ference on Human Factors in Computing Systems, pages 16{23, 1986.
Fur91] George W. Furnas. New graphical reasoning models for understanding graph-
ical interfaces. In Proceedings of the ACM Conference on Human Factors in
Computing Systems, 71-78, 1991.
245](https://image.slidesharecdn.com/1993brianjohnsondissertation-1311918672257-phpapp02-110729005208-phpapp02/85/Treemaps-Visualizing-Hierarchical-and-Categorical-Data-265-320.jpg)
![Gav89] William W. Gaver. The sonic nder: An interface that uses auditory icons.
International Journal of Human-Computer Interaction, 4(1):67{94, 1989.
GF78] T. R. G. Green and Mike Fitter. Can ow-charts be bettered? - the case
for structure diagrams. Memo 219, MRC Social and Applied Psychology
Unit,University of She eld, She eld S10 2TN, 1978.
GH89] R. W. Garneau and M. Holynski. The interactive adaptability of graphics dis-
plays. In G. Salvendy and M. J. Smith, editors, Designing and Using Human-
Computer Interfaces and Knowledge Based Systems, pages 321{328. Elsevier
Science, 1989.
GS90] William W. Gaver and Randall B. Smith. Auditory icons in large-scale collab-
orative environments. In Human-Computer Interaction { INTERACT, pages
735{740, 1990.
Gur86] David Bernard Guralnik, editor. Webster's New World Dictionary of the Amer-
ican Language. Prentice Hall, second college edition, 1986.
HCMM89] J. G. Hollands, T. T. Carey, M. L. Matthews, and C. A. McCann. Presenting
a graphical network: A comparison of performance using sheye and scrolling
views. In G. Salvendy and M. J. Smith, editors, Designing and Using Human-
Computer Interfaces and Knowledge Based Systems, pages 313{320. Elsevier
Science, Amsterdam, 1989.
Hel87] Martin G. Helander. Design of visual displays. In Gavriel Salvendy, editor,
Handbook of Human Factors, number 5.1 in 5. Equipment and Workplace Design,
pages 507{548. John Wiley & Sons, New York, NY, 1987.
HH90] Tyson R. Henry and Scott E. Hudson. Viewing large graphs. Technical Report
90-13, Department of Computer Science, University of Arizona, Tucson, AZ,
May 1990.
HH91] Tyson R. Henry and Scott E. Hudson. Interactive graph layout. In Proceedings of
the ACM SIGGRAPH Symposium on User Interface Software and Technology,
pages 55{64, 1991.
HH92] Tyson R. Henry and Scott E. Hudson. End user controlled interfaces: Creating
multiple view interfaces for data-rich applications. Technical Report TR 92-04,
Department of Computer Science, University of Arizona, Tucson, AZ, 1992.
HK81] J.A. Hartigan and B. Kleiner. Mosaics for contingency tables. In The Com-
puter Science and Statistics 13th Symposium on the Interface, pages 268{273.
Springer-Verlag, 1981.
246](https://image.slidesharecdn.com/1993brianjohnsondissertation-1311918672257-phpapp02-110729005208-phpapp02/85/Treemaps-Visualizing-Hierarchical-and-Categorical-Data-266-320.jpg)
![HK84] J.A. Hartigan and Beat Kleiner. A mosaic of televison ratings. The American
Statistician, 38(1):32{35, February 1984.
Hoa90] Ellen D. Hoadley. Investigating the e ects of color. Communications of the
ACM, 33(2):120{139, February 1990.
Hod70] A. G. Hodgkiss. Maps for Books and Theses. Pica Press, New York, 1970.
JMWU91] Robin Je ries, James R. Miller, Cathleen Wharton, and Kathy M. Uyeda. User
interface evaluation in the real world: A comparison of four techniques. In
Proceedings of the ACM Conference on Human Factors in Computing Systems,
pages 119{124, 1991.
Joh92] Brian Johnson. Treeviz: Treemap visualization of hierarchically structured infor-
mation. In Proceedings of the ACM Conference on Human Factors in Computing
Systems, pages 369{370, 1992.
Jon89] Dylan Jones. The sonic interface. In Work with Computers: Organizational,
Management, Stress and Health Aspects. Elsevier Science, 1989.
JS91] Brian Johnson and Ben Shneiderman. Tree-maps: A space- lling approach to
the visualization of hierarchical information structures. In Proceedings of the
IEEE Conference on Visualization, pages 284{291, October 1991.
Kam88] Tomihisa Kamada. On Visualization of Abstract Objects and Relations. PhD
thesis, University of Tokyo, Department of Information Science, 7-3-1 Hongo,
Bunkyo-ku, Tokyo, 113 JAPAN, December 1988.
Kau92] Karlis Kaugars. Bass and cat: Two sheye views of trees. Technical Report
NMSU-TR-92-CS-06, Department of Computer Science,New Mexico State Uni-
versity, Las Cruces, NM, March 1992.
KK87] Seiji Kitakaze and Yutaka Kasahara. Designing optimum CRT text blinking for
video image presentation. In Proceedings of ACM CHI+GI'87 Conference on
Human Factors in Computing Systems and Graphics Interface, pages 1{6, 1987.
Knu73] D. Knuth. Fundamental Algorithms, Volume 1 of the Art of Computer Program-
ming. Addison-Wesley, Reading, Massachusetts, 2nd edition, 1973.
KS90] Anthony Karrer and Walt Scacchi. Requirements for an extensible object-
oriented tree/graph editor. In Proceedings of the ACM SIGGRAPH Symposium
on User Interface Software and Technology, pages 84{90, 1990.
Kuh90] Werner Kuhn. Editing spatial relations. In Prooceedings of the 4th International
Symposium on Spatial Data Handling, pages 323{432, 1990.
247](https://image.slidesharecdn.com/1993brianjohnsondissertation-1311918672257-phpapp02-110729005208-phpapp02/85/Treemaps-Visualizing-Hierarchical-and-Categorical-Data-267-320.jpg)
![Lan88] Thomas K. Landauer. Research methods in human-computer interaction. In
Handbook of Human-Computer Interaction, chapter 42, pages 905{928. Elsevier
Science, Amsterdam, 1988.
Les89] Michael Lesk. What to do when there's too much information. In Proceedings
of the ACM Conference on Hypertext, pages 305{318, 1989.
Leu89] Y. K. Leung. Human-computer interface techniques for map based diagrams. In
G. Salvendy and M. J. Smith, editors, Designing and Using Human-Computer
Interfaces and Knowledge Based Systems, pages 361{368. Elsevier Science, Am-
sterdam, 1989.
Liv92] Lori A. Livingston. Vigilance in a long-term cognitive computing task: The
e ects of subject strategy and screen colour on performance. In I. Tomek, editor,
Proceedings of the International Conference on Computer Assisted Learning,
pages 405{416. Springer-Verlag, 1992.
Lm91] Patrick Lai and Udi manber. Flying through hypertext. Technical Report TR
91-10, Department of Computer Science, University of Arizona, Tucson, AZ,
April 1991.
Loh91] Jerry Lohse. A cognitive model for the perception and understanding of graphs.
In Proceedings of the ACM Conference on Human Factors in Computing Sys-
tems, pages 137{143, 1991.
LR90] M. Langen and G. Rau. A development environment for the design of multi-
modal, colourgraphic human-computer interfaces. In Human-Computer Inter-
action { INTERACT, pages 1021{1024, 1990.
LS90] Mary J. LaLomia and Joseph B. Sidowski. Measurements of computer satis-
faction. International Journal of Human-Computer Interaction, 2(3):231{253,
1990.
Mac88] Jock Mackinlay. Applying a theory of graphical presentation to the graphic
design of user interfaces. In Proceedings of the ACM SIGGRAPH Symposium
on User Interface Software, pages 179{189, 1988.
Mac90] Lindsay W. MacDonald. Using colour e ectively in displays for computer-human
interface. DISPLAYS, pages 129{142, July 1990.
Mal81] Thomas W. Malone. What makes computer games fun? BYTE, page 258,
December 1981.
Mei88] Barbara J. Meier. Ace: A color expert system for user interface design. In
Proceedings of the ACM SIGGRAPH Symposium on User Interface Software,
pages 117{128, 1988.
248](https://image.slidesharecdn.com/1993brianjohnsondissertation-1311918672257-phpapp02-110729005208-phpapp02/85/Treemaps-Visualizing-Hierarchical-and-Categorical-Data-268-320.jpg)
![MHK89] H. Matoba, F. Hirabayshi, and Y. Kasahara. Issues in auditory interfaces man-
agement: An extra channel for computer applications. In M. J. Smith and
G. Salvendy, editors, Working with Computers: Organizational, management,
Stress and health Aspects, pages 429{435. Elsevier Science, Amsterdam, 1989.
MMN88] James E. McDonald, Mark E. Molander, and Ronald W. Noel. Color-coding
categories in menus. In Proceedings of the ACM Conference on Human Factors
in Computing Systems, pages 101{106, 1988.
Moe90] Sven Moen. Drawing dynamic trees. IEEE Software, pages 21{28, July 1990.
MRC91] Jock D. Mackinlay, George G. Robertson, and Stuart K. Card. The perspec-
tive wall: Detail and context smoothly integrated. In Proceedings of the ACM
Conference on Human Factors in Computing Systems, pages 173{177, 1991.
MRH91] Eli B. Messinger, Lawerence A. Rowe, and Robert R. Henry. A divide-and-
conquer algorithm for the automatic layout of large directed graphs. IEEE
Transactions on Systems, Man, and Cybernetics, 21(1):1{12, January 1991.
ND] David Owen (Ed. Donald A. Norman and Stephen W. Draper). User Centered
System Design: Answers First, Then Questions, chapter 17, pages 361{375.
Noi93] Emanuel G. Noik. Layout-independent sheye views of nested graphs. In Visual
Languages, 1993.
NS73] I. Nassi and B. Shneiderman. Flowchart techniques for structured programming.
SIGPLAN Notices, 8(8), August 1973.
Pre81] F. P. Preparata. A new approach to planar point location. SIAM Journal of
Computing, 10:473{482, 1981.
PT88] Franco P. Preparata and Roberto Tamassia. Fully dynamic techniques for point
location and transitive closure in planar structures. In Proceedings of the IEEE
Symposium on Foundations of Computer Science, pages 558{567, 1988.
RD88] Gerald M. Radack and Tejas Desai. Akrti: A system for drawing data structures.
IEEE Languages and Automation, pages 116{120, 1988.
RG93] Jun Rekimoto and Mark Green. The information cube: Using transparency in
3d information visualization. Extended Abstract, 1993.
Ric91] John F. Rice. Ten rules for color coding. Information Display, 7(3):12{14, March
1991.
Rit91] Ken Ritchie. A general method for visualizing abstract structures. In IEEE
Transactions on Systems, Man, and Cybernetics, 1991.
249](https://image.slidesharecdn.com/1993brianjohnsondissertation-1311918672257-phpapp02-110729005208-phpapp02/85/Treemaps-Visualizing-Hierarchical-and-Categorical-Data-269-320.jpg)
![RLS90] Peter A. Rhodes, M. Ronnier Luo, and A. R. Scrivner. Colour model integration
and visualization. In Human-Computer Interaction { INTERACT, pages 725{
728, 1990.
RM90] Steven F. Roth and Joe Mattis. Data characterization for intelligent graphics
presentation. In Proceedings of the ACM Conference on Human Factors in
Computing Systems, pages 193{200, 1990.
RMC91] George G. Robertson, Jock D. Mackinlay, and Stuart K. Card. Cone trees:
Animated 3d visualizations of hierarchical information. In Proceedings of the
ACM Conference on Human Factors in Computing Systems, pages 189{194,
1991.
RT81] E. M. Reingold and J. S. Tilford. Tidier drawings of trees. IEEE Transactions
on Software Engineering, 7(2):223{228, March 1981.
Sam89] Hanan J. Samet. Design and Analysis of Spatial Data Structures: Quadtrees, Oc-
trees, and other Hierarchical Methods. Addison-Wesley, Reading, Massachusetts,
1989.
SB92] Manojit Sarkar and Marc H. Brown. Graphical sheye views of graphs. In
Proceedings of the ACM Conference on Human Factors in Computing Systems,
1992.
SBG90] Stuart Smith, R. Daniel Bergon, and Georges G. Grinstein. Stereophonic and
surface sound generation for exploratory data analysis. In Proceedings of the
ACM Conference on Human Factors in Computing Systems, pages 125{132,
1990.
SH87] David Simkin and Reid Hastie. An information-processing analysis of graph
perception. Journal of the American Statistical Association, 82(398):454{464,
June 1987.
Shn80] Ben Shneiderman. Software Psychology: Human Factors in Computer and In-
formation Systems. Winthrop, Cambridge, MA, 1980.
Shn87] Ben Shneiderman. Designing the User Interface: Strategies for E ective Human-
Computer Interaction. Addison-Wesley, Reading, Massachusetts, 1987.
Shn90] Ben Shneiderman. Human values and the future of technology: A declaration
of empowerment. In ACM SIGCAS Conference: Computers and the Quality of
Life, 1990.
Shn91] Ben Shneiderman. Visual user interfaces for information exploration. In Pro-
ceedings of ASIS, July 1991.
250](https://image.slidesharecdn.com/1993brianjohnsondissertation-1311918672257-phpapp02-110729005208-phpapp02/85/Treemaps-Visualizing-Hierarchical-and-Categorical-Data-270-320.jpg)
![Shn92] Ben Shneiderman. Tree visualization with tree-maps: A 2-d space- lling ap-
proach. ACM Transaction on Graphics, 11(1):92{99, January 1992.
SM90] Kozo Sugiyama and Kazou Misue. Good graphic interfaces for good idea orga-
nizers. In INTERACT, pages 521{526, 1990.
SM91] Kozo Sugiyama and Kazuo Misue. Visualization of structural information: Au-
tomatic drawing of compound digraphs. IEEE Transactions on Systems, Man,
and Cybernetics, 21(4):876{892, July 1991.
Sor87] Robert D. Sorkin. Design of auditory and tactile displays. In Gavriel Salvendy,
editor, Handbook of Human Factors, number 5.2 in 5. Equipment and Workplace
Design, pages 549{576. John Wiley & Sons, New York, NY, 1987.
SR83] K. J. Supowit and E. M. Reingold. The complexity of drawing trees nicely. Acta
Informatica, 18(4):377{392, 1983.
ST86] Neil Sarnak and Robert E. Tarjan. Planar point location using persistent search
trees. Communications of the ACM, 29(7):669{679, July 1986.
SZB+92] Doug Schafer, Zhengping Zuo, Lyn Bartram, John Dill, Shell Dubs, Saul Green-
berg, and Mark Roseman. Comparing sheye and full-zoom techniques for
navigation of hierarchically clustered networks. Technical Report 92/491/29,
Department of Computer Science, University of Calgary, November 1992. 12
pages.
TJ92] Dave Turo and Brian Johnson. Improving the visualization of hierarchies with
treemaps: Design issues and experimentation. In Proceedings of the IEEE Con-
ference on Visualization, pages 124{131, October 1992.
Tra89] Michael Travers. A visual representation for knowledge structures. In Proceed-
ings of the ACM Conference on Hypertext, pages 147{158, 1989.
Tuf83] E. R. Tufte. The Visual Display of Quantitative Information. Graphics Press,
Cheshire, CT, 1983.
Tul88] Thomas S. Tullis. Screen design. In Handbook of Human-Computer Interaction,
chapter 18, pages 377{411. Elsevier, 1988.
Tur93] David Turo. Enhancing treemap displays via distortion and animation: Algo-
rithms and experimental evaluation. Master's thesis, University of Maryland at
College Park, October 1993.
Ull92] Je rey K. Ullman. Algorithms for multiple-target tracking. American Scientist,
80:128{141, March 1992.
251](https://image.slidesharecdn.com/1993brianjohnsondissertation-1311918672257-phpapp02-110729005208-phpapp02/85/Treemaps-Visualizing-Hierarchical-and-Categorical-Data-271-320.jpg)
![Vei88] Richard H. Veith. Visual Information Systems: The Power of Graphics and
Video. G. K. Hall & Co., Boston, MA, 1988.
VHW87] Kim J. Vicente, Brian C. Hayes, and Robert C. Williges. Assaying and isolating
individual di erences in searching a hierarchical le system. Human Factors,
29(3):349{359, 1987.
Wan85] C. Ming Wang. Applications and computing of mosaics. Computational Statis-
tics & Data Analysis 3, 1985.
Wic88] Christopher D. Wickens. Information processing, decision-making, and cogni-
tion. In Human FactorsFundamentals, chapter 2.2, pages 74{107. 1988.
WS79] C. Wetherell and A. Shannon. Tidy drawings of trees. IEEE Transactions on
Software Engineering, SE-5(9):514{520, September 1979.
WS92] Christopher Williamson and Ben Shneiderman. The dynamic home nder: Eval-
uating dynamic queries in a real-estate information exploration system. In ACM
SIGIR, 1992.
WS93] William J. Weiland and Ben Shneiderman. A graphical query interface based
on aggregation/generalization hierarchies. Info Systems, 18(4):215{232, 1993.
WWK91] Elizabeth M. Wenzel, Fredric L. Wightman, and Doris J. Kistler. Localization
with non-individualized virtual acoustic display cues. In Proceedings of the ACM
Conference on Human Factors in Computing Systems, pages 351{359, 1991.
252](https://image.slidesharecdn.com/1993brianjohnsondissertation-1311918672257-phpapp02-110729005208-phpapp02/85/Treemaps-Visualizing-Hierarchical-and-Categorical-Data-272-320.jpg)

Treemaps are a graphical method for visualizing hierarchical and categorical data sets. They partition display space based on weighted hierarchical data to simultaneously present thousands of data records and facilitate semantic information presentation. Two controlled experiments showed that treemaps significantly reduced user task completion times compared to traditional methods for exploring and analyzing large data sets.