Downloaded 36 times


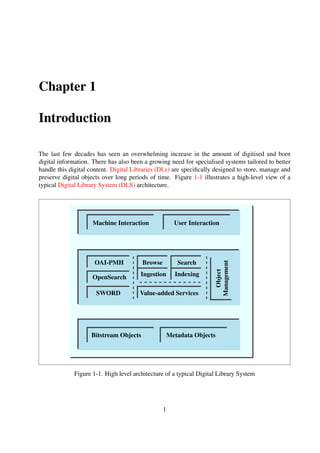

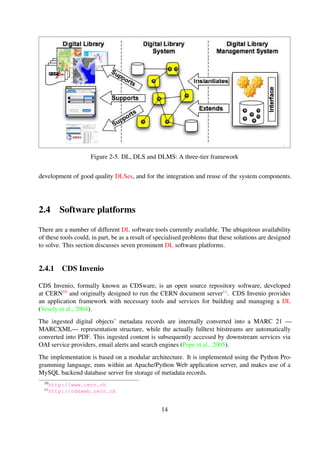


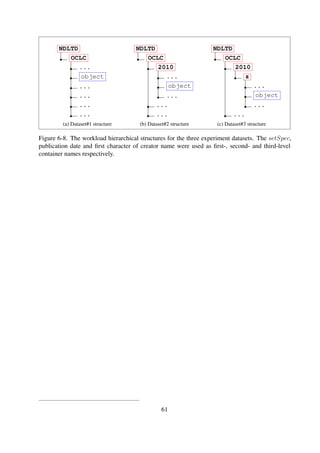
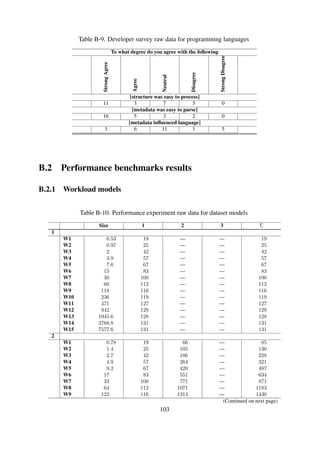
![The dataset used for the experiments is a collection of XML records, encoded using simple Dublin
Core, which were harvested from the NDLTD Union Catalog5 using the OAI-PMH 2.0 protocol.
Table 6-3 shows a summary of the dataset profile used for conducting the performance experi-
ments, and the details of the repository and sub-collection structure are shown in Listing 6-1 and
Listing 6-2 respectively.
The OAI-PMH unique setSpec element names, shown in Listing 6-2, for each of the harvested
records were used to create container structures that represent collection names for the resulting
archive.
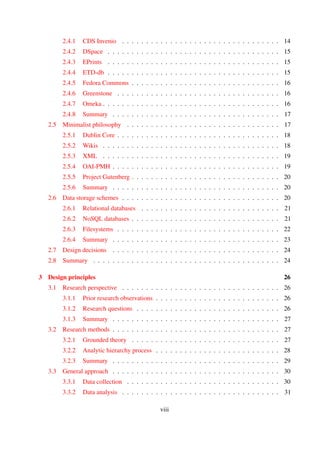
6.2.3 Workloads
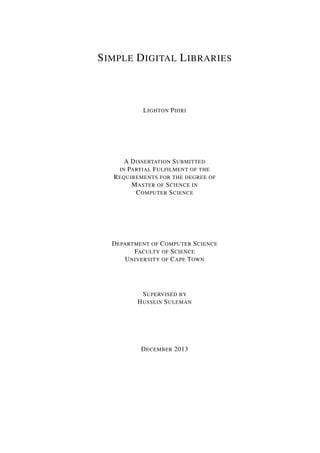
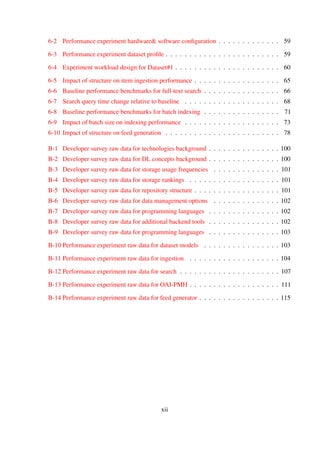
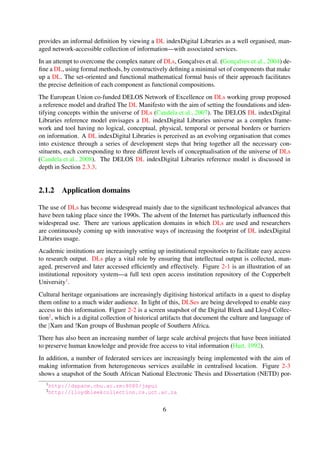
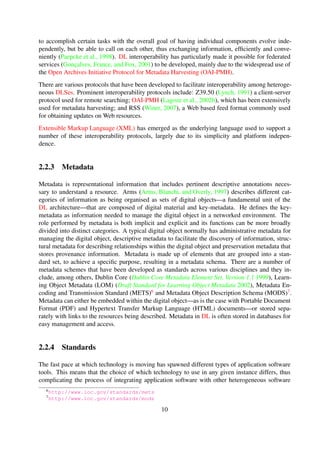
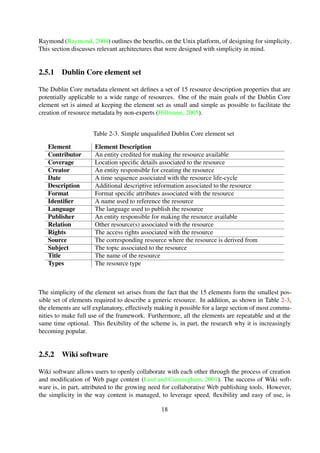
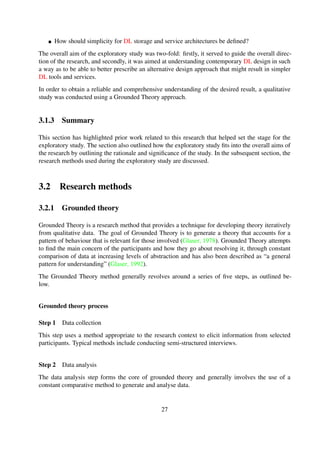
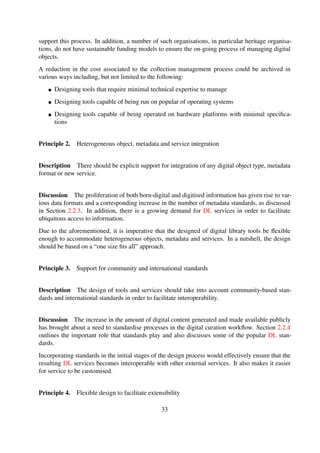
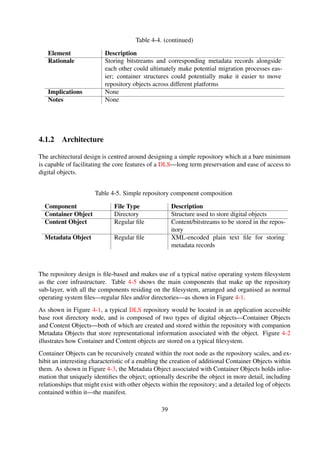
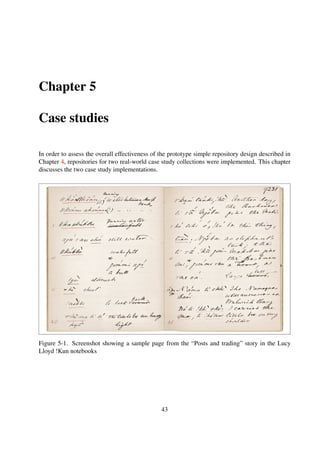
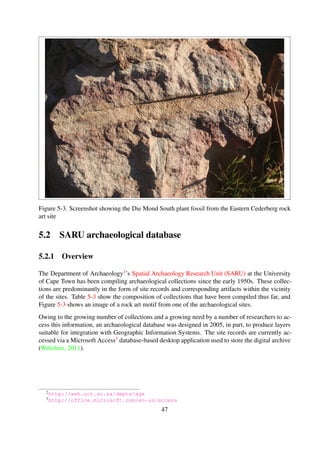
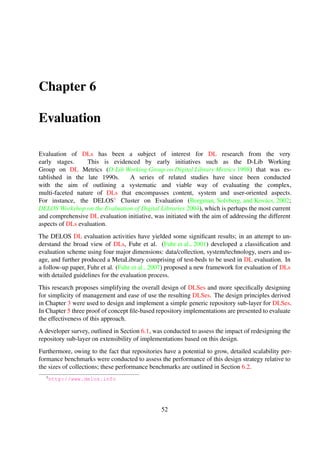
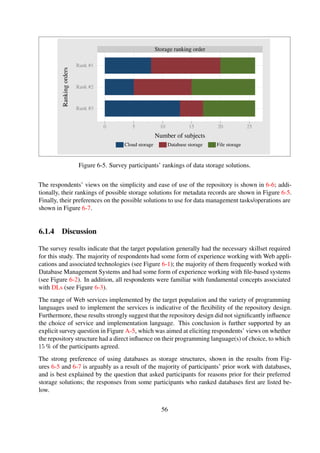
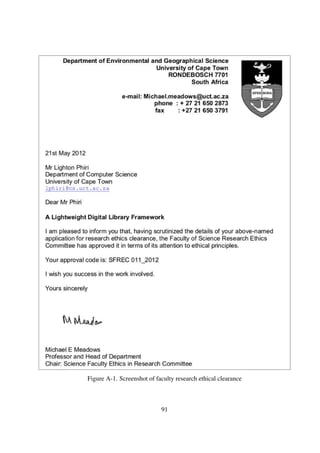
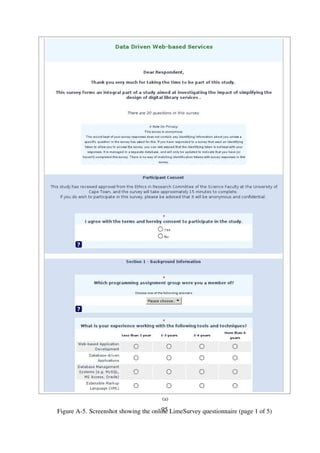
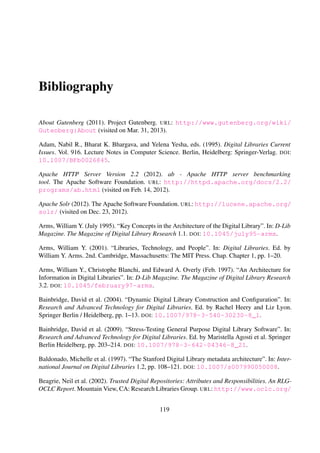
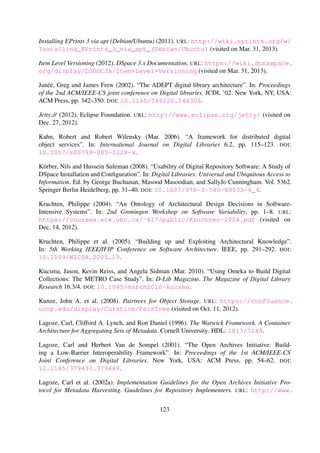
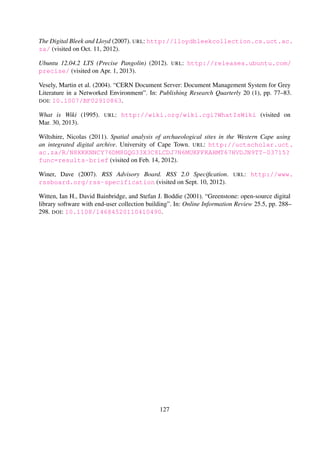
The 1907000 objects in the experiment dataset—summarised in Table 6-3—are aggregate meta-
data records from a total of 131 different institutional repositories from around the world; in ad-
dition the metadata records are encoded in Dublin Core, a metadata scheme which allows for all
elements to be both optional and repeatable. As a result, the structure of the metadata records was
not consistent throughout all the records. A random sampling technique was thus used to generate
linearly increasing workloads, with records randomly selected from the 131 setSpecs.
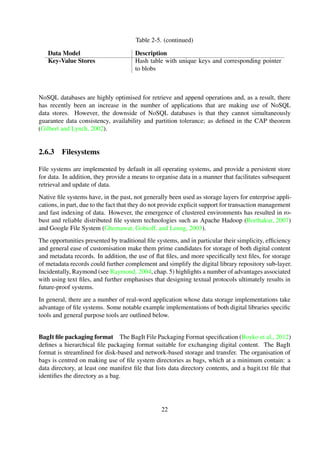
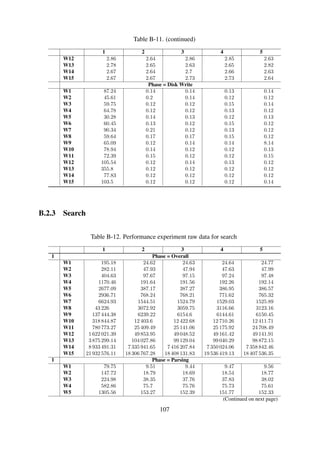
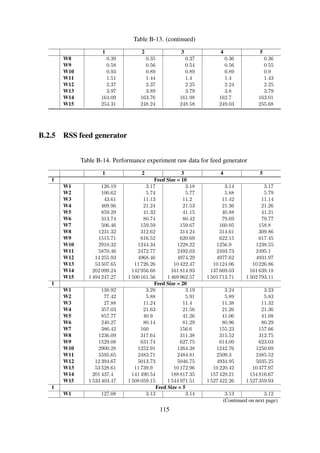
Table 6-4 shows the 15 workloads initially modelled for use during the performance experimenta-
tion stage. An additional two datasets were then spawned to create experiment datasets with vary-
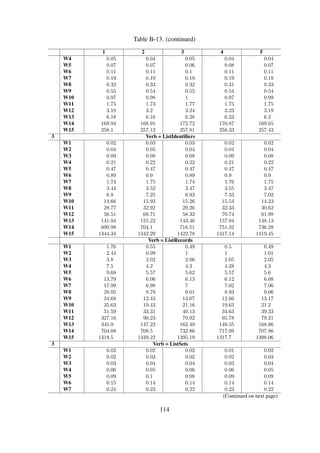
ing hierarchical structures. Table B-10 shows the profiles for the three dataset workload models,
and Figure 6-8 illustrates the object organisation in one-level, two-level and three-level workload
models.
Table 6-4. Experiment workload design for Dataset#1
W1
W2
W3
W4
W5
W6
W7
W8
W9
W10
W11
W12
W13
W14
W15
Records
100
200
400
800
1600
3200
6400
12800
25600
51200
102400
204800
409600
819200
1638400
Collections
19
25
42
57
67
83
100
112
116
119
127
129
128
131
131
Size [MB]
0.54
1.00
2.00
3.90
7.60
15.00
30.00
60.00
118.00
236.00
471.00
942.00
1945.00
3788.80
7680.00
5http://union.ndltd.org/OAI-PMH
59](https://image.slidesharecdn.com/lightonphirimscdissertation2013-140310173009-phpapp02/85/M-Sc-Dissertation-Simple-Digital-Libraries-74-320.jpg)
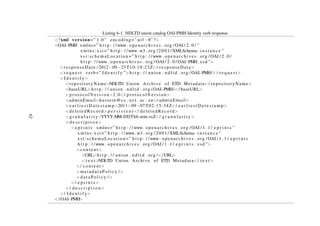
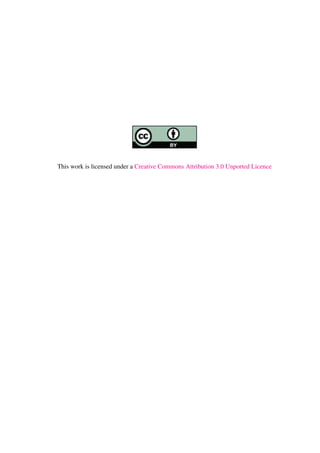
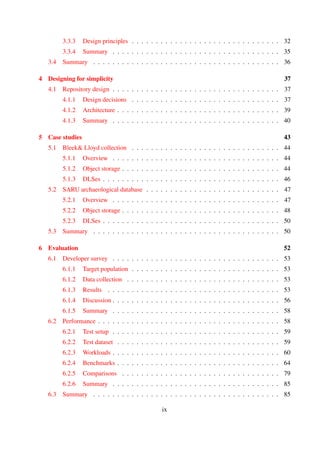
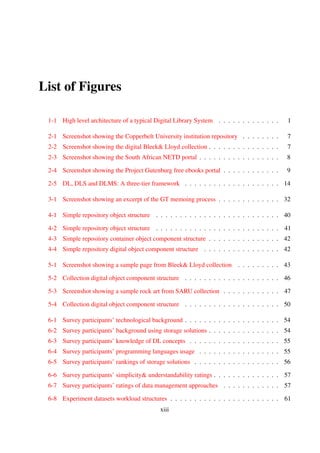
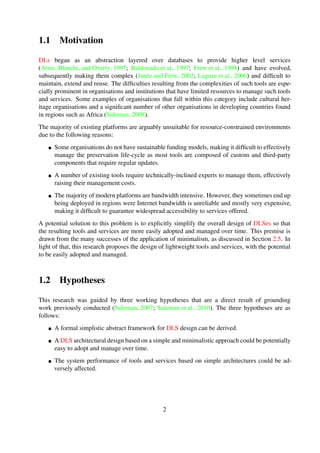
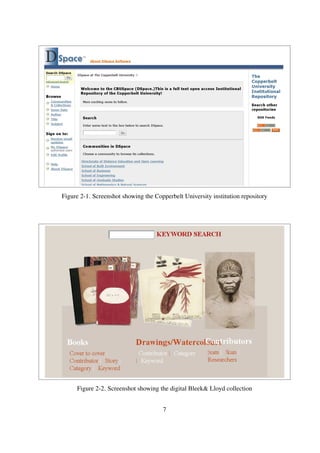
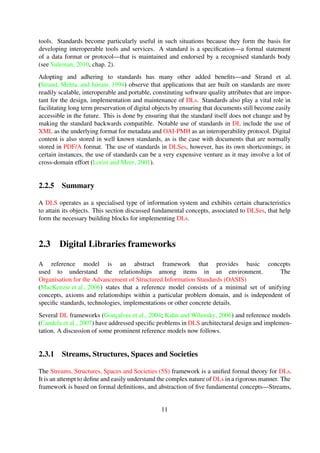
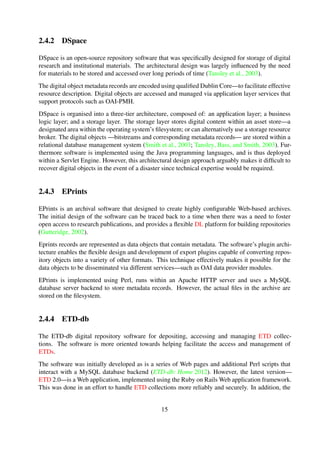
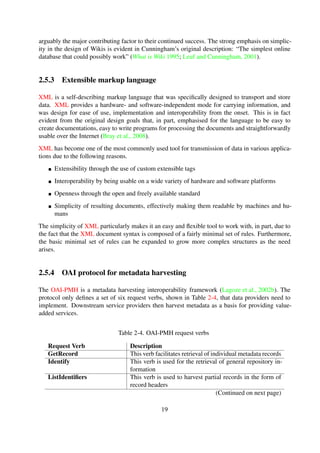
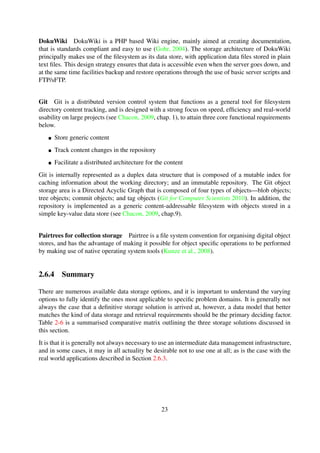
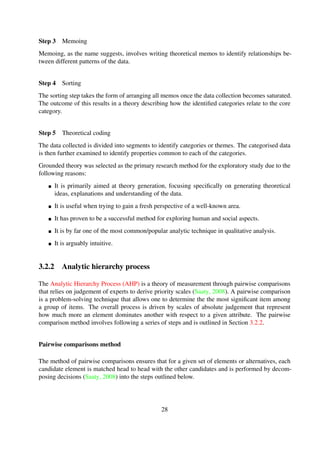
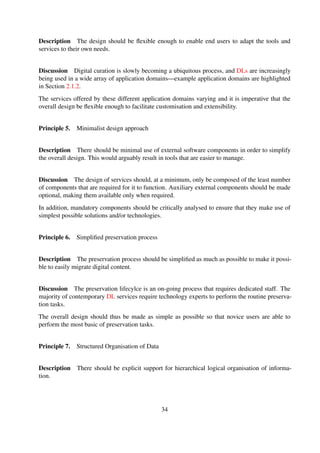
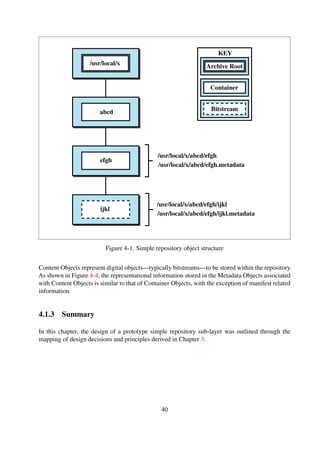
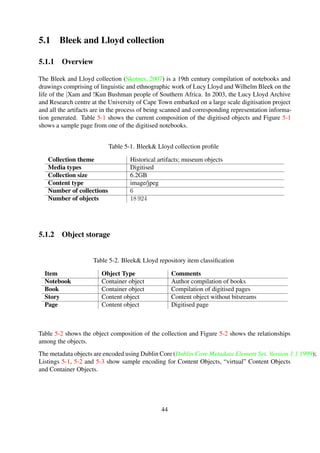
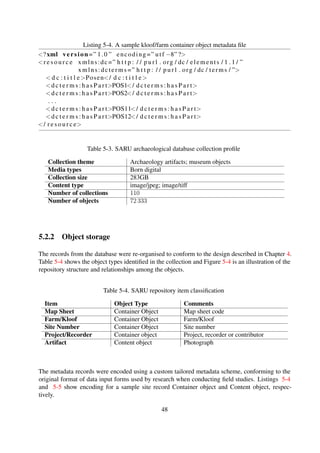
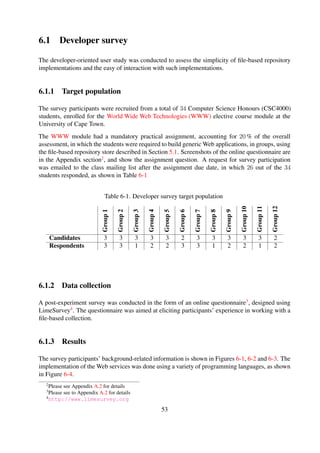
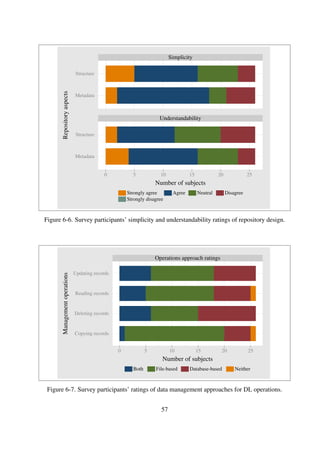
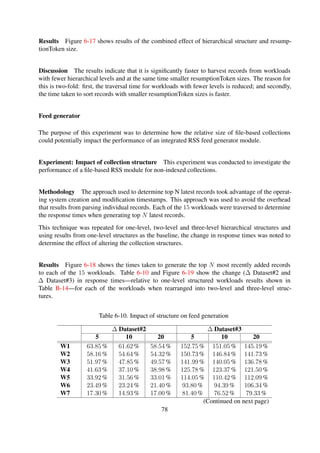
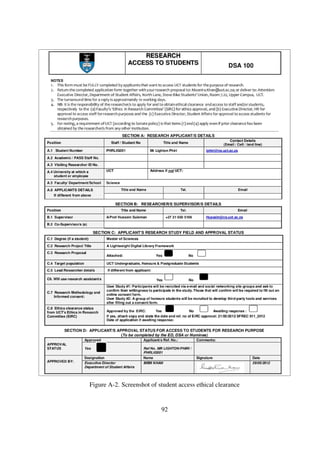
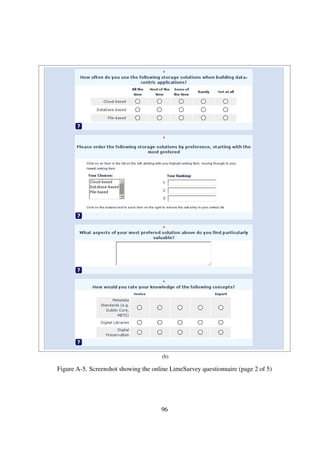
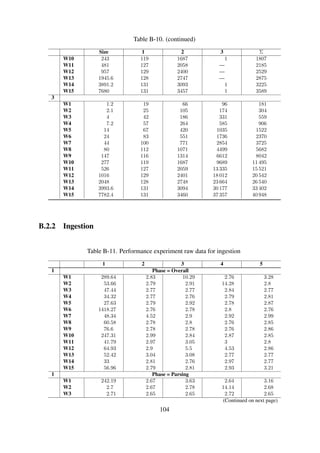
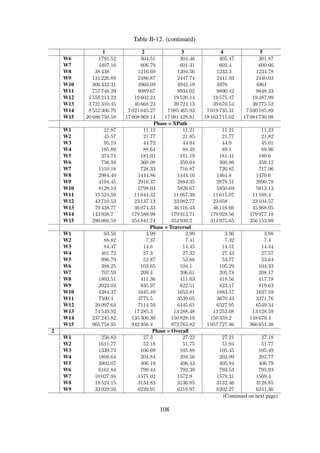
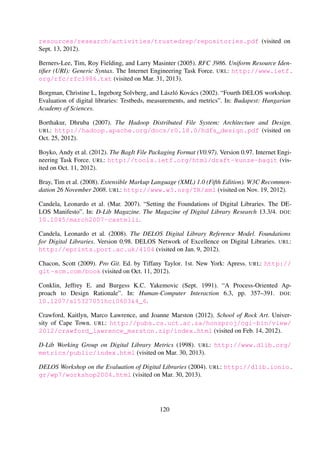
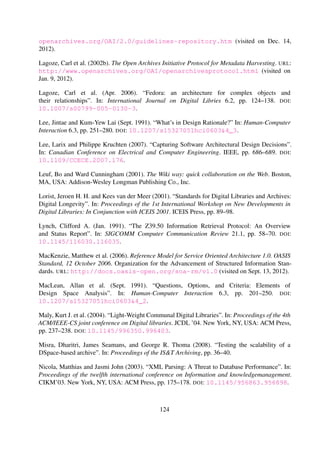
![Results The experiment results are shown in Table 6-5 and Figure 6-9.
Table 6-5. Impact of structure on item ingestion performance
Dataset #1 Dataset #2 Dataset #3Ingestion[ms]
Parsing
Diskwrite
Ingestion[ms]
Parsing
Diskwrite
Ingestion[ms]
Parsing
Diskwrite
W1 4.79 63.14 % 36.86 % 4.15 96.40 % 3.60 % 4.12 96.67 % 3.33 %
W2 5.69 97.76 % 2.24 % 5.09 97.42 % 2.58 % 4.02 96.35 % 3.65 %
W3 2.79 95.69 % 4.31 % 2.87 95.53 % 4.47 % 2.94 95.51 % 4.49 %
W4 2.78 95.67 % 4.33 % 4.08 96.78 % 3.22 % 2.84 95.65 % 4.35 %
W5 2.84 95.42 % 4.58 % 2.86 95.57 % 4.43 % 2.94 95.64 % 4.36 %
W6 2.78 95.68 % 4.32 % 2.90 95.67 % 4.33 % 2.86 95.41 % 4.59 %
W7 3.33 96.10 % 3.90 % 2.81 95.76 % 4.24 % 2.89 94.96 % 5.04 %
W8 2.80 95.59 % 4.41 % 2.80 95.63 % 4.37 % 2.86 94.65 % 5.35 %
W9 2.80 95.71 % 4.29 % 2.86 95.31 % 4.69 % 4.95 56.82 % 43.18 %
W10 2.89 95.54 % 4.46 % 2.79 95.72 % 4.28 % 2.88 95.52 % 4.48 %
W11 2.96 95.33 % 4.67 % 2.81 95.33 % 4.67 % 2.95 95.45 % 4.55 %
W12 3.95 96.26 % 3.74 % 2.96 95.40 % 4.60 % 2.87 95.62 % 4.38 %
W13 2.92 95.27 % 4.73 % 3.13 95.96 % 4.04 % 2.81 95.69 % 4.31 %
W14 2.83 95.45 % 4.55 % 2.85 95.63 % 4.37 % 2.78 95.66 % 4.34 %
W15 2.93 95.38 % 4.62 % 2.95 95.48 % 4.52 % 2.82 95.50 % 4.50 %
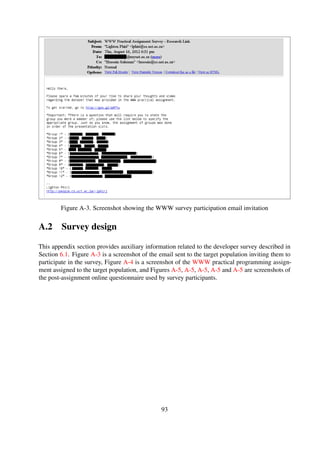
Discussion The ingestion response times remain constant irrespective of the workload size. This
is because the only overhead incurred results from disk write IO. It should be noted that this
experiment mimicked an ideal situation where the destination location for the item is known before
hand.
The workload size does not affect the ingestion response time.
Full-text search
The purpose of these experiments was to determine the impact on collection size on query perfor-
mance for indexed and non-indexed collections.
Experiment: Search performance for unindexed collections This experiment was conducted
to determine query performance of non-indexed collections.
64](https://image.slidesharecdn.com/lightonphirimscdissertation2013-140310173009-phpapp02/85/M-Sc-Dissertation-Simple-Digital-Libraries-79-320.jpg)
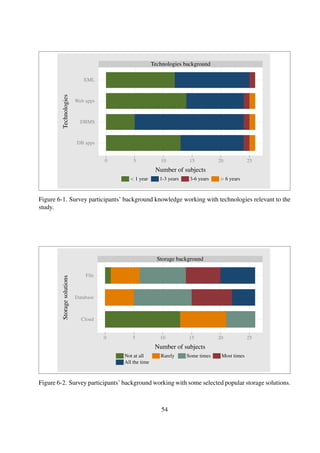
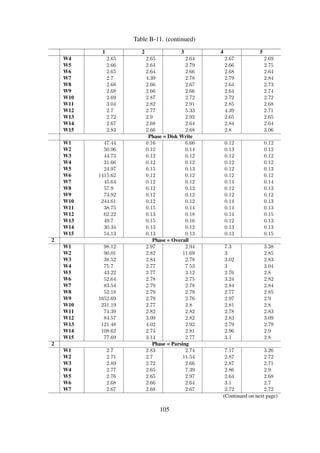
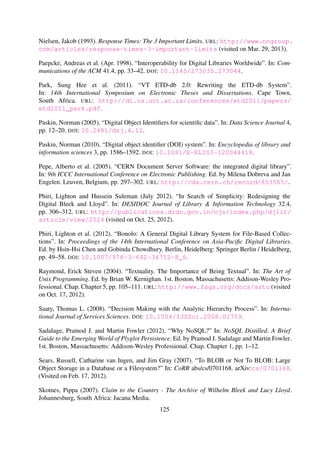
![Item ingestion
2.5
2.6
2.7
2.8
2.9
3.0
100
200
400
800
1.6k
3.2k
6.4k
12.8k
25.6k
51.2k
102.4k
204.8k
409.6k
819.2k
1638.4k
Workload size
Time[ms]
Dataset#1 Dataset#2 Dataset#3
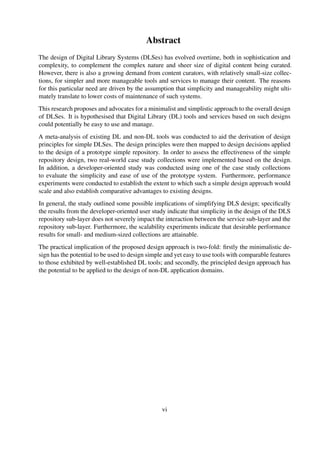
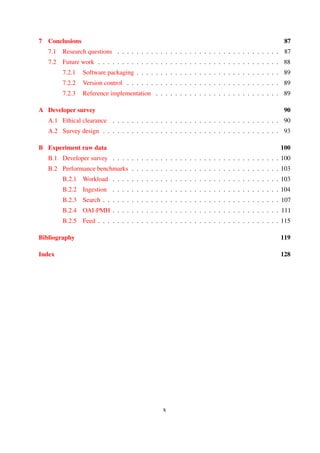
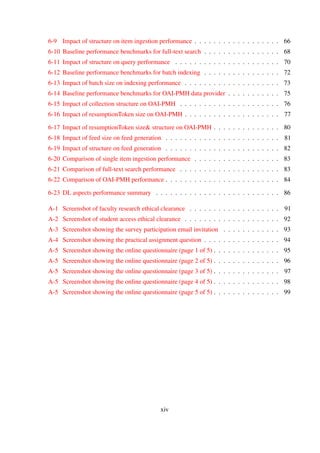
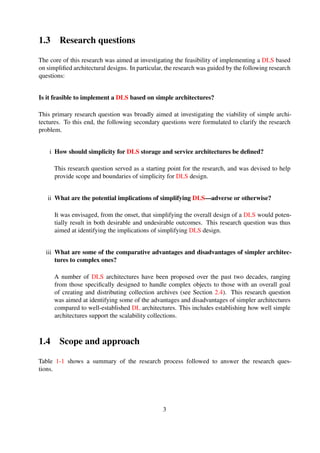
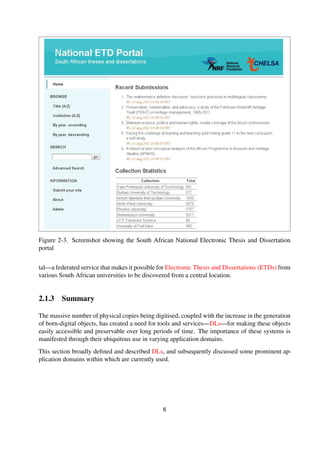
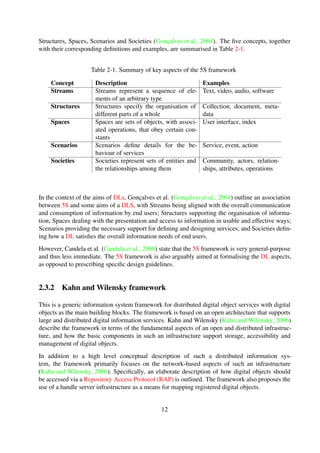
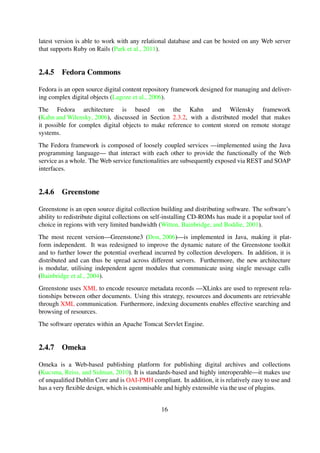
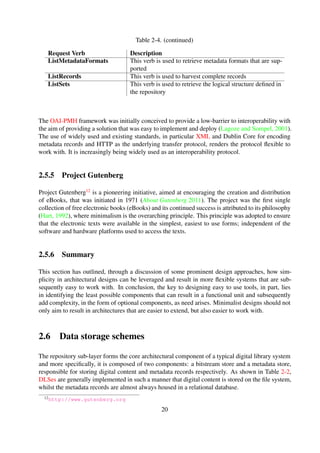
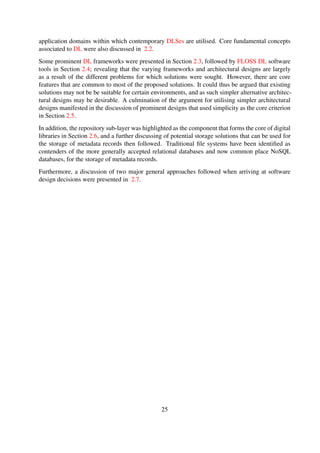
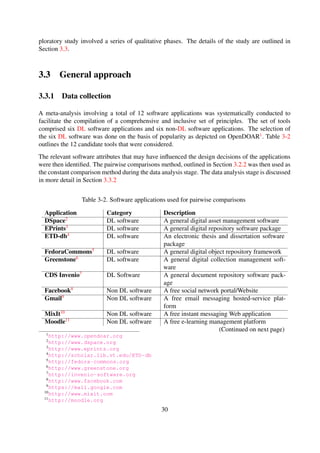
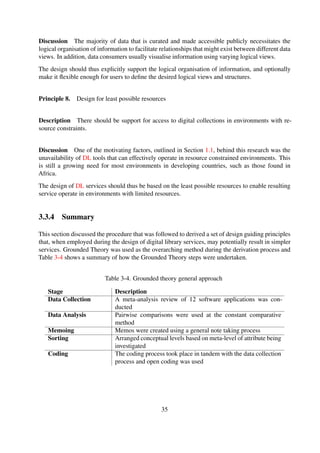
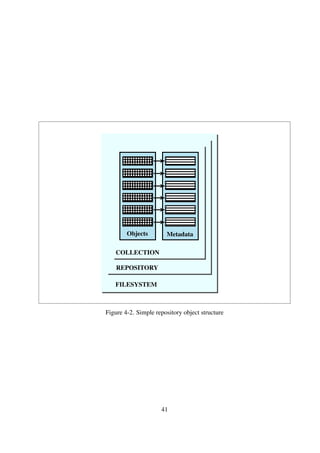
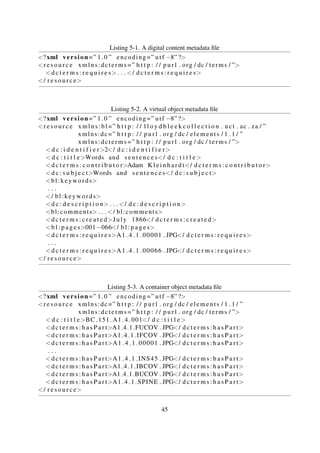
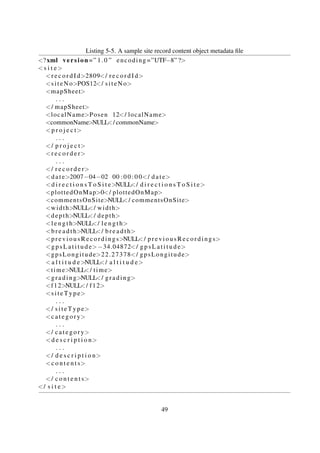
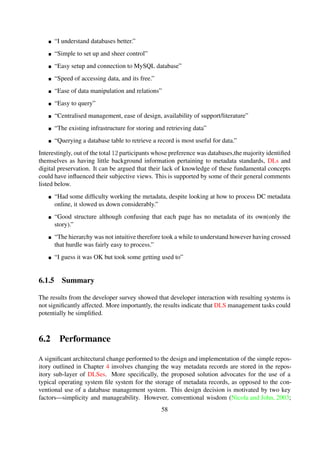
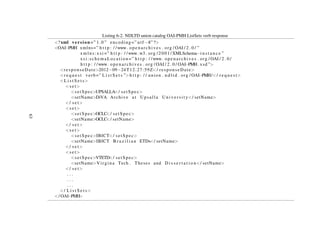
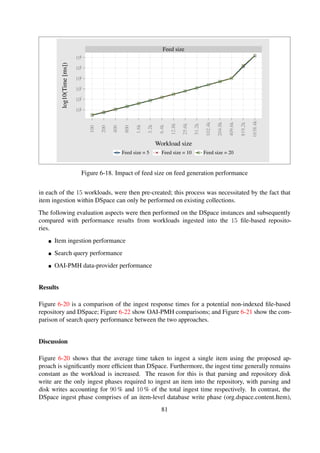
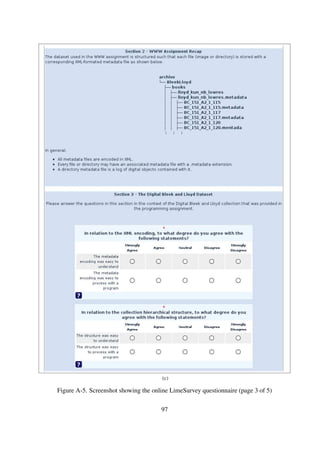
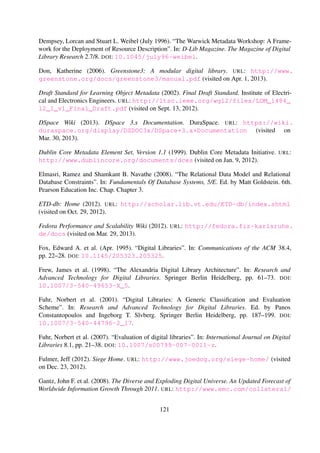
Figure 6-9. The average time, in milliseconds, taken to ingest a single item into an existing collec-
tion.
Methodology The most frequently occurring terms in the workloads were identified and search
requests issued to determine response times. The search module implementation involved travers-
ing collection containers and successively parsing and querying each metadata file in the collection
for the search phrase in question.
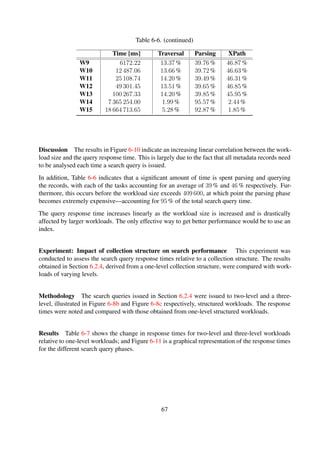
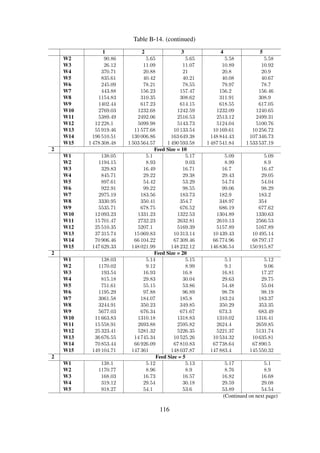
Results The mean response times taken to generate search query resultsets are shown in Fig-
ure 6-10. In order to ascertain the overall distribution of the search response times, the time taken
for the various search phases—directory traversal, parsing and XPath querying—was noted; Ta-
ble 6-6 and Figure 6-10 show these times for the 15 workloads.
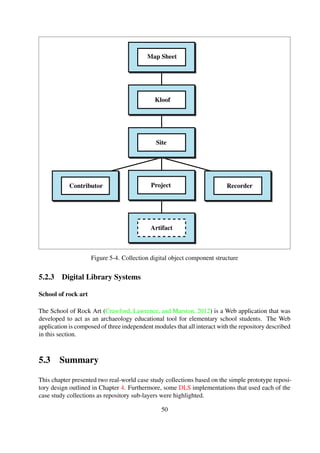
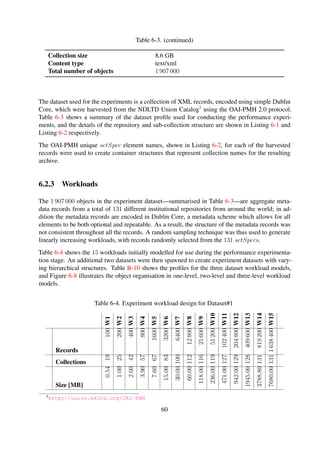
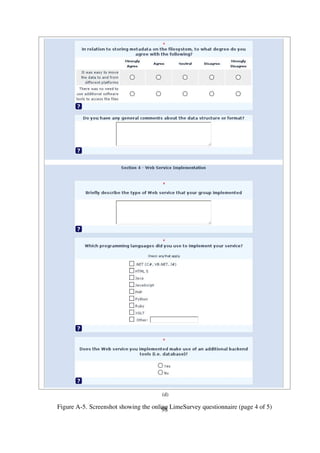
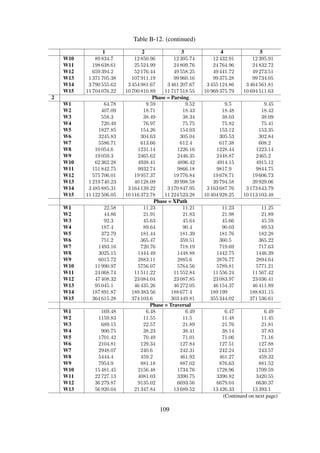
Table 6-6. Baseline performance benchmarks for full-text search
Time [ms] Traversal Parsing XPath
W1 24.67 16.13 % 38.49 % 45.38 %
W2 47.87 15.40 % 39.05 % 45.54 %
W3 97.38 14.89 % 39.01 % 46.10 %
W4 191.90 14.28 % 39.45 % 46.27 %
W5 386.99 13.82 % 39.39 % 46.79 %
W6 768.35 13.58 % 39.58 % 46.84 %
W7 1531.06 13.55 % 39.37 % 47.08 %
W8 3093.12 13.41 % 39.52 % 47.08 %
W9 6172.22 13.37 % 39.76 % 46.87 %
W10 12487.06 13.66 % 39.72 % 46.63 %
W11 25108.74 14.20 % 39.49 % 46.31 %
W12 49301.45 13.51 % 39.65 % 46.85 %
(Continued on next page)
65](https://image.slidesharecdn.com/lightonphirimscdissertation2013-140310173009-phpapp02/85/M-Sc-Dissertation-Simple-Digital-Libraries-80-320.jpg)
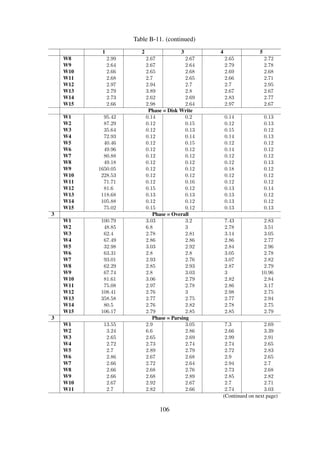
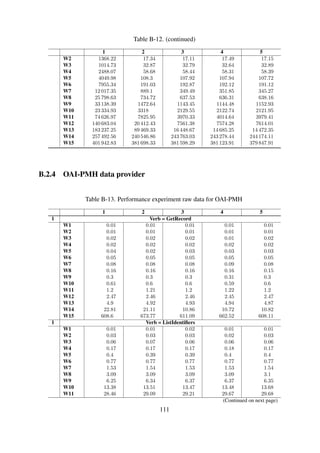
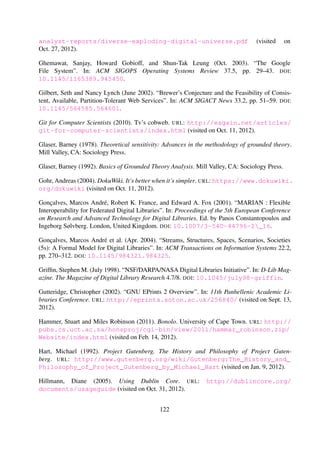
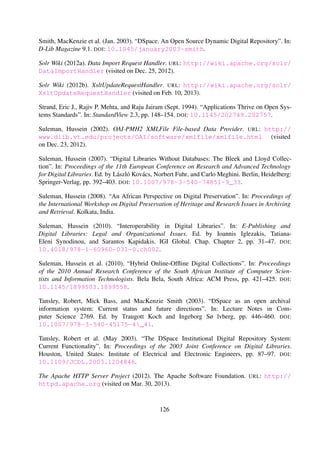
![Table 6-6. (continued)
Time [ms] Traversal Parsing XPath
W13 100267.33 14.20 % 39.85 % 45.95 %
W14 7365254.00 1.99 % 95.57 % 2.44 %
W15 18664713.65 5.28 % 92.87 % 1.85 %
Discussion The results in Figure 6-10 indicate an increasing linear correlation between the work-
load size and the query response time. This is largely due to the fact that all metadata records need
to be analysed each time a search query is issued.
In addition, Table 6-6 indicates that a significant amount of time is spent parsing and querying
the records, with each of the tasks accounting for an average of 39 % and 46 % respectively. Fur-
thermore, this occurs before the workload size exceeds 409600, at which point the parsing phase
becomes extremely expensive—accounting for 95 % of the total search query time.
The query response time increases linearly as the workload size is increased and is drastically
affected by larger workloads. The only effective way to get better performance would be to use an
index.
Experiment: Impact of collection structure on search performance This experiment was
conducted to assess the search query response times relative to a collection structure. The results
obtained in Section 6.2.4, derived from a one-level collection structure, were compared with work-
loads of varying levels.
Methodology The search queries issued in Section 6.2.4 were issued to two-level and a three-
level, illustrated in Figure 6-8b and Figure 6-8c respectively, structured workloads. The response
times were noted and compared with those obtained from one-level structured workloads.
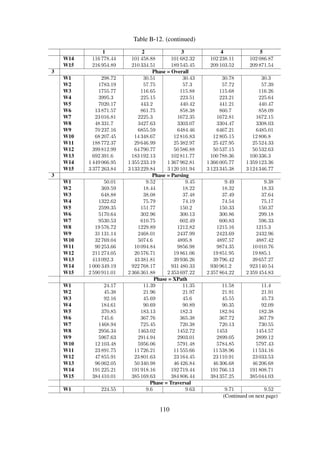
Results Table 6-7 shows the change in response times for two-level and three-level workloads
relative to one-level workloads; and Figure 6-11 is a graphical representation of the response times
for the different search query phases.
Table 6-7. Search query time change relative to baseline
∆ Dataset#2 ∆ Dataset#3
Traversal Parsing XPath Traversal Parsing XPath
W1 62.91 % 0.21 % 0.33 % 141.59 % (0.39) % 2.13 %
W2 55.90 % (0.99) % 0.45 % 134.24 % (1.98) % 0.63 %
W3 51.78 % 0.65 % 1.65 % 126.18 % (0.84) % 1.68 %
W4 39.22 % 0.38 % 1.24 % 113.29 % (1.03) % 2.49 %
W5 32.61 % 0.82 % 0.36 % 101.85 % (1.16) % 0.90 %
(Continued on next page)
66](https://image.slidesharecdn.com/lightonphirimscdissertation2013-140310173009-phpapp02/85/M-Sc-Dissertation-Simple-Digital-Libraries-81-320.jpg)
![Search (Cumulative)
102
104
106
100
200
400
800
1.6k
3.2k
6.4k
12.8k
25.6k
51.2k
102.4k
204.8k
409.6k
819.2k
1638.4k
Workload size
log10(Time[ms])
Traversal Traversal+Parsing Traversal+Parsing+XPath
Search (Distribution)
100
105
1010
1015
100
200
400
800
1.6k
3.2k
6.4k
12.8k
25.6k
51.2k
102.4k
204.8k
409.6k
819.2k
1638.4k
Workload size
log10(Time[ms])
Traversal Parsing XPath
Figure 6-10. The cumulative times taken for the different search query processing phases—
directory traversal, XML parsing and XPath query times.
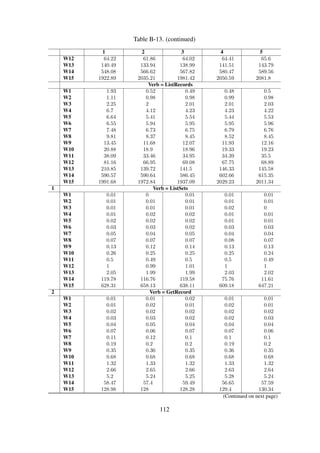
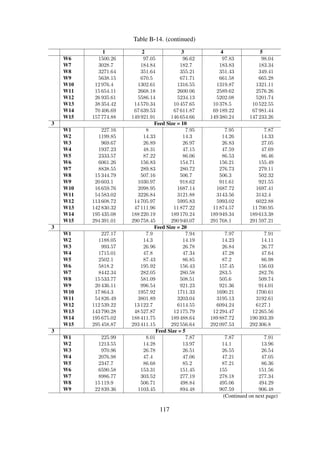
Results The batch indexing experiment results are shown in Table 6-8 and Figure 6-12.
Discussion The results strongly indicate that there is a linear relationship between the workload
size and the resulting index size, with an average ratio of 1:2. This is largely as a result of indexing
all the 15 Dublin Core repeatable fields. In addition, all the record fields were stored in the index
when conducting the experiment. In an ideal scenario, only relevant fields would have to be indexed
and stored, significantly reducing the resulting index size.
The indexing operation throughput generally increases with increasing workload, reaching a peak
value of 803 documents/second at workload W9—as shown in Figure 6-12, after which it plum-
mets. This scenario is attributed to the fact that Apache Solr indexing is, in part, dependent on the
size on the index—the index size linearly increases with workload size. Furthermore, the 2 GB
RAM on the graduate becomes inadequate as the workload increases, thus degrading the perfor-
mance.
68](https://image.slidesharecdn.com/lightonphirimscdissertation2013-140310173009-phpapp02/85/M-Sc-Dissertation-Simple-Digital-Libraries-83-320.jpg)
![Traversal
Parsing
XPath
102
104
106
102
104
106
102
104
106
100
200
400
800
1.6k
3.2k
6.4k
12.8k
25.6k
51.2k
102.4k
204.8k
409.6k
819.2k
1638.4k
100
200
400
800
1.6k
3.2k
6.4k
12.8k
25.6k
51.2k
102.4k
204.8k
409.6k
819.2k
1638.4k
100
200
400
800
1.6k
3.2k
6.4k
12.8k
25.6k
51.2k
102.4k
204.8k
409.6k
819.2k
1638.4k
Workloadsize
log10(Time [ms])
Dataset#1Dataset#2Dataset#3
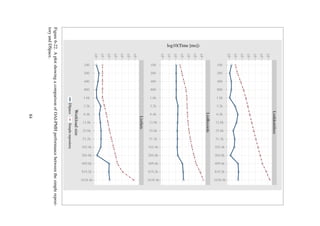
Figure6-11.Impactofdirectorystructureonqueryperformance,splitupintothedifferentsearch
phases—traversal,parsingandxpathphases.
69](https://image.slidesharecdn.com/lightonphirimscdissertation2013-140310173009-phpapp02/85/M-Sc-Dissertation-Simple-Digital-Libraries-84-320.jpg)
![Index size
100
101
102
103
104
100
200
400
800
1.6k
3.2k
6.4k
12.8k
25.6k
51.2k
102.4k
204.8k
409.6k
819.2k
1638.4k
Workload size
log10(Size[MB])
Corpus size Index size
Time
100
101
102
103
104
100
200
400
800
1.6k
3.2k
6.4k
12.8k
25.6k
51.2k
102.4k
204.8k
409.6k
819.2k
1638.4k
Workload size
log10(Time[s])
Throughput
200
400
600
800
100
200
400
800
1.6k
3.2k
6.4k
12.8k
25.6k
51.2k
102.4k
204.8k
409.6k
819.2k
1638.4k
Workload size
Throughput[doc/s]
Figure 6-12. Indexing operations performance benchmarks results showing the size of the indices
on disk, the time taken to generate the indices, and the indexing process throughput. Notice how
the throughput plummets when the workload goes beyond 25600 documents.
70](https://image.slidesharecdn.com/lightonphirimscdissertation2013-140310173009-phpapp02/85/M-Sc-Dissertation-Simple-Digital-Libraries-85-320.jpg)
![Table 6-8. Baseline performance benchmarks for batch indexing
Index [MB] Time [s] Throughput [doc/s]
W1 0.40 1.11 90
W2 0.56 1.47 136
W3 1.10 2.46 163
W4 1.90 4.14 193
W5 3.50 7.19 223
W6 6.40 13.25 242
W7 12.00 14.81 432
W8 24.00 17.89 715
W9 46.00 31.87 803
W10 91.00 204.21 251
W11 179.00 432.12 237
W12 348.00 1331.99 154
W13 962.00 2934.96 140
W14 1433.60 8134.99 101
W15 2662.40 18261.88 90
Experiment: Incremental collection indexing benchmarks This experiment was conducted
to assess the performance of the indexing process, relative to the size of the collection, when
collections are updated with new content.
Methodology A batch of 1000 latest records8 were harvested from the NDLTD portal and added
to existing workload indices using Apache Solr XSLT UpdateRequestHandler (Solr Wiki 2012b).
The number of documents added to the indices was varied between 1, 10, 100 and 1000. In addition,
the changes were only committed to the indices after all records had been added to the index.
Results Table 6-9 and Figure 6-13 show the experiment results.
Table 6-9. Impact of batch size on indexing performance
Batch size
1 10 100 1000
Indexing
Parsing
Indexing
Parsing
Indexing
Parsing
Indexing
Parsing
W1 88.78 % 11.22 % 45.96 % 54.04 % 45.04 % 54.96 % 39.44 % 60.56 %
W2 88.89 % 11.11 % 39.34 % 60.66 % 40.44 % 59.56 % 39.08 % 60.92 %
W3 90.32 % 9.68 % 40.13 % 59.87 % 42.40 % 57.60 % 40.60 % 59.40 %
(Continued on next page)
8OAI-PMH ’from’ parameter was used to harvest records not previously harvested
71](https://image.slidesharecdn.com/lightonphirimscdissertation2013-140310173009-phpapp02/85/M-Sc-Dissertation-Simple-Digital-Libraries-86-320.jpg)
![Incremental indexing
101.5
102
102.5
103
103.5
100
200
400
800
1.6k
3.2k
6.4k
12.8k
25.6k
51.2k
102.4k
204.8k
409.6k
819.2k
1638.4k
Workload size
log10(Time[ms])
Batch size=1 Batch size=10 Batch size=100 Batch size=1000
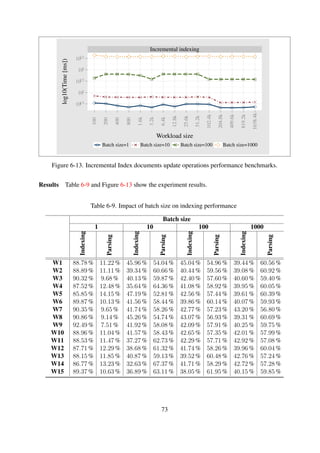
Figure 6-13. Incremental Index documents update operations performance benchmarks.
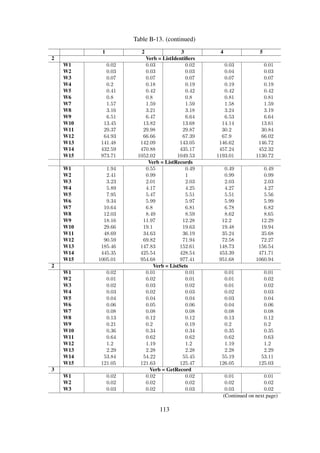
Table 6-9. (continued)
Batch size
1 10 100 1000
Indexing
Parsing
Indexing
Parsing
Indexing
Parsing
Indexing
Parsing
W4 87.52 % 12.48 % 35.64 % 64.36 % 41.08 % 58.92 % 39.95 % 60.05 %
W5 85.85 % 14.15 % 47.19 % 52.81 % 42.56 % 57.44 % 39.61 % 60.39 %
W6 89.87 % 10.13 % 41.56 % 58.44 % 39.86 % 60.14 % 40.07 % 59.93 %
W7 90.35 % 9.65 % 41.74 % 58.26 % 42.77 % 57.23 % 43.20 % 56.80 %
W8 90.86 % 9.14 % 45.26 % 54.74 % 43.07 % 56.93 % 39.31 % 60.69 %
W9 92.49 % 7.51 % 41.92 % 58.08 % 42.09 % 57.91 % 40.25 % 59.75 %
W10 88.96 % 11.04 % 41.57 % 58.43 % 42.65 % 57.35 % 42.01 % 57.99 %
W11 88.53 % 11.47 % 37.27 % 62.73 % 42.29 % 57.71 % 42.92 % 57.08 %
W12 87.71 % 12.29 % 38.68 % 61.32 % 41.74 % 58.26 % 39.96 % 60.04 %
W13 88.15 % 11.85 % 40.87 % 59.13 % 39.52 % 60.48 % 42.76 % 57.24 %
W14 86.77 % 13.23 % 32.63 % 67.37 % 41.71 % 58.29 % 42.72 % 57.28 %
W15 89.37 % 10.63 % 36.89 % 63.11 % 38.05 % 61.95 % 40.15 % 59.85 %
Discussion The conversion process of records to Apache Solr ingest format takes up a consider-
able amount of time during parsing. In addition, it is significantly faster to schedule commits for
large sets of newer records in contrast to issuing commits after addition of each record, since the
cumulative commit times for individual items in a typical batch are avoided.
72](https://image.slidesharecdn.com/lightonphirimscdissertation2013-140310173009-phpapp02/85/M-Sc-Dissertation-Simple-Digital-Libraries-87-320.jpg)
![OAI-PMH (Baseline)
10-2
10-1
100
101
102
103
100
200
400
800
1.6k
3.2k
6.4k
12.8k
25.6k
51.2k
102.4k
204.8k
409.6k
819.2k
1638.4k
Workload size
log10(Time[ms])
GetRecord ListIdentifiers ListRecords ListSets
Figure 6-14. OAI-PMH data provider baseline performance benchmarks results for all four request
verbs.
Results Figure 6-15 show results of the impact on performance of collection structure on the
OAI-PMH verbs.
Discussion The difference in response times, of ListIdentifiers and ListRecords verbs, for the
different levels only becomes apparent with relatively larger workloads. This difference is as a
result of the latency incurred during directory traversal, an operation that takes a relatively shorter
time to complete. This is further evidenced by the results from the ListSets verb (see Figure 6-15),
an operation that is significantly dependent on directory traversal.
Experiment: Impact of resumptionToken size The flow control for incomplete list responses
in Experiment 1 was handled based on the recommendations from the guidelines for repository
implementers (Lagoze et al., 2002a). This involved the use of a resumptionToken size of 1000
records. This experiment was conducted to determine the impact of varying the resumptionToken
sizes as the workload increased.
Methodology The resumptionToken sizes were varied between 10, 100 and 1000, whilst con-
ducting ListIdentifiers and ListRecords requests for the first and last list responses. Siege was
used to simulate a single user request with a total of 5 repeated runs for each request; the average
response times for each case were then recorded.
Results The results of the experiment are shown in Figure 6-16 in the form of response times for
ListRecord verb when resumptionToken size is 0 (First list recordset) and when resumptionToken
size is N (Last list recordset); with N representing the last list response.
74](https://image.slidesharecdn.com/lightonphirimscdissertation2013-140310173009-phpapp02/85/M-Sc-Dissertation-Simple-Digital-Libraries-89-320.jpg)
![GetRecord
ListIdentifiers
ListRecords
ListSets
10-2
10-1
100
101
102
103
10-2
10-1
100
101
102
103
10-2
10-1
100
101
102
103
10-2
10-1
100
101
102
103
100
200
400
800
1.6k
3.2k
6.4k
12.8k
25.6k
51.2k
102.4k
204.8k
409.6k
819.2k
1638.4k
Workload size
log10(Time[ms])
Dataset#1 Dataset#2 Dataset#3
Figure 6-15. Impact of collection structure on OAI-PMH data provider performance. Note that
with the exception of workloads with less than 1000 documents, ListIdentifiers and ListRecords
are partial incomplete-list responses for the first N=1000 records.
75](https://image.slidesharecdn.com/lightonphirimscdissertation2013-140310173009-phpapp02/85/M-Sc-Dissertation-Simple-Digital-Libraries-90-320.jpg)
![First list recordset
Last list recordset (N)
10-1
100
101
102
103
10-1
100
101
102
103
100
200
400
800
1.6k
3.2k
6.4k
12.8k
25.6k
51.2k
102.4k
204.8k
409.6k
819.2k
1638.4k
100
200
400
800
1.6k
3.2k
6.4k
12.8k
25.6k
51.2k
102.4k
204.8k
409.6k
819.2k
1638.4k
Workload size
log10(Time[ms])
Token size=10 Token size=100 Token size=1000
Figure 6-16. Impact of resumptionToken size on OAI-PMH data provider performance. The plots
show the time taken to generate archives’ first partial incomplete list set and the archives’ last list
set.
Discussion The results indicate that harvesting recordsets using a smaller resumptionToken size
is faster than otherwise. In addition, there is not a noticeable change when the resumptionToken
cursor is varied.
Experiment: Impact of resumptionToken size and structure This experiment was conducted
to assess the combined effect of a structured collection and varying resumptionToken sizes.
Methodology The collection structures shown in Figure 6-8 was used and resumptionToken sizes
varied as in the experiment described in Section 6.2.4. Siege was then used to compute response
times for generating incomplete list responses for the ListRecords OAI-PMH verb.
Results Figure 6-17 shows results of the combined effect of hierarchical structure and resump-
tionToken size.
76](https://image.slidesharecdn.com/lightonphirimscdissertation2013-140310173009-phpapp02/85/M-Sc-Dissertation-Simple-Digital-Libraries-91-320.jpg)
![First list recordset Last list recordset (N)
10-1
100
101
102
103
10-1
100
101
102
103
10-1
100
101
102
103
Tokensize=10Tokensize=100Tokensize=1000
100
200
400
800
1.6k
3.2k
6.4k
12.8k
25.6k
51.2k
102.4k
204.8k
409.6k
819.2k
1638.4k
100
200
400
800
1.6k
3.2k
6.4k
12.8k
25.6k
51.2k
102.4k
204.8k
409.6k
819.2k
1638.4k
Workload size
log10(Time[ms])
Dataset#1 Dataset#2 Dataset#3
Figure 6-17. Impact of varying resumptionToken sizes and collection structure on the OAI-PMH
Data Provider performance.
77](https://image.slidesharecdn.com/lightonphirimscdissertation2013-140310173009-phpapp02/85/M-Sc-Dissertation-Simple-Digital-Libraries-92-320.jpg)
![Feed size
101
102
103
104
105
106
100
200
400
800
1.6k
3.2k
6.4k
12.8k
25.6k
51.2k
102.4k
204.8k
409.6k
819.2k
1638.4k
Workload size
log10(Time[ms])
Feed size = 5 Feed size = 10 Feed size = 20
Figure 6-18. Impact of feed size on feed generation performance
Table 6-10. (continued)
∆ Dataset#2 ∆ Dataset#3
5 10 20 5 10 20
W12 3.69 % 4.28 % 4.14 % 55.52 % 64.81 % 57.05 %
W13 9.00 % 8.98 % 9.24 % 101.65 % 94.27 % 100.57 %
W14 (50.45) % (55.47) % (57.92) % 38.85 % 25.31 % 18.00 %
W15 (90.14) % (90.06) % (90.36) % (80.48) % (80.50) % (80.84) %
Discussion The results presented in Figure 6-18 indicate that there is not a noticeable change
in the overall performance when the collection structure is changed. This is primarily due to the
fact that the only significant factor involved during feed generation is the comparison of metadata
file timestamps—an operation which is very efficient. Another significant factor involved in the
feed generation process is directory traversal time, which remains almost constant for varying feed
sizes, since the structure remains unchanged. However, increasing the feed sizes to larger sizes
would result in some noticeable variation, since the time for comparing file timestamps would be
increased significantly.
Table 6-10 and Figure 6-19 show a noticeable change in the response times for two-level and three-
level structured workload collections, relative to one-level structured workloads. This change is as
a result of the increase in the traversal times as the hierarchies are increased.
79](https://image.slidesharecdn.com/lightonphirimscdissertation2013-140310173009-phpapp02/85/M-Sc-Dissertation-Simple-Digital-Libraries-94-320.jpg)
![Feedsize=5
Feedsize=10
Feedsize=20
101
102
103
104
105
106
101
102
103
104
105
106
101
102
103
104
105
106
100
200
400
800
1.6k
3.2k
6.4k
12.8k
25.6k
51.2k
102.4k
204.8k
409.6k
819.2k
1638.4k
100
200
400
800
1.6k
3.2k
6.4k
12.8k
25.6k
51.2k
102.4k
204.8k
409.6k
819.2k
1638.4k
100
200
400
800
1.6k
3.2k
6.4k
12.8k
25.6k
51.2k
102.4k
204.8k
409.6k
819.2k
1638.4k
Workloadsize
log10(Time [ms])
Dataset#1Dataset#2Dataset#3
Figure6-19.Impactofstructureonfeedgenerationperformance
80](https://image.slidesharecdn.com/lightonphirimscdissertation2013-140310173009-phpapp02/85/M-Sc-Dissertation-Simple-Digital-Libraries-95-320.jpg)
![Item ingestion
101
102
103
100
200
400
800
1.6k
3.2k
6.4k
12.8k
25.6k
51.2k
102.4k
204.8k
409.6k
819.2k
1638.4k
Workload size
log10(Time[ms])
DSpace Simple repository
Figure 6-20. A plot showing a comparison of ingestion performance between the simple repository
and DSpace.
Full text search
102
104
106
100
200
400
800
1.6k
3.2k
6.4k
12.8k
25.6k
51.2k
102.4k
204.8k
409.6k
819.2k
1638.4k
Workload size
log10(Time[ms])
DSpace Simple repository
Figure 6-21. A plot showing a comparison of full-text search performance between the simple
repository and DSpace.
82](https://image.slidesharecdn.com/lightonphirimscdissertation2013-140310173009-phpapp02/85/M-Sc-Dissertation-Simple-Digital-Libraries-97-320.jpg)
![ListIdentifiers
ListRecords
ListSets
100
101
102
103
104
105
106
100
101
102
103
104
105
106
100
101
102
103
104
105
106
100
200
400
800
1.6k
3.2k
6.4k
12.8k
25.6k
51.2k
102.4k
204.8k
409.6k
819.2k
1638.4k
100
200
400
800
1.6k
3.2k
6.4k
12.8k
25.6k
51.2k
102.4k
204.8k
409.6k
819.2k
1638.4k
100
200
400
800
1.6k
3.2k
6.4k
12.8k
25.6k
51.2k
102.4k
204.8k
409.6k
819.2k
1638.4k
Workloadsize
log10(Time [ms])
DSpaceSimplerepository
Figure6-22.AplotshowingacomparisonofOAI-PMHperformancebetweenthesimplereposi-
toryandDSpace.
83](https://image.slidesharecdn.com/lightonphirimscdissertation2013-140310173009-phpapp02/85/M-Sc-Dissertation-Simple-Digital-Libraries-98-320.jpg)
![Index
Ingest
OAI-PMH
Feed
Search
100
102
104
106
log10(Time[ms])
100
200
400
800
1.6k
3.2k
6.4k
12.8k
25.6k
51.2k
102.4k
204.8k
409.6k
819.2k
1638.4k
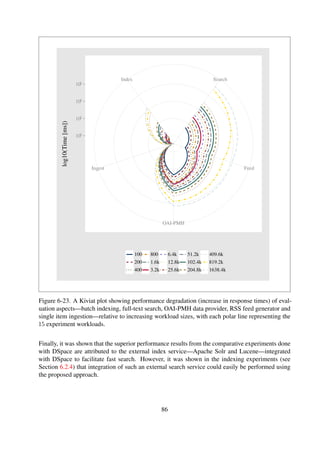
Figure 6-23. A Kiviat plot showing performance degradation (increase in response times) of eval-
uation aspects—batch indexing, full-text search, OAI-PMH data provider, RSS feed generator and
single item ingestion—relative to increasing workload sizes, with each polar line representing the
15 experiment workloads.
Section 6.2.4) that integration of such an external search service could easily be performed using
the proposed approach.
85](https://image.slidesharecdn.com/lightonphirimscdissertation2013-140310173009-phpapp02/85/M-Sc-Dissertation-Simple-Digital-Libraries-100-320.jpg)

![Appendix B
Experiment raw data
B.1 Developer Survey results
Table B-1. Developer survey raw data for technologies background
Experience working with DL tools and techniques
<1year
1-3years
3-6years
>6years
[Database Management Systems]
5 19 1 1
[Database-Driven Applications]
13 11 1 1
[Extensible Markup Language]
12 13 1 0
[Web-Based Application Development]
14 10 1 1
Table B-2. Developer survey raw data for DL concepts background
Participants knowledge of DL concepts
Novice
Expert
1 2 3 4 5
[Digital Libraries]
10 11 5 0 0
[Digital Preservation]
11 8 7 0 0
[Metadata Standards]
8 9 8 1 0
99](https://image.slidesharecdn.com/lightonphirimscdissertation2013-140310173009-phpapp02/85/M-Sc-Dissertation-Simple-Digital-Libraries-114-320.jpg)
![Table B-3. Developer survey raw data for storage usage frequencies
Storage solutions usage frequencies
Allthetime
Mosttimes
Notatall
Rarely
Sometimes
[Cloud-Based Solutions]
0 0 13 8 5
[Database-Based Solutions]
4 7 5 10
[File-Based Solutions]
6 6 1 5 8
Table B-4. Developer survey raw data for storage rankings
Storage solutions preferences
Cloud
Database
File
[Ranking 1]
8 12 6
[Ranking 2]
5 10 11
[Ranking 3]
13 4 9
Reasons for most prefered solution
Table B-5. Developer survey raw data for repository structure
To what degree do you agree with the following
StrongAgree
Agree
Neutral
Disagree
StrongDisagree
[Easy to move the data]
3 15 6 2 0
[No additional softwar required]
5 13 6 2 0
[Easy to process with program]
5 11 4 5 1
[Easy to understand]
2 10 8 6 0
[XML was easy to process]
6 13 1 5 1
[XML was easy to understand]
(Continued on next page)
100](https://image.slidesharecdn.com/lightonphirimscdissertation2013-140310173009-phpapp02/85/M-Sc-Dissertation-Simple-Digital-Libraries-115-320.jpg)
![Table B-5. (continued)
To what degree do you agree with the following
StrongAgree
Agree
Neutral
Disagree
StrongDisagree
4 12 7 3 0
Table B-6. Developer survey raw data for data management options
Solution best suited for data operations
Both
Database
FileStore
Neither
[Copying files]
1 5 19 1
[Deleting metadata records]
6 11 9 0
[Editing metadata records]
6 8 12 0
[Reading metadata records]
5 7 13 1
Table B-7. Developer survey raw data for programming languages
Programming languages used during in assignment
C#
HTML5
Java
JavaScript
PHP
Python
2 11 2 17 15 4
Table B-8. Developer survey raw data for additional backend tools
Additional backend tools used in assignment
Yes
No
11 15
101](https://image.slidesharecdn.com/lightonphirimscdissertation2013-140310173009-phpapp02/85/M-Sc-Dissertation-Simple-Digital-Libraries-116-320.jpg)
![Table B-9. Developer survey raw data for programming languages
To what degree do you agree with the following
StrongAgree
Agree
Neutral
Disagree
StrongDisagree
[structure was easy to process]
11 3 7 5 0
[metadata was easy to parse]
16 5 3 2 0
[metadata influenced language]
3 6 11 1 5
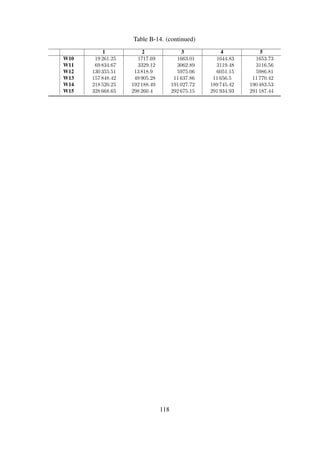
B.2 Performance benchmarks results
B.2.1 Workload models
Table B-10. Performance experiment raw data for dataset models
Size 1 2 3 Σ
1
W1 0.53 19 — — 19
W2 0.97 25 — — 25
W3 2 42 — — 42
W4 3.9 57 — — 57
W5 7.6 67 — — 67
W6 15 83 — — 83
W7 30 100 — — 100
W8 60 112 — — 112
W9 118 116 — — 116
W10 236 119 — — 119
W11 471 127 — — 127
W12 942 129 — — 129
W13 1945.6 128 — — 128
W14 3788.8 131 — — 131
W15 7577.6 131 — — 131
2
W1 0.78 19 66 — 85
W2 1.4 25 105 — 130
W3 2.7 42 186 — 228
W4 4.9 57 264 — 321
W5 9.2 67 420 — 487
W6 17 83 551 — 634
W7 33 100 771 — 871
W8 64 112 1071 — 1183
W9 123 116 1314 — 1430
(Continued on next page)
102](https://image.slidesharecdn.com/lightonphirimscdissertation2013-140310173009-phpapp02/85/M-Sc-Dissertation-Simple-Digital-Libraries-117-320.jpg)

The dissertation by Lighton Phiri proposes a minimalist approach to digital library systems (DLS) to cater to smaller collections, aiming for simplicity and manageability that could reduce maintenance costs. It includes a meta-analysis to derive design principles and evaluates a prototype simple repository through real-world case studies and performance experiments. The findings suggest that such a design can achieve desirable performance for small to medium-sized collections without severely impacting user interaction.


![Saptableref[1]](https://cdn.slidesharecdn.com/ss_thumbnails/saptableref1-120604231254-phpapp01-thumbnail.jpg?width=640&height=640&fit=bounds)