Downloaded 38 times


![1.1 Qualitative Representations: Relying on Human Perception
Learning the qualitative features of a data set is the first step towards under-
standing it. The pursuit of qualitative representations is a practical matter,
because it will be useless or impossible to consider individual quantities for
very large, continuously changing data sets. Impossible because the mind is
not capable of handling hundreds of thousands of individual quantities simul-
taneously. Or useless because only a small amount of the information will actu-
ally be useful, and time would be wasted in analyzing the unnecessary parts.
Instead, the most important part is a picture that provides the context that will
give meaning to specific quantitative values. The second chapter of this thesis
describes relevant background on previous approaches.
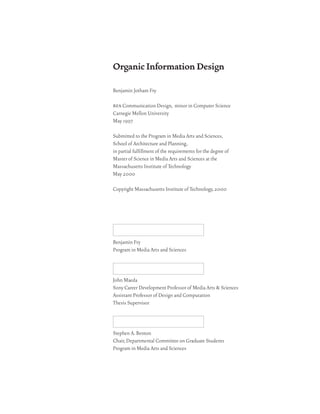
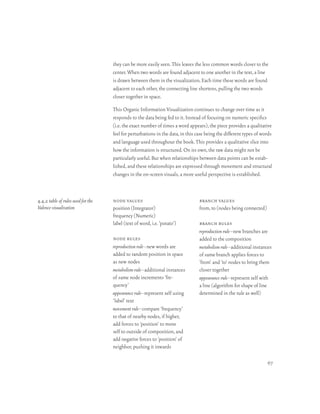
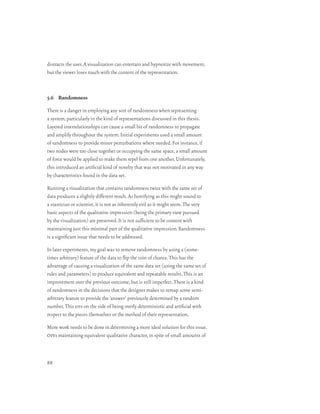
Because of the accuracy and speed with which the human visual system works,
graphic representations make it possible for large amounts of information to
be displayed in a small space. A telling example is found Bertin’s Semiology of
Graphics [Bertin, 83] and is reproduced in figure 1.1.1.
1.1.1 comparison between two modes
of representation for sociographic data.
left: quantitative version using numbers
to depict data . right: graphic version
that relies on dots of changing density
to depict relative differences
In this example, both maps describe varying sociographical data throughout
France. On the left, numbers are used to represent values, and at the right, the
numbers are depicted through changing densities in a pattern of dots. Unlike
the image with the numbers, the graphic is immediately readable and quickly
makes apparent the qualitative characteristics of the data: a dense area can be
seen in the upper-left, with other sparser regions throughout, illuminating less
significant values. By making a visual representation for the hundred or so
values that construct the map, quickly discernible relationships of the numbers
can be obtained.
14](https://image.slidesharecdn.com/thesis-0522d-100117115723-phpapp01/85/organic-information-design-14-320.jpg)
![1.2 An Approach to Depicting Complexity: Organic Systems
The third chapter of this thesis describes how properties from organic systems,
such as growth, response to stimuli, and metabolism, provide a framework for
thinking about visualizations capable of handling dynamic sources of informa-
tion. There is much to be learned from organic systems because even the
simplest organisms deal with complicated stimuli and must adapt to a chang-
ing environment. Instead of environmental conditions, organic visualizations
use data as stimuli, and their reactions are prescribed in a set of rules crafted
by an information designer.
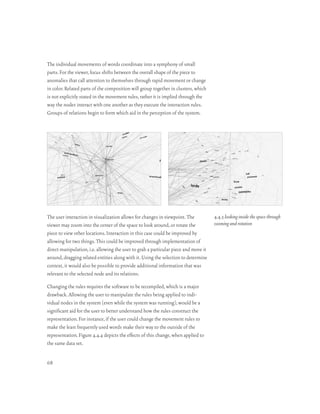
A key feature of organic systems, even synthetic ones, are the psychological
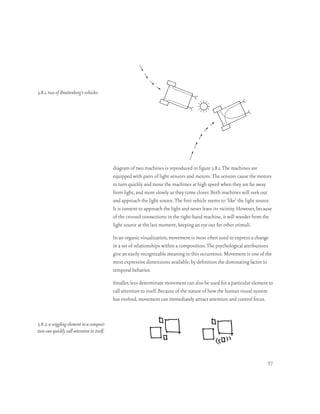
phenomena associated with their perception. In Vehicles: Experiments in Synthetic
Psychology, Valentino Braitenberg elucidates this well:
Interest arises, rather, when we look at these machines or vehicles as if they were
animals in a natural environment. We will be tempted, then, to use psychological
language to describe their behavior. And yet we know very well that there is nothing
in these vehicles that we have not put in ourselves. [Braitenberg, 84]
Braitenberg continues with a description of machines whose characteristics
seem to evoke emotions or personality traits. A machine that moves away
from an object seems to ‘dislike’ or ‘fear’ it. Another machine might move
towards a similar object with much speed, appearing ‘aggressive’. Such a system
can be extremely simple: Braitenberg’s formulas for the fearful and aggressive
machines have just one sensor and one motor. These psychological metaphors
can be an extremely powerful tool for constructing an organic visualization,
particularly with regards to how they are read by the user, and providing a
vernacular for their description.
Emergent characteristics, such as aggregation and coordination, also play an
important role in an organic visualization. Interaction rules must be con-
structed such that behavioral features emerge (i.e. causing a visual clustering
of related information). These emergent features often find psychological meta-
phors. For instance, some elements in the system may ‘like’ related elements.
Others might disassociate themselves from a grouping, appearing primitively
‘antisocial’.
15](https://image.slidesharecdn.com/thesis-0522d-100117115723-phpapp01/85/organic-information-design-15-320.jpg)
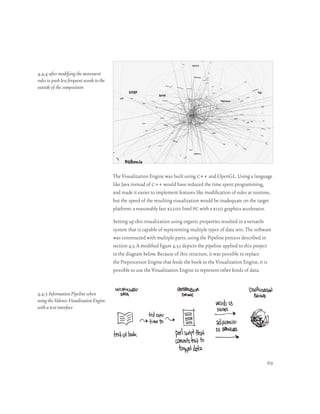
![1.3 The Organic Information Visualization as a Tool for Thought
Organic Information Design is concerned with augmenting one’s ability to pro-
cess large amounts of data. The fourth chapter of the thesis describes a set of
experiments that are examples of visualizations implemented with simulated
organic properties. They are a starting point for how people can begin thinking
about very complicated systems of relationships in a data set.
Complexity is a perceived quality that comes from the difficulty in understand-
ing or describing many layers of inter-related parts. An Organic Information
Visualization provides a means for viewers to engage in an active deconstruc-
tion of a data set. The complexity is pulled apart through a combination of real-
time user interaction as well as control of the data set through modification of
the rules used for representation.
A paper by Ben Shneidermann discusses “training and education by explora-
tion” [Shneidermann, 94] and the positive reactions users had with such sys-
tems. It states that “the enthusiasm users have for dynamic queries emanates
from the sense of control they gain over the database.” This highlights the
engaging quality of learning about a data set. The Shneidermann work is
limited, however, because each visualization must be constructed by a program-
mer, who also determines the parameters and ranges used for the data. This
problem suggests a model where the programming is simpler and accessible
to the viewer. In this model, they can become more involved in the creation of
representations with features most important to their goals.
16](https://image.slidesharecdn.com/thesis-0522d-100117115723-phpapp01/85/organic-information-design-16-320.jpg)

![2 Context and Definitions
Visualization as a sub-field of science, statistics, and graphics has only been
recognized as its own entity since the mid- to late-80s. The depth of seminal
work is in line with that of a young field, but finds its strength in background
drawn from years of statistics and graphic design.
A succinct definition of Visualization is found in [Card et al., 99]
visualization–the use of computer-supported, interactive, visual representa-
tions of data to amplify cognition.
Visualization is concerned with non-abstract data sets, for example imagery
from weather data or an animation describing the movement of a fluid. For this
kind of data, representations or physical analogues already exist.
information visualization–the use of computer-supported, interactive,
visual representations of abstract data to amplify cognition.
Information Visualization, by contrast, is concerned with making an abstract
set of information visible, usually in circumstances where no metaphor exists
in the physical world.
The previous two terms can be used as both a verb describing a process or
a noun describing an outcome. In order to avoid this ambiguity, this thesis
separates the roles by defining Organic Information Design as the process used
to create an Organic Information Visualization. The latter expands on the defini-
tion of Information Visualization in several ways:
organic information visualization–a system that employs simulated
organic properties in an interactive, visually refined environment to glean qualita-
tive facts from large bodies of quantitative data generated by dynamic information
sources.
This chapter closely examines this definition, using five sections to relate each
of the five parts of the definition to precedents in the fields of visualization,
19](https://image.slidesharecdn.com/thesis-0522d-100117115723-phpapp01/85/organic-information-design-19-320.jpg)
![2.1 Simulated Organic Systems
The predominant trait of organic systems is their decentralized, distributed
structure. The structure can be highly complex due to the interactions of their
simpler component parts. Later chapters describe how this type of complexity
can be used to create visualizations by causing data to coalesce and organize
into structures in a similar manner. Computational models such as cellular
automata are decentralized, rule-based systems that have been used for all
manner of simulation, from games demonstrating social phenomena to highly
mathematical physics to primitive models of simple organisms.
StarLogo–Decentralized, self-organizing systems were examined in Turtles, Ter-
mites, and Traffic Jams [Resnick, 94]. The text introduced StarLogo, an environ-
ment based on the Logo programming language. StarLogo’s purpose is the
simulation of massively parallel microworlds, systems made up of thousands of
actors interacting with one another and their environment. StarLogo builds
on the simplicity of the Logo programming language [Logo Foundation, 99],
enabling developers with a wide range of skill levels to experiment with such
distributed phenomena as ant colonies, traffic jams, slime molds and forest
fires. Unlike a more general purpose programming language, its tuned syntax
makes it straightforward to model the behaviors and interactions of elements in
a distributed system. Using such an environment, the user can experiment with
the parameters of these systems, observing how changes affect the outcome
of the simulation. It provides firsthand experience for how organization can
emerge from component parts without the direction of a central coordinator.
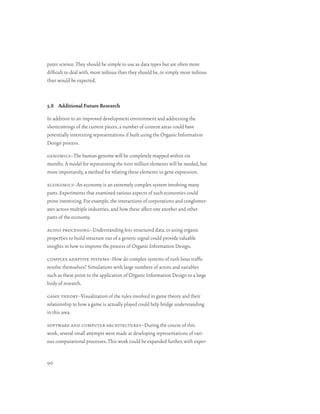
Figure 2.1.1 is an example StarLogo program, a simulation of termites collecting
wood chips and organizing them into piles. The termites act with complete
independence of one another. Each termite moves about randomly, until it
bumps into a wood chip, which it picks up and continues wandering. If it
bumps into another wood chip, it will find a nearby empty space to set down
the chip it was carrying. It then returns to wandering. Eventually, the chips will
be collected into a single pile, as if the termites had worked together to act out
this explicit goal. However, this ‘goal’ was never a part of the rules that made
21](https://image.slidesharecdn.com/thesis-0522d-100117115723-phpapp01/85/organic-information-design-21-320.jpg)
![up the program, but was instead emergent from the interaction of several entities
(the termites) acting out the simple set of instructions.
Emergence is an essential strength of decentralized systems. It means that a
meaningful whole can be developed from the interactions of many elements
acting on very simple rules.
to setup
2.1.1 termite simulation written in
setc red StarLogo, with pictures of the simula-
seth random 360
jump random 200 tion at increasing time steps
end
t=1 to go
search-for-chip ;; nd a wood chip and pick it up
nd-new-pile ;; nd another wood chip
nd-empty-spot ;; nd a place to put down wood chip
end
to search-for-chip
t=5 if pc = yellow
[stamp black
;; if nd a wood chip...
;; remove wood chip from patch
setc orange ;; turn orange while carrying chip
jump 20
stop]
wiggle
search-for-chip
end
t=25 to nd-new-pile
if pc = yellow [stop] ;; if nd a wood chip, stop
wiggle
nd-new-pile
end
to nd-empty-spot
if pc = black ;; if nd a patch without a wood chip
t=50 [stamp yellow ;; put down wood chip in patch
setc red ;; set own color back to red
get-away
stop]
seth random 360
fd 1
nd-empty-spot
end
t=100 to get-away
seth random 360
jump 20
if pc = black [stop]
get-away
end
t=350 to wiggle
fd 1
rt random 50
lt random 50
end
22](https://image.slidesharecdn.com/thesis-0522d-100117115723-phpapp01/85/organic-information-design-22-320.jpg)
![Cellular Automata–The first theories on computation with decentralized systems
trace back to John von Neumann in 1948, when he gave a lecture on the
“General and Logical Theory of Automata.” Stanislaw Ulam later worked out
these ideas and proposed that distributed systems could be modeled on a
regular grid of ‘cells’, which updated itself according to a set of rules. The rules
are local, meaning that the state of individual cells are affected only by a cell’s
immediate neighbors in the grid. During the 1950s, Arthur Burks continued to
extend von Neumann’s work and coined the term cellular automaton. [Coveney
& Highfield, 95]
In 1970, the field saw a resurgence when John Conway invented The Game of
Life, a set of rules for a cellular automaton that simulated a kind of microworld.
The simplicity of the four rules (chart 2.1.2) can be deceptive, because of the
variety and depth of configurations that can be created. The figures at the right
2.1.2 rules for Conway’s Life–in the
examples, only the center element is
affected by the rule loneliness–a cell with less
than 2 neighbors dies
overcrowding–a cell with
more than 3 neighbors dies
reproduction–an empty cell
with 3 neighbors comes to life
stasis–a cell with exactly 2
neighbors continues unchanged
23](https://image.slidesharecdn.com/thesis-0522d-100117115723-phpapp01/85/organic-information-design-23-320.jpg)
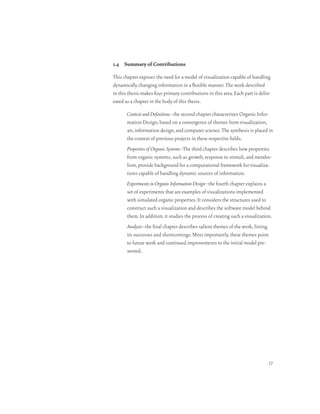
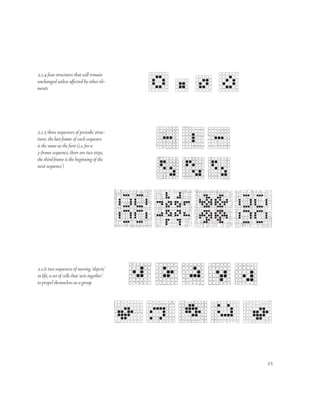
![depict examples of several possible configurations, including static, periodic
and moving objects [examples from Flake, 98]. Using Conway’s Life, it is pos-
sible to create systems that regenerate and reproduce in a primitive manner. In
addition the combination of stable, persistent structures; the ability to ‘count’
with periodic structures; and the ability to move information qualifies the
system as Turing complete, meaning that it is possible to fully simulate the
kind of computation done with today’s machines.
Another notable kind of cellular automaton is a class known as lattice gases.
These systems use a set of rules not unlike Conway’s to model complex fluid
dynamics. Using a systems such as hpp and fhp, after [Hardy et al., 76]
and [Frisch et al., 86] it is possible to accurately represent both macro and
microscopic dynamics of particles which obey the Navier-Stokes equation
[d’Humières et al., 87], the basis for most work in fluid dynamics.
2.1.3 examples of simulating fluid
dynamics using lattice gasses. at left, a
sound wave propagating through a air;
at right, the mixing of two fluids of dif-
ferent densities
The image on the left shows a simulation of a sound wave propagating in air,
built using hpp, a system which involves particles on a square lattice which
interact using a very limited set of rules. The right-hand image is a simulation
of a fluid mixing simulation using fhp-iii, a more advanced version of basic
fhp rules.
These examples show how a small number of rules can create a system that
emulates full computation, or has considerable mathematical relevance such
that a difficult equation like Navier-Stokes just ‘falls out’ through their use.
24](https://image.slidesharecdn.com/thesis-0522d-100117115723-phpapp01/85/organic-information-design-24-320.jpg)
![2.2 Interactive Environments
Interaction is an essential component of visualization, particularly for enabling
the representation of much larger structures by relying on user interaction. The
ability to show and hide elements of interest, or to zoom in to a particular
area of interest for a more detailed view are capabilities unique to interactive
interfaces. Along with number-crunching ability, interaction is the other half
of the strength in relying on the assistance of a computer for the task of
visualization. Much work has been done in creating software environments for
interactively exploring large sets of data. These software tools support a kind of
active viewing or detective work.
2.2.1 Dynamic Home-Finder
Dynamic Queries – in 1993, Shneidermann and his students at the University of
Maryland first presented work associated with a well-formed model of direct
manipulation [Shneidermann, 94]. The image on the left depicts an interface
that allows the user to search for homes based on criteria such as price, number
of bedrooms, and distance for one’s commute. Previously, when interacting
with a database, a user would choose a set of criteria, then use that as a query
to be sent to the database. Constructing this type of query requires a great deal
of expertise, making it inaccessible to all but the most advanced user. After
a delay for the query to process, the results of that query would be shown
on the screen. Dynamic queries make several improvements to this model.
26](https://image.slidesharecdn.com/thesis-0522d-100117115723-phpapp01/85/organic-information-design-26-320.jpg)
![Starfield Displays –closely related to the previous projects with dynamic queries 2.2.2 FilmFinder by Christopher
work is the FilmFinder [Ahlberg & Shneidermann, 93], a project by Christo- Ahlberg and Ben Shneidermann
pher Ahlberg, at the time a student of Shneidermann’s. It relies on a widget
called the Starfield Display, which enables applications with much larger data
sets.
Having chosen to directly discretize axes (one-for-one mapping of an axis to a
dimension of data), this piece is limited by the number of axes it can represent.
This too quickly leads to a cluttered interface that attempts to support many
axes, with both continuous (year) and discrete (genre) selections.
Each axis is linearly spaced, evidenced by an apparent need for a logarithmic
scaling on the year axis. It’s perhaps interesting to see the change of density
in number of movies over the years, but the attraction seems fading, past the
initial glance. As a result, the already cluttered interface suffers from poor use
of space.
The representation used is primitive, using small blocks of highly saturated
color for instances of data, a form fails to be evocative of the data being
presented. The lack of care seems as though it could potentially distract from
the data being represented.
It is also unclear if the application (a film finder) is particularly relevant to how
people would want to access this particular kind of data (movies). However, I
believe the author’s intent was to explain an idea, which stands on its own in
spite of the application.
28](https://image.slidesharecdn.com/thesis-0522d-100117115723-phpapp01/85/organic-information-design-28-320.jpg)
![2.2.3 Table Lens implementation
from Inxight software
Table Lens – The Table Lens, reproduced in figure 2.2.3, is a system created
by Ramana Rao and Stuart Card at Xerox PARC [Rao, 94]. It is an interface
that allows the user to view multiple dimensions of data for easy sorting and
visual correlation. A positionable lens provides the ability to locally zoom in to
particular sections of data, based focus shifts by the user.
The concept of an adjustable lense providing focus+context is extremely useful.
The general problem of zooming into a set of data is that all context is lost
because the zoom moves everything out of the viewing area except the actual
targeted area.
The shortcoming in this approach, however, is that it assumes that all of
the data is equally relevant, requiring the user to spend much time weeding
through the data set. The work of Axel Kilian, described in the next section, is
an example of a significant improvement on this model.
In addition, the reliance on a heavily quantitative view based on devices like
bar charts shows how such devices break down when applied to large volumes
of data. The strength of a bar chart is being able to compare a handful of quan-
tities against one another, and determine their relationships semi-explicitly
through the use of its numeric scale. But here it is used as a pseudo-qualitative
29](https://image.slidesharecdn.com/thesis-0522d-100117115723-phpapp01/85/organic-information-design-29-320.jpg)
![device, to show general features of the data. At best, it seems that the qualitative
feature being represented has three states: higher than most, lower than most,
or somewhere in the middle/ambiguous. An improvement would be a grouping
of related features, a sliding scale that adjusted to show logical sets. In the
example depicted, the low/medium/high distinction would only tell the user
whether the home was in the one hundred thousand, three hundred thousand,
or one million dollar range. More useful cost groupings at smaller increments
(based on typical buyer ranges) could be marked on the scale, aiding in the
process of weeding through the data.
2.2.4 space-warping with interaction
history by Axel Kilian. at left: structure
only, at right: interaction model
applied to a photographic map
Axel Kilian–Kilian’s thesis work is an in-depth study in the use of nonlinear
space [Kilian, 2000] . His studies in architecture led him to an interest in how
software unchained the designer from the spatial restrictions of the physical
environment. He explores this theme through a number of smaller pieces, each
playing with a related sub-theme of this idea.
One of his particularly successful sub-themes has to do with storing a kind of
‘focus history’, based on the interactions of one or several users with a data
set over time. The result is for multiple parts of the visual composition to
maintain some of their prevalence even when not the primary focus. And when
returning to previous focus locations, they are allowed to more quickly regain
their previous focus state. This concept of residue from interaction over time is
especially useful as he applies it to large sets of information.
30](https://image.slidesharecdn.com/thesis-0522d-100117115723-phpapp01/85/organic-information-design-30-320.jpg)
![ever, the goal is for a single person to be able to act as designer and programmer
as a combined role, but with some of the tedium of programming removed,
through the use of simpler development languages than c/c++ or Java. In
addition, with the positive aspects of the available aspects of software tools for
design, most notably the ability to iterate on a solution quickly, incorporated.
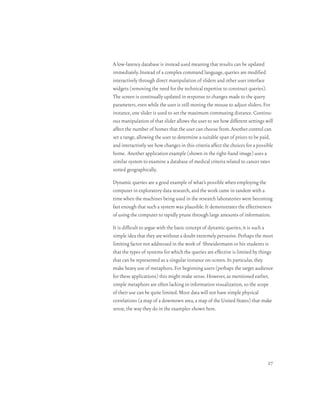
Financial Viewpoints–very elegantly designed work by designer-programmer Lisa 2.3.1 Financial Viewpoints by Lisa
Strausfeld, exploring quantitative data
Strausfeld [Strausfeld, 95] during her tenure with the Visible Language Work- in three dimensional space
shop at the Media Lab. The piece depicts a large amount of multivariate data
regarding securities markets. The project uses delicately crafted tables, bar
charts, and graphs but combines them in a unique way. Employing three spatial
dimensions, the tables and charts (implemented in two dimensional planes)
intersect one another where relations exist. To show different relations, the
planes are shifted and the tables automatically updated. It is a powerful exam-
ple of an effective synthesis of older models (charts and graphs) can be re-
synthesized in a new way, based on what is possible in software.
The limitations of this work are closely related to its strengths. By relying on
charts and graphs, this piece fails in the same way that they do, namely that
the extent of the data being represented is limited by the linear space they
are presented in, and the number of dimensions that can be expressed in the
relations shown are limited to the 3-dimensional environment.
32](https://image.slidesharecdn.com/thesis-0522d-100117115723-phpapp01/85/organic-information-design-32-320.jpg)
![mathematical integrator (see the discussion of Runge-Kutta in [Gershenfeld,
99]) could aid in smoother dynamics, perhaps with less taxing computation.
Taking care with movement is extremely important because it is capable of so
much expressive power (see discussion in section 3.8).
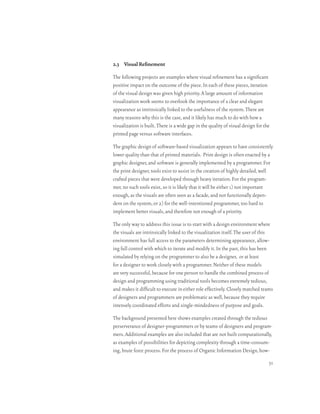
Hyperbolic Geometry–non-Euclidian geometry has been something of a trend
for information visualization for the past five years, following a handful of
published papers surrounding the subject, most notably [Lamping & Rao, 94]
from Xerox parc. Hyperbolic geometry is based on a space whose coordinates
increase exponentially, rather than linearly. Therefore it is possible to condense
a large number of nodes into a small space. The user interacts with the graph
by shifting focus between different nodes in the system. When implemented
well, it is possible for the user to maintain context as they voyage through the
space, because most elements maintain their visibility. This geometry also has
significant aesthetic appeal for many, as its warped and circular forms can be
quite elegant.
2.3.3 Site Lens Studio, a software prod-
uct based on the hyperbolic geometry
research at Xerox PARC
34](https://image.slidesharecdn.com/thesis-0522d-100117115723-phpapp01/85/organic-information-design-34-320.jpg)
![this piece. However the visual details could be improved significantly. The
arrowheads used to indicate directionality call more attention to themselves
than necessary, and the use of straight lines to reach points laid out in a
hyperbolic space make the composition considerably noisy, In fact, it would be
difficult to determine that this were in fact a three dimensional sphere if there
weren’t an outline demarcating the boundary of the space. And without the
queue to help describe the geometry being used to create the form, navigation
would seem quite difficult.
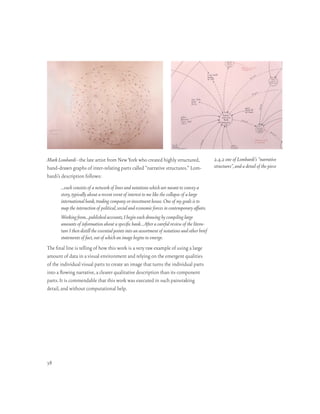
Asymptote–an architecture firm in New York, led by Hani Rashid and Lise 2.3.5 examples of diagrams by
Anne Couture with a remarkably unique approach to information design, they Asymptote, from [Wurman, 1999]
employ high-end 3D graphics software to create elaborate information graph-
ics. The attractiveness of this work is hotly debated, and the highly-stylized
structures that result are ostentatious without abandon, not just shying away
from readability, but avoiding it aggressively. Their apparent lack of seriousness
suggests that simple diagrams need not be simple or even boring, but that the
same data can be presented in an extremely striking visual that may in fact be
more memorable than the approaches to charts and diagrams that dominate
post-Tufte graphic design. This is a useful notion to at least entertain while
considering new approaches to information visualization.
36](https://image.slidesharecdn.com/thesis-0522d-100117115723-phpapp01/85/organic-information-design-36-320.jpg)
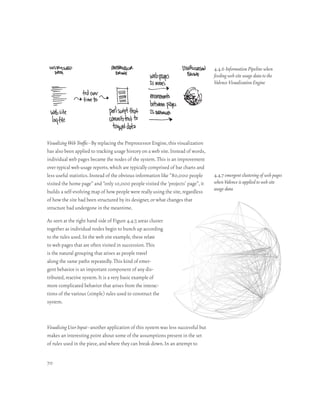
![2.5 Dynamic Information Sources
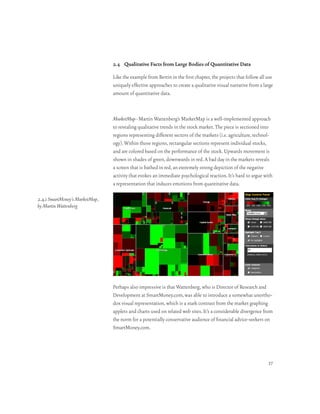
Useful examples of visualization research done with dynamic information
sources are somewhat sparse. Small examples exist, for instance Wattenberg’s
MarketMap is an example of using a live stock feed as a dynamic data source.
But a perusal of [Card et. al, 99] produces a disappointingly limited (as in, near
zero) set of papers regarding research in this area. There are examples of using a
‘current’ set of data (such as a file browser), but next to none that use a stream
of data that is fed to a visualization.
It seems that the majority of visualization work is done offline, likely for
three reasons. First, that the computational power required to synthesize large
amounts of data make it prohibitive to execute these systems in real time
in most instances. Second, that it is considerably more difficult to develop a
visualization that can handle a live stream of data instead of a canned database
or flat file. Third, the combination of these two factors creates an environment
where it is simply not worth the additional difficulty of making a visualization
dynamic. Organic Information Visualization begins with dynamic information
sources as its basis, in order to address this lacking of research in this area.
The field of information visualization was born out of the need for methods to
represent large data structures or many large numbers of data values. Examples
of large data structures include hierarchical file systems (many documents and
applications inside nested folders) or tree-shaped web sites (linkages on the
scale of thousands of pages). Perhaps the most prevalent example of many data
values is financial or economic data.
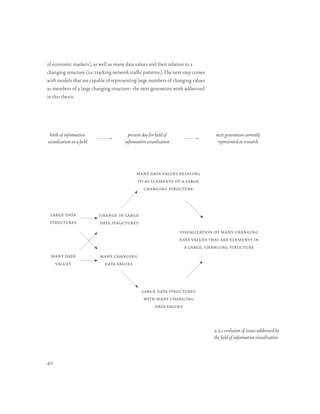
Having developed solutions for the two areas, the notion of expressing many
changing data values and change in large data structures had to be addressed.
The two areas were pursued separately, because their combination was too
complex. A common example of many changing data values is found in the
many representations of the stock market, beginning with the stock ticker
and later evolving to tools like the MarketMap. Few examples exist that cover
changing structure in data.
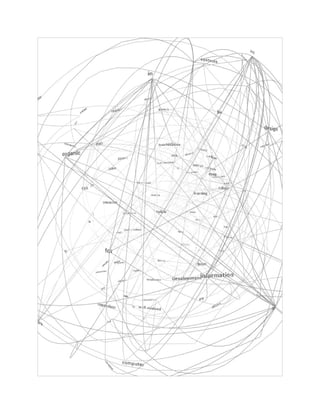
With primitive models for all four areas, a crossover is now occurring, as
depicted in figure 2.5.1. The visualization community is beginning to address
large data structures with many changing values (i.e. more advanced models
39](https://image.slidesharecdn.com/thesis-0522d-100117115723-phpapp01/85/organic-information-design-39-320.jpg)


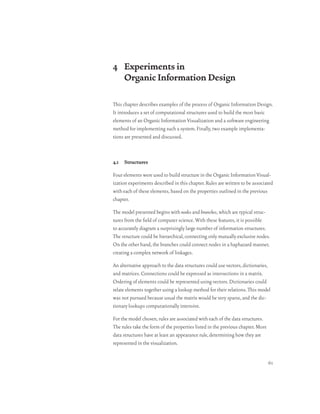
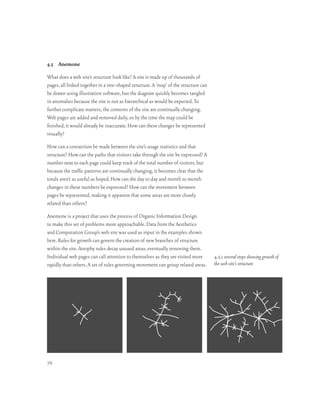
![3 Properties of Organic Systems
This chapter describes the properties of organisms, and begins a description
in broad terms of how similar systems can be implemented computationally,
when applied to information visualization. More specific details on this imple-
mentation are described in the fourth chapter, where a formalized mode of
implementation is presented along with a set of experiments.
The sections in this chapter are based in part on a definition of life taken
from [Villee et al., 89]. By learning how an organism uses these traits to cope
with its environment, one can infer how a visualization might take on similar
characteristics, as a kind of caricature organic system. The properties listed
provide a basis for the necessary components of a primitive organic system.
Each of these properties can be simulated by simple rules in a decentralized
system. Nine such properties are considered:
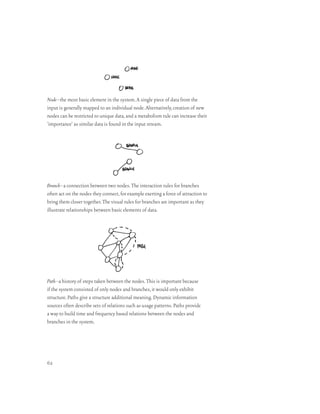
Structure–aggregation of elements to form more complex structures
Appearance–visual expression of internal state
Metabolism–synthesis of nutrients for raw materials and fuel
Growth–an increase in either scale or amount of structure
Homeostasis–the maintenance of a balanced internal state
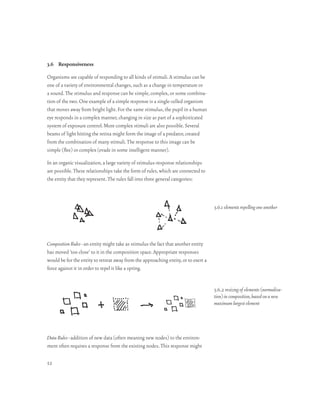
Responsiveness–reaction to stimuli and awareness of the environment
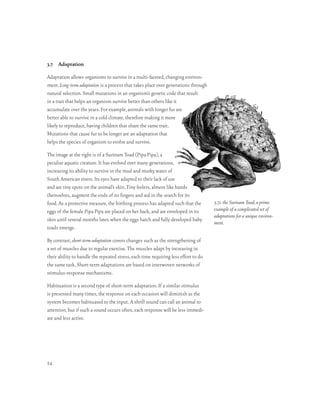
Adaptation–adjustments to survive in a changing environment
Movement–behavioral expression of internal state
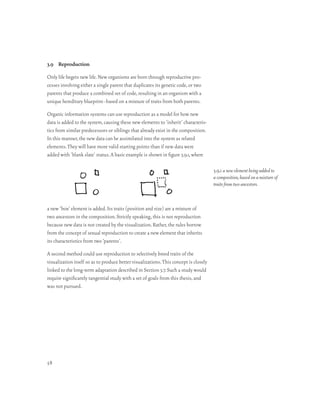
Reproduction–the ability of entities to create others like itself
Individual entities in the simulated organic system, called nodes, interact in a
visual environment based on a set of behavioral rules that are determined by
the designer of the system. These behavioral rules map meanings determined
by the designer, such as ‘importance’, to a property like appearance. Based on
43](https://image.slidesharecdn.com/thesis-0522d-100117115723-phpapp01/85/organic-information-design-43-320.jpg)
![3.3 Metabolism
Metabolism is the set of chemical reactions that take place in an organism,
relating to consumption of nutrients for raw materials and fuel. As part of
cellular synthesis, the raw materials are used for building or repairing a cell.
Through cellular respiration, nutrients for fuel are converted to energy to drive
the synthesis as well as other activities of the cell such as muscle contractions
or nerve impulses. This process is diagrammed in figure 3.3.1.
3.3.1 metabolic process in an organism,
after [Villee et al., 89]
Each reaction is regulated by enzymes, which can control how and when reac-
tions are started, the extent or vigor of the reaction, and its duration.
In a computational medium, the basic blocks of data fed to the organic visual-
ization work like nutrients fed to the system. A set of rules determine whether
these blocks of data are raw materials or fuel. Raw materials are used to build
or modify structures. Fuel manipulates the attributes of individual elements.
Additional rules can act as enzymes, determining when and to what degree the
other metabolic rules should affect the system.
48](https://image.slidesharecdn.com/thesis-0522d-100117115723-phpapp01/85/organic-information-design-48-320.jpg)
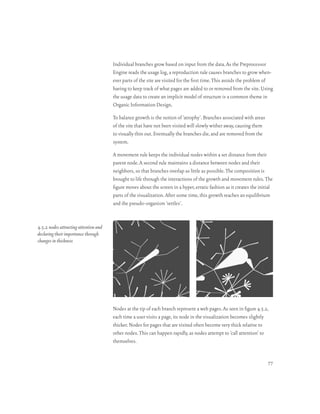
![elements to wither and die as they become no longer pertinent, without the
input data having to explicitly describe when this should happen. Growth
will create new structures to replace the old ones as necessary. The process of
atrophy is slow and non-explicit.
3.4.2 structure undergoing process of
atrophy
A balance of growth and atrophy is important because the presentation space
will always be finite. There are both physical and cognitive limitations that
affect the presentation space. It is physically limited by the resolution of the
screen (or any other chosen output device). On the other hand, an infinitely
large presentation space wouldn’t be useful because our cognitive abilities
would not be able to handle a much larger space. Instead, atrophy can be used
to limit the outer bounds of a visualization, and to weed out less useful parts
that are no longer in use.
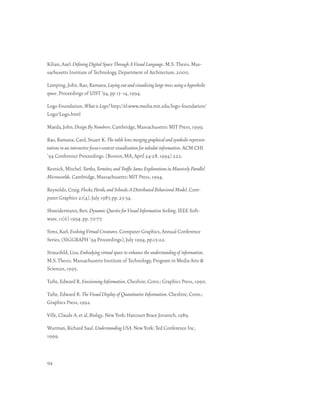
3.5 Homeostasis
Homeostasis is the collection of a set of mechanisms that maintain the bal-
anced internal state of an organism. Figure 3.5.1 depicts the regulation of body
temperature in a human through homeostasis. The description that accompa-
nies the diagram [Villee et al., 89] follows:
An increase in body temperature above the normal range stimulates special cells in
the brain to send messages to sweat glands and capillaries in the skin. Increased
circulation of blood in the skin and increased sweating are mechanisms that help
the body get rid of excess heat. When the body temperature falls below the normal
range, blood vessels in the skin constrict so that less heat is carried to the body
surface. Shivering, in which muscle contractions generate heat, may also occur.
When applied to organic visualization, homeostasis has two modes of imple-
mentation. First, rules must be constructed so that they balance themselves,
50](https://image.slidesharecdn.com/thesis-0522d-100117115723-phpapp01/85/organic-information-design-50-320.jpg)
![3.5.1 regulation of human body tem-
perature through homeostasis, after
[Villee et al., 89]
not allowing values to run out of control which might cause the system to ‘blow
up’. Second, additional rules can be added that maintain the internal balance
between the actions of the original rules. For instance, a rule can be added that
does not allow forces applied to a node to exceed a certain maximum.
51](https://image.slidesharecdn.com/thesis-0522d-100117115723-phpapp01/85/organic-information-design-51-320.jpg)
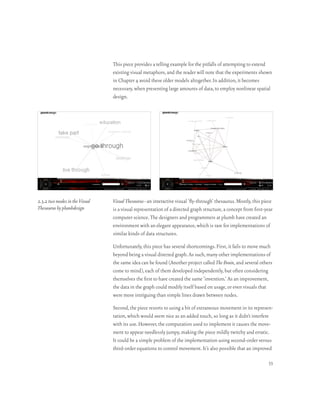
![3.7.3 from “Evolving Virtual
Creatures” by Karl Sims, an
example of simple creatures
adapted through breeding over
several generations.
decision-making and an algorithm for the parts that could be determined com-
putationally. For example, Figure 3.7.3 comes from a project called “Evolving
Virtual Creatures” from Karl Sims [Sims, 94], where he bred simple creatures
in software using adaptation, mutation and evolution. The creatures slowly
learned how to move themselves, because the mutations started a few creatures
moving, and the criteria for breeding was chosen based on ability for self-
locomotion–the fastest piece was able to reproduce and continue. The creatures
even ‘learned’ loopholes in the constraint rules set in the software that simu-
lated them–allowing them to achieve artificially high scores until these rules
were adjusted.
In general, this direction is covered by a wide body of research, most specifically
including work in genetic algorithms, and should be seen as a separate area
of study.
3.8 Movement
All living things move. Even plants have streaming motion known as cyclosis,
allowing them to bend and reconfigure. Movement is important for how an
organism is perceived–it’s the most basic test an observer uses to determine
whether it is alive.
In section 1.2 all of Braitenberg’s descriptions of psychological attributions
given to machines were related to movement. Movement is the key indicator
for what a being is ‘thinking’. It helps to describe feelings or intentionality. Of
course these attributes are not always present in the system, because machines
of this kind are not capable of having feelings or intentionality. Braitenberg’s
56](https://image.slidesharecdn.com/thesis-0522d-100117115723-phpapp01/85/organic-information-design-56-320.jpg)


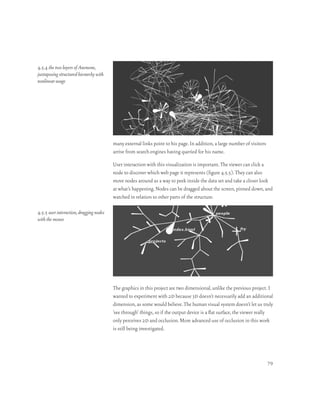
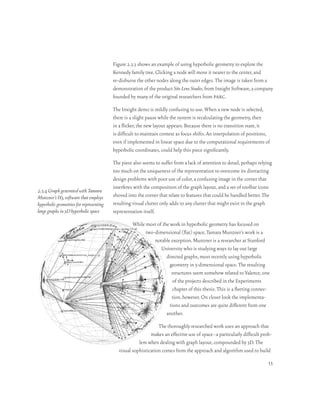
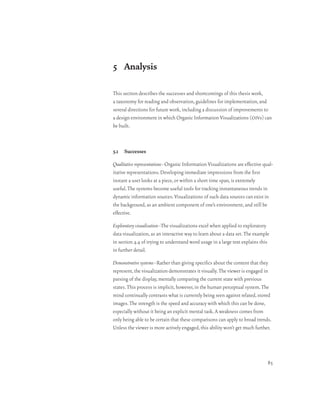
![Visualizing computation–Anemone has also been applied to the visualization of
computational processes. Figure 4.5.6 is the coding/editing environment for
Design By Numbers (dbn), a simple programming language developed by
John Maeda to teach non-programmers (artists and designers in particular)
about computation [Maeda, 99]. On the right-hand side is the editing area
where a program is entered; on the left is the imaging area, controlled by a
running dbn program. About a year ago, I completed a rewrite of the inner-
workings of dbn, which deal with how text written by the user is first parsed
and then executed by an interpreter engine. Because this process is so opaque
and rarely understood in common use, even by experienced programmers, I
decided to develop a visualization of how this process takes place.
4.5.6 example of a simple mouse-
based program running in the DBN
environment
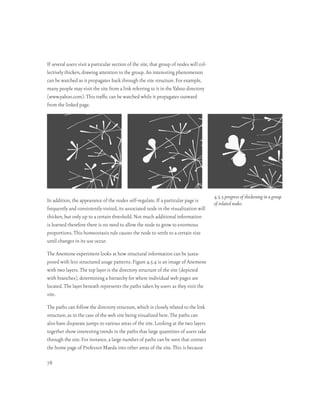
The concept of a parse tree is central to any programming language. A parser
converts the program typed by the user into a tree-shaped structure. To run the
program represented by the tree, the tree is traversed visiting the branches in a
well-defined order, starting with the root of the tree.
The top layer of branching lines is the parse tree of the program typed by the
user. After parsing this program, it is output to Anemone using a simple text-
based protocol. The branches have simple layout ‘intelligence’ and are aware
of their neighbors. This causes them to avoid overlapping one another, and
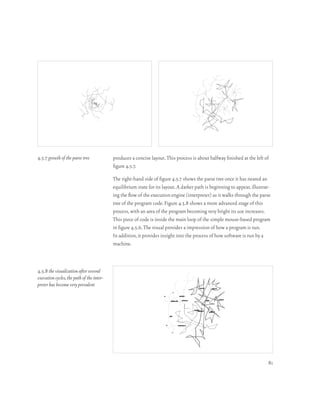
80](https://image.slidesharecdn.com/thesis-0522d-100117115723-phpapp01/85/organic-information-design-80-320.jpg)


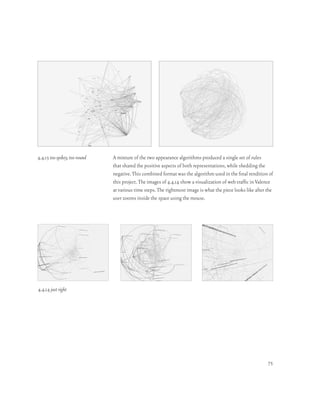
![5.2 Shortcomings
It seems that oivs are potentially less useful for quantitative analysis. While it
is possible to support a mixing of quantitative specifics into the representation
(like the example shown in section 1.2), this has not been pursued to much
depth.
Addressing highly noisy or irregular data is another issue that could use further
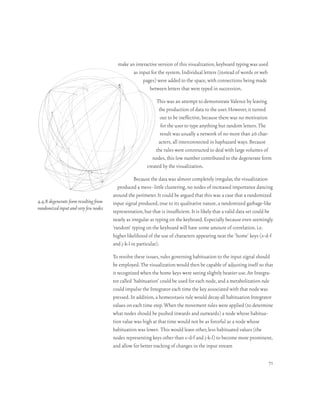
exploration and testing. The keyboard input example in section 4.4 is a simple
explanation of a broader difficulty. Finding appropriate and repeatable ways
to make oivs self-regulate to bring the useful features out of noisy data is
potentially a very difficult problem.
Information lacking structure is a related area. Consider a stream of sampled
sound data. It would require many components to construct a visualization
that would do something useful with this data as input. This is entirely pos-
sible under the model of oiv, but tests in this area are far from substantive.
The use of oivs for prediction has not yet been explored. Although it is pos-
sible to construct a visualization out of neuron elements which would be
capable of sophisticated prediction, it has not been fully examined in the
context of information visualization.
5.3 Reading and Observation
This research points to multiple ways to read an abstract visualization and their
relationship to current visual information processing theories.
1. Innate understanding–rely on one’s own graphical sensibilities, using Bertin’s
model of an innate model of graphics based on charts, maps, etc. [Bertin, 83]
Perhaps only a weak link to this work, as it pursues alternative representations
that are not necessarily intuitive.
2. Comparing deviance–first determine what the ‘normal’ state looks like, and
then watch how the changing data signal causes the visualization to deviate
from that state. This is probably the closest model for the current set of experi-
ments. The normal state is continually updated as the visualization evolves in
time.
86](https://image.slidesharecdn.com/thesis-0522d-100117115723-phpapp01/85/organic-information-design-86-320.jpg)
![3. Comparing multiples–an interesting area of research would be comparing
several versions of the same system, each with slightly different rules determin-
ing its organization and representation. By observing the relative differences
between the iterations, deeper understanding can be gleaned. There are two
ways this can be done. First, by looking at streams of data, and running them
through the systems based on the same sets of rules. Second, by looking at the
same data set and changing the rules used to display it. This method is related
to the notion of small multiples, discussed in [Tufte, 90].
4. Information dissection–by doing queries within the rules to see what kinds
of things are happening, the viewer can engage in a kind of detective work.
Sometimes reading a data will be a difficult process that requires the viewer to
take an active role in learning about the data. Information design is concerned
with making data accessible, not dumbing it down or limiting it to what is
instantly digestible.
5.4 Guidelines for Rules
Having applied the Organic Information Design process to a set of experi-
ments, the following guidelines become apparent.
Structure–it is essential to construct these systems in ways that will cause the
individual parts to aggregate together. The experiments presented used simple
clustering and grouping, but did not use employ additional rules to govern the
grouping of those first-level clusters.
Appearance–these are complicated systems, and it is easy (and therefore tempt-
ing) to make them very beautiful in their complications. . This is a weak
exercise, however, because one can take the simplest thing and make it need-
lessly complicated but beautiful. Ostentatious or wildly complex things can
be interesting, if they’re done in the appropriate contexts and executed in a
creative manner. But in general, it is more important to simplify for the sake
of the user.
Movement–it is important to avoid extraneous movement in the composition
that is not related to the task at hand. Movement eye-catching and quickly
87](https://image.slidesharecdn.com/thesis-0522d-100117115723-phpapp01/85/organic-information-design-87-320.jpg)


![6 References
Ahlberg, Christopher. Shneidermann, Ben. Visual Information Seeking: Tight cou-
pling of dynamic query filters with starfield displays. ACM CHI ‘94 Conference Pro-
ceedings. (Boston, MA, April 24-28, 1994) 313-337.
Anscombe, F. J. Graphs in Statistical Analysis. American Statistician, 27. February
1973, 17-21. Cited from [Tufte, 92] pp. 14-15.
Bertin, Jacques. Semiology of Graphics: Diagrams, Networks, Maps. Madison, Wis.:
University of Wisconsin Press, 1983.
Braitenberg, Valentino. Vehicles: Experiments in Synthetic Psychology. Cambridge,
Massachusetts: MIT Press, 1984.
Card, Stuart K. Mackinlay, Jock D. Shneidermann, Ben. Readings in Information
Visualization: Using Vision to Think. San Francisco: Morgan Kauffman, 1999.
Coveney, Peter. Highfield, Roger. Frontiers of Complexity. New York: Fawcett Col-
umbine, 1995.
Flake, Gary William. The Computational Beauty of Nature. Cambridge, Massachu-
setts: MIT Press, 1998.
Frisch, U. Hasslacher, B. Pomeau, Y. Physics Review Letters. 56 (1986) 1505.
Gershenfeld, Neil A. The Nature of Mathematical Modeling. New York : Cambridge
University Press, 1999.
Hardy, J. de Pazzis, O. Pomeau, Y. Molecular Dynamics of a Classical Lattice
Gas: Transport Properties and Time Correlation Functions. Phys. Rev. A, 13 (1976),
1949-61.
Holland, John H. Hidden Order: How Adaptation Builds Complexity. Reading, Mas-
sachusetts: Addison-Wesley, 1995.
d’Humières, Dominique and Lallemand, Pierre. Complex Systems. 1 (1987)
599-632.
93](https://image.slidesharecdn.com/thesis-0522d-100117115723-phpapp01/85/organic-information-design-93-320.jpg)


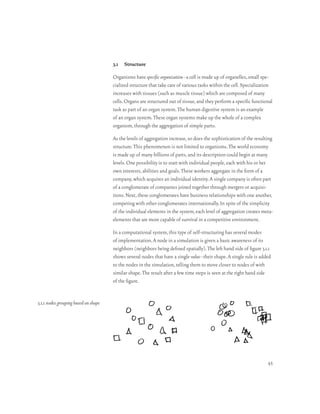
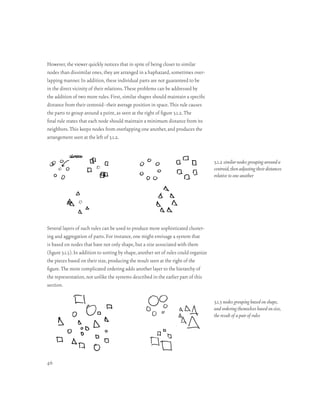
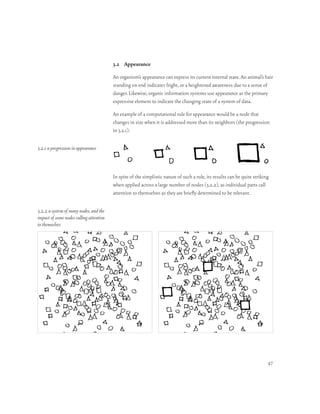
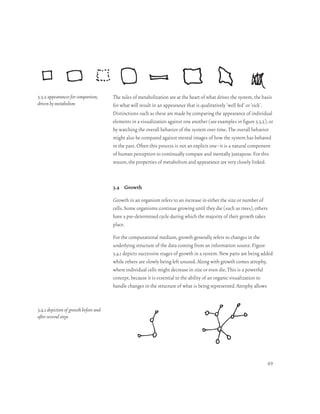
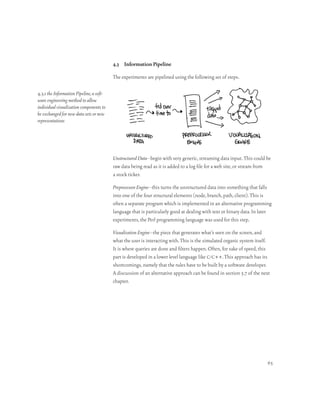
The document presents an introduction to the concept of Organic Information Design, which aims to create dynamic visualizations of changing data sources. It discusses how organic systems can provide a framework for visualizing complex and dynamic information. Key points: - Existing techniques for visualizing data are insufficient for dynamic data sources that are continually changing. - Organic Information Design draws from properties of decentralized organic systems like growth, adaptation and response to stimuli to create interactive visualizations ("Organic Information Visualizations"). - These visualizations aim to depict qualitative features of large, changing datasets to aid understanding, rather than focus on individual data points. - Psychological responses to the behavior of the visualizations can provide a way to interpret


