Introduction
• Trends
– Social media
– Internet of things
– Human (participatory) sensing
• Properties
– Multiple media
– Spatio-temporal
– Realtime
– Cloud
2
3.
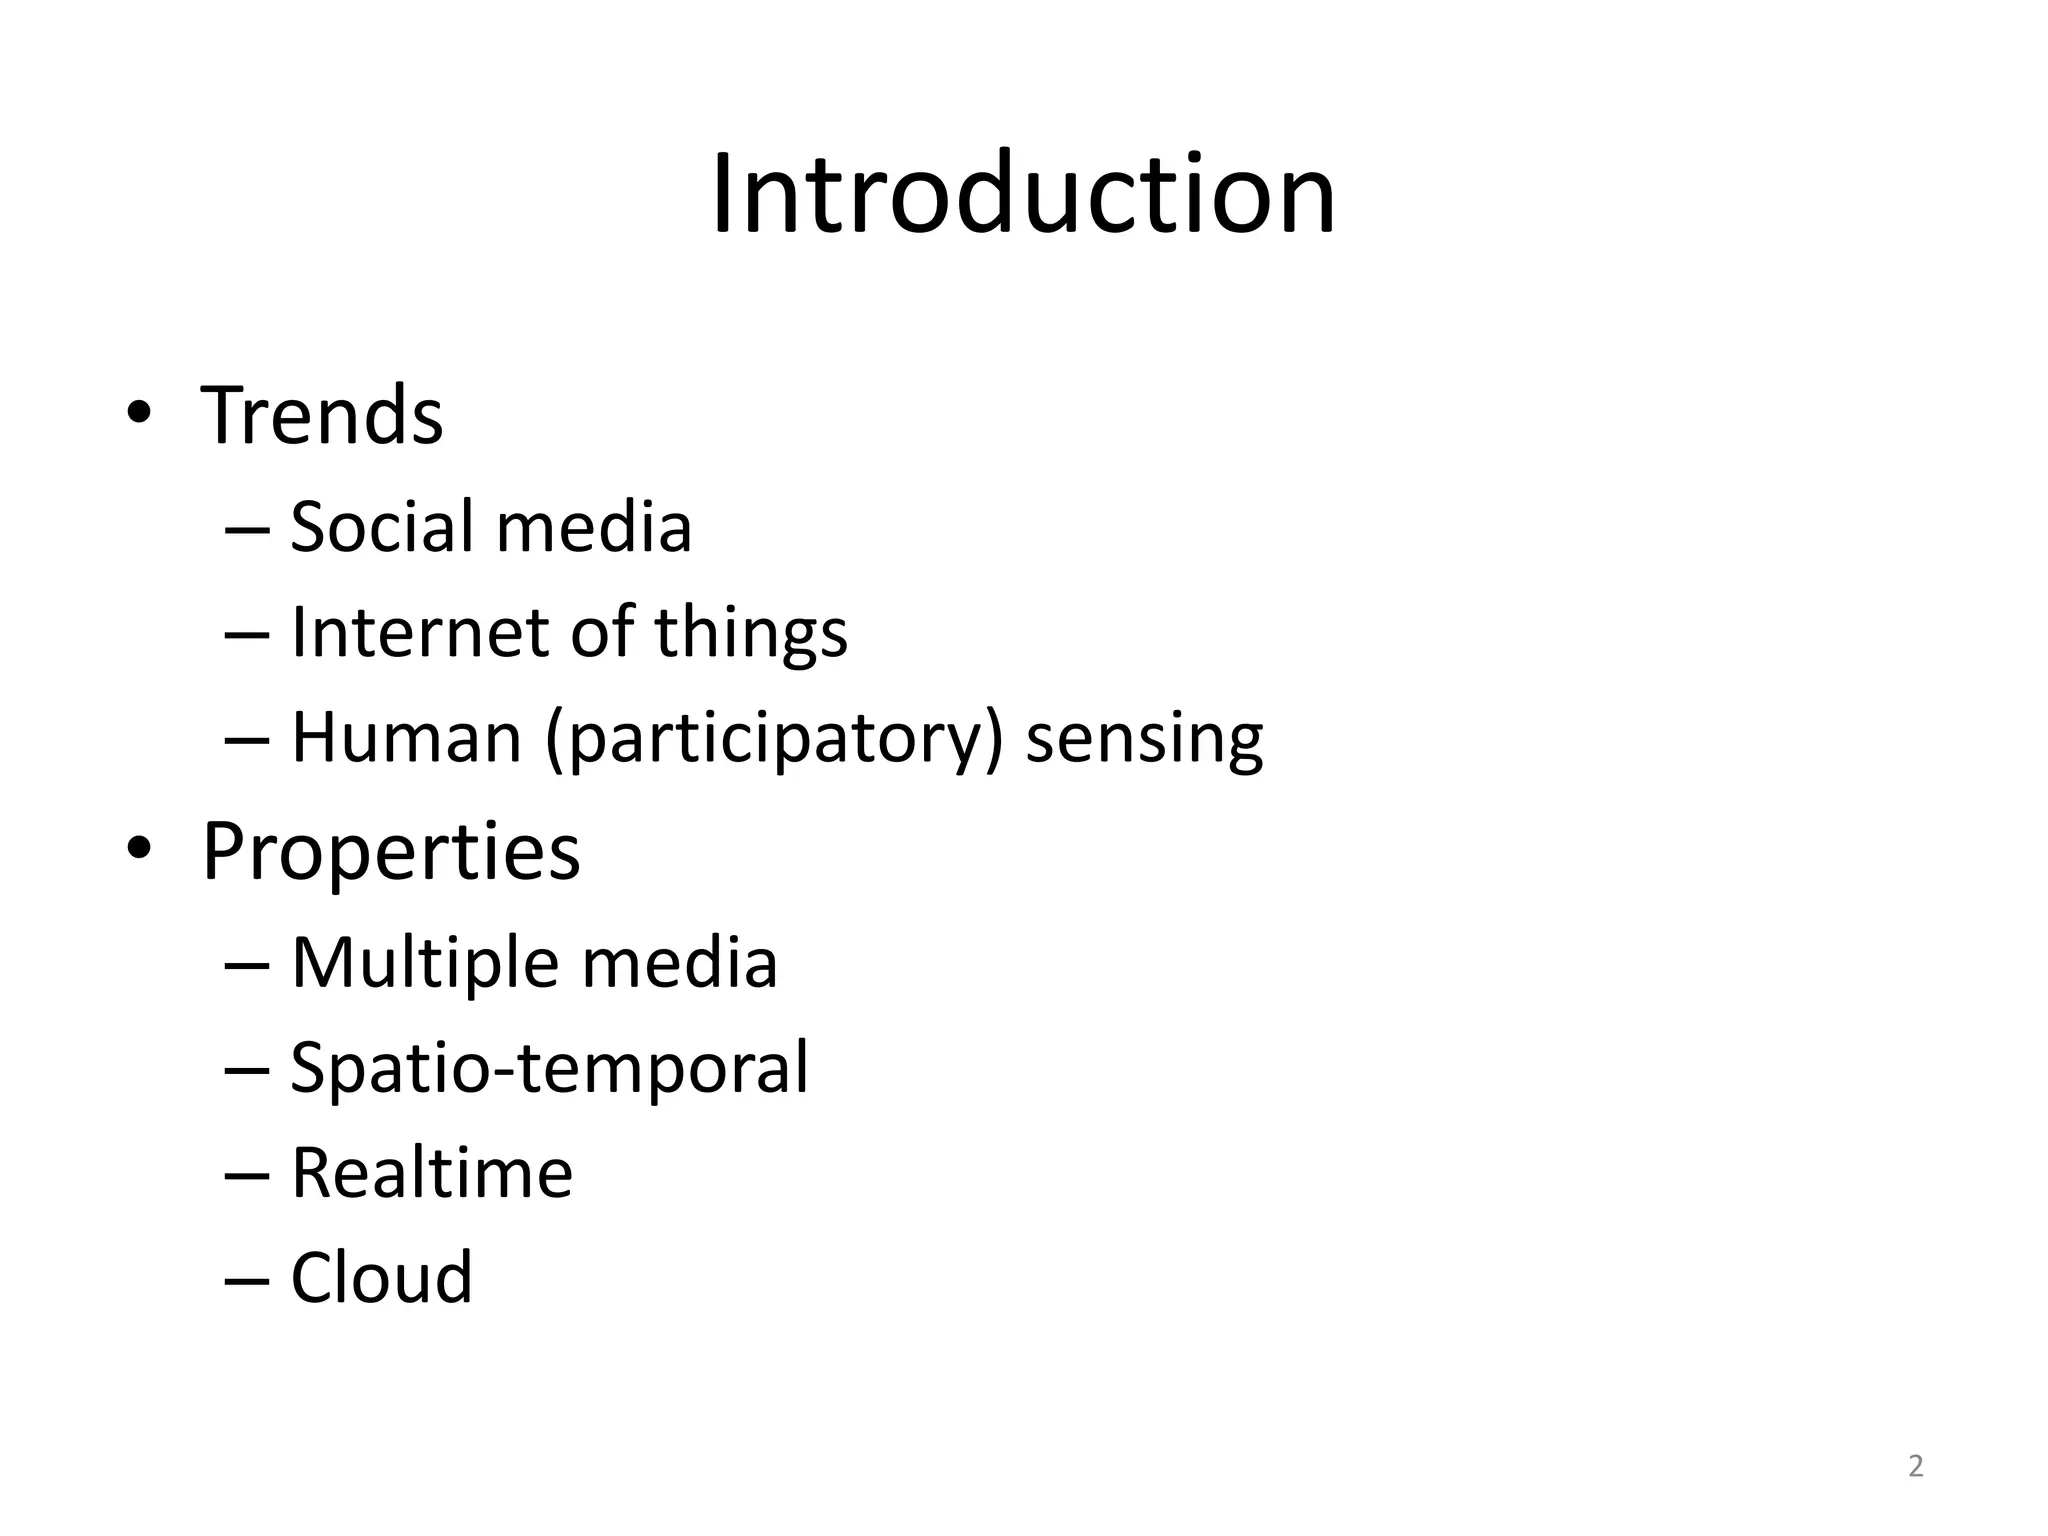
Social Life Networks
Connecting People
and resources
Situation aware routing
Information
Aggregation Situation Alerts
and Detection
Composition
Queries
3
4.
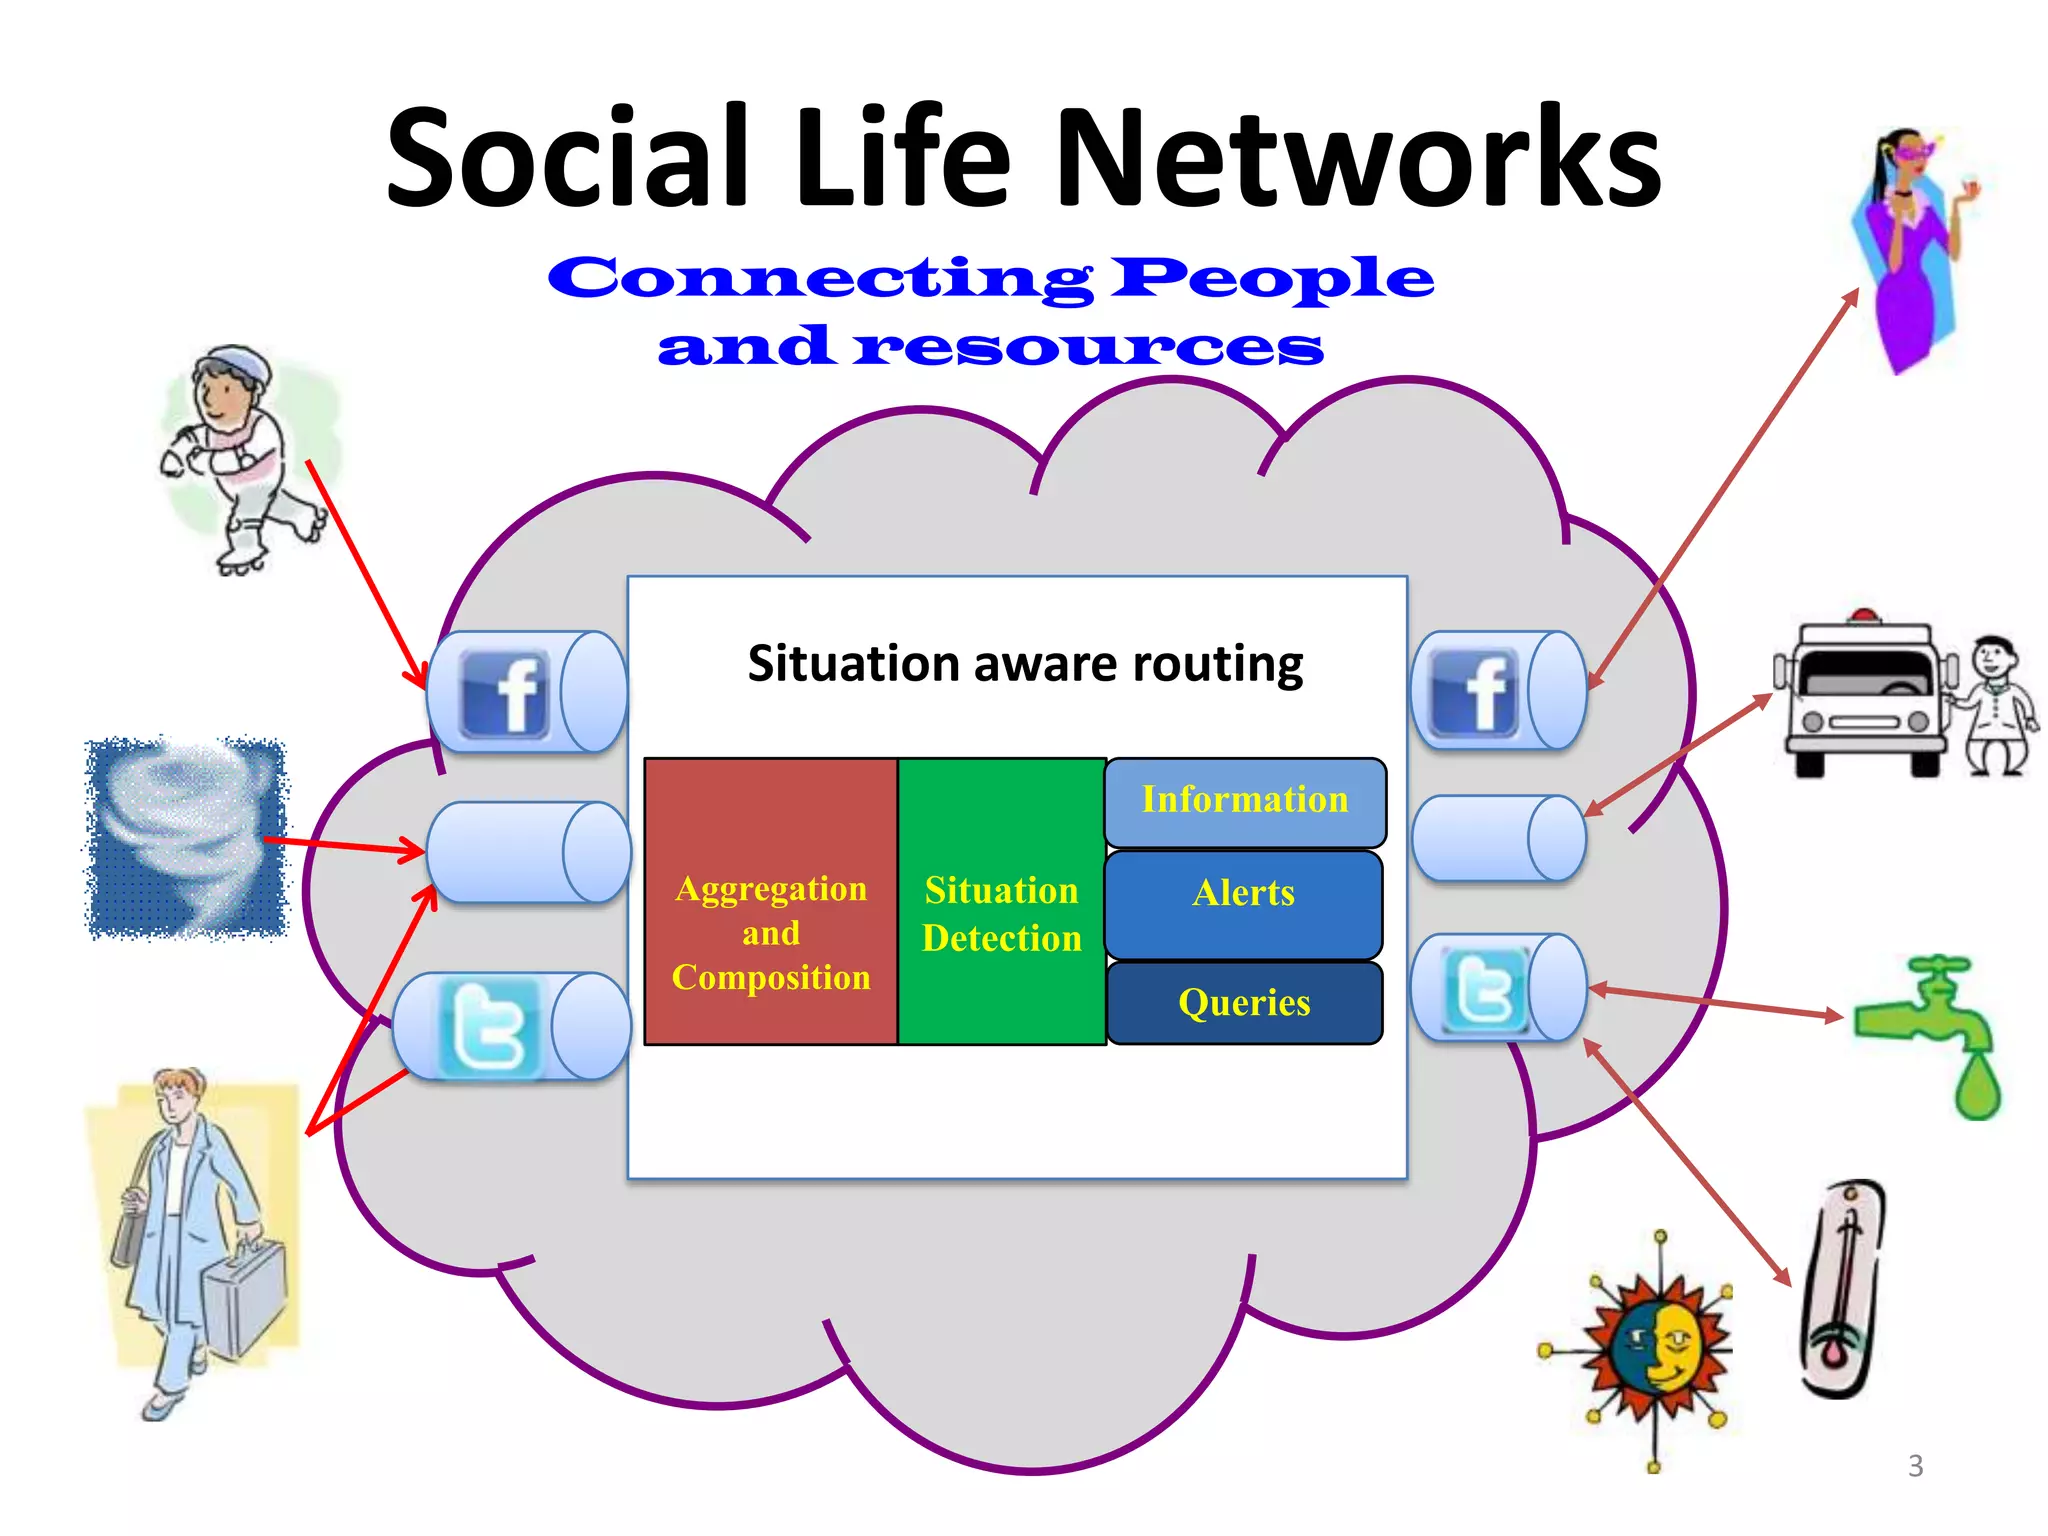
Motivating example
Aggregation, Characterization,…
Alert level
= High
Date: 3rd Jun, 2011
STT data Situation Detection User-Feedback
Tweet: 1) Characterization ‘Please visit nearest
‘Urrgh… got the flu’ 2) Control action CDC center at 4th St
immediately’
Loc: NYC,
Date: 3rd Jun, 2011
Theme: Swine Flu 4
5.
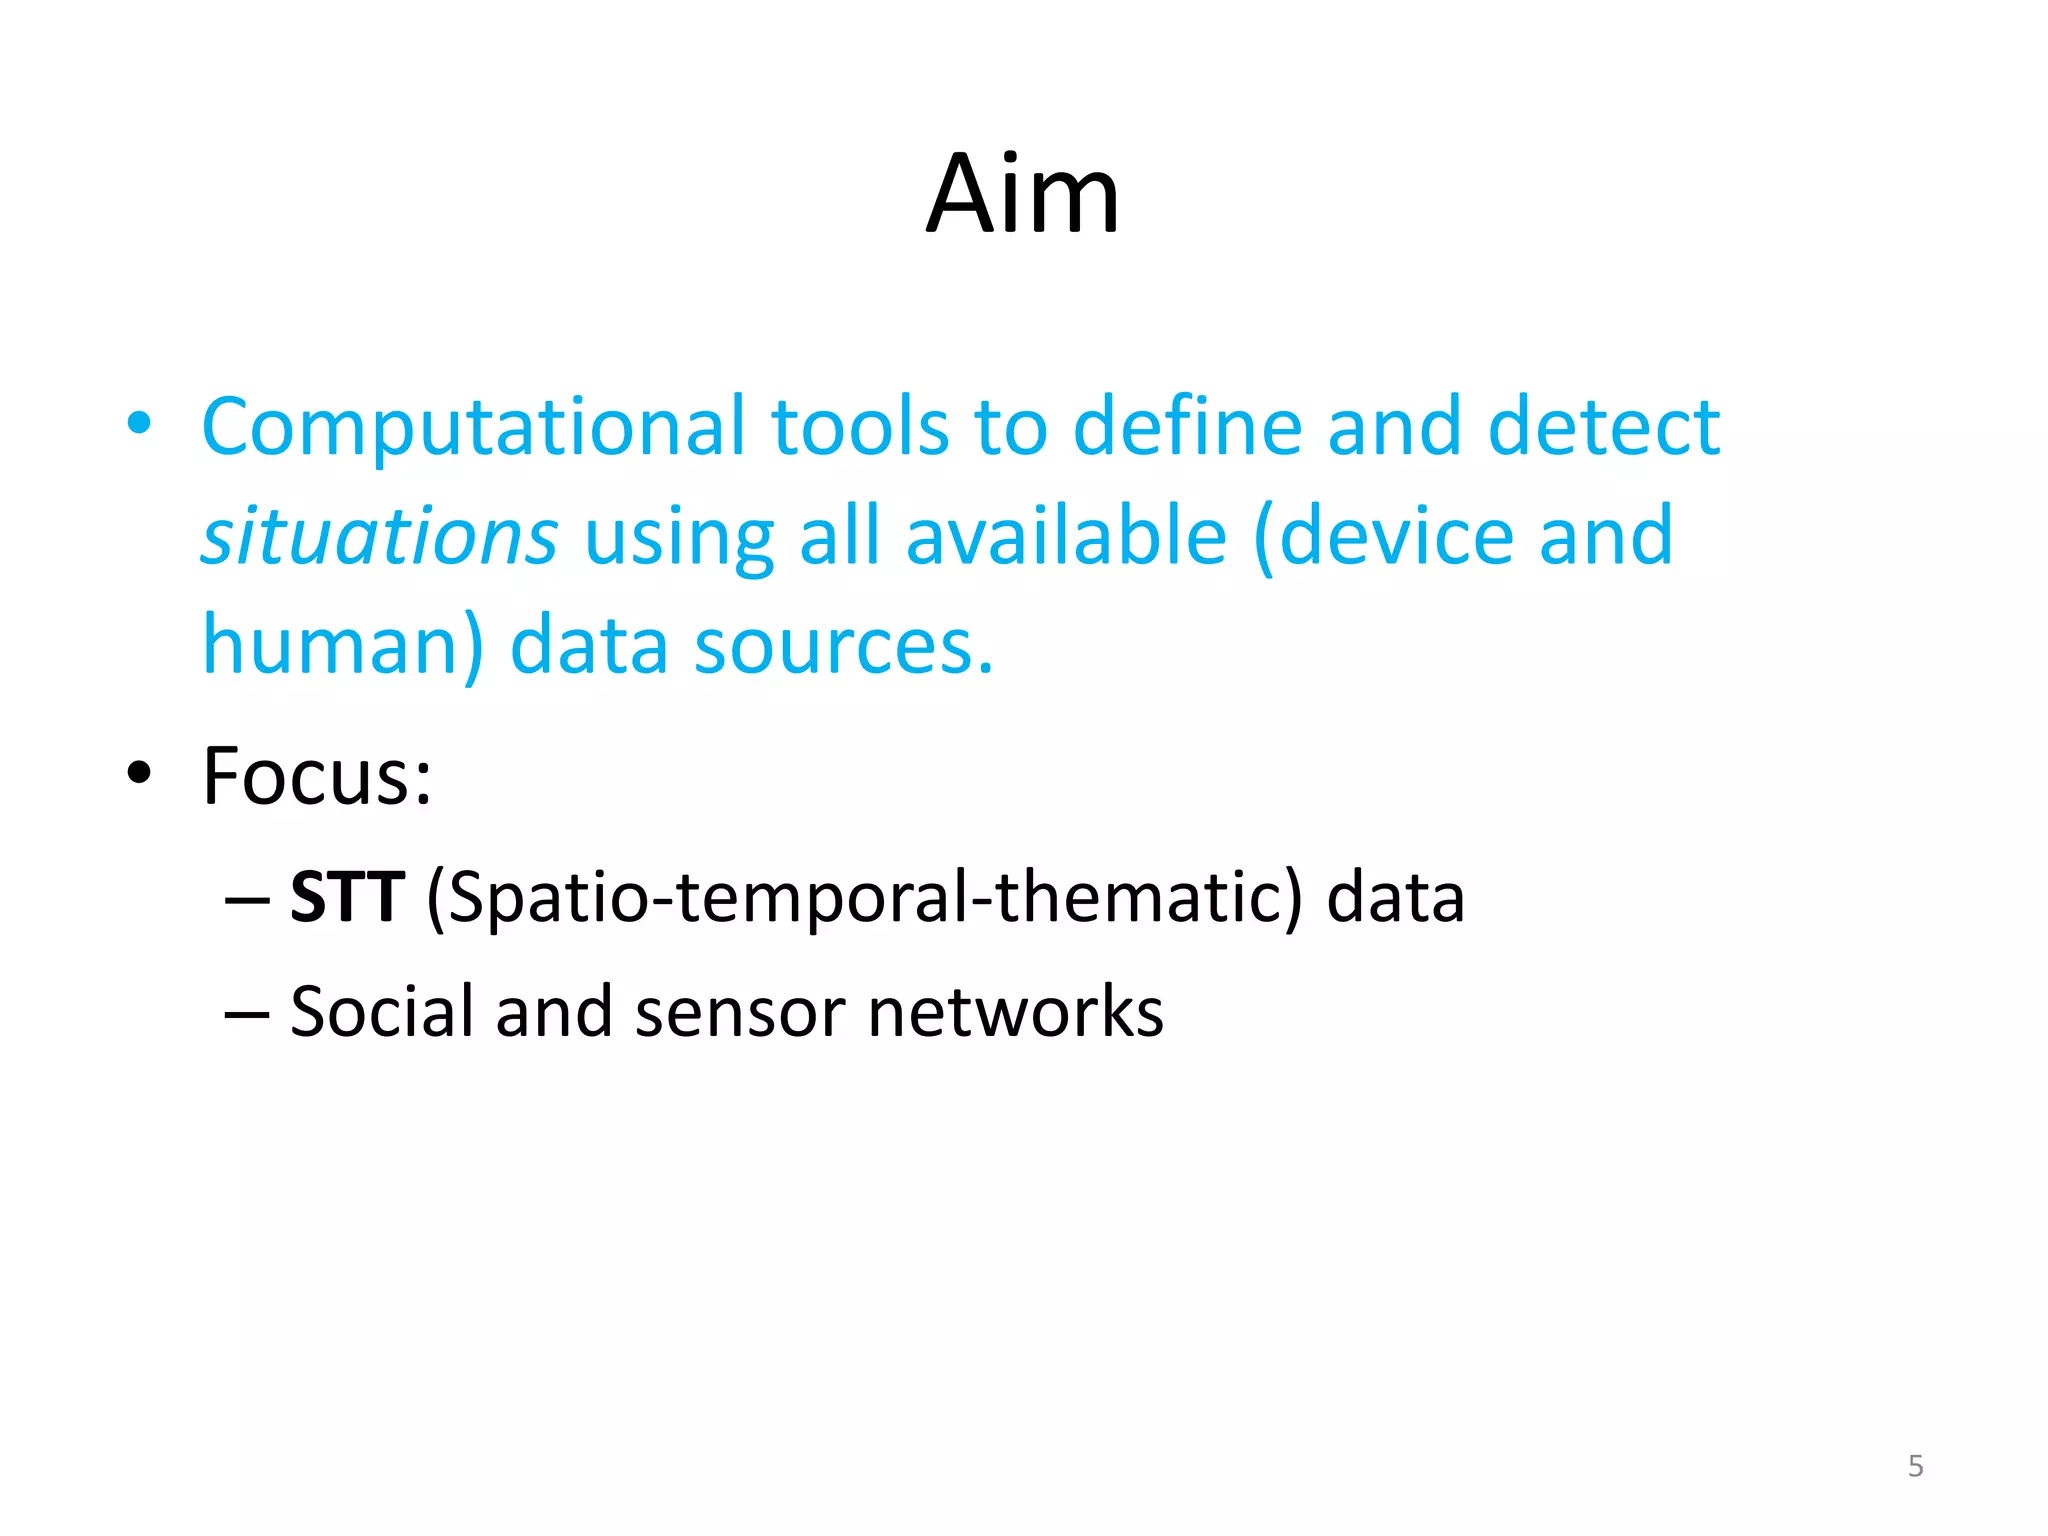
Aim
• Computational toolsto define and detect
situations using all available (device and
human) data sources.
• Focus:
– STT (Spatio-temporal-thematic) data
– Social and sensor networks
5
6.
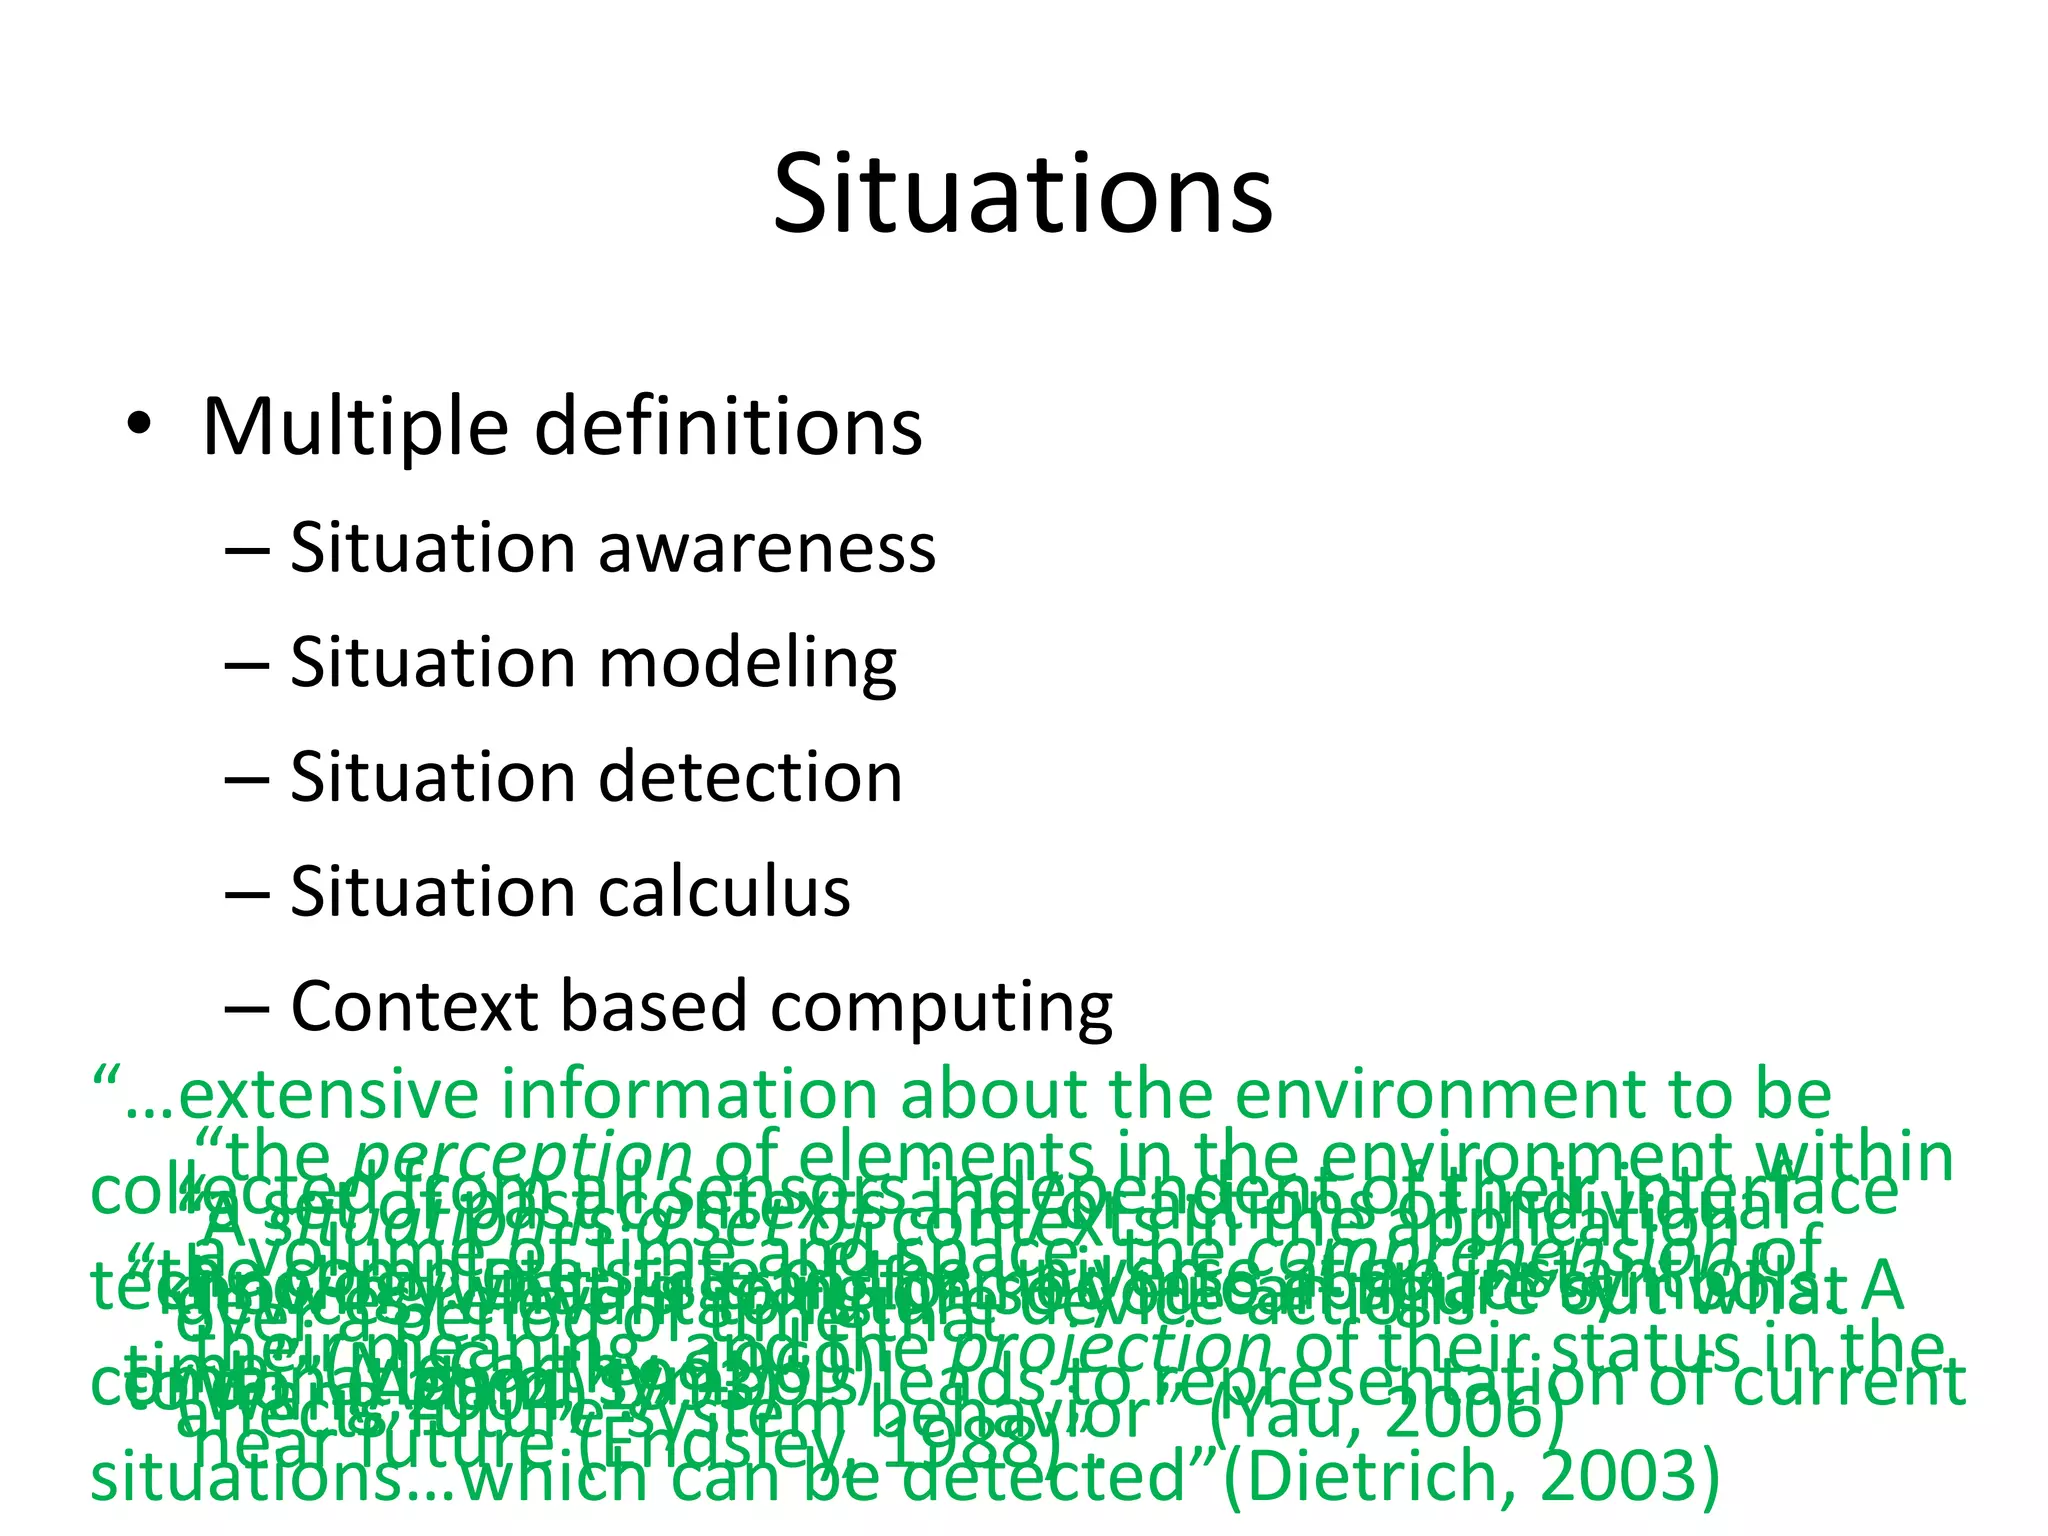
Situations
• Multipledefinitions
– Situation awareness
– Situation modeling
– Situation detection
– Situation calculus
– Context based computing
“…extensive information about the environment to be
“the perception of elements in the environment within
collectedof past contextscontexts in theof their interface
“a set from is asensorsand/or actions application
“Avolume ofall set of space, the comprehension of
situation time and independent of individual
a
technology.whatstate of the universe abstract”out what A
“the complete is going on so you can figure symbols.
is transformed into at an instant of
devices Dataof to future
“knowingrelevant time that device actions”
over ameaning, and the projection of their status in the
period
their(Adam, 1993)”. leads to representation of current
time” (McCarthy, 1969)
combination of symbols behavior” (Yau, 2006)
to do” future system
(Wang,2004)”.
affects
situations…which can be1988)”.
near future (Endsley, detected”(Dietrich, 2003)
7.
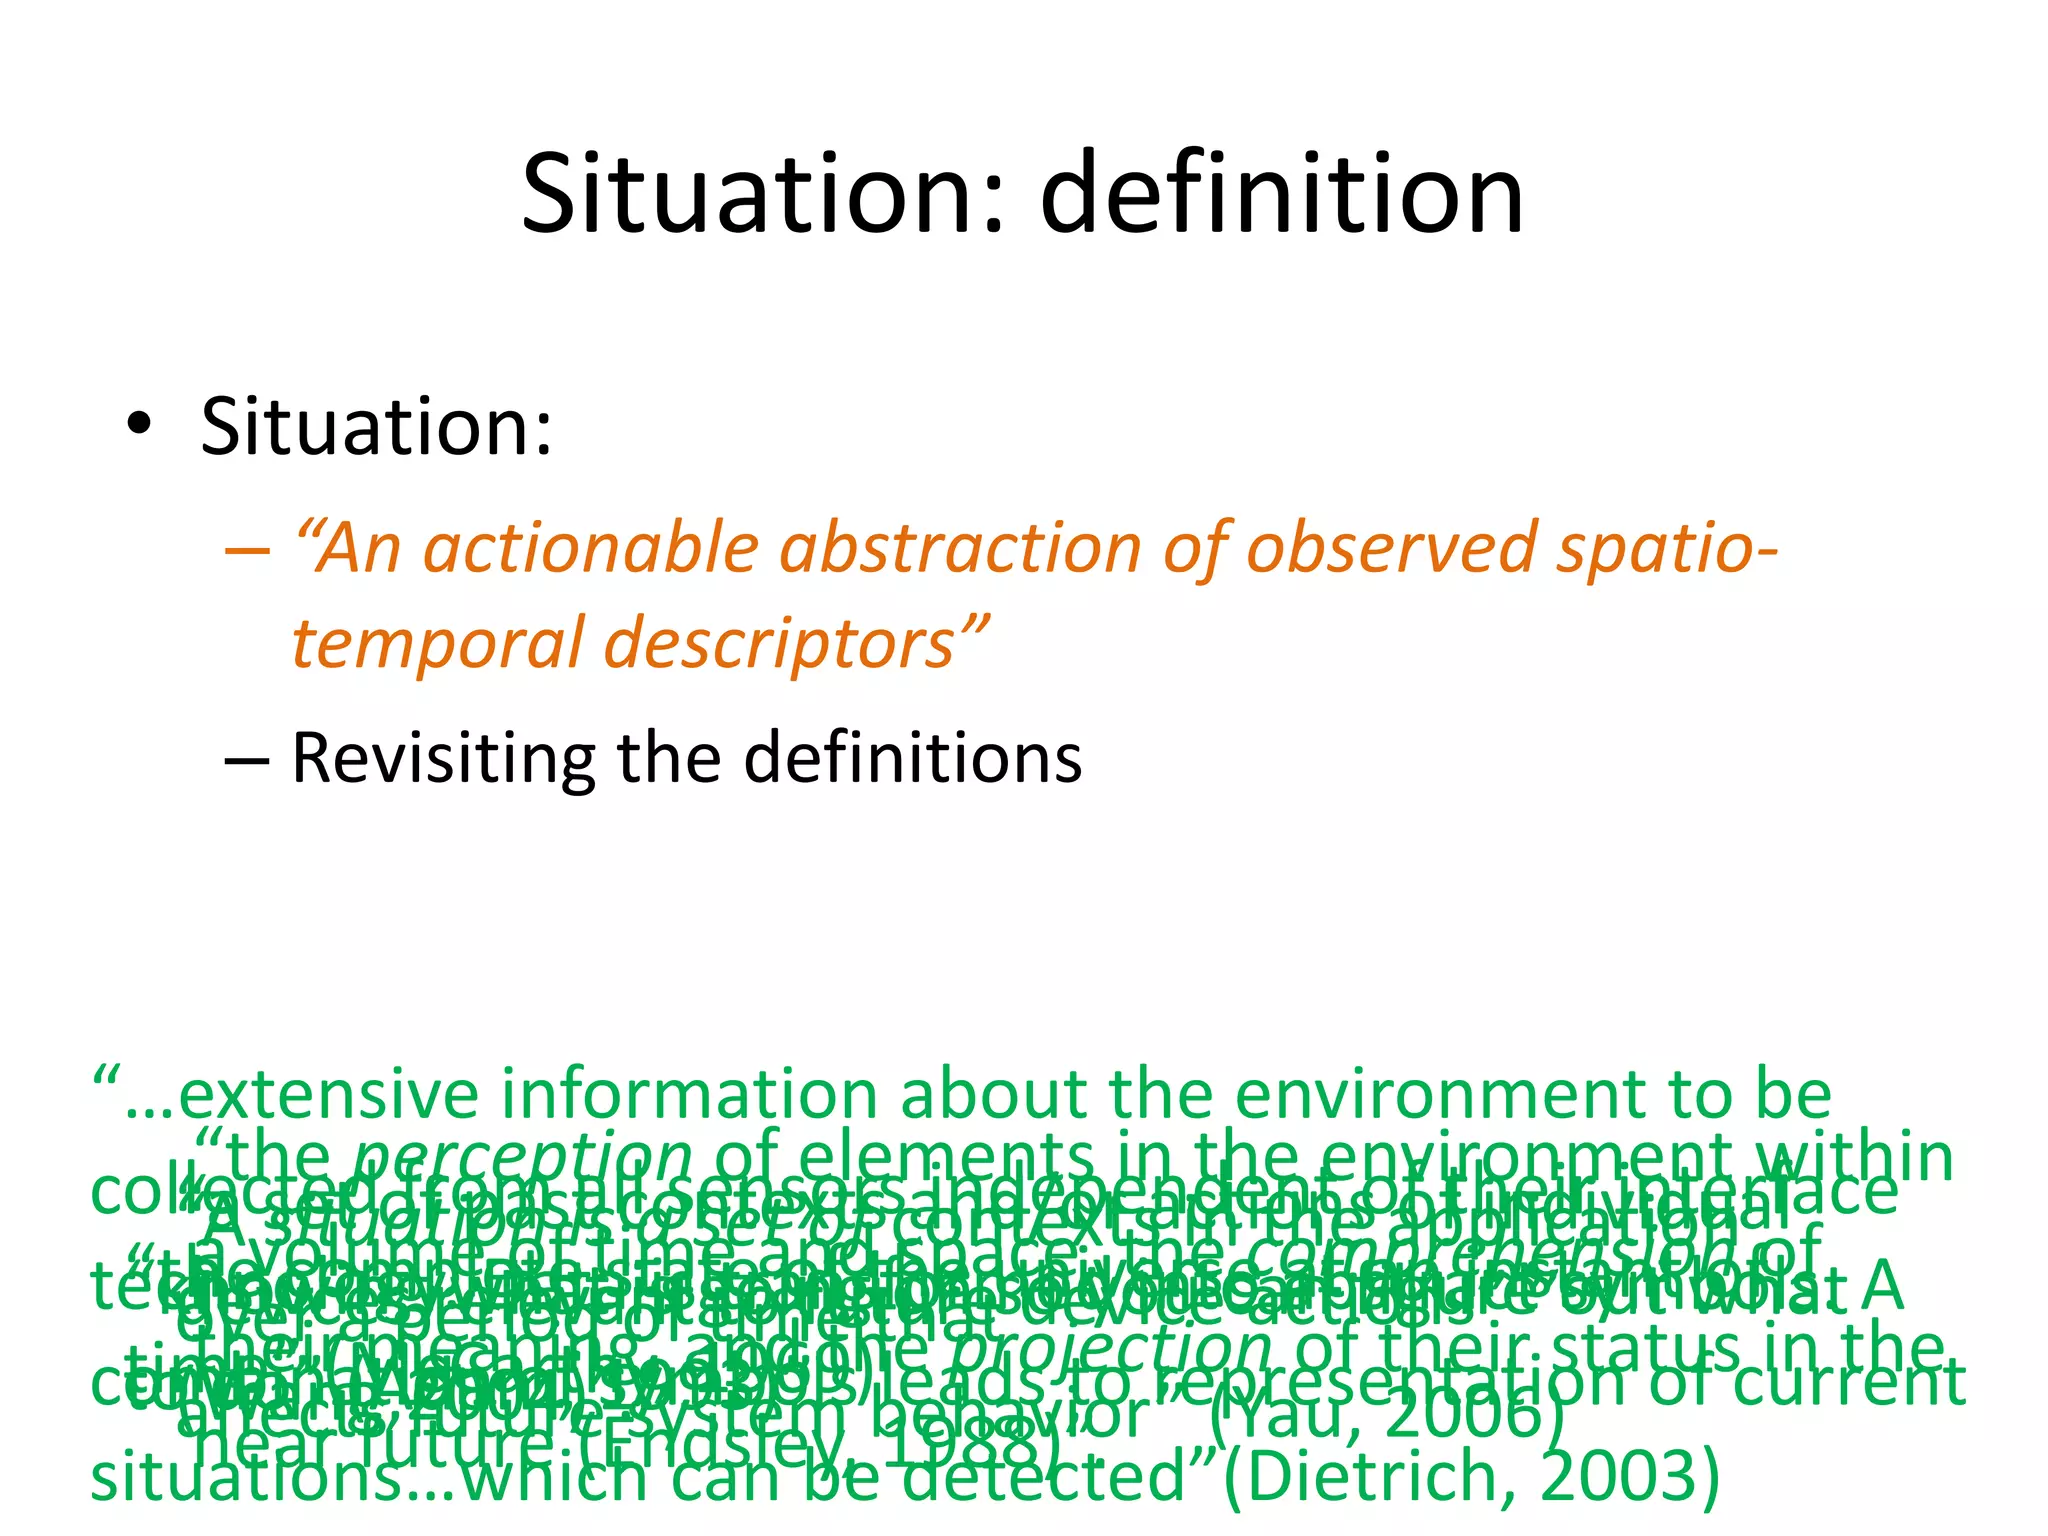
Situation: definition
•Situation:
– “An actionable abstraction of observed spatio-
temporal descriptors”
– Revisiting the definitions
“…extensive information about the environment to be
“the perception of elements in the environment within
collectedof past contextscontexts in theof their interface
“a set from is asensorsand/or actions application
“Avolume ofall set of space, the comprehension of
situation time and independent of individual
a
technology.whatstate of the universe abstract”out what A
“the complete is going on so you can figure symbols.
is transformed into at an instant of
devices Dataof to future
“knowingrelevant time that device actions”
over ameaning, and the projection of their status in the
period
their(Adam, 1993)”. leads to representation of current
time” (McCarthy, 1969)
combination of symbols behavior” (Yau, 2006)
to do” future system
(Wang,2004)”.
affects
situations…which can be1988)”.
near future (Endsley, detected”(Dietrich, 2003)
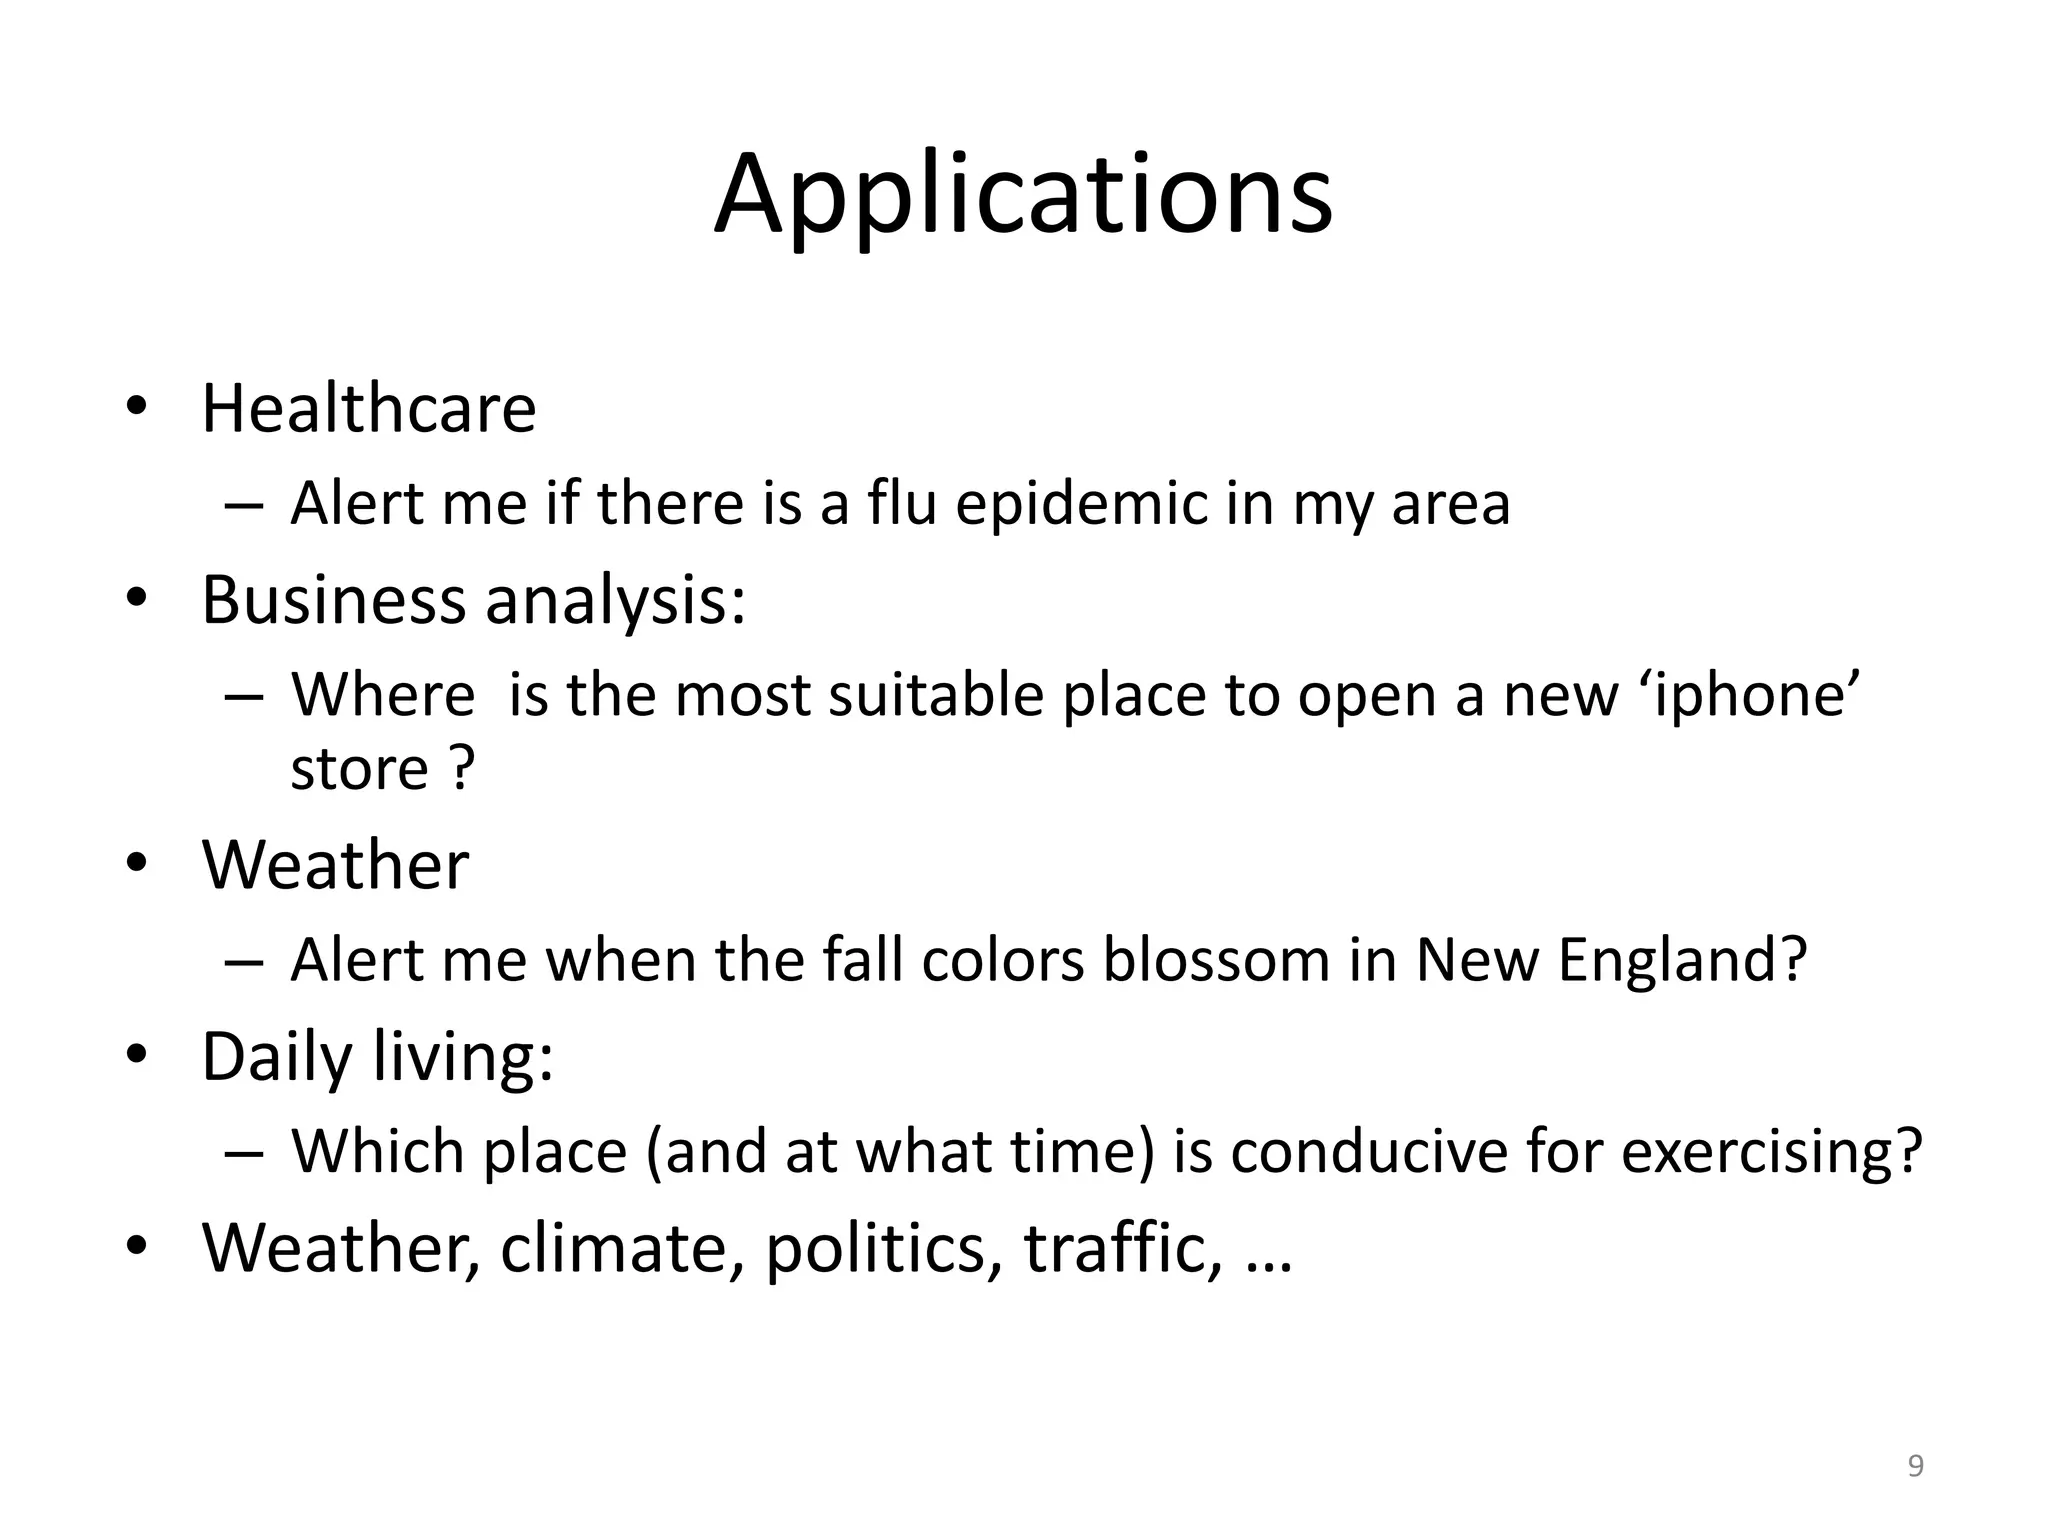
Applications
• Healthcare
– Alert me if there is a flu epidemic in my area
• Business analysis:
– Where is the most suitable place to open a new ‘iphone’
store ?
• Weather
– Alert me when the fall colors blossom in New England?
• Daily living:
– Which place (and at what time) is conducive for exercising?
• Weather, climate, politics, traffic, …
9
10.
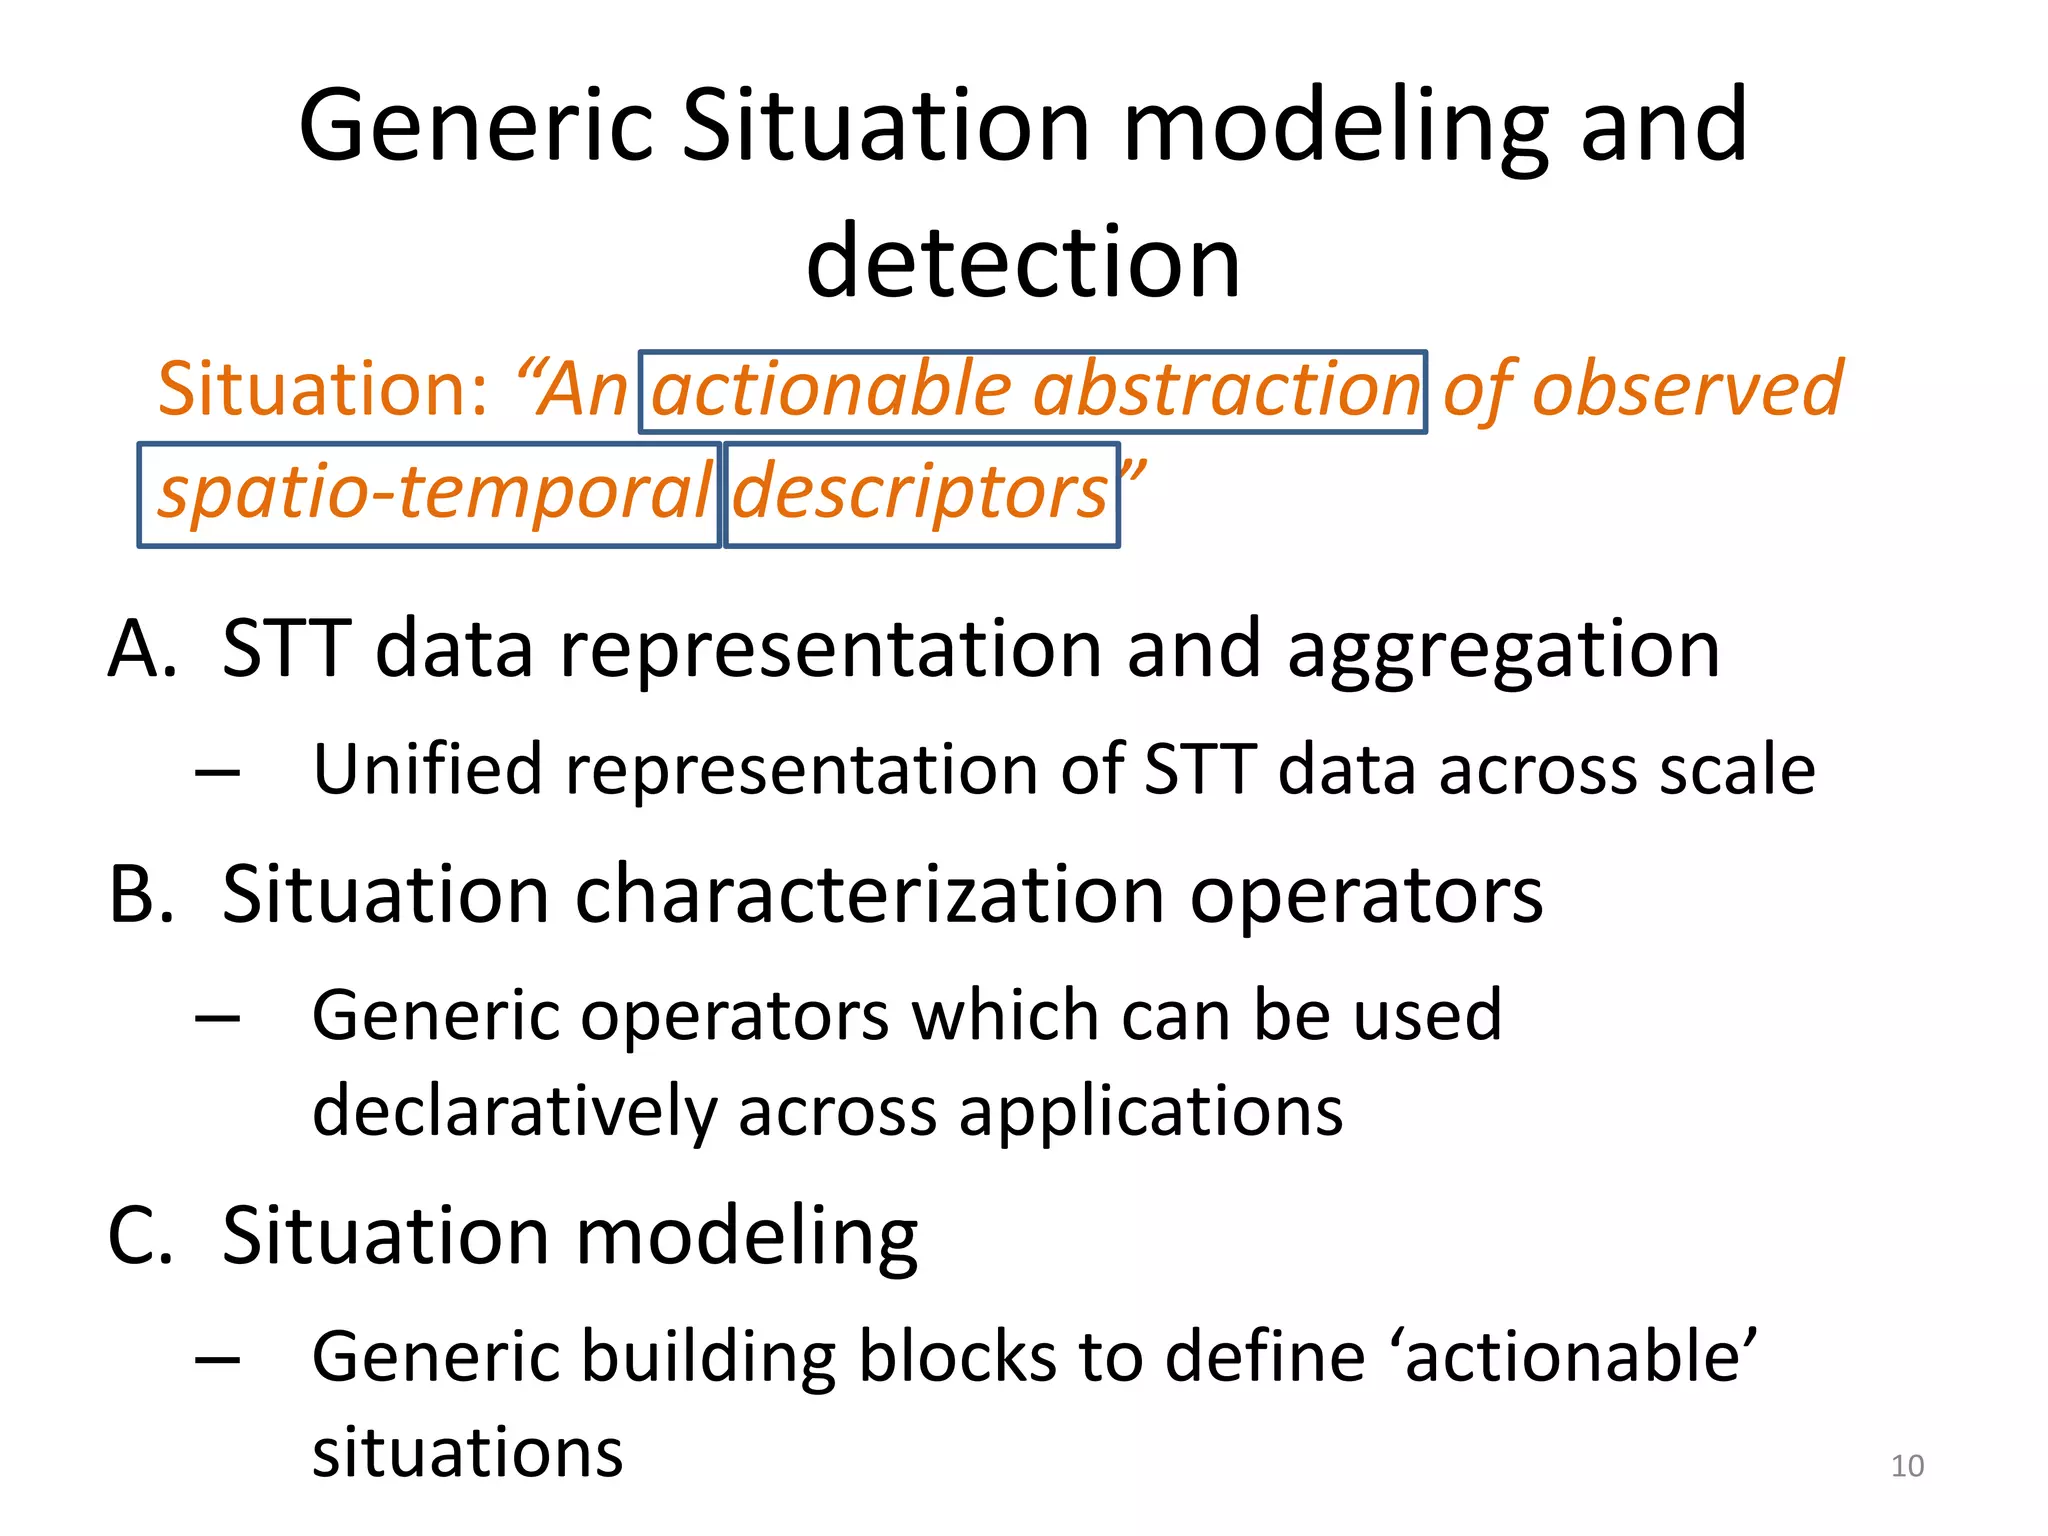
Generic Situation modelingand
detection
Situation: “An actionable abstraction of observed
spatio-temporal descriptors”
A. STT data representation and aggregation
– Unified representation of STT data across scale
B. Situation characterization operators
– Generic operators which can be used
declaratively across applications
C. Situation modeling
– Generic building blocks to define ‘actionable’
situations 10
11.
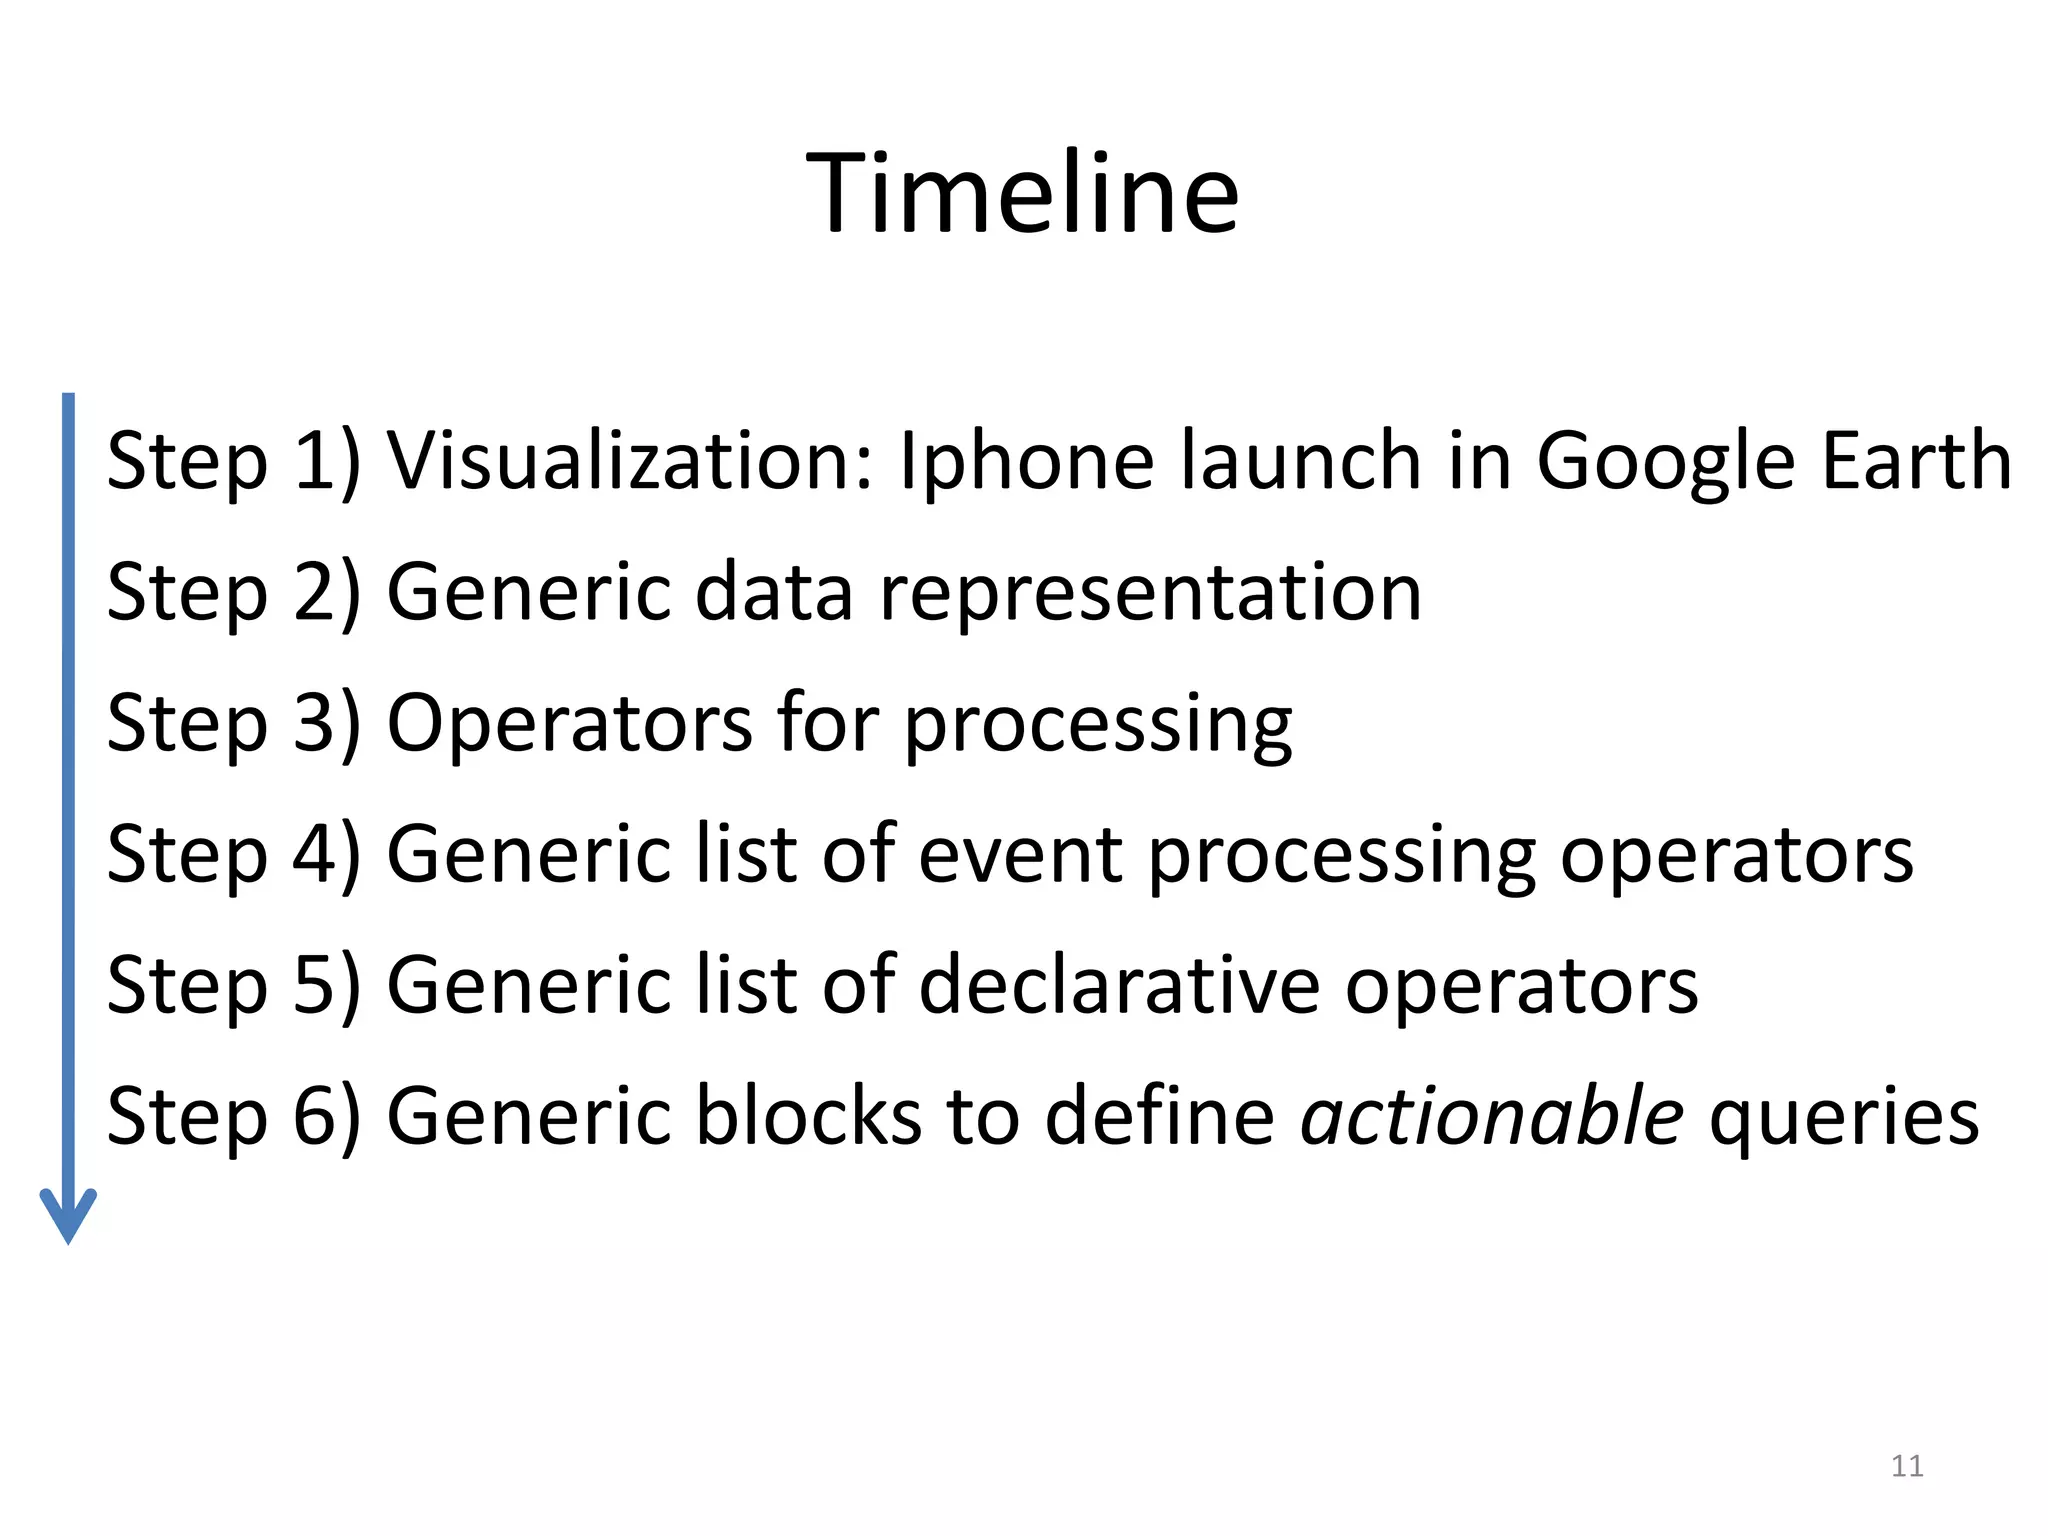
Timeline
Step 1) Visualization:Iphone launch in Google Earth
Step 2) Generic data representation
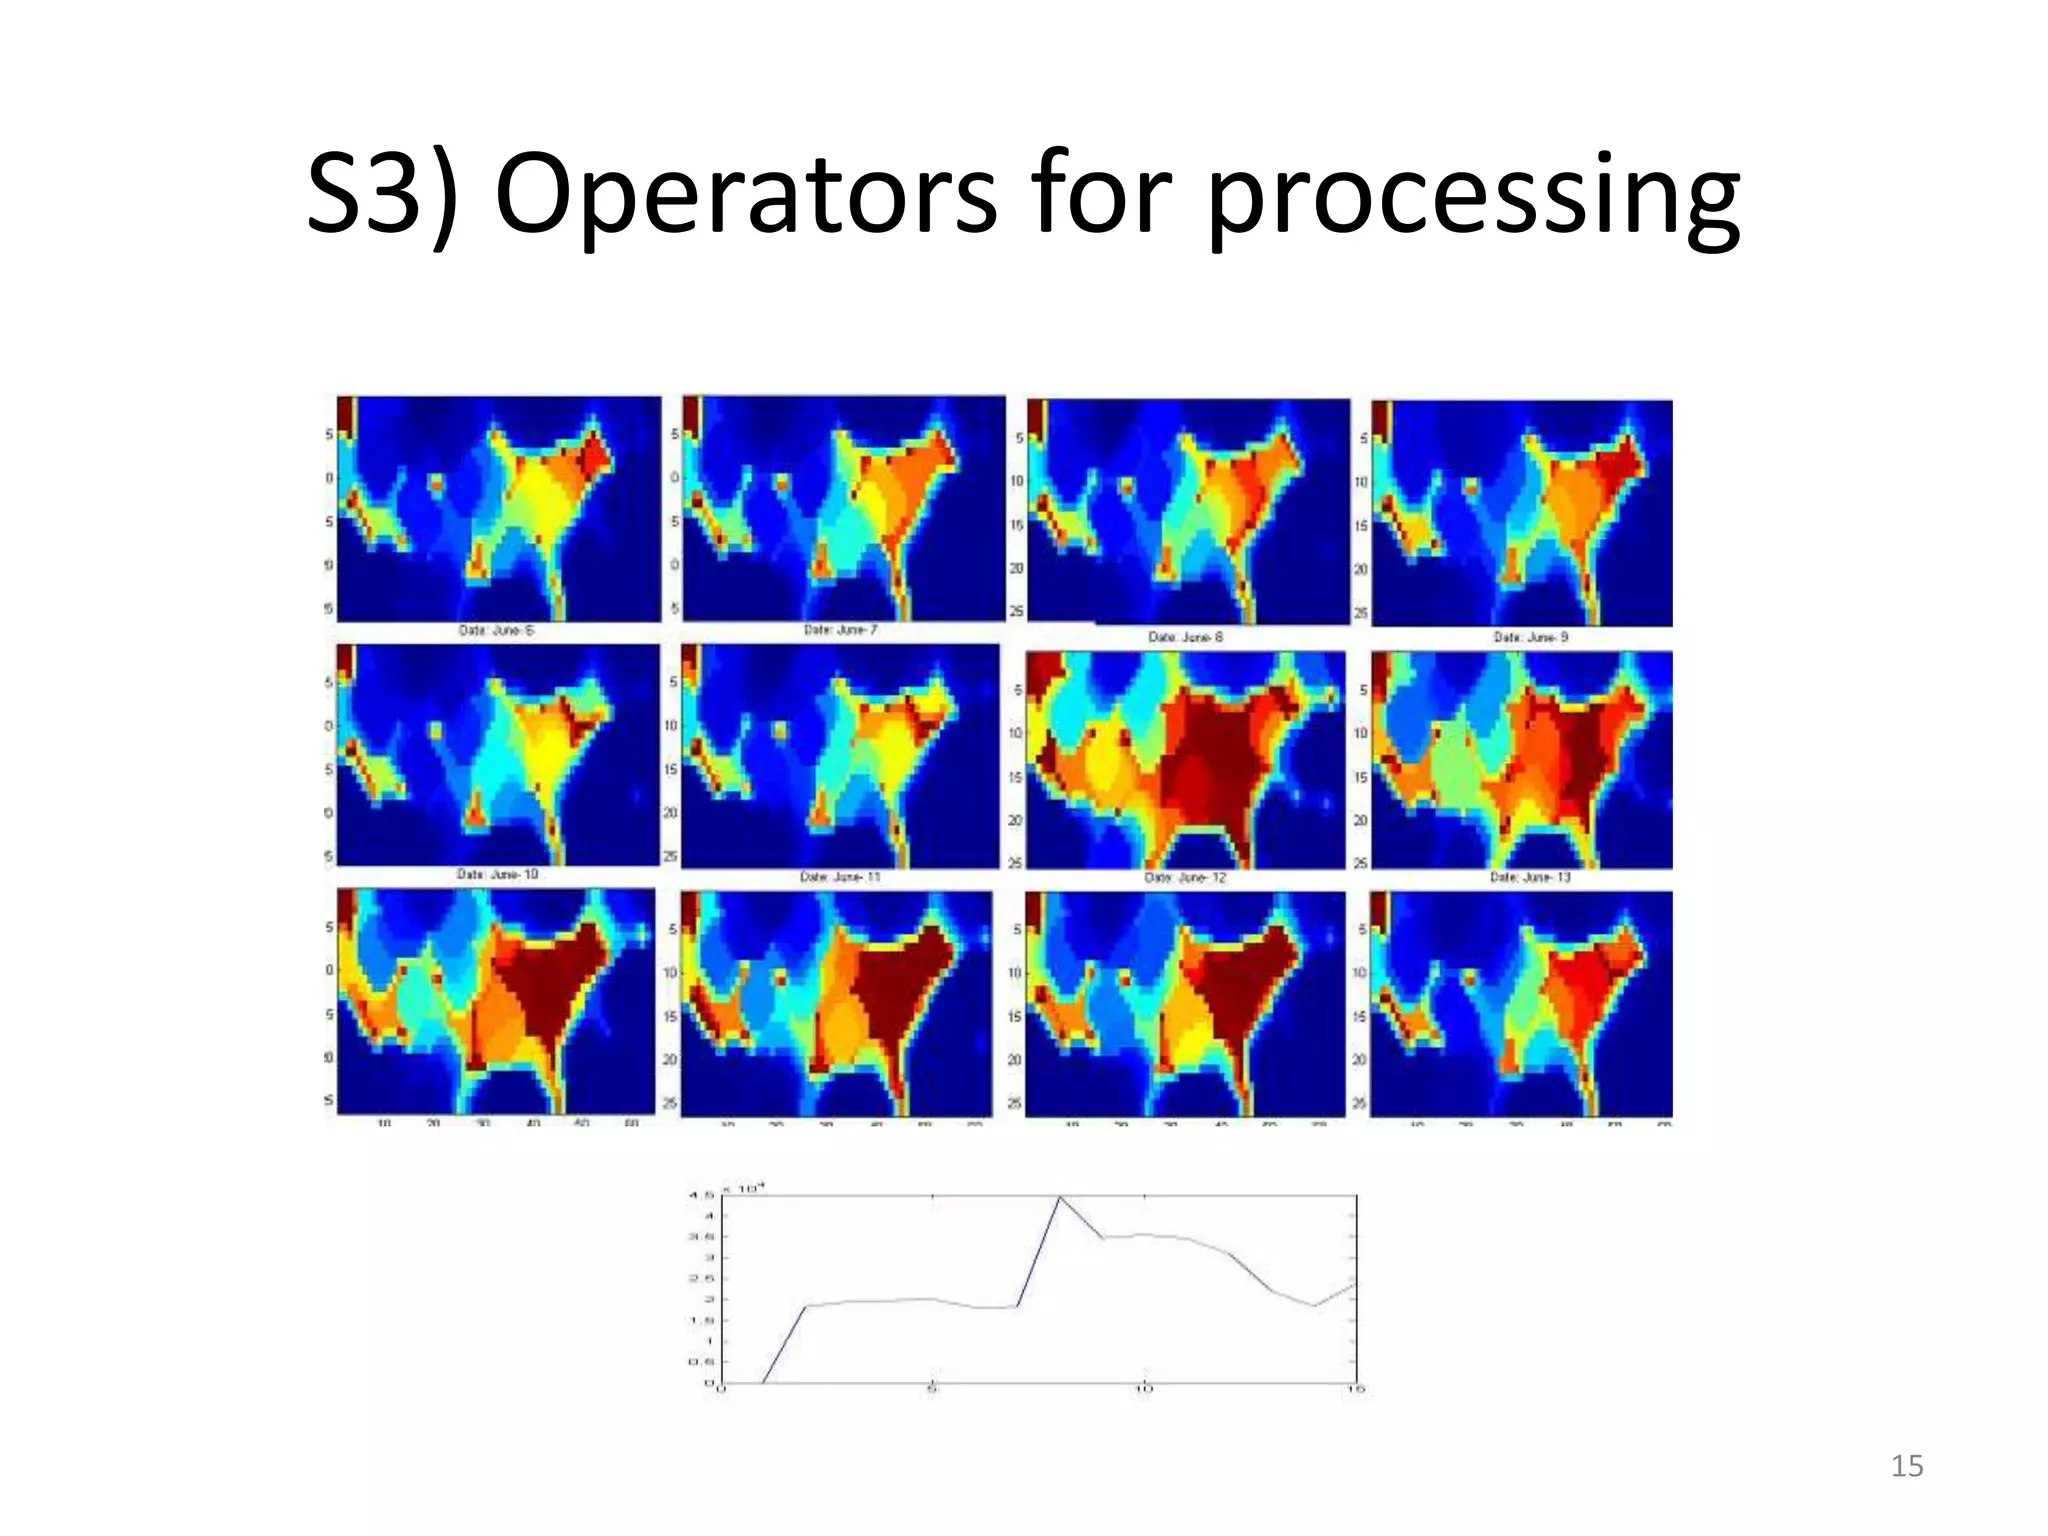
Step 3) Operators for processing
Step 4) Generic list of event processing operators
Step 5) Generic list of declarative operators
Step 6) Generic blocks to define actionable queries
11
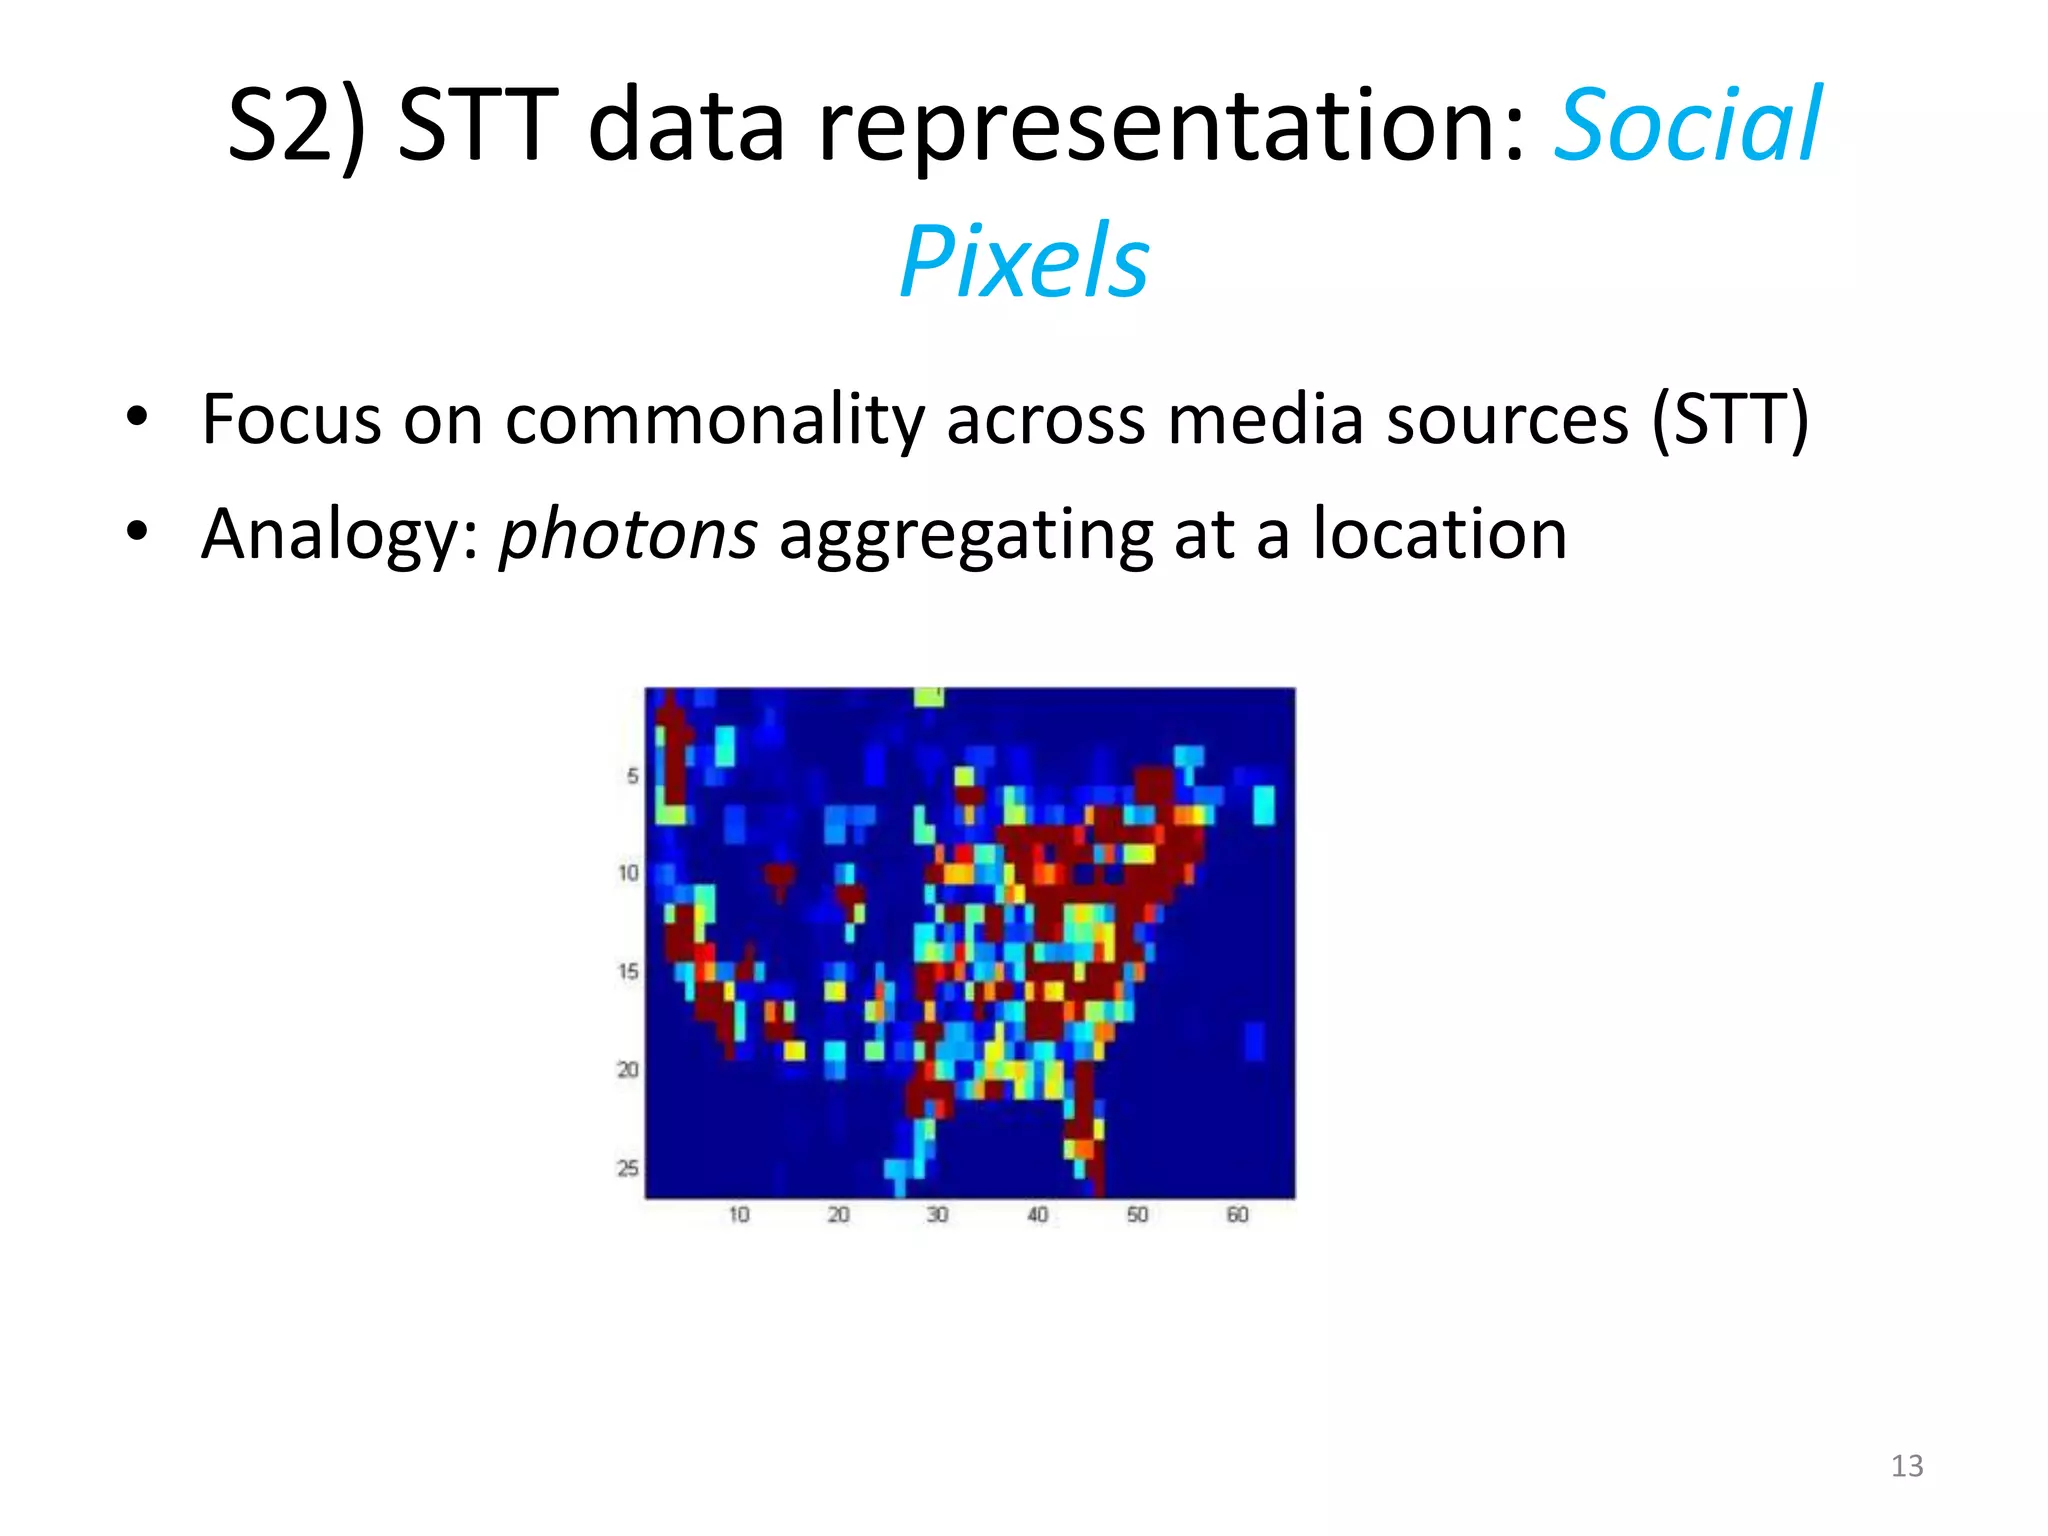
S2) STT datarepresentation: Social
Pixels
• Focus on commonality across media sources (STT)
• Analogy: photons aggregating at a location
13
14.
Why social pixels/Emages?
•Advantages
– Visualization
– Intuitive query and mental model
– Common spatio-temporal data representation
– Data analysis using media processing
• Image/Media Processing operators -> Situation
characterization operators
– e.g. convolution, filtering, background subtraction
14
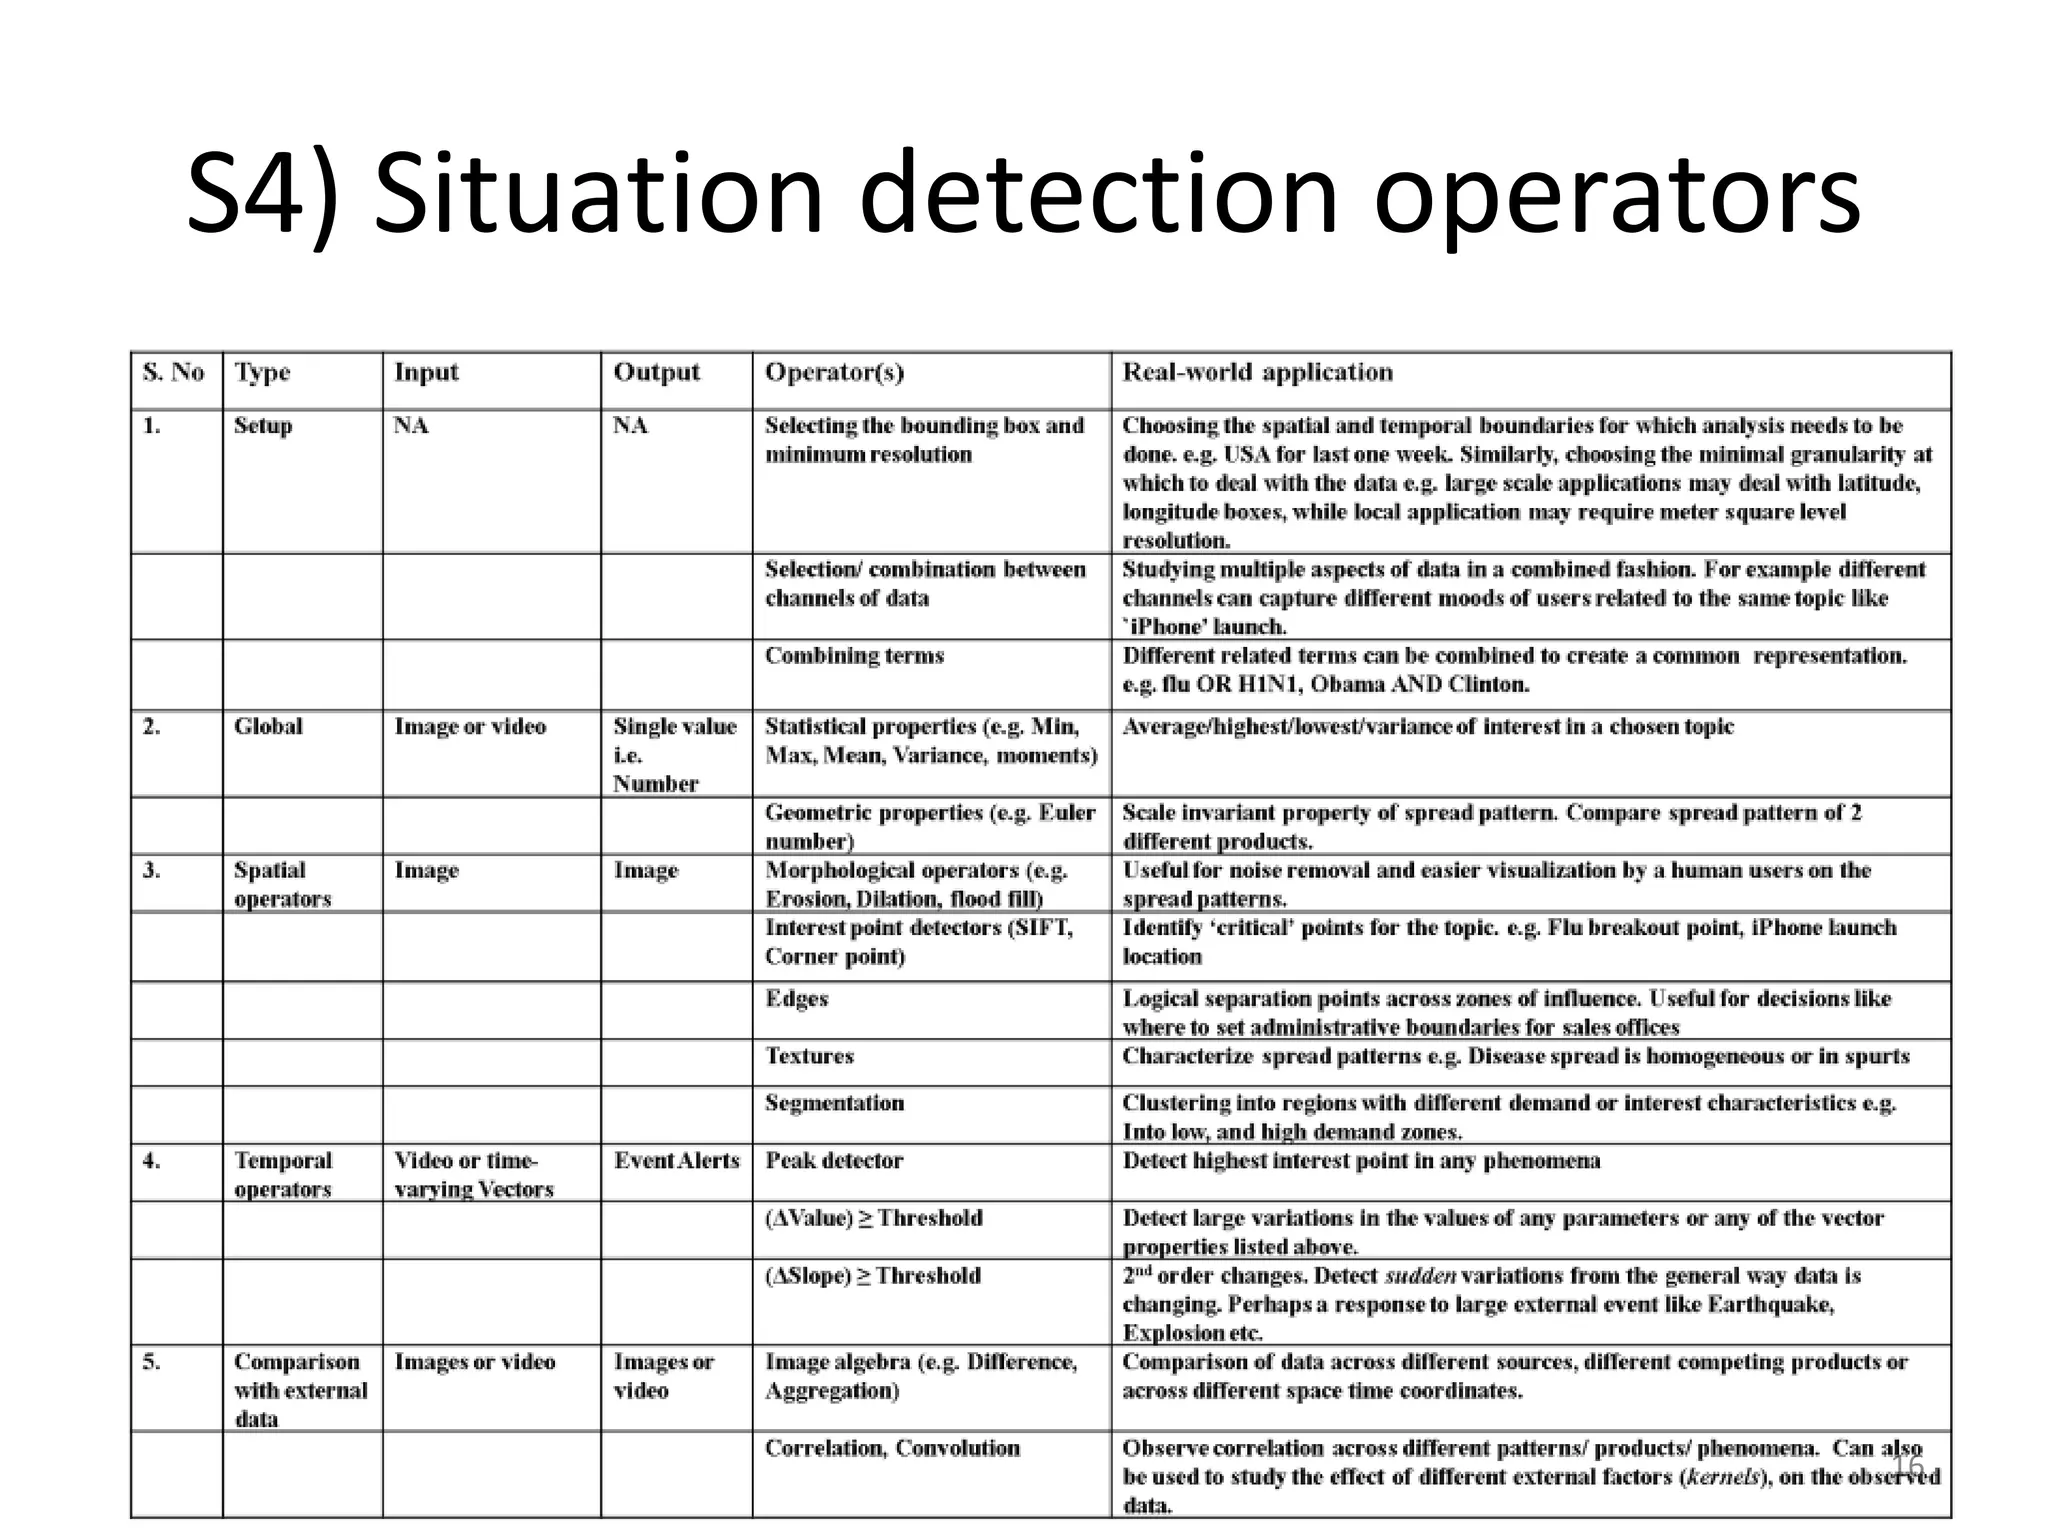
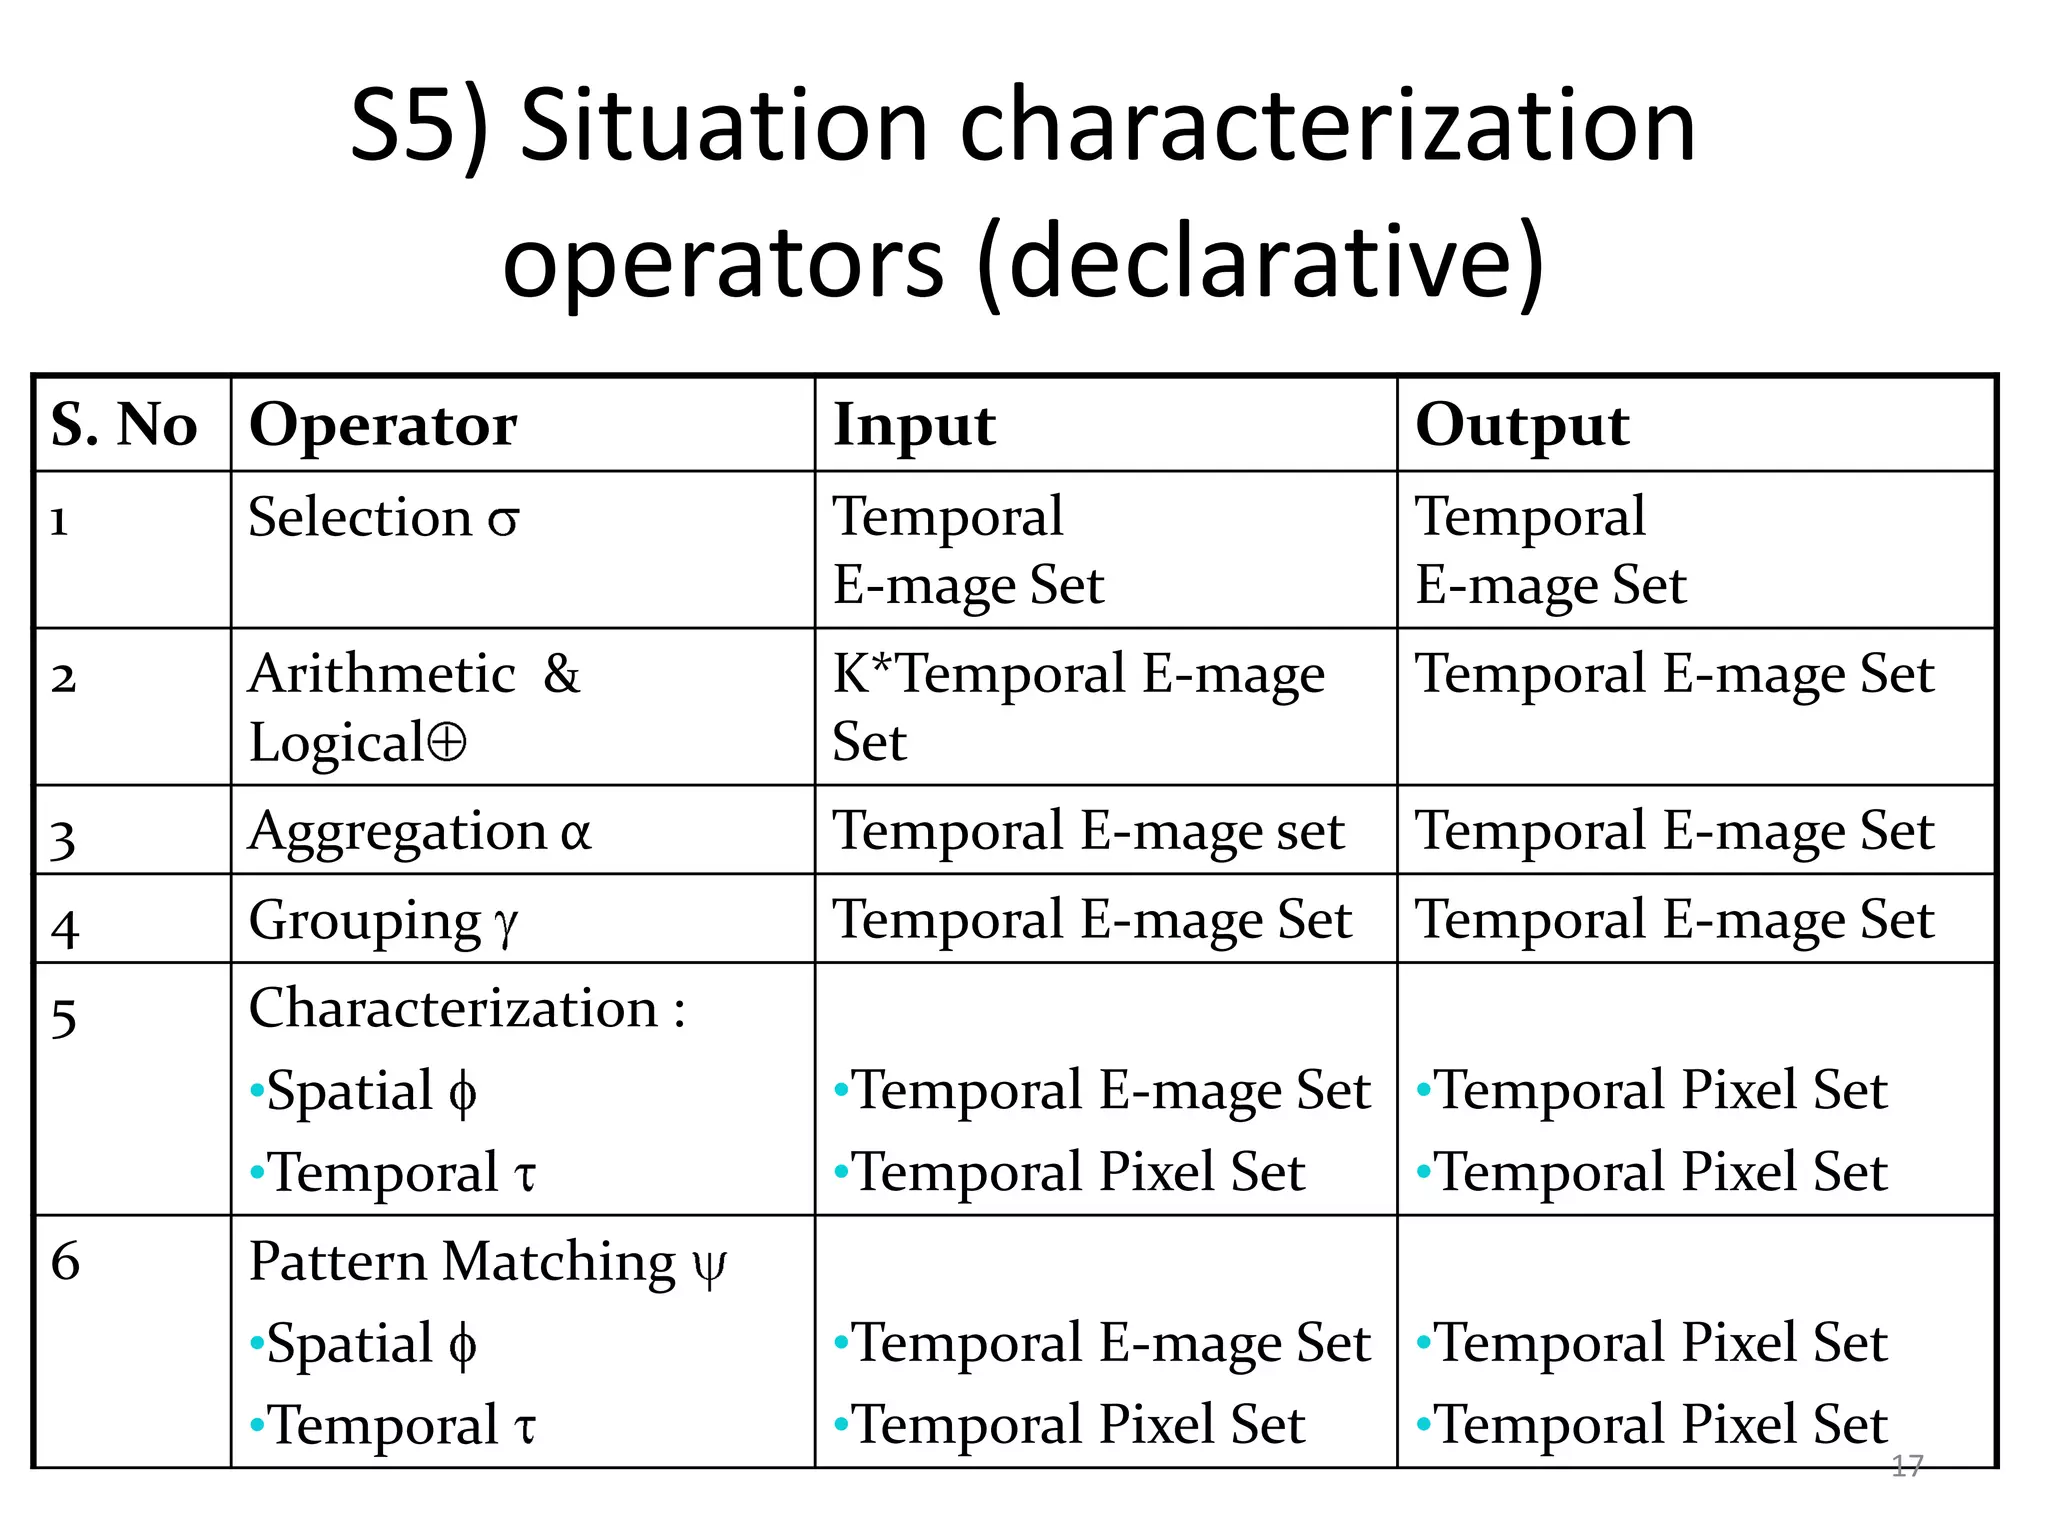
S5) Situation characterization
operators (declarative)
S. No Operator Input Output
1 Selection Temporal Temporal
E-mage Set E-mage Set
2 Arithmetic & K*Temporal E-mage Temporal E-mage Set
Logical Set
3 Aggregation α Temporal E-mage set Temporal E-mage Set
4 Grouping Temporal E-mage Set Temporal E-mage Set
5 Characterization :
•Spatial •Temporal E-mage Set •Temporal Pixel Set
•Temporal •Temporal Pixel Set •Temporal Pixel Set
6 Pattern Matching
•Spatial •Temporal E-mage Set •Temporal Pixel Set
•Temporal •Temporal Pixel Set •Temporal Pixel Set
17
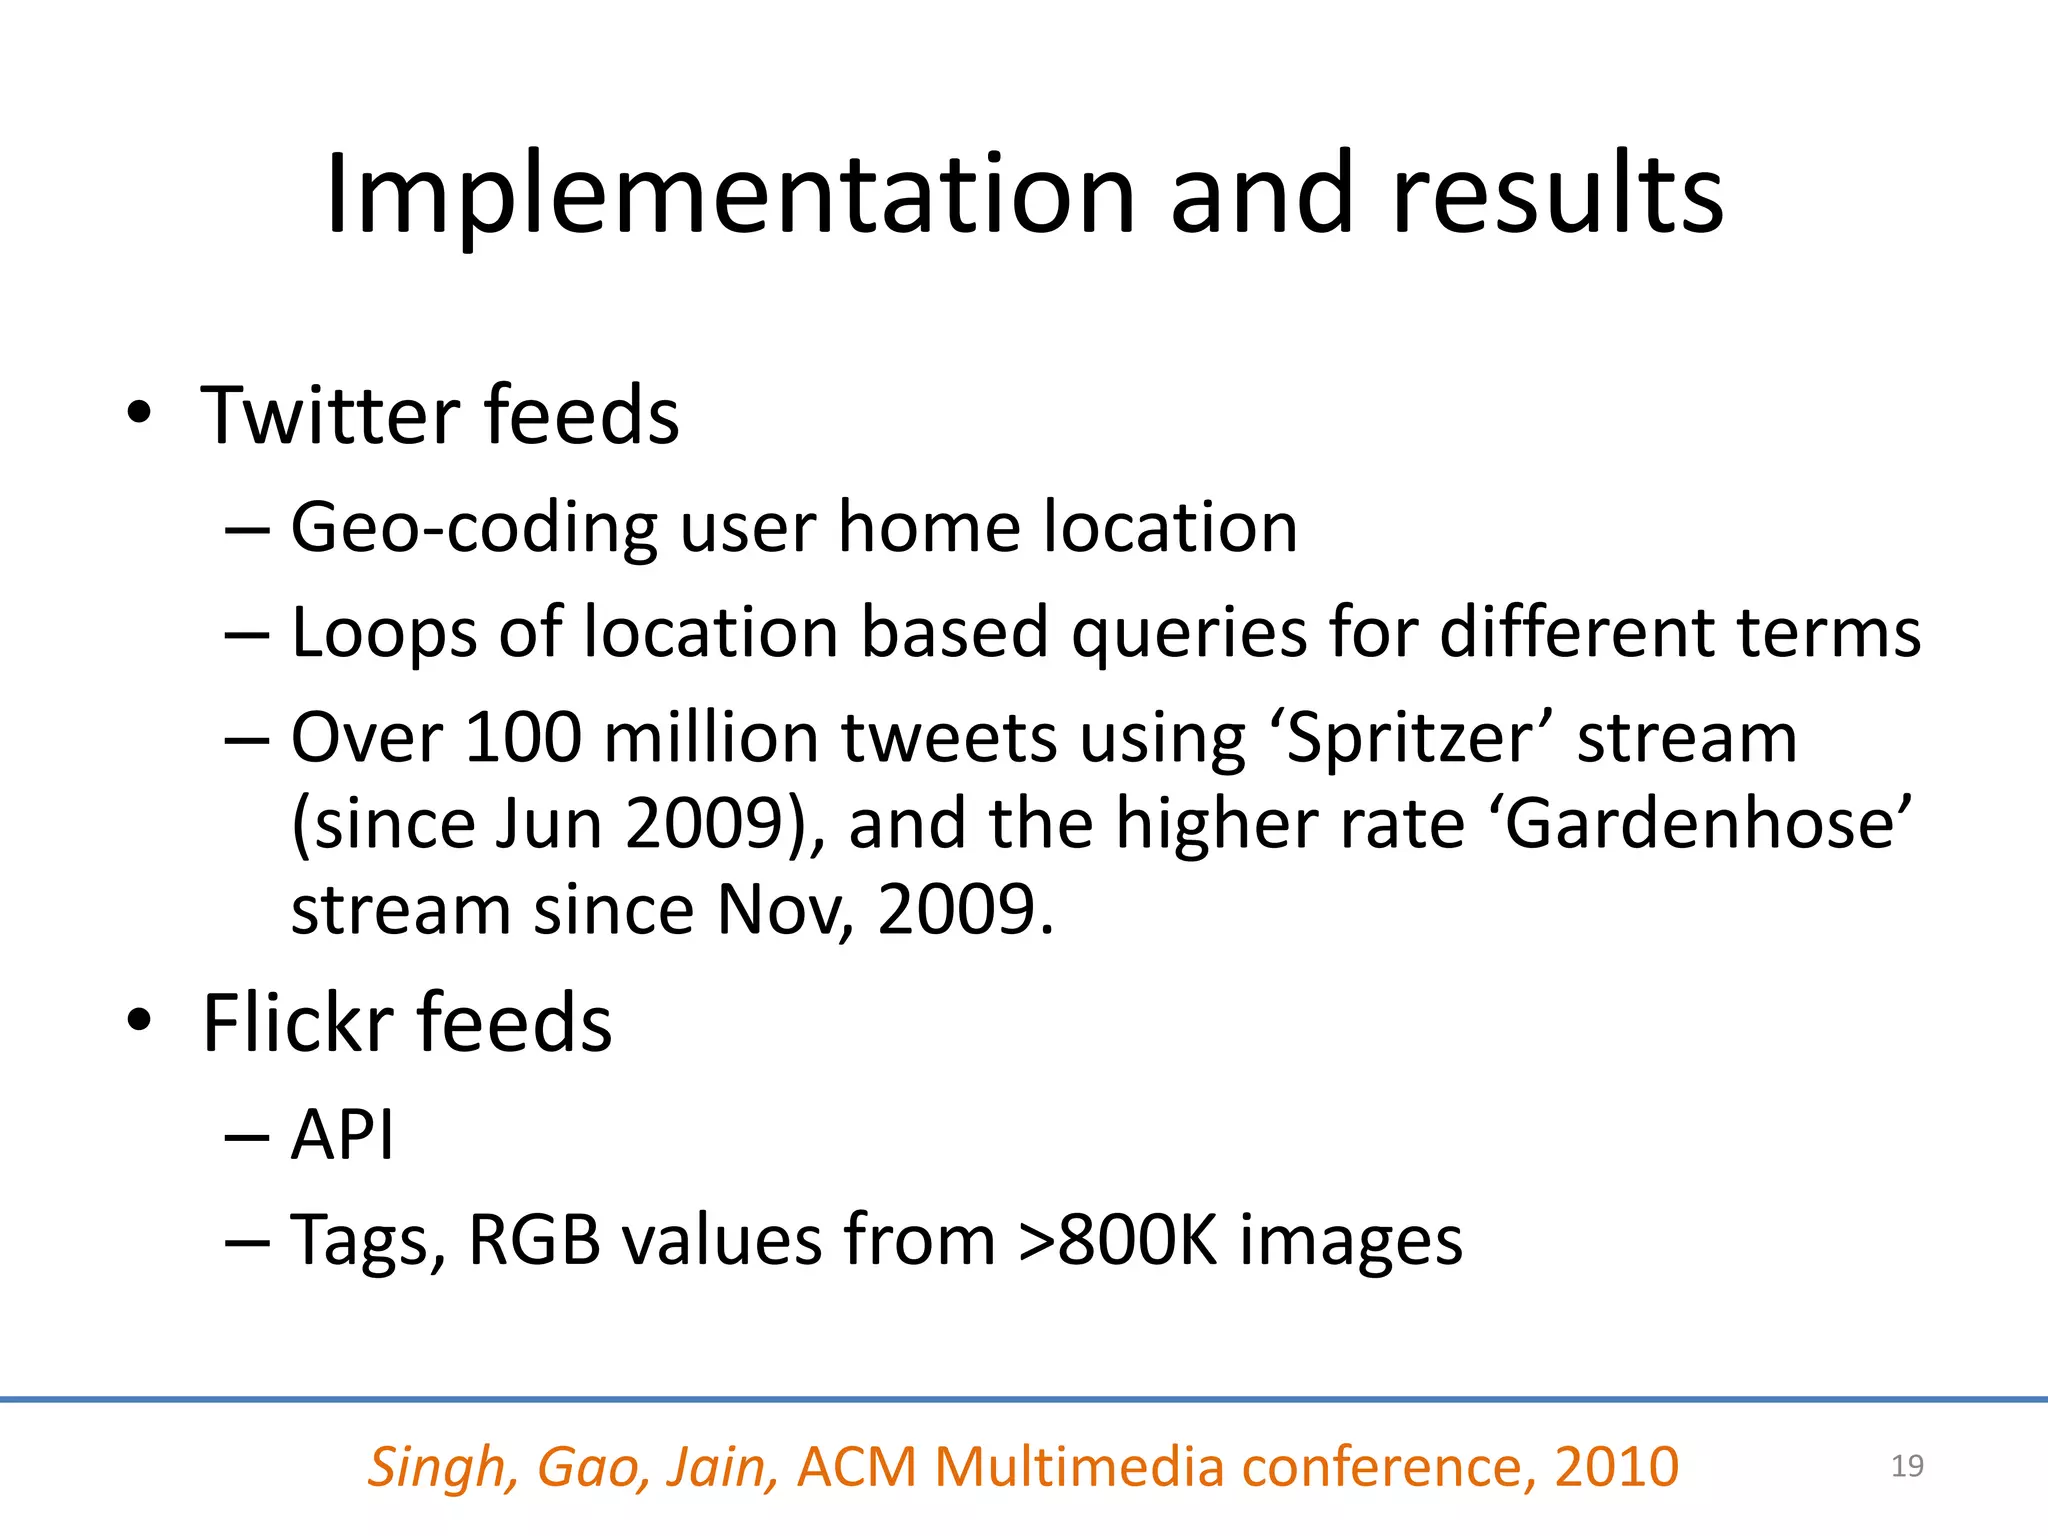
Implementation and results
•Twitter feeds
– Geo-coding user home location
– Loops of location based queries for different terms
– Over 100 million tweets using ‘Spritzer’ stream
(since Jun 2009), and the higher rate ‘Gardenhose’
stream since Nov, 2009.
• Flickr feeds
– API
– Tags, RGB values from >800K images
Singh, Gao, Jain, ACM Multimedia conference, 2010 19
20.
iPhone theme AT&T
based e-mage, retail
Jun 2 to Jun 11 locations
. Convolution
Store
+ Add
* catchment
area
Subtract
Aggregate AT&T total
interest - catchment
area
<geoname>
Convolution
. Maxima Decision
<name>College City</name>
<lat>39.0057303</lat>
<lng>-122.0094129</lng>
Best Location is at <geonameId>5338600</geonameId>
* Geocode [39, -122] ,
just north of Bay
Area, CA
<countryCode>US</countryCode>
<countryName>United
States</countryName>
<fcl>P</fcl>
<fcode>PPL</fcode>
<fclName>city, village,...</fclName>
<fcodeName>populated
place</fcodeName>
<population/>
Under-served <distance>1.0332</distance>
</geoname>
interest areas Store catchment 20
Seasonal characteristics analysis
•Show me the difference between red and
green colors for New England region, as it
varies throughout the year
( -( sum ( t <= 1yr theme = Green R=[(40,-76), (44,-71)] (TES)),
sum( t <= 1yr theme = Red R=[(40,-76), (44,-71)] (TES))))
22
23.
Variations throughout theyear
– Fall colors of New England
– [R-G] channel data
0
Jan Dec
• Total Energy
Jan Dec
23
24.
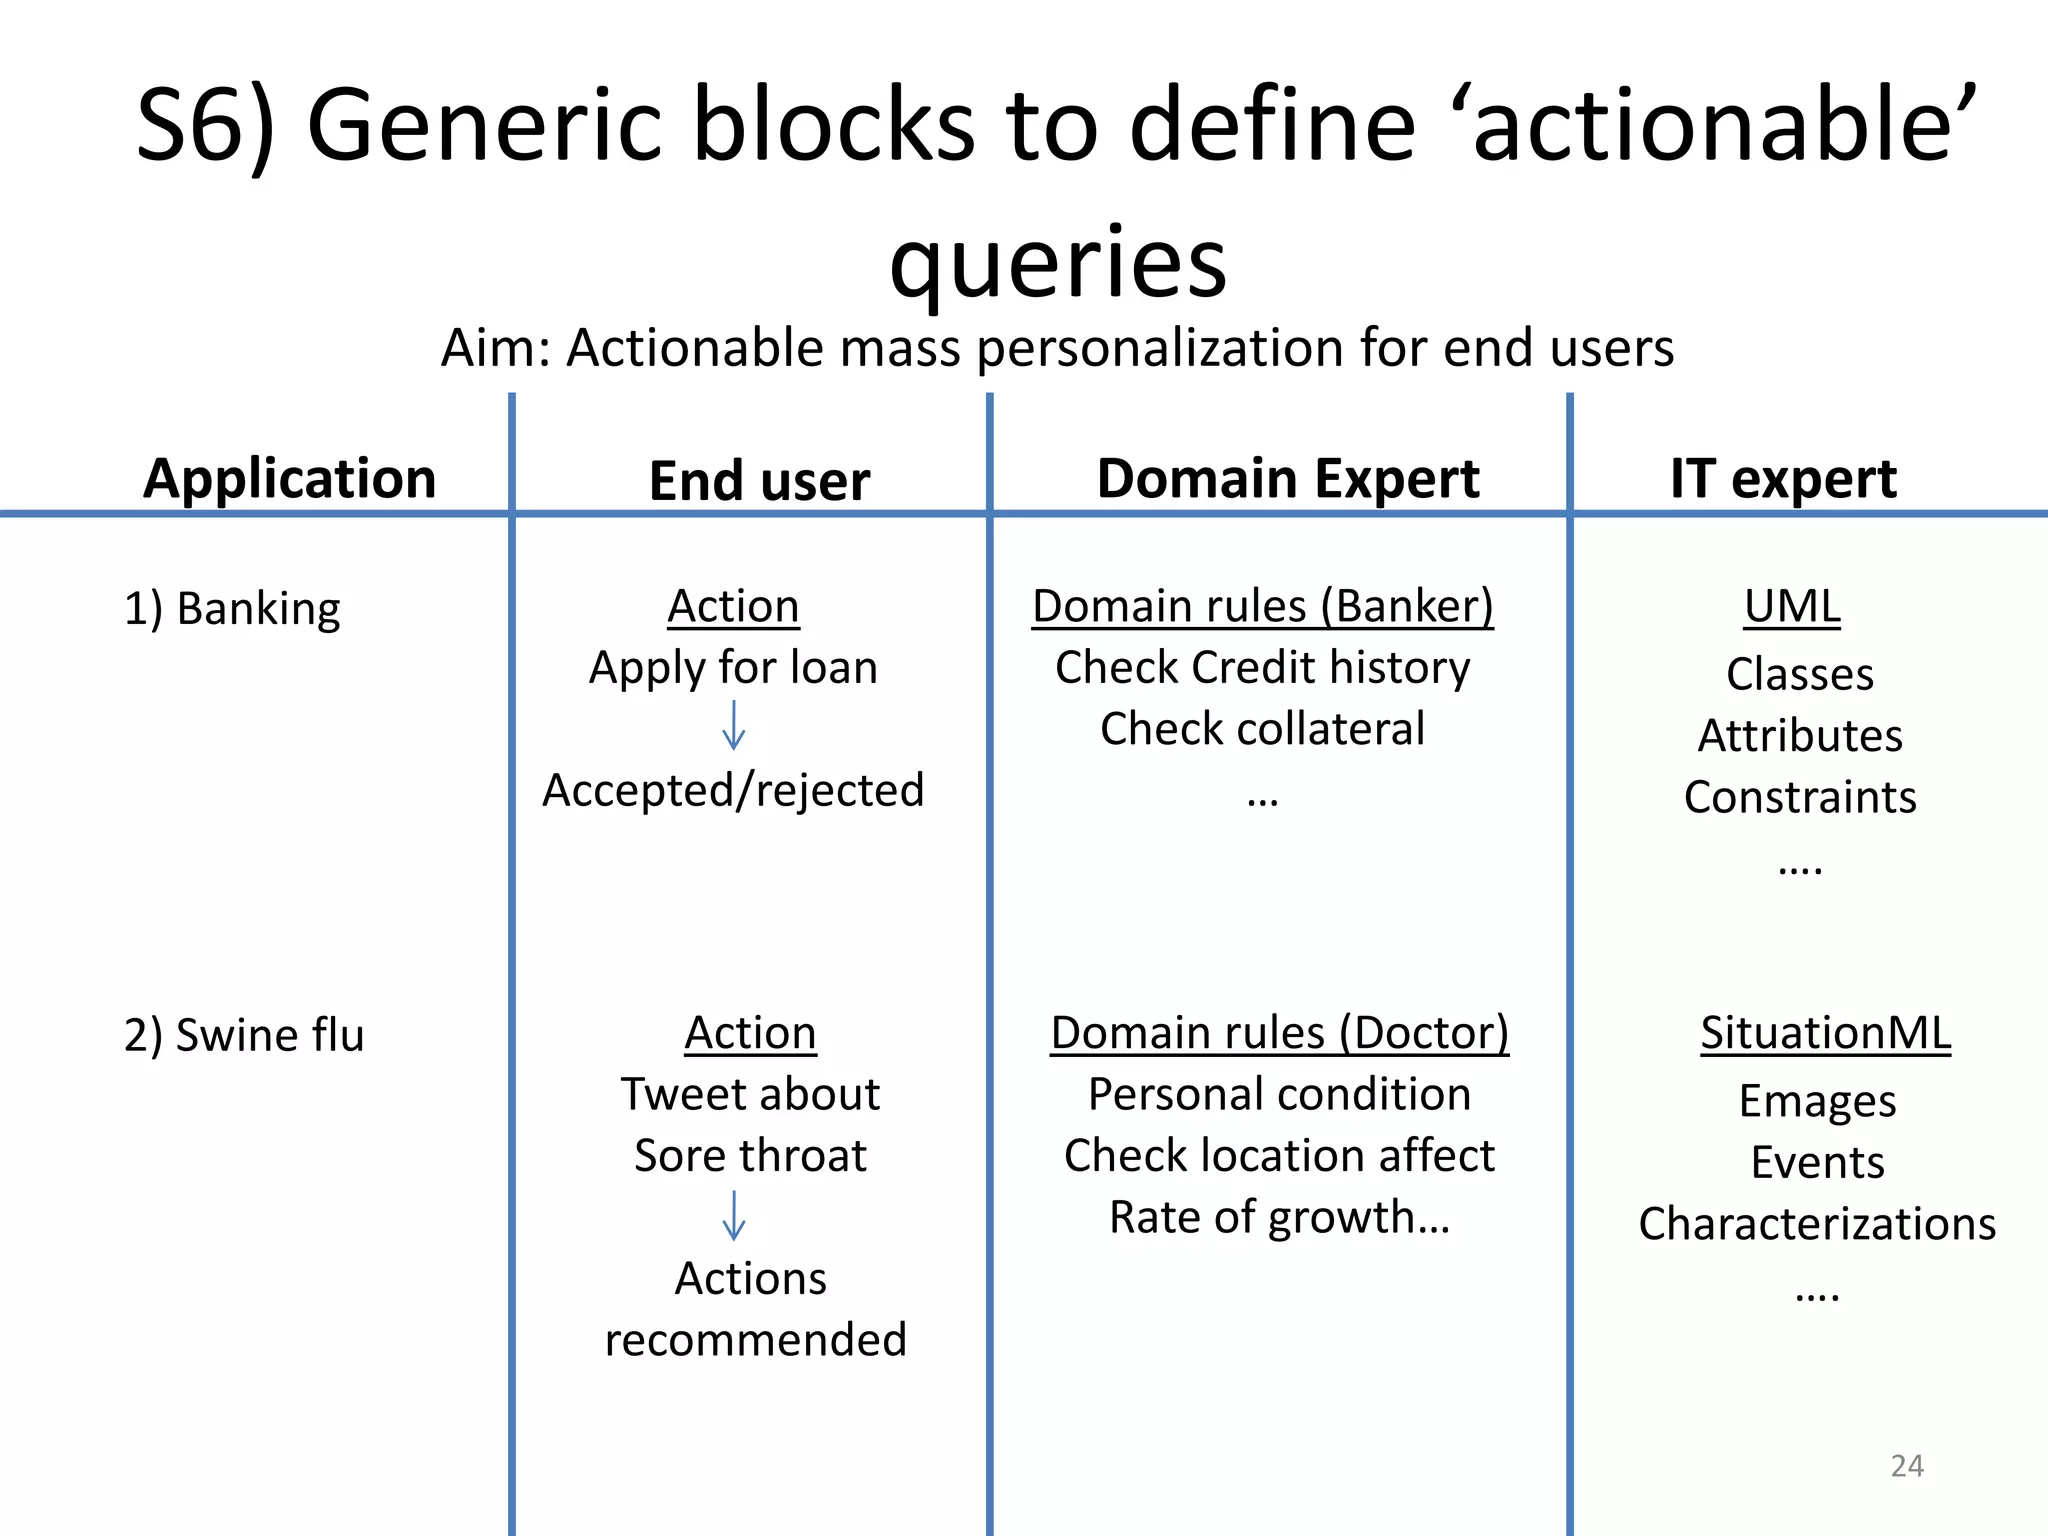
S6) Generic blocksto define ‘actionable’
queries
Aim: Actionable mass personalization for end users
Application End user Domain Expert IT expert
1) Banking Action Domain rules (Banker) UML
Apply for loan Check Credit history Classes
Check collateral Attributes
Accepted/rejected … Constraints
….
2) Swine flu Action Domain rules (Doctor) SituationML
Tweet about Personal condition Emages
Sore throat Check location affect Events
Rate of growth… Characterizations
Actions ….
recommended
24
25.
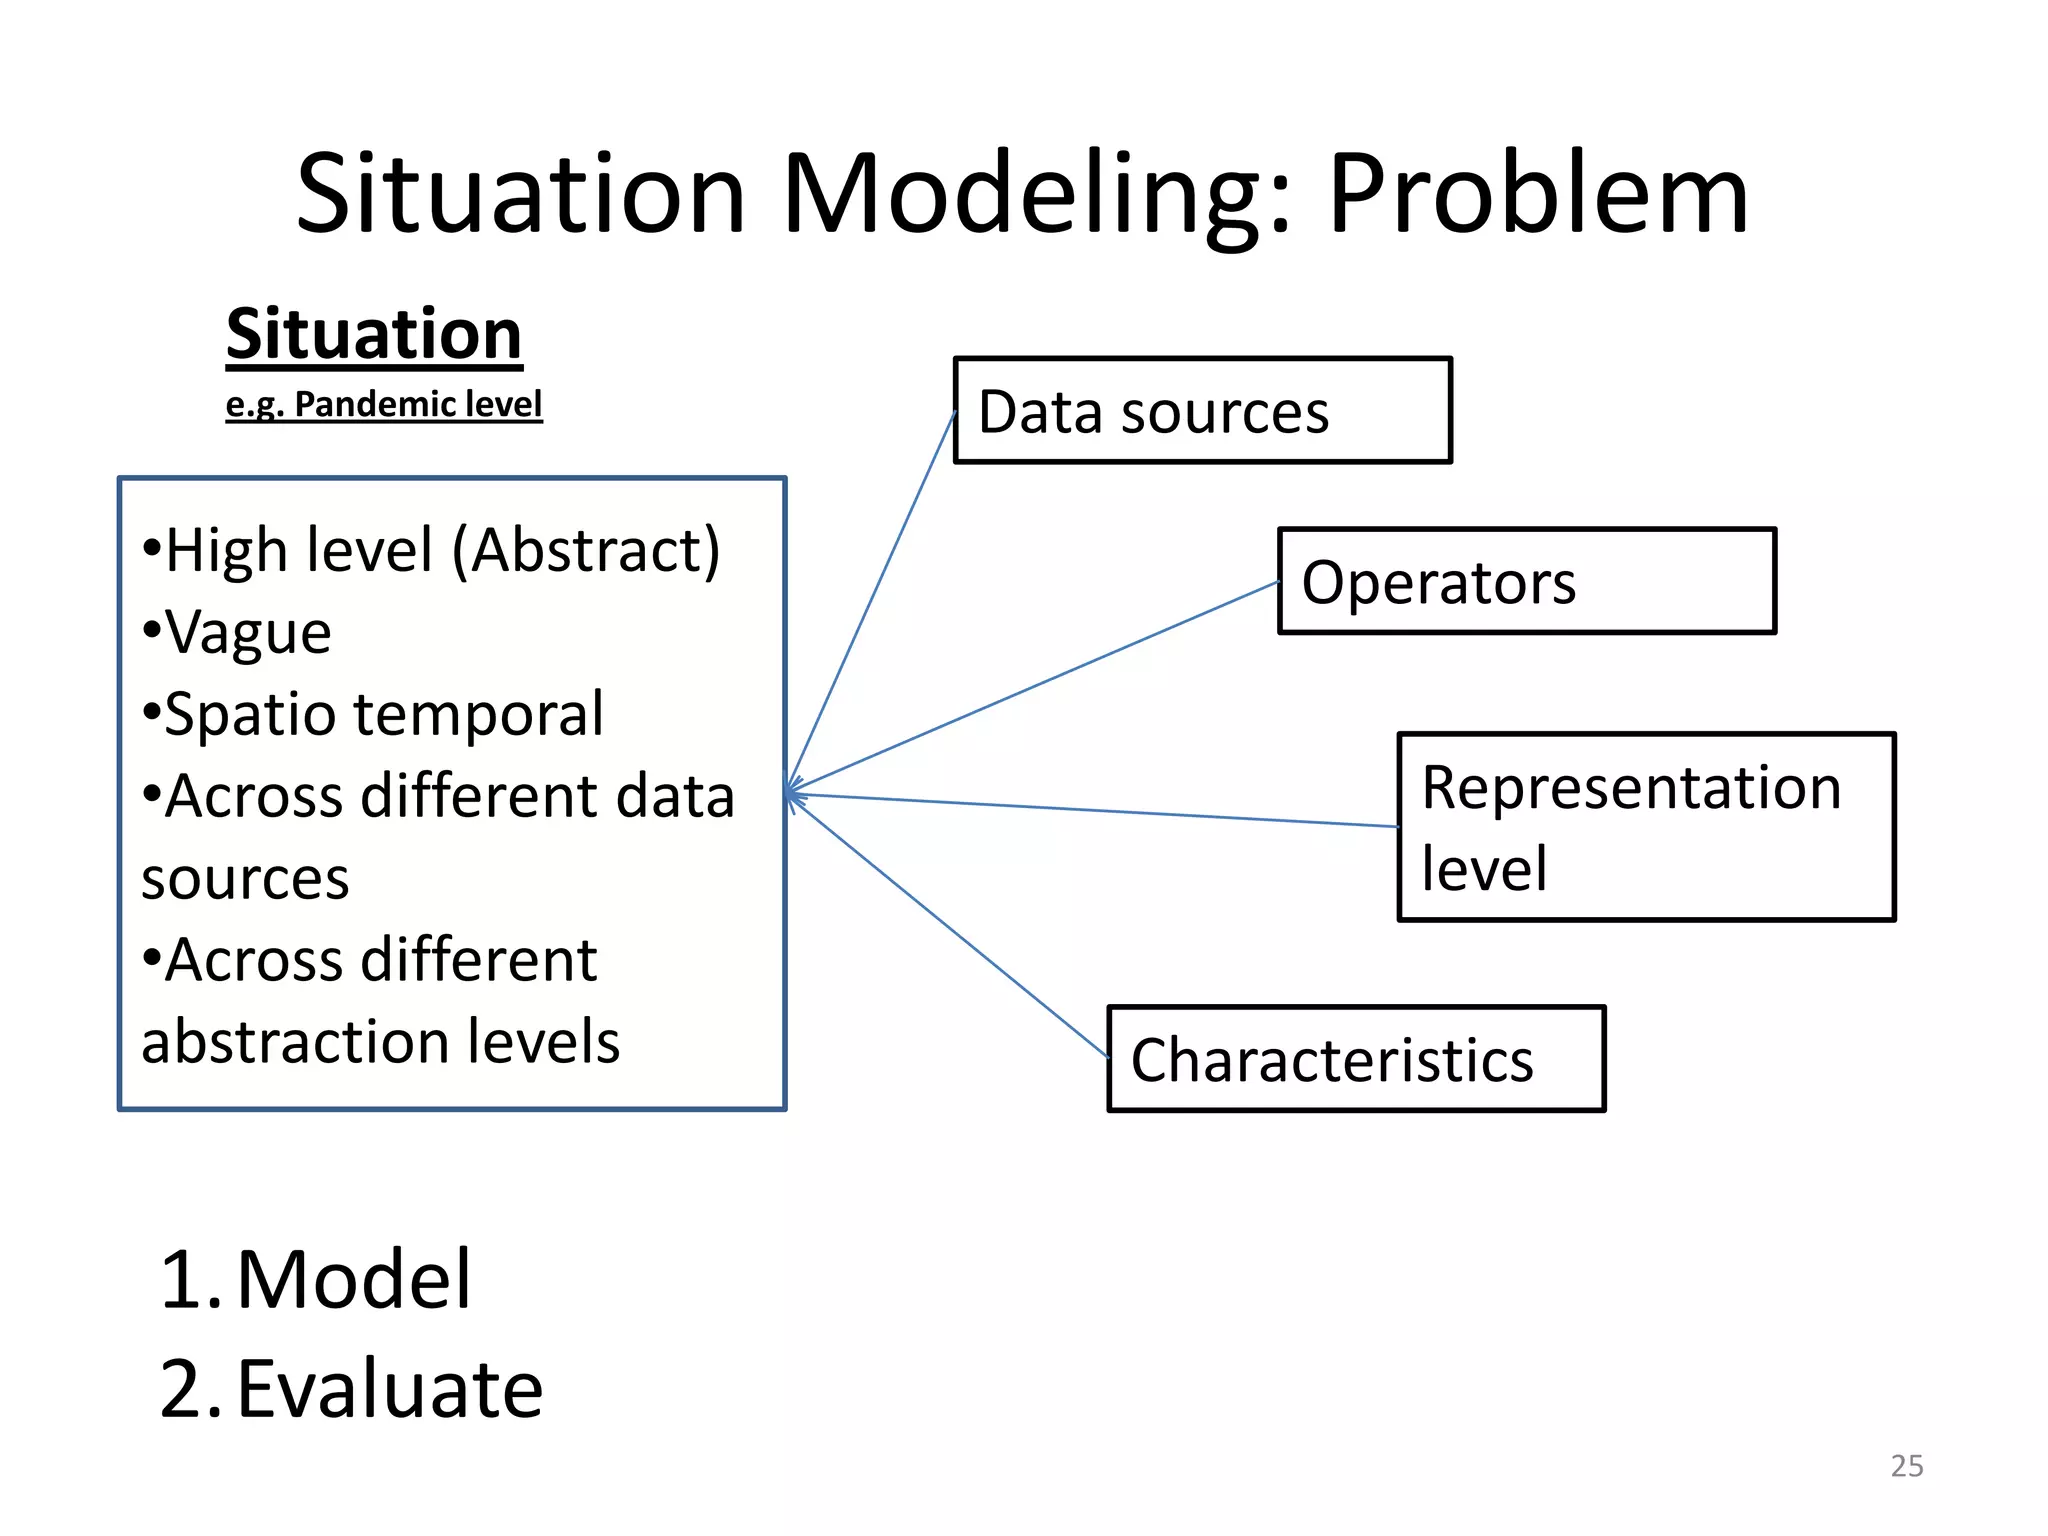
Situation Modeling: Problem
Situation
e.g. Pandemic level Data sources
•High level (Abstract) Operators
•Vague
•Spatio temporal
•Across different data Representation
sources level
•Across different
abstraction levels Characteristics
1.Model
2.Evaluate
25
26.
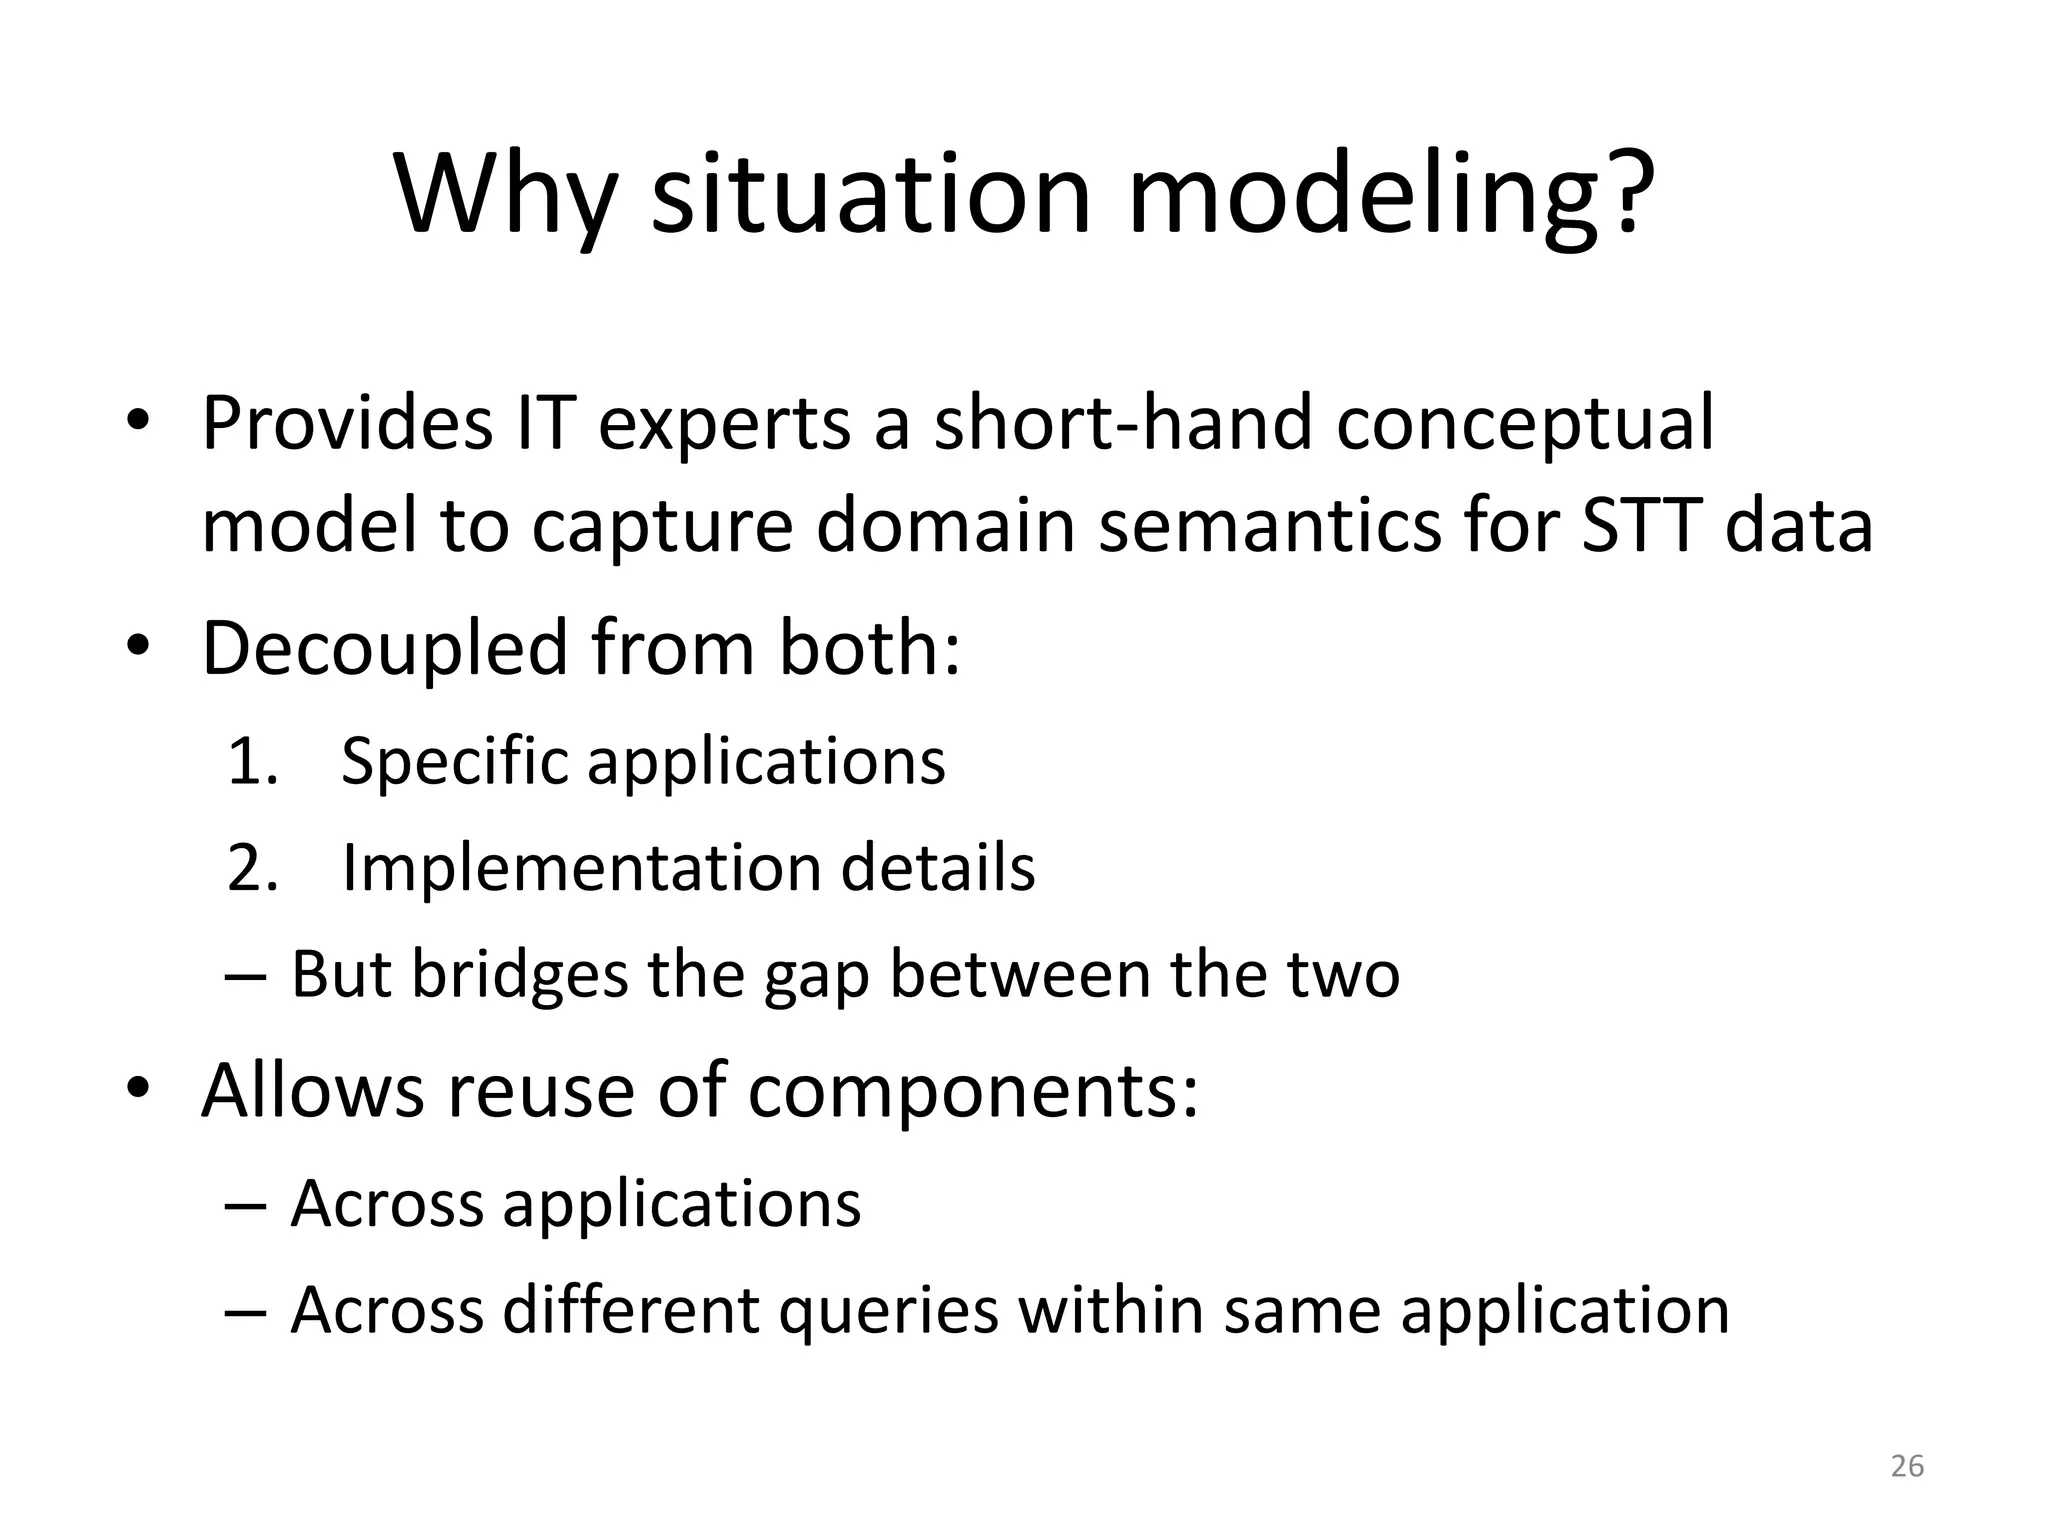
Why situation modeling?
•Provides IT experts a short-hand conceptual
model to capture domain semantics for STT data
• Decoupled from both:
1. Specific applications
2. Implementation details
– But bridges the gap between the two
• Allows reuse of components:
– Across applications
– Across different queries within same application
26
27.
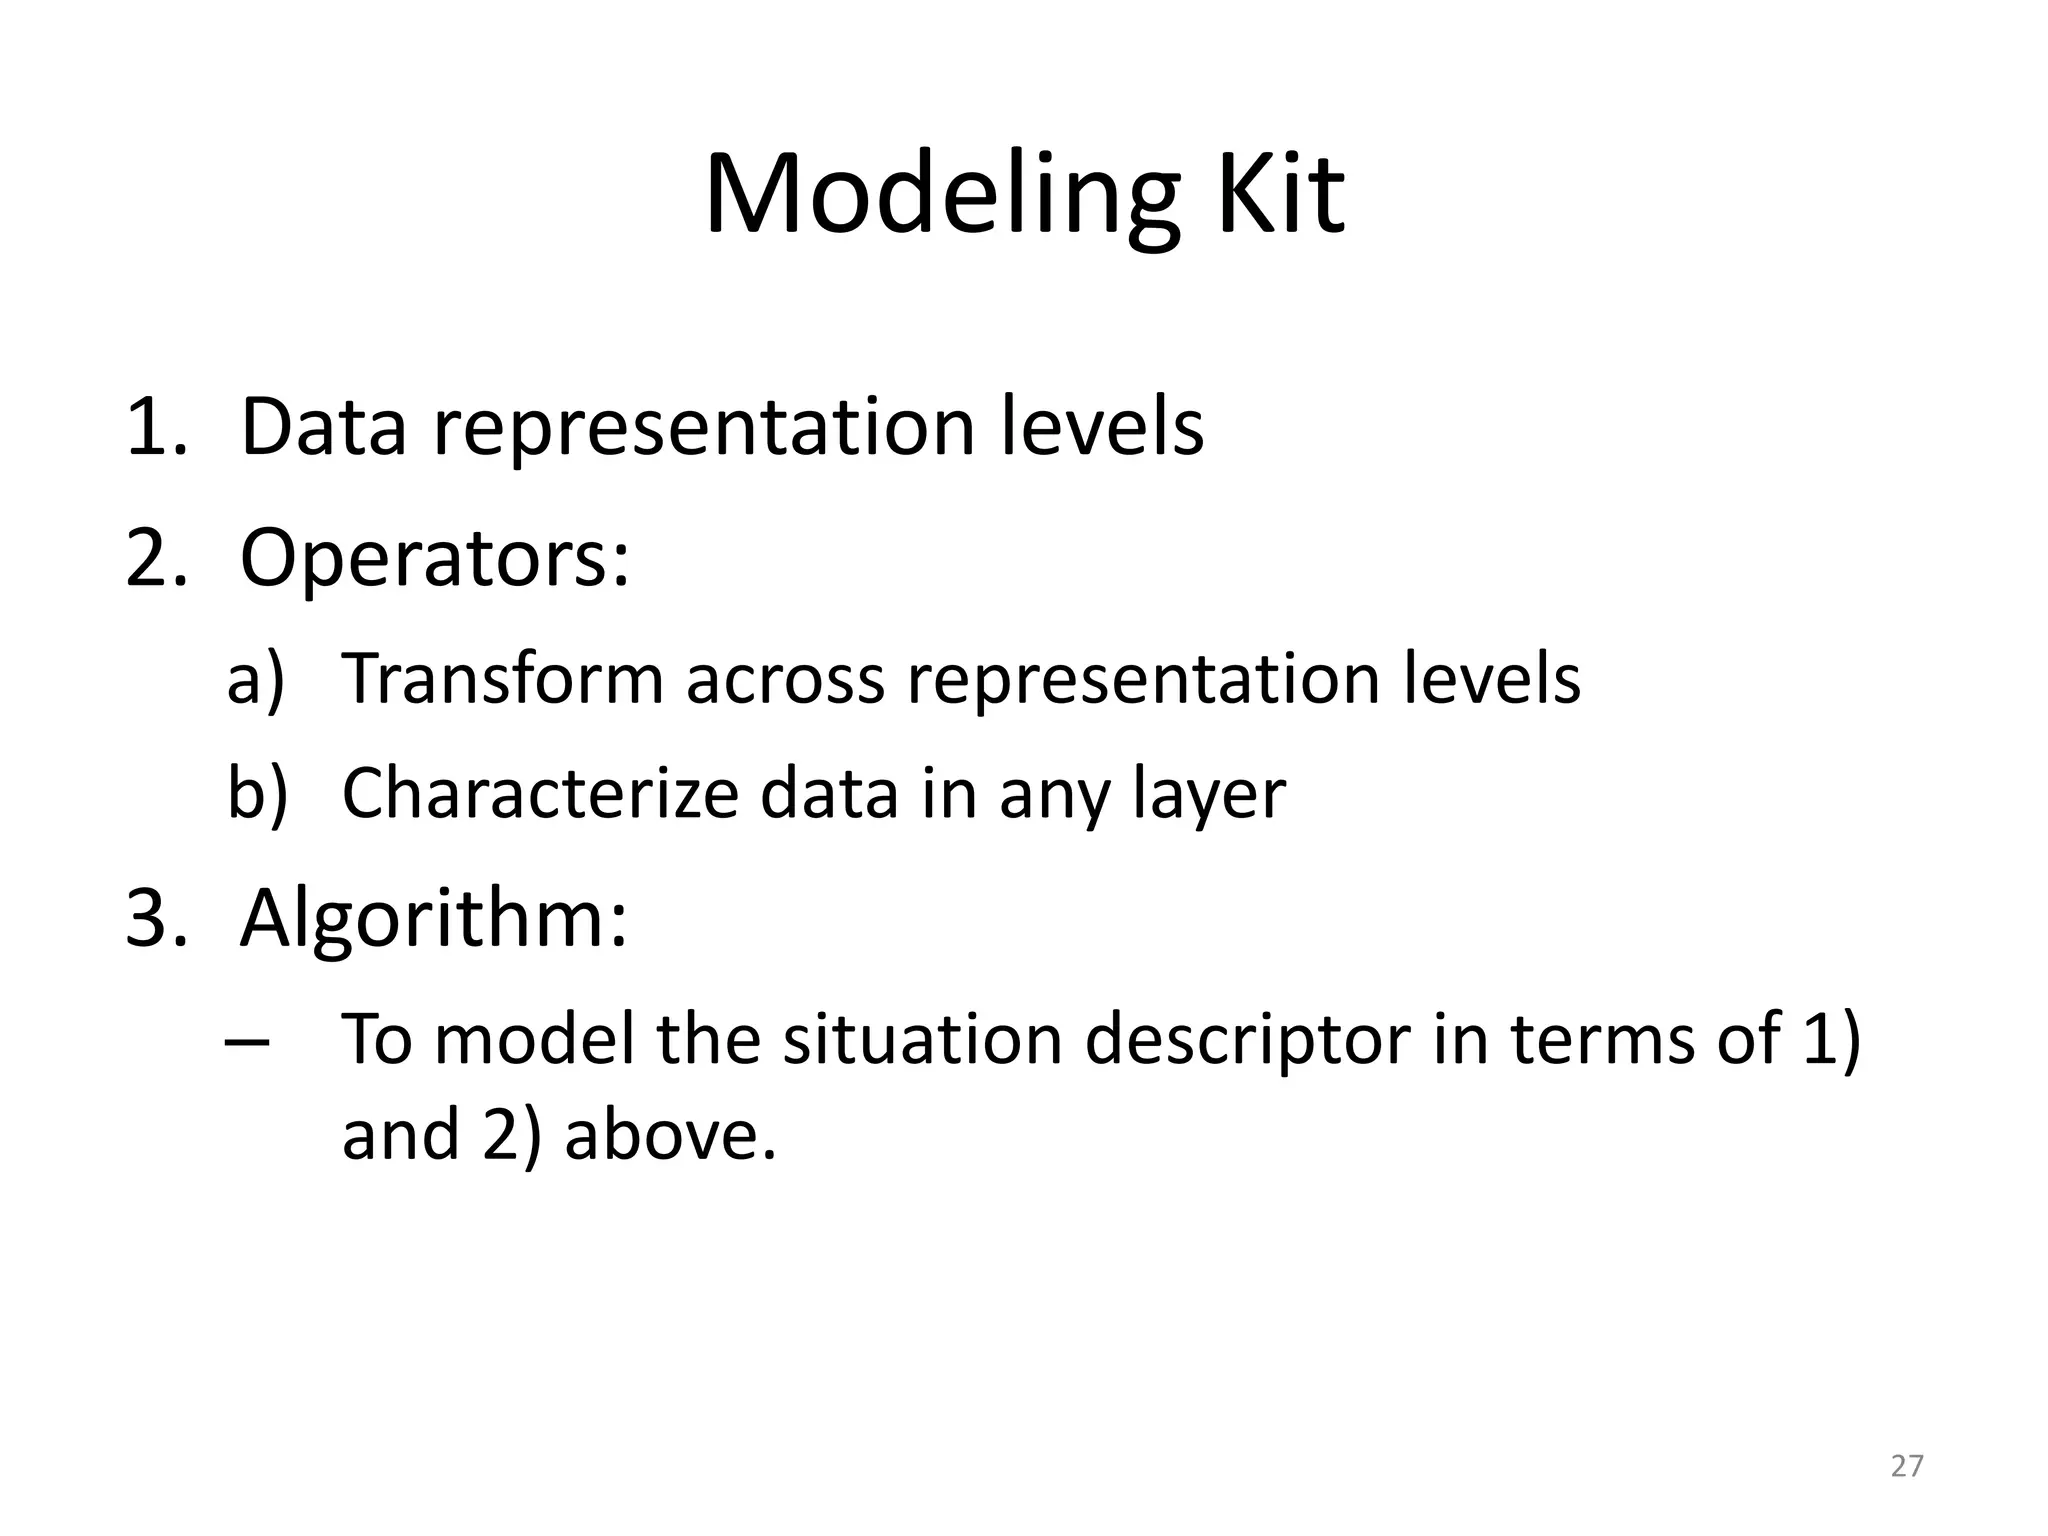
Modeling Kit
1. Datarepresentation levels
2. Operators:
a) Transform across representation levels
b) Characterize data in any layer
3. Algorithm:
– To model the situation descriptor in terms of 1)
and 2) above.
27
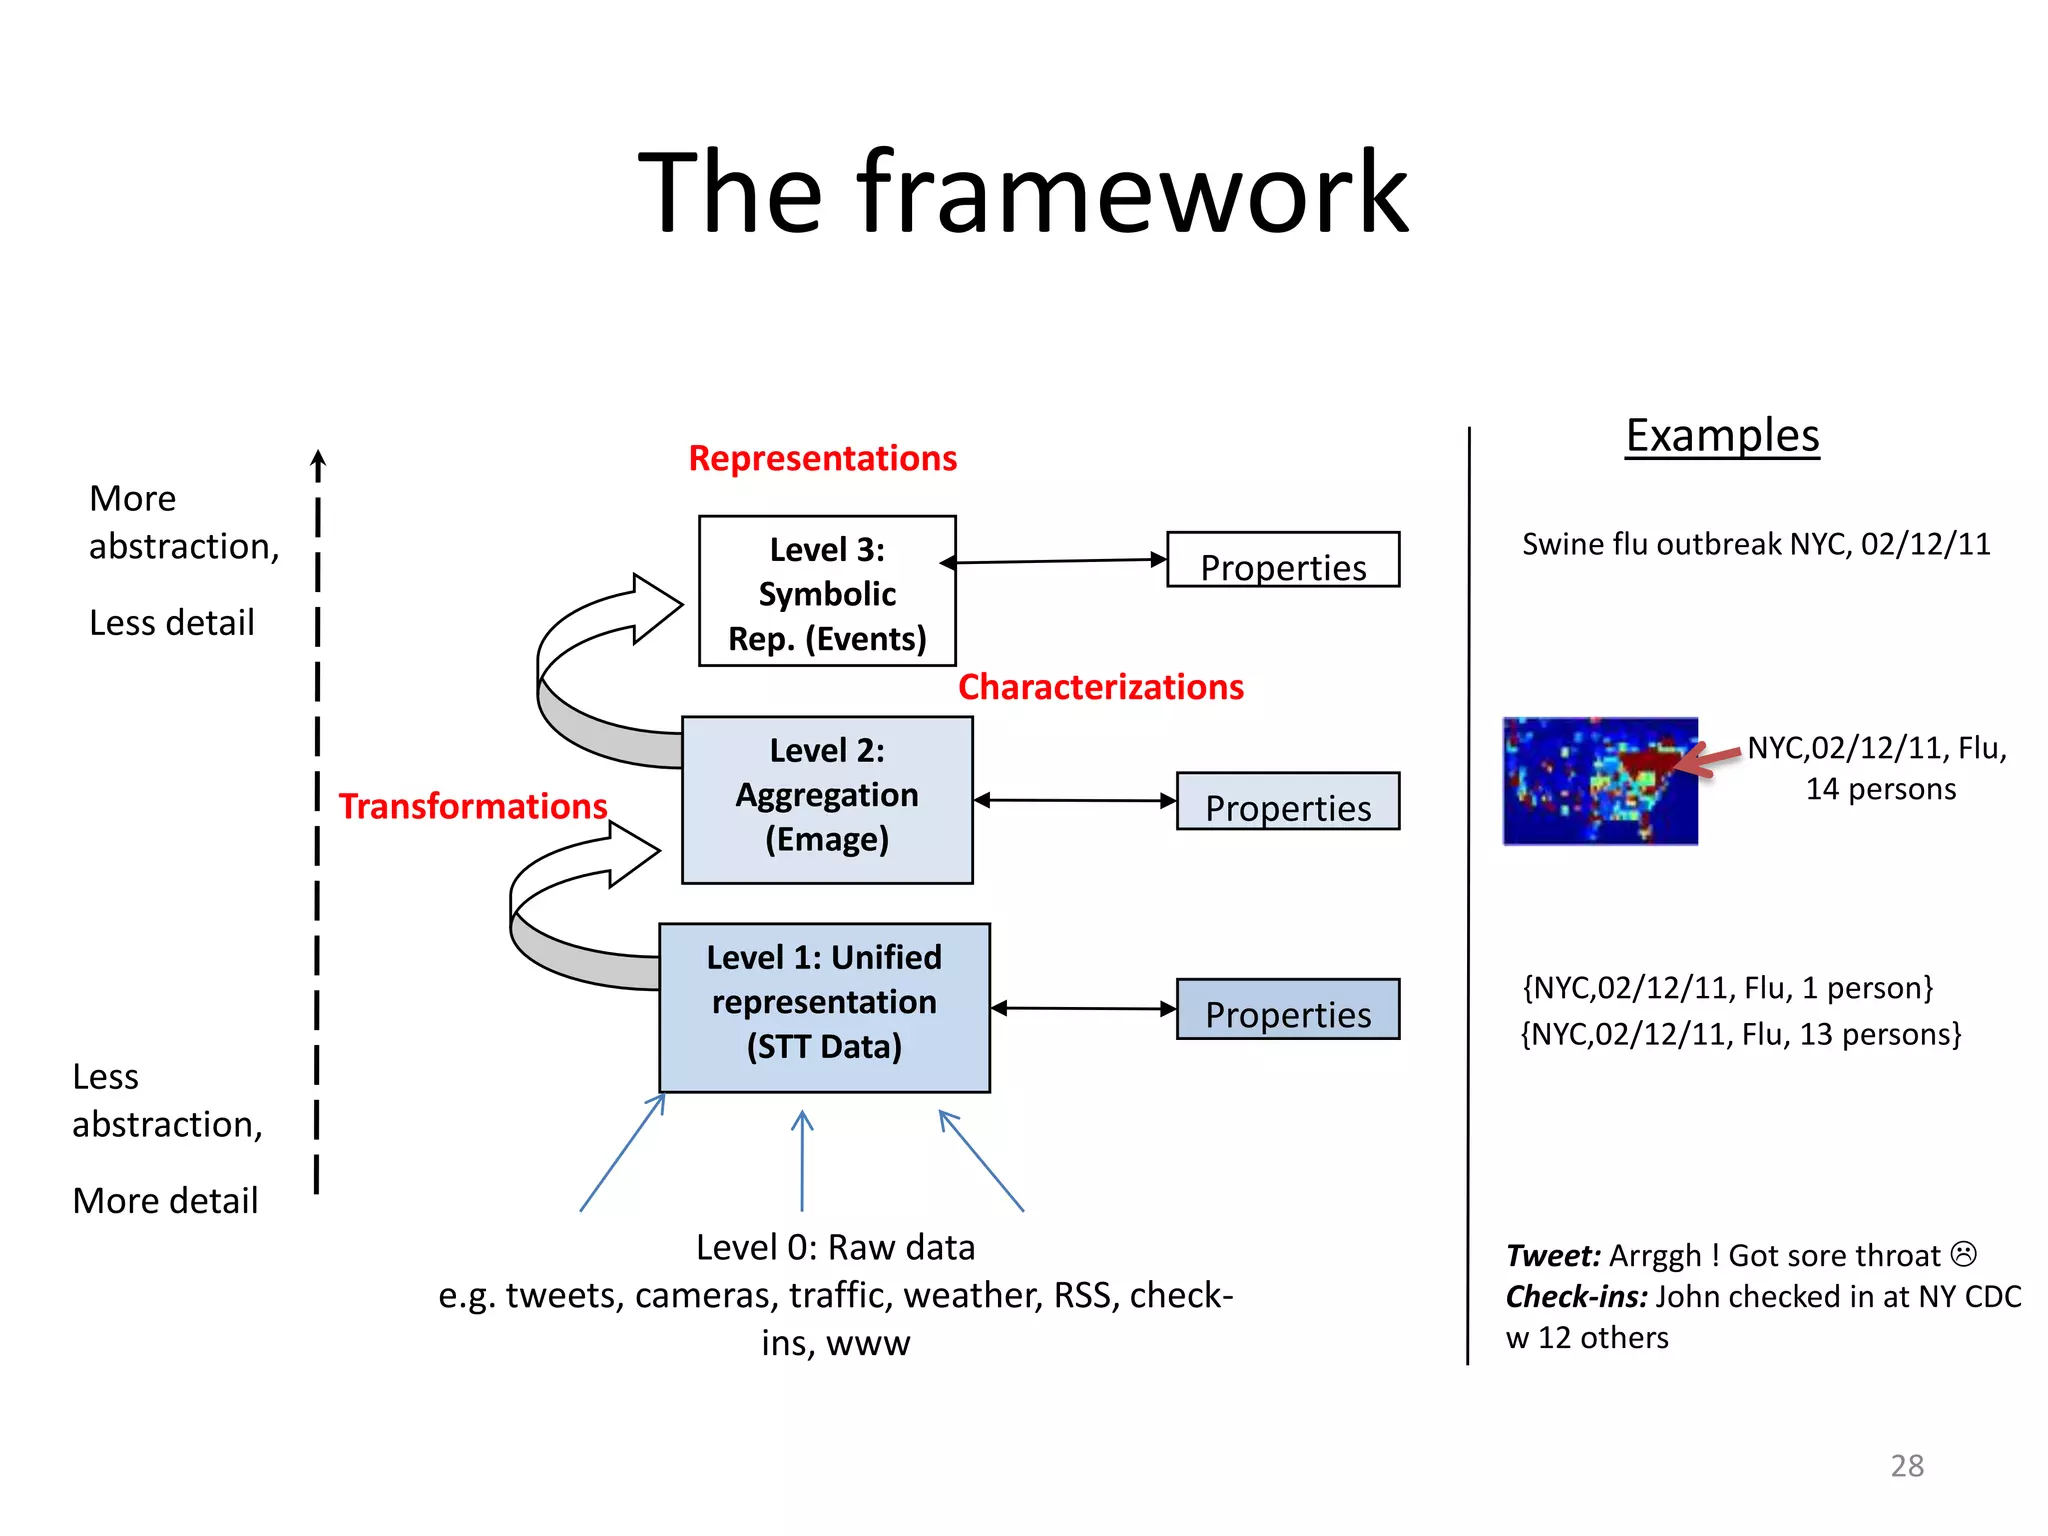
28.
The framework
Representations Examples
More
abstraction, Level 3: Swine flu outbreak NYC, 02/12/11
Properties
Symbolic
Less detail Rep. (Events)
Characterizations
Level 2: NYC,02/12/11, Flu,
Aggregation 14 persons
Transformations Properties
(Emage)
Level 1: Unified
representation {NYC,02/12/11, Flu, 1 person}
Properties {NYC,02/12/11, Flu, 13 persons}
(STT Data)
Less
abstraction,
More detail
Level 0: Raw data Tweet: Arrggh ! Got sore throat
e.g. tweets, cameras, traffic, weather, RSS, check- Check-ins: John checked in at NY CDC
ins, www w 12 others
28
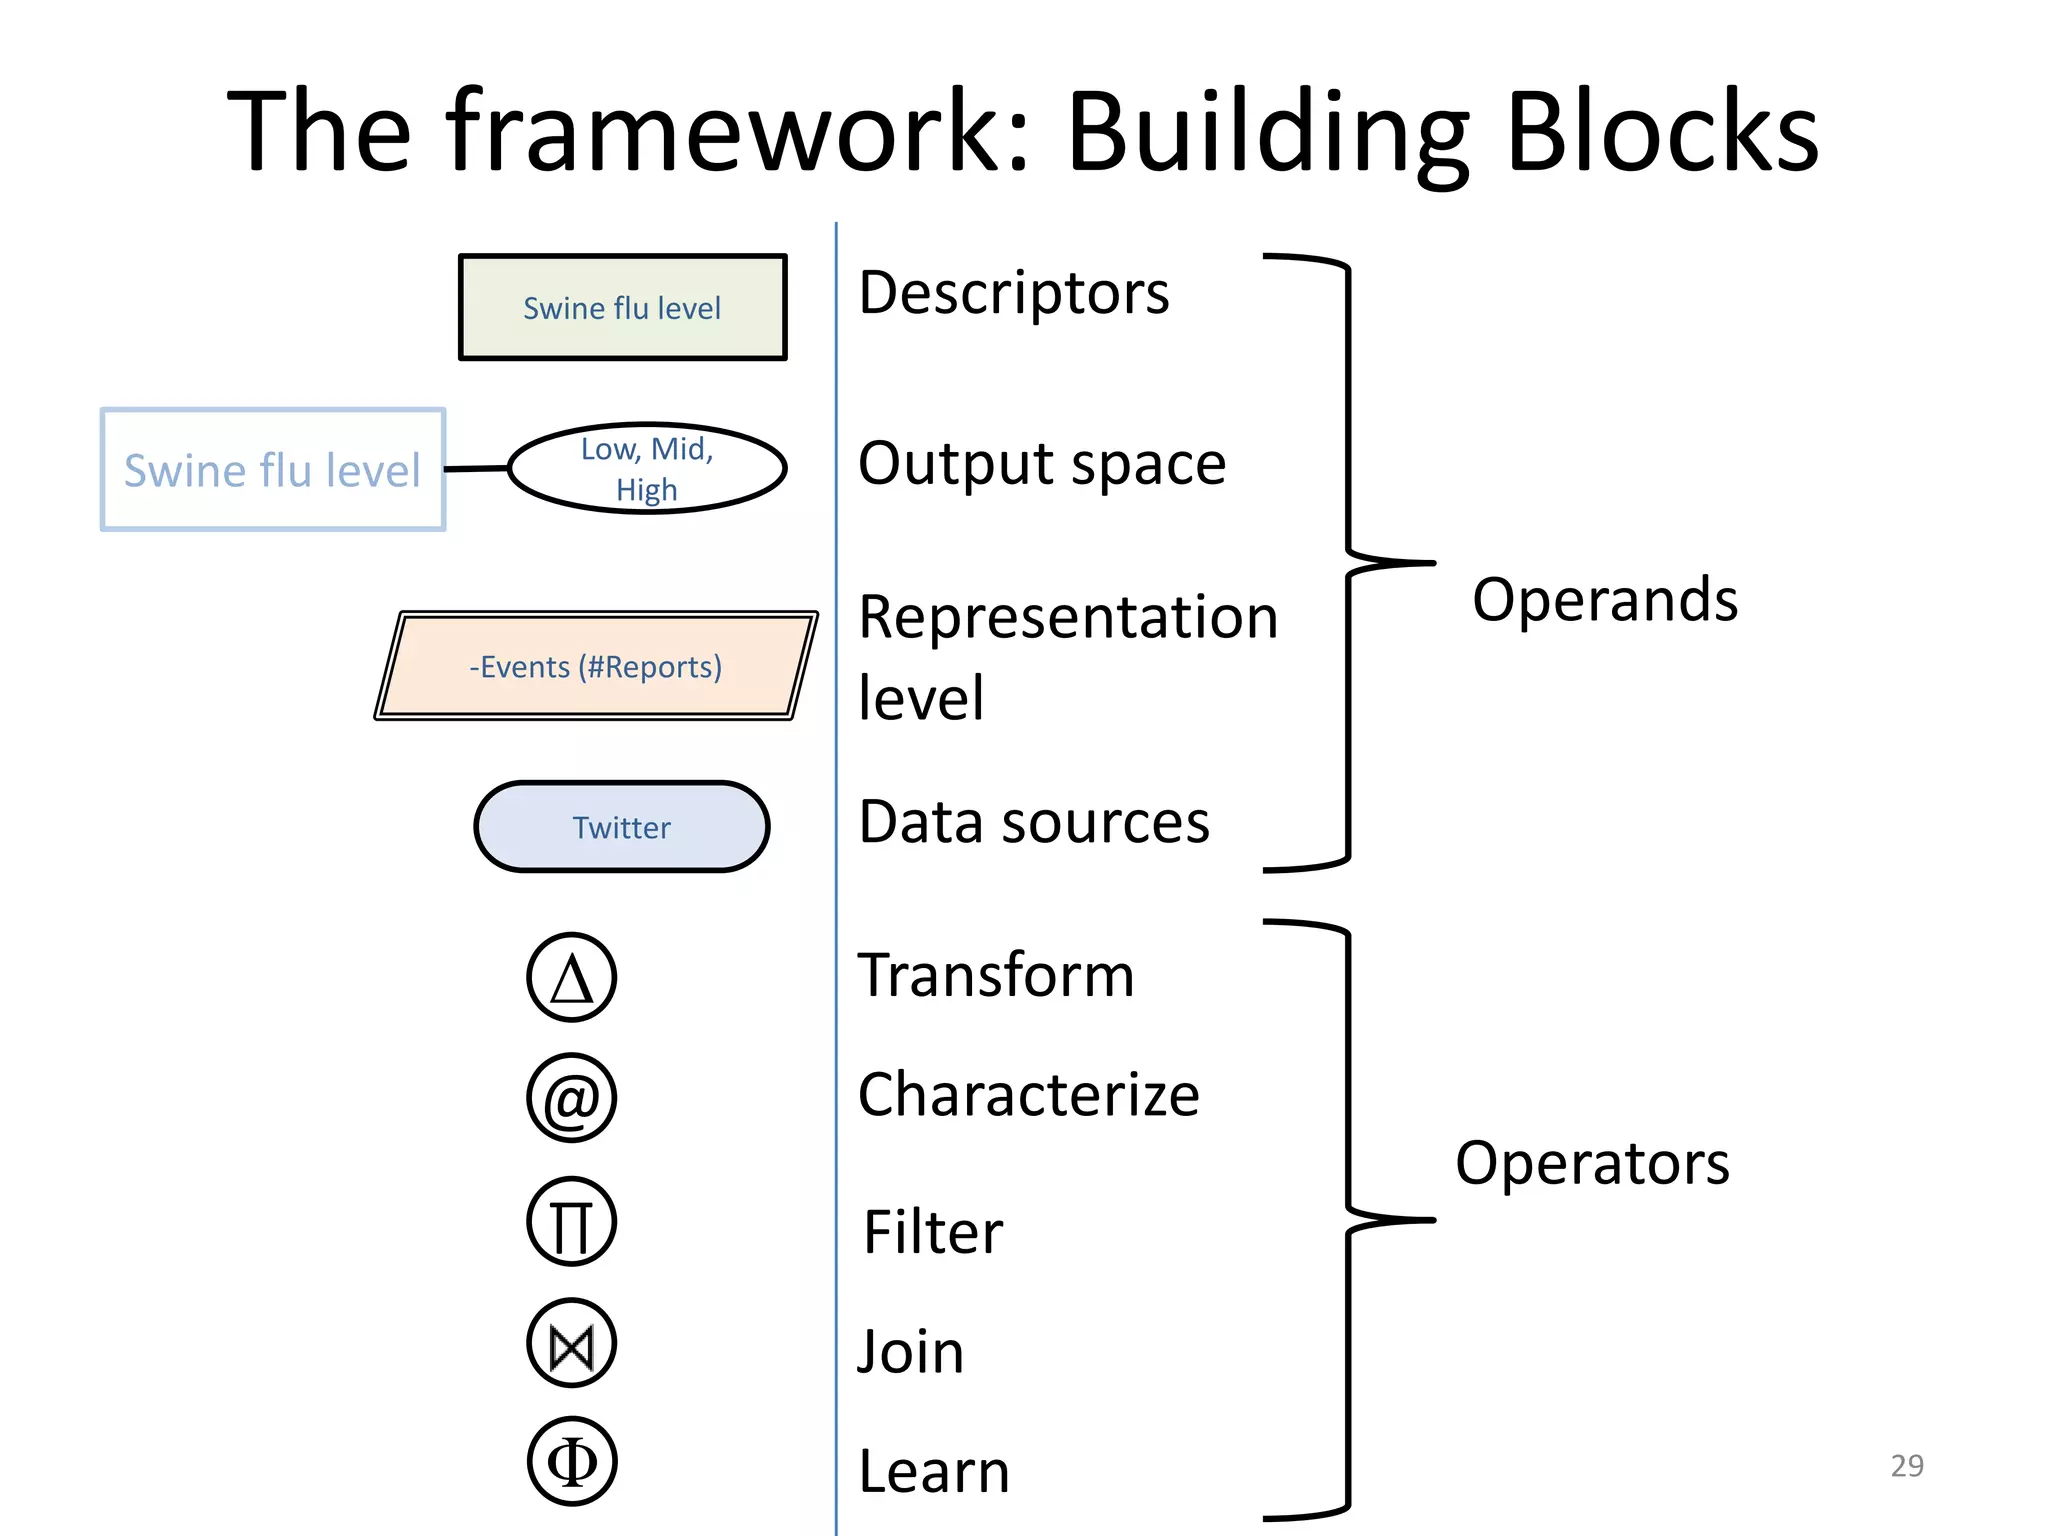
29.
The framework: BuildingBlocks
Swine flu level Descriptors
Swine flu level
Low, Mid,
High Output space
Representation Operands
-Events (#Reports)
level
Twitter Data sources
Δ Transform
@ Characterize
Operators
∏ Filter
Join
Φ Learn 29
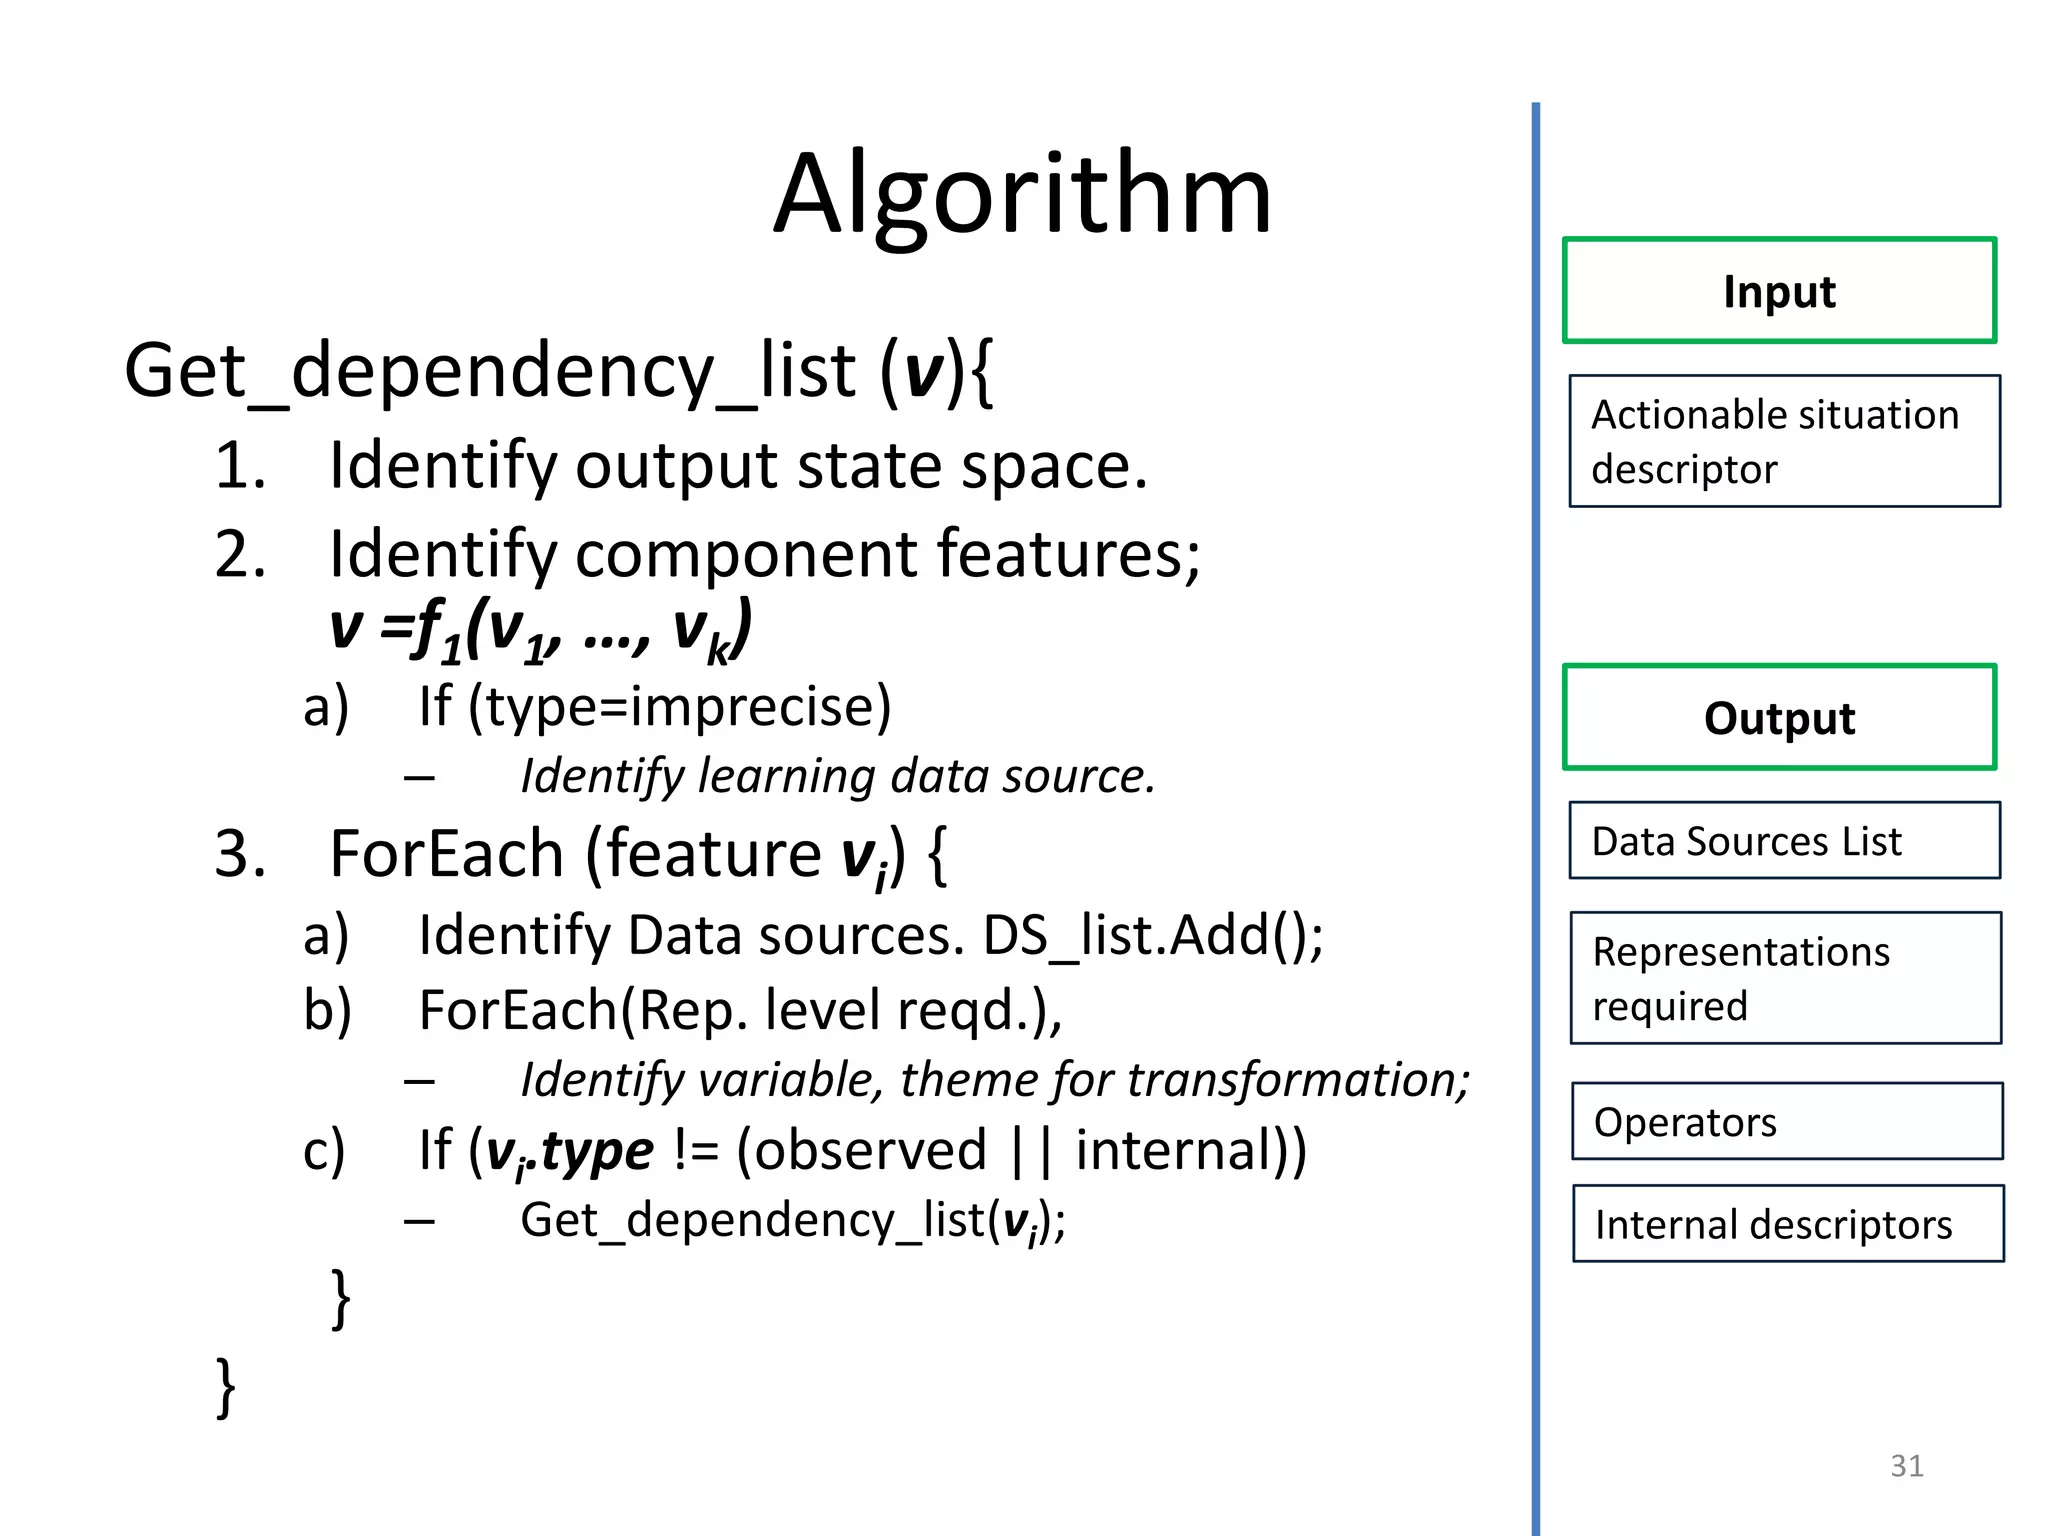
Algorithm
Input
Get_dependency_list (v){ Actionable situation
1. Identify output state space. descriptor
2. Identify component features;
v =f1(v1, …, vk)
a) If (type=imprecise) Output
– Identify learning data source.
3. ForEach (feature vi) { Data Sources List
a) Identify Data sources. DS_list.Add(); Representations
b) ForEach(Rep. level reqd.), required
– Identify variable, theme for transformation;
Operators
c) If (vi.type != (observed || internal))
– Get_dependency_list(vi); Internal descriptors
}
}
31
32.
Pandemic
Low, mid,
high level Φ CDC reports
Number of Size of % of Population ϵƦ
Outbreak events high activity zone at Risk [0,1]
@ @
-Emage
Events(#reports) Locations with Population at
(High activity)
high activity Locations
Δ @
∏ Δ
-Emage -Emage
(#reports) (#reports) S-t-t
Δ Δ
(population)
∏
S-t-t (#reports) S-t-t (#reports)
Census
Δ ∏
Twitter Twitter
32
33.
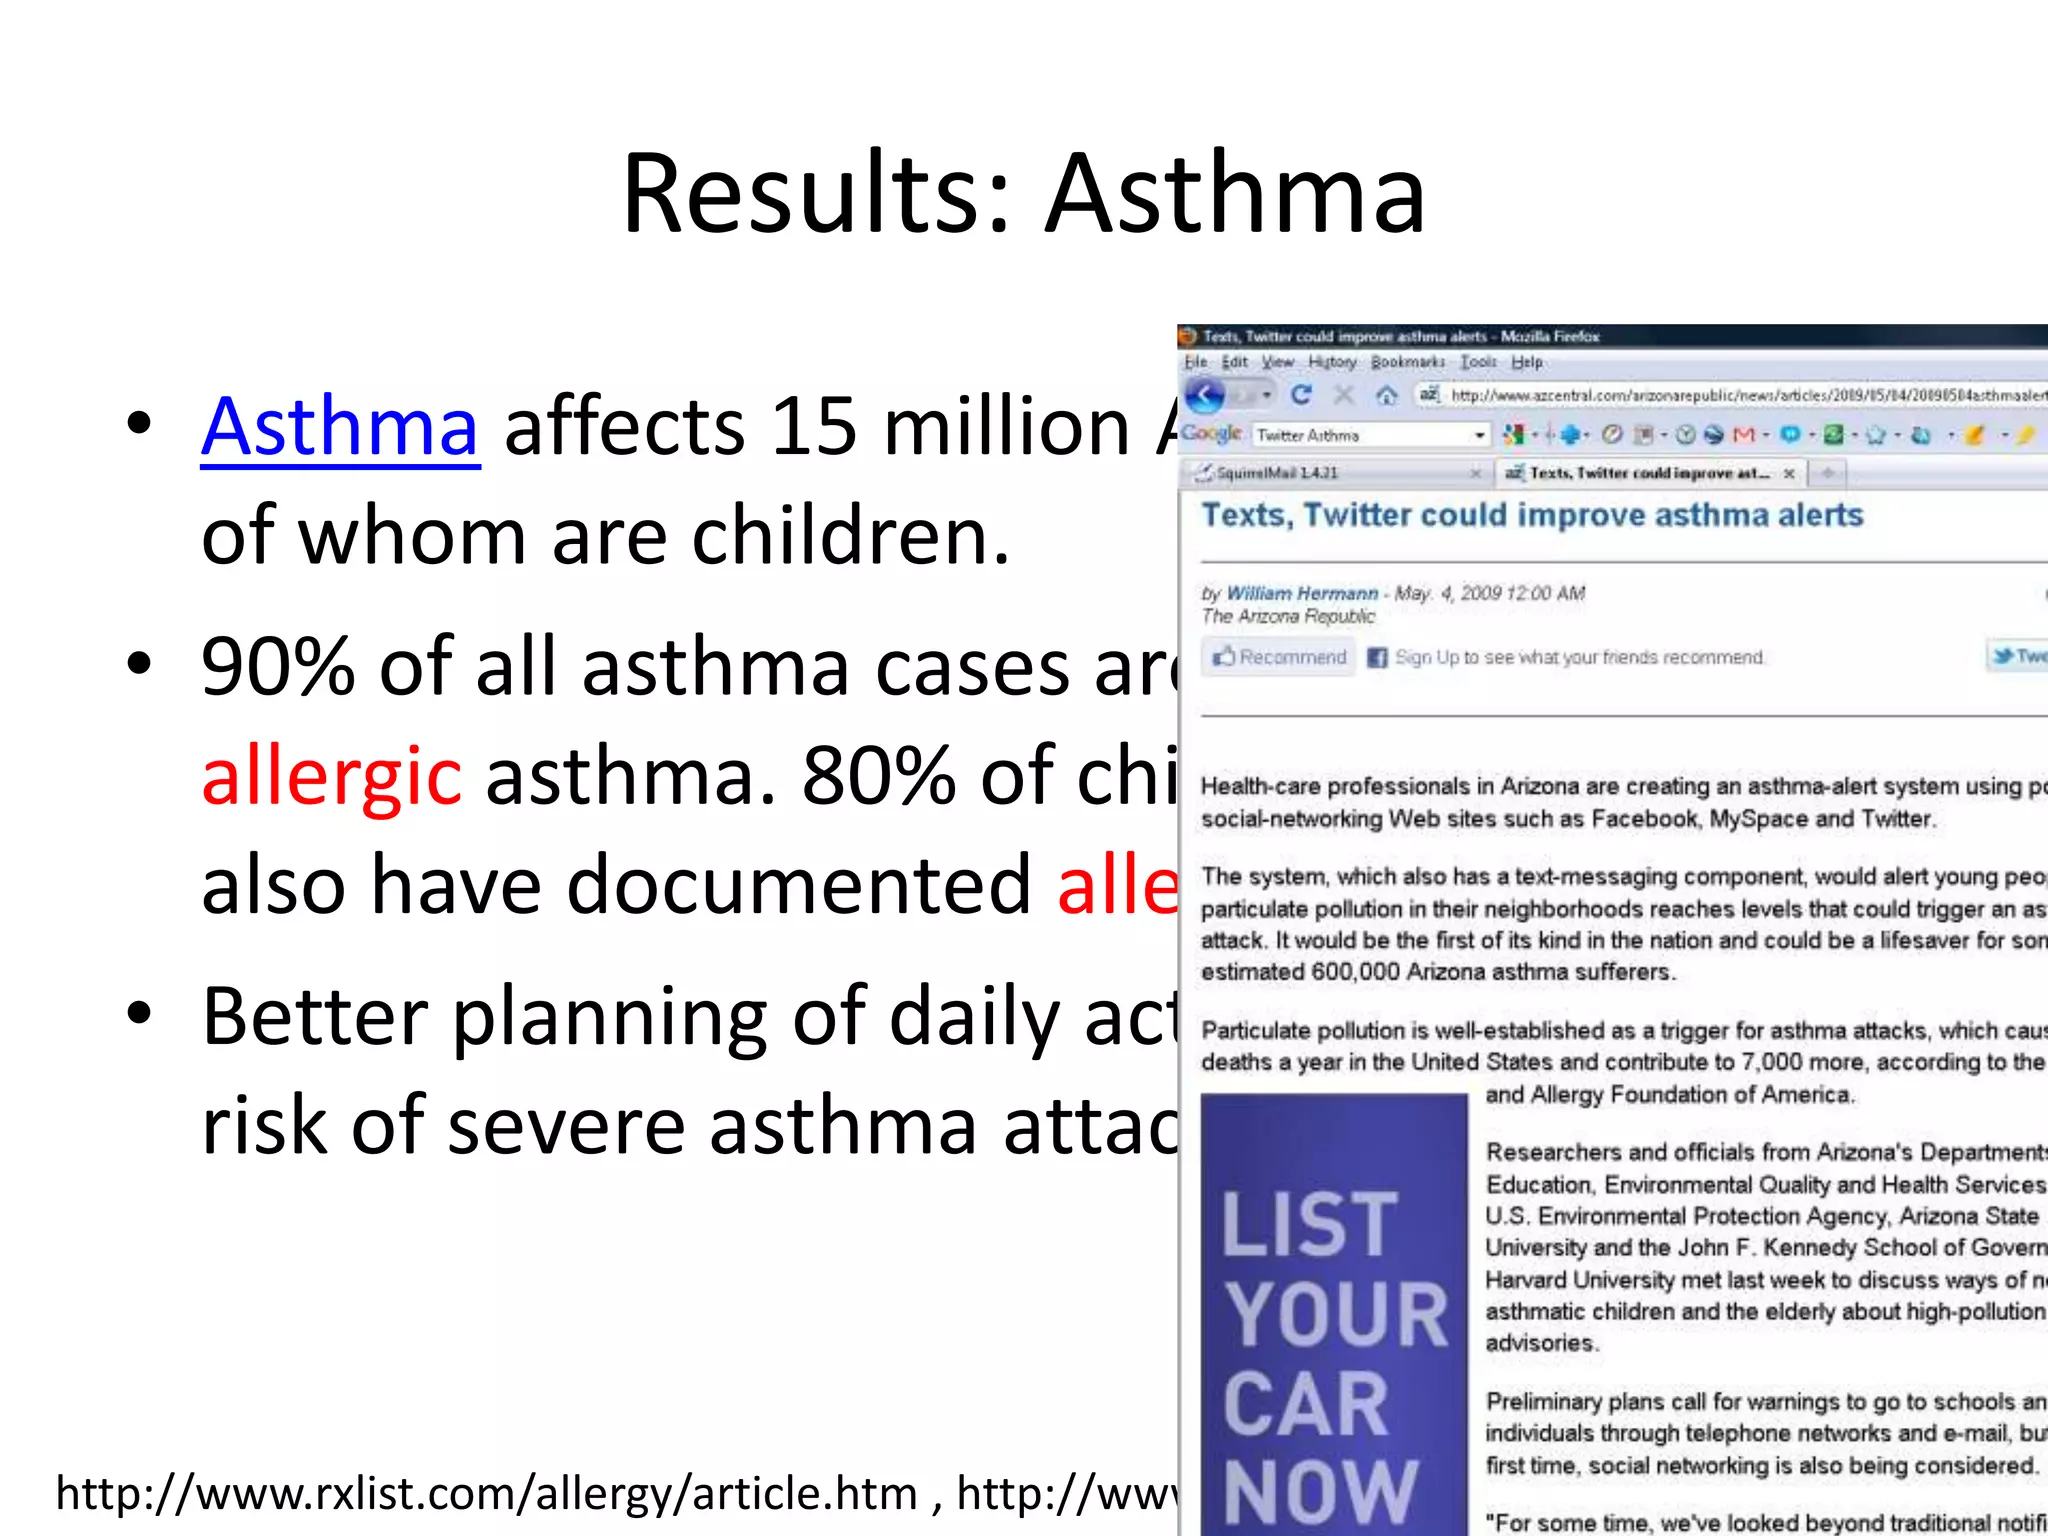
Results: Asthma
• Asthma affects 15 million Americans, 5 million
of whom are children.
• 90% of all asthma cases are Extrinsic, i.e.
allergic asthma. 80% of children with asthma
also have documented allergies.
• Better planning of daily activities can minimize
risk of severe asthma attacks.
33
http://www.rxlist.com/allergy/article.htm , http://www.rxlist.com/asthma/page6.htm#tocl
34.
Application
• Uses:
– Individuals: Planning their daily
activities, or combine across their lifetimes
to measure their exposure level
– Macro Level Policy Makers :Noticing sudden
changes, identifying healthier
years, seasons, locations
– Insurance companies: Care about both
levels e.g. charging different premiums.
34
35.
Pre-processing of Data
•Image transformation of Pollen and Air quality
maps
– Rectified images through 25 matching point
– Filtered for only populated US areas
• Downloading tweets through API
• Resolution used:
– Pollen and Air quality=0.1 lat by 0.1 lon
– Tweets= 1 lat * 1 lon
35
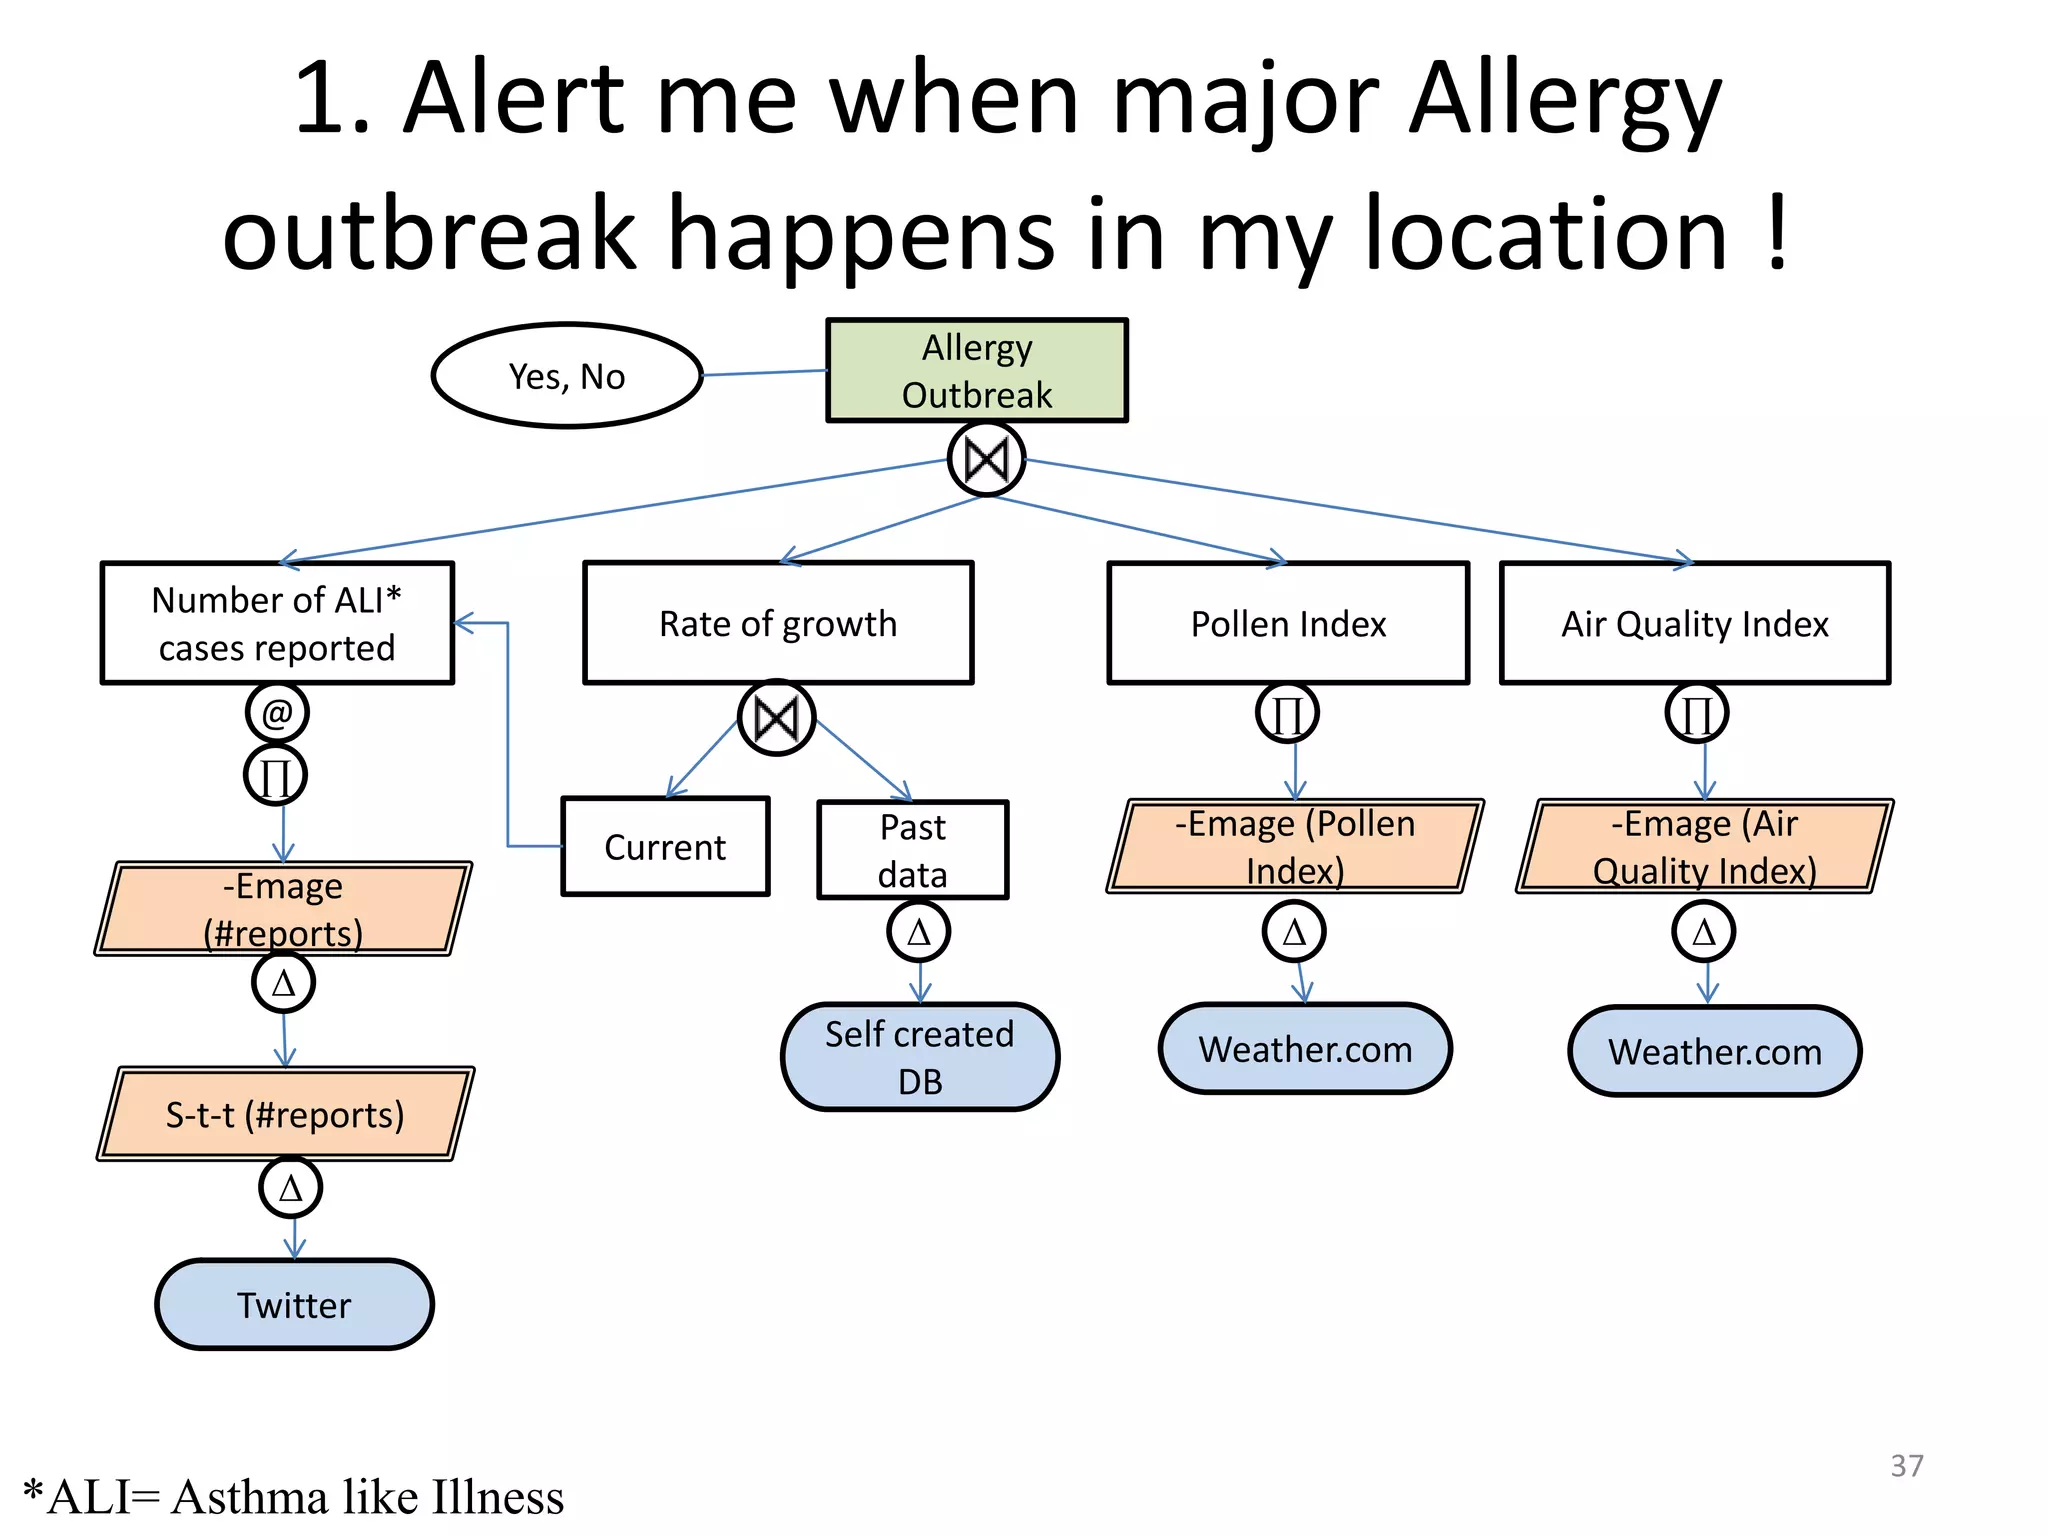
1. Alert mewhen major Allergy
outbreak happens in my location !
Allergy
Yes, No Outbreak
Number of ALI*
Rate of growth Pollen Index Air Quality Index
cases reported
@ ∏ ∏
∏
Past -Emage (Pollen -Emage (Air
Current
-Emage data Index) Quality Index)
(#reports) Δ Δ Δ
Δ
Self created Weather.com Weather.com
DB
S-t-t (#reports)
Δ
Twitter
37
*ALI= Asthma like Illness
38.
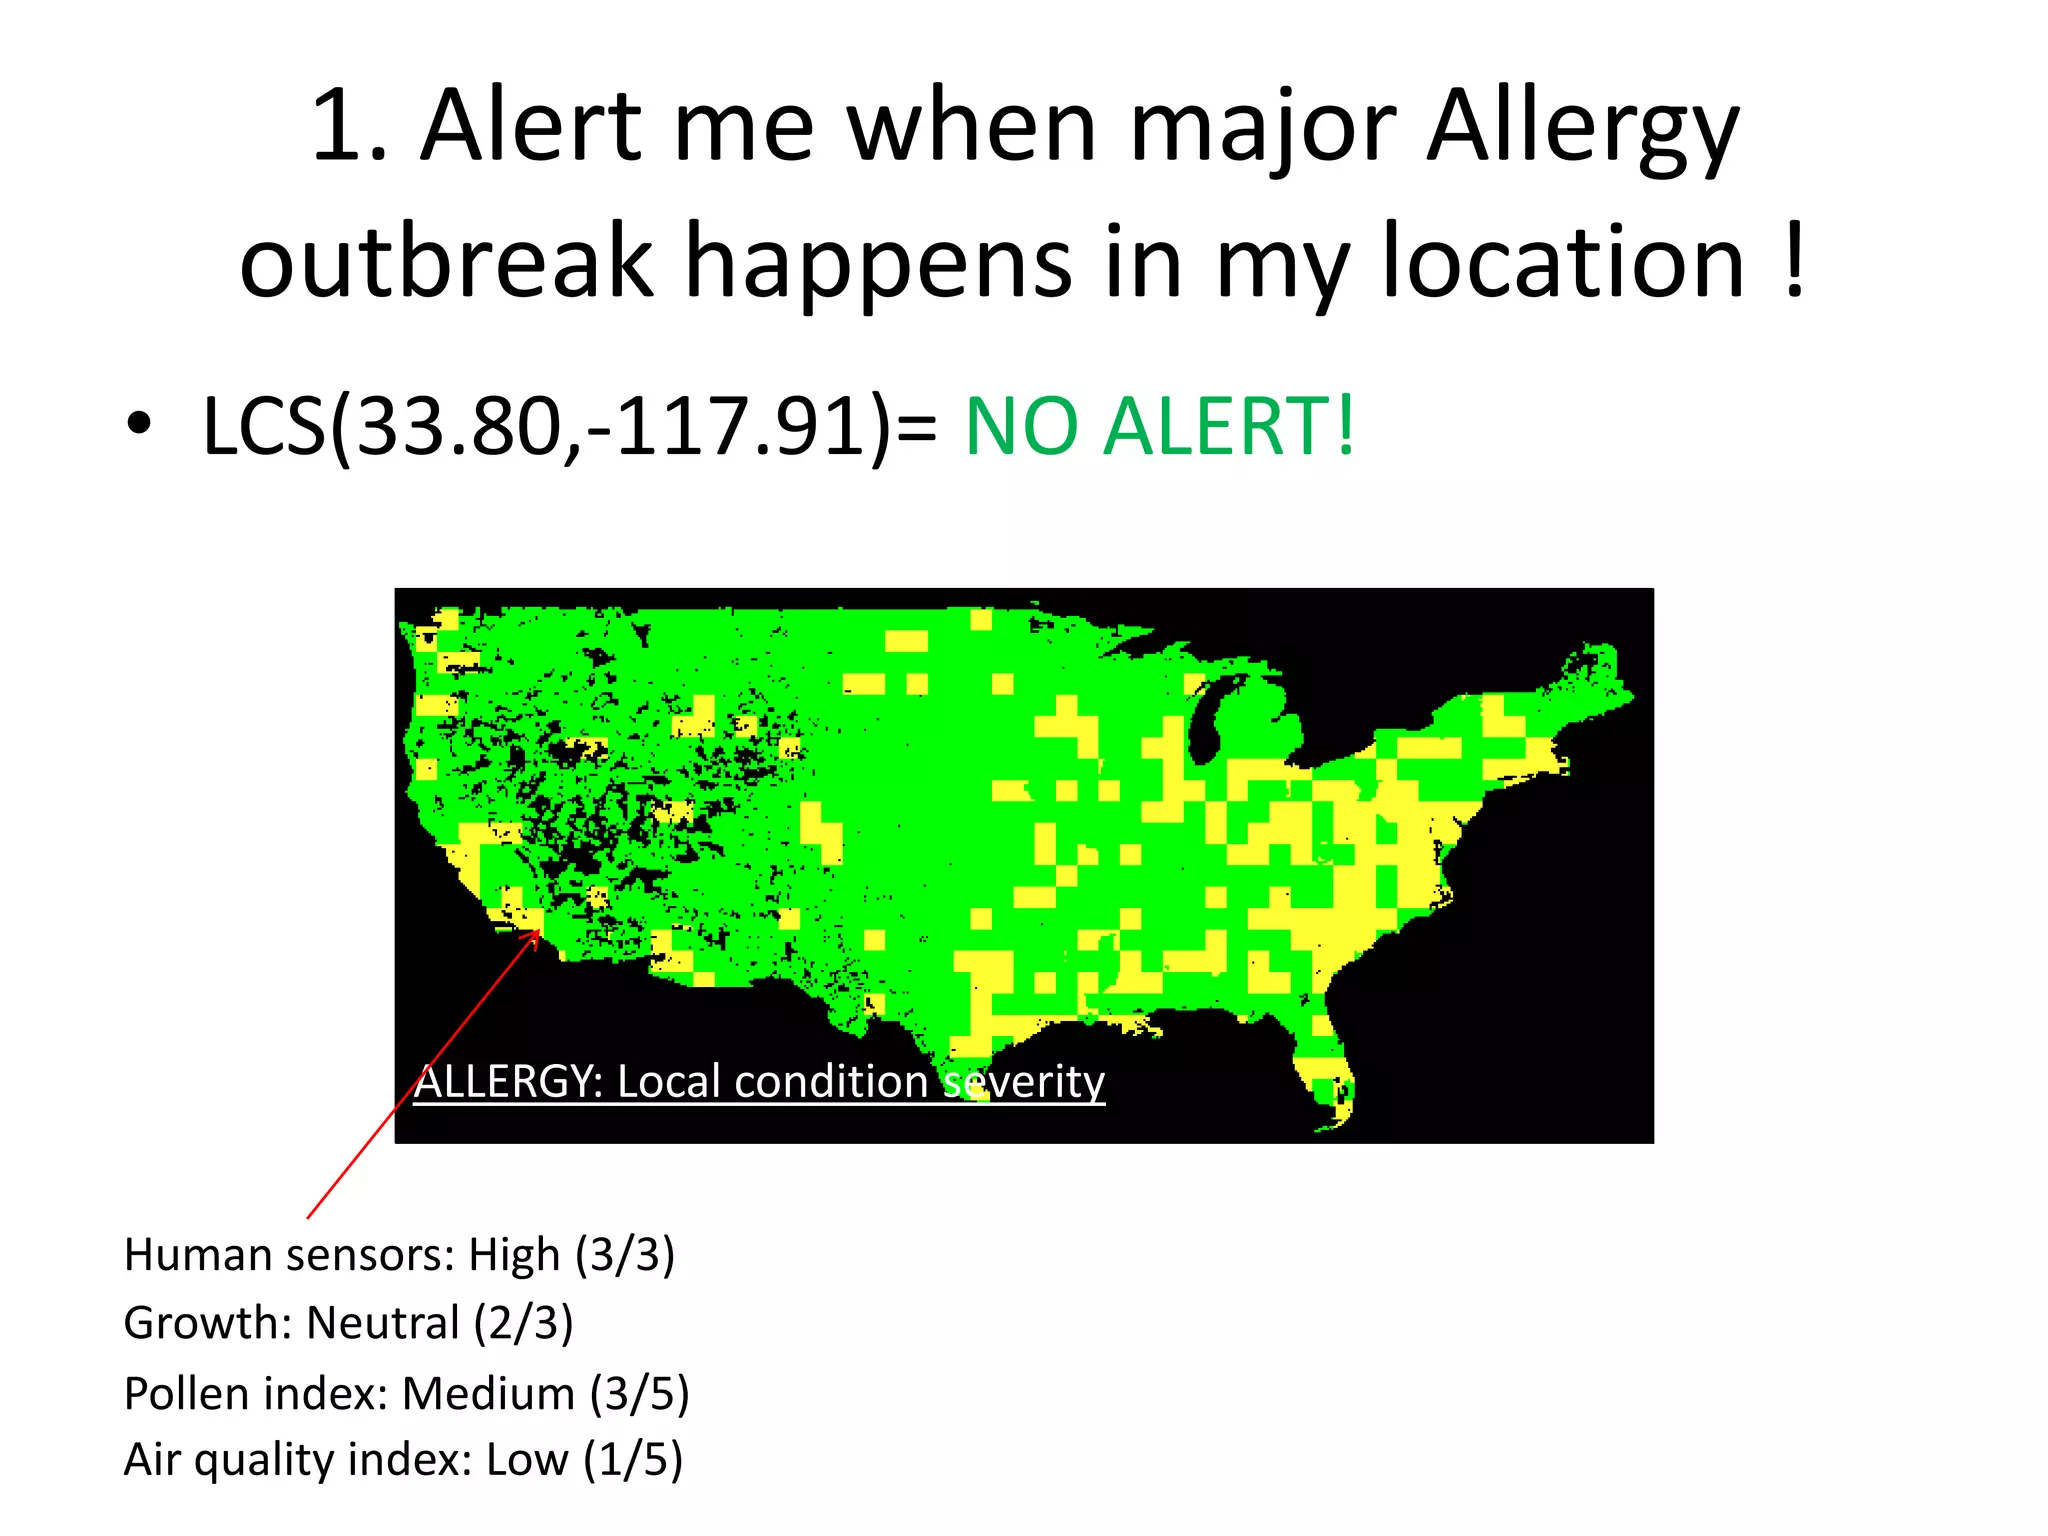
1. Alert mewhen major Allergy
outbreak happens in my location !
• LCS(33.80,-117.91)= NO ALERT!
Human Index (human reports)
Pollen sensor reports
Growth rate
Air quality Index
ALLERGY: Local condition severity
Human sensors: High (3/3)
Growth: Neutral (2/3)
Pollen index: Medium (3/5)
Air quality index: Low (1/5)
39.
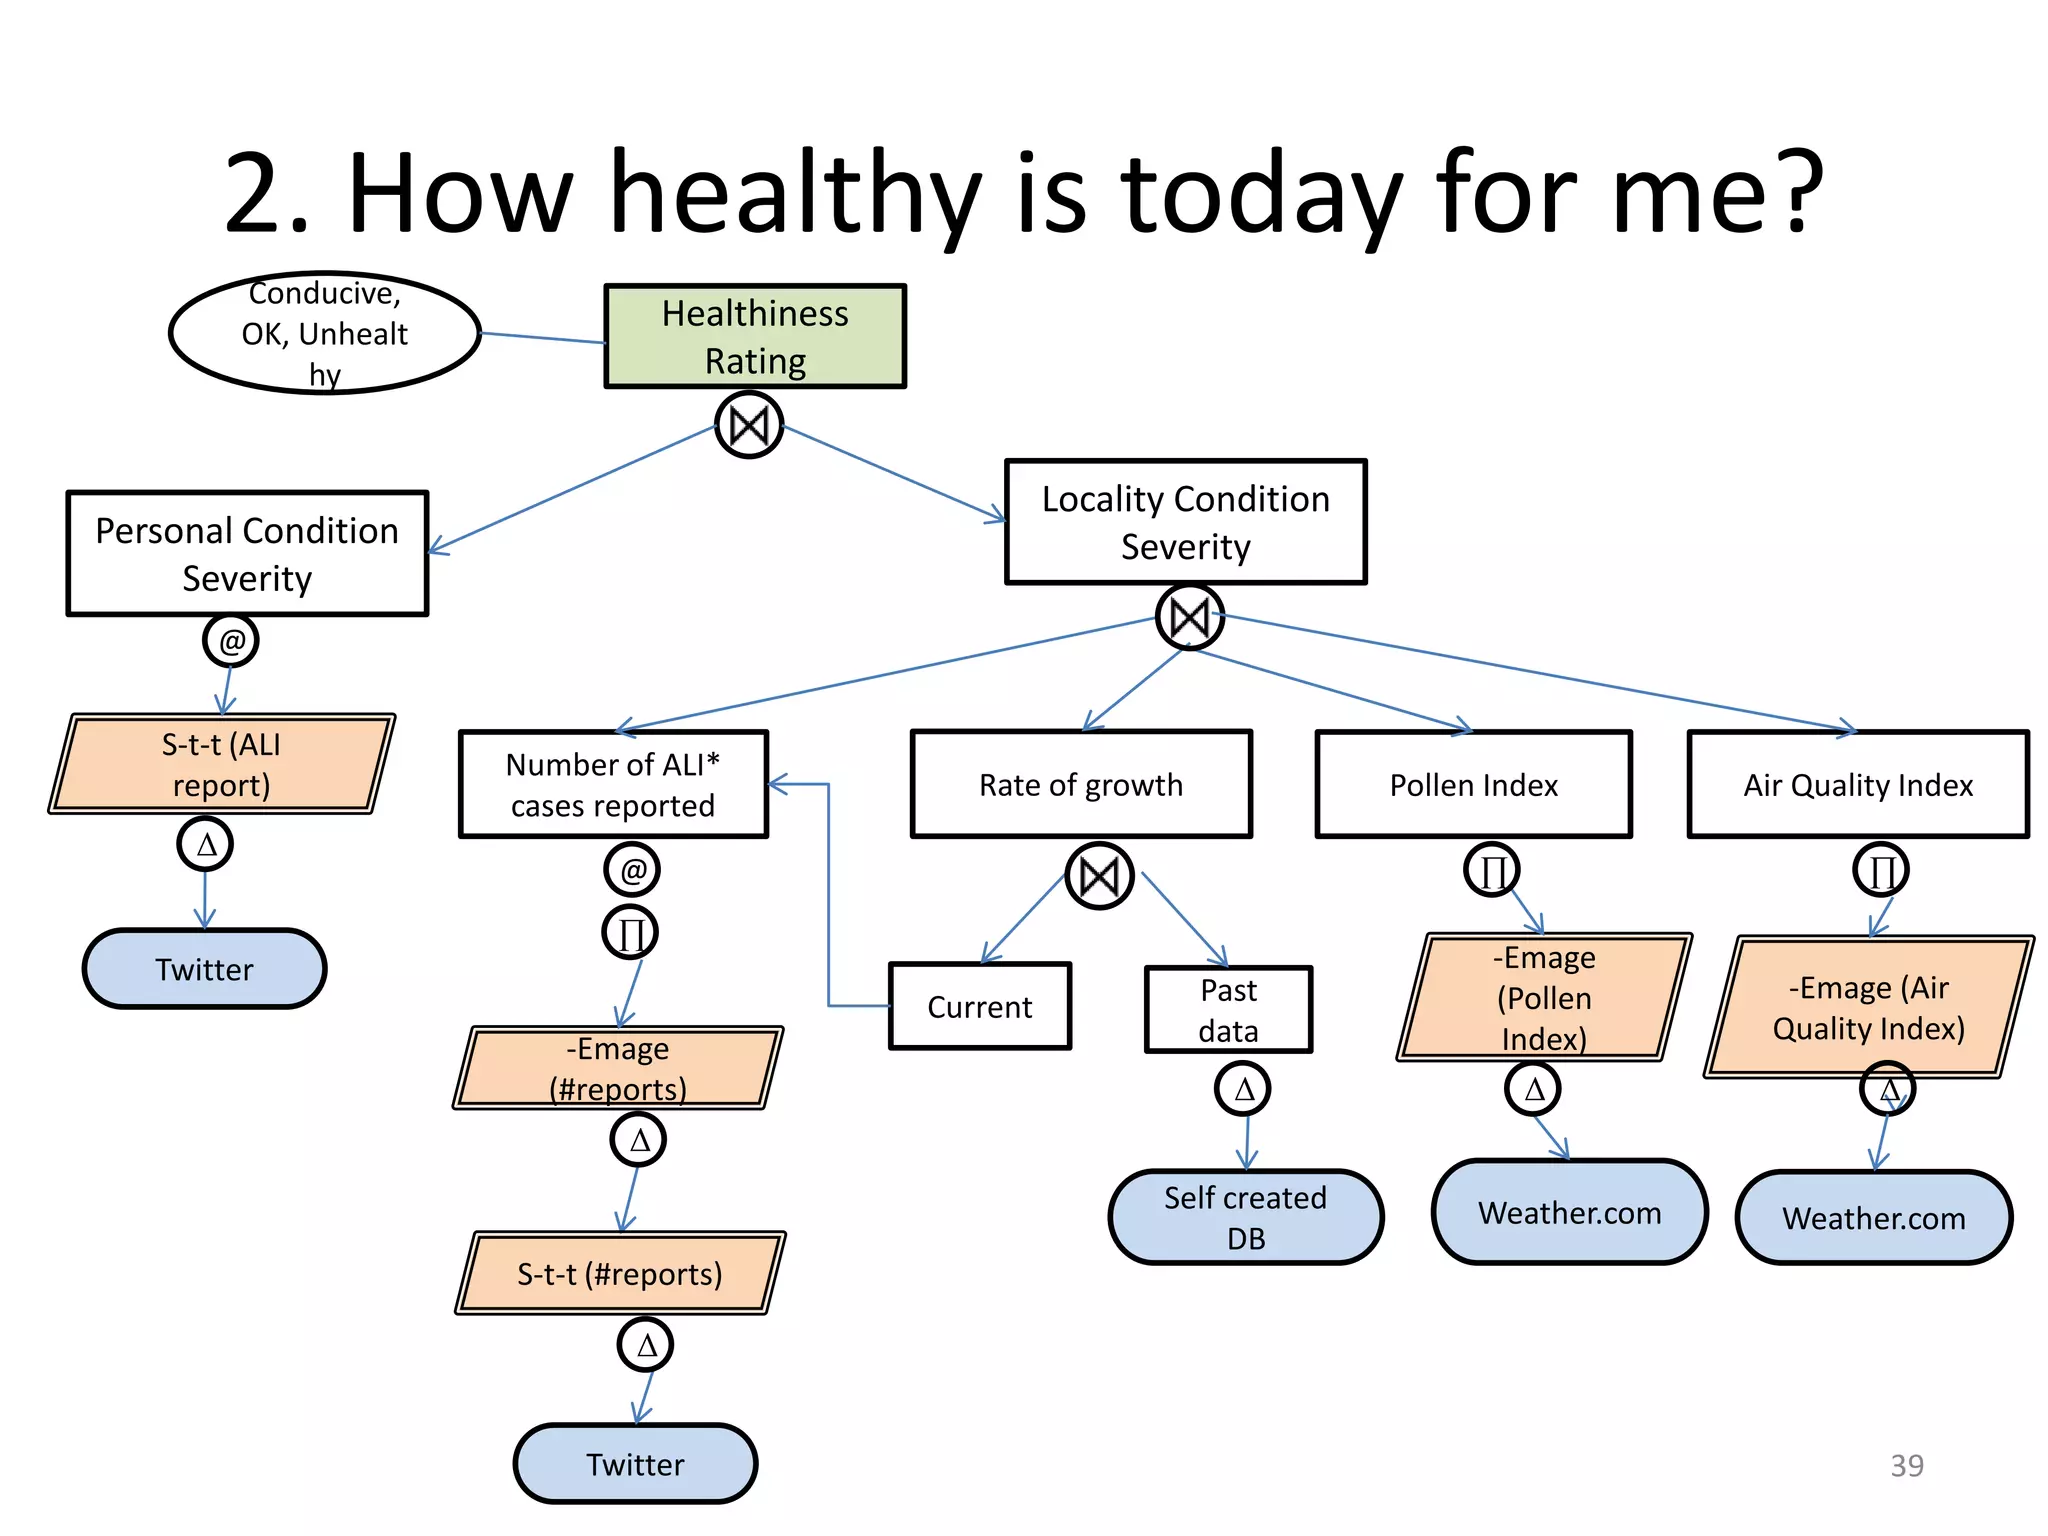
2. How healthyis today for me?
Conducive,
OK, Unhealt
Healthiness
hy Rating
Locality Condition
Personal Condition Severity
Severity
@
S-t-t (ALI
Number of ALI*
report) Rate of growth Pollen Index Air Quality Index
cases reported
Δ
@ ∏ ∏
∏
Twitter -Emage
Past (Pollen -Emage (Air
Current
data Index) Quality Index)
-Emage
(#reports) Δ Δ Δ
Δ
Self created Weather.com Weather.com
DB
S-t-t (#reports)
Δ
Twitter 39
40.
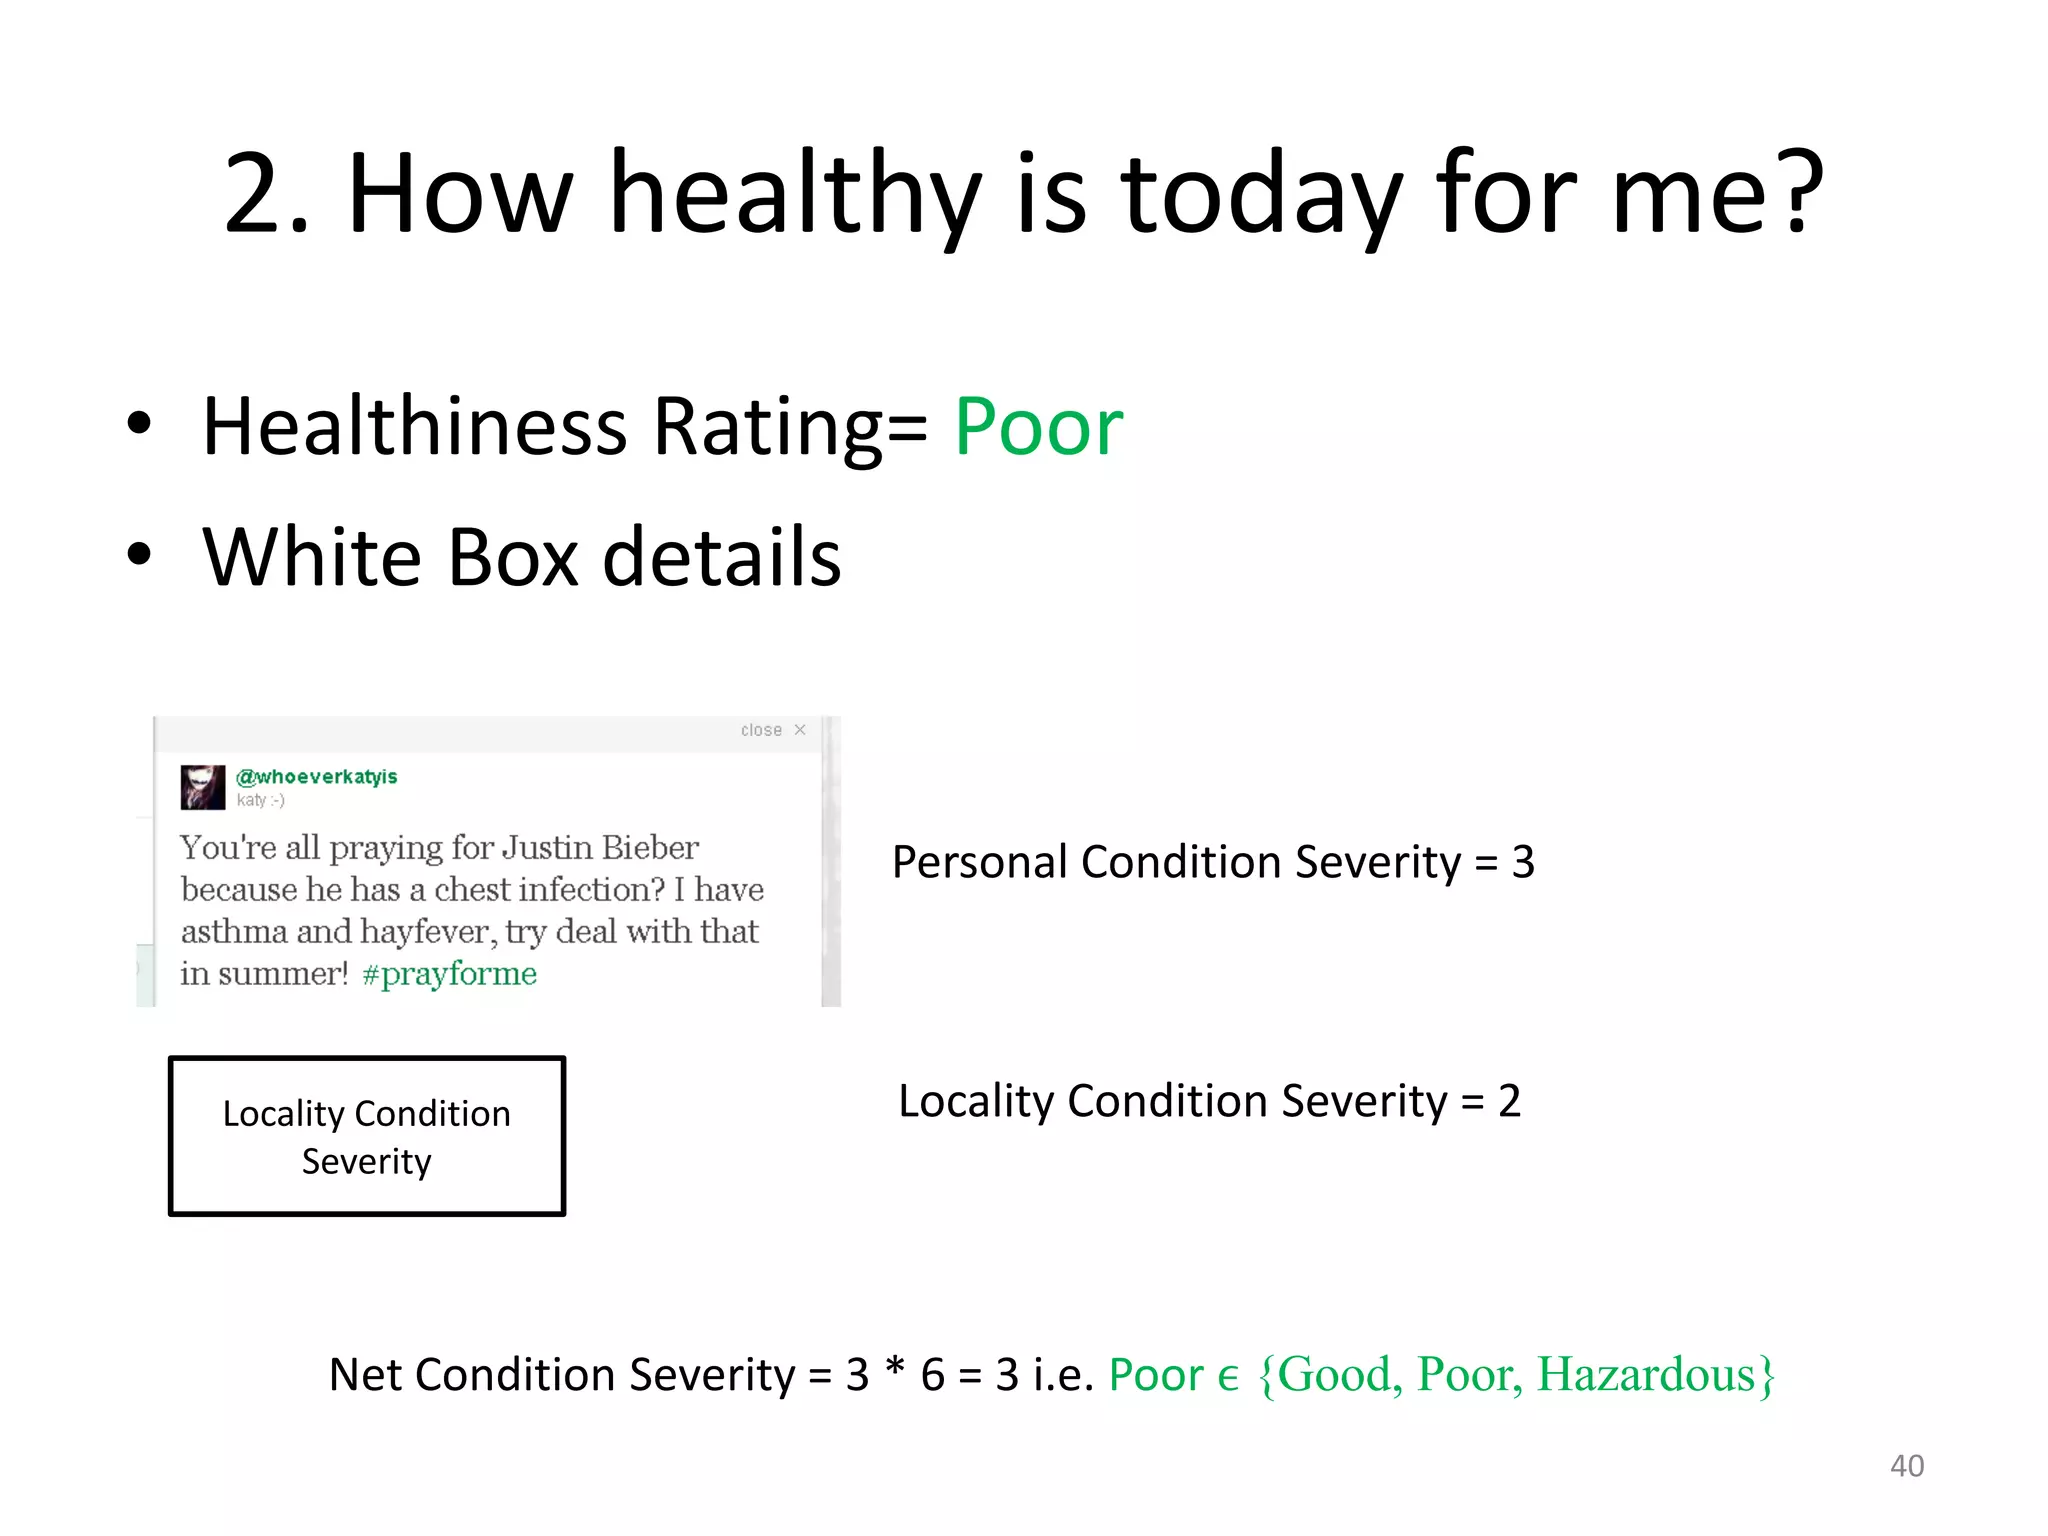
2. How healthyis today for me?
• Healthiness Rating= Poor
• White Box details
Personal Condition Severity = 3
Locality Condition Locality Condition Severity = 2
Severity
Net Condition Severity = 3 * 6 = 3 i.e. Poor ϵ {Good, Poor, Hazardous}
40
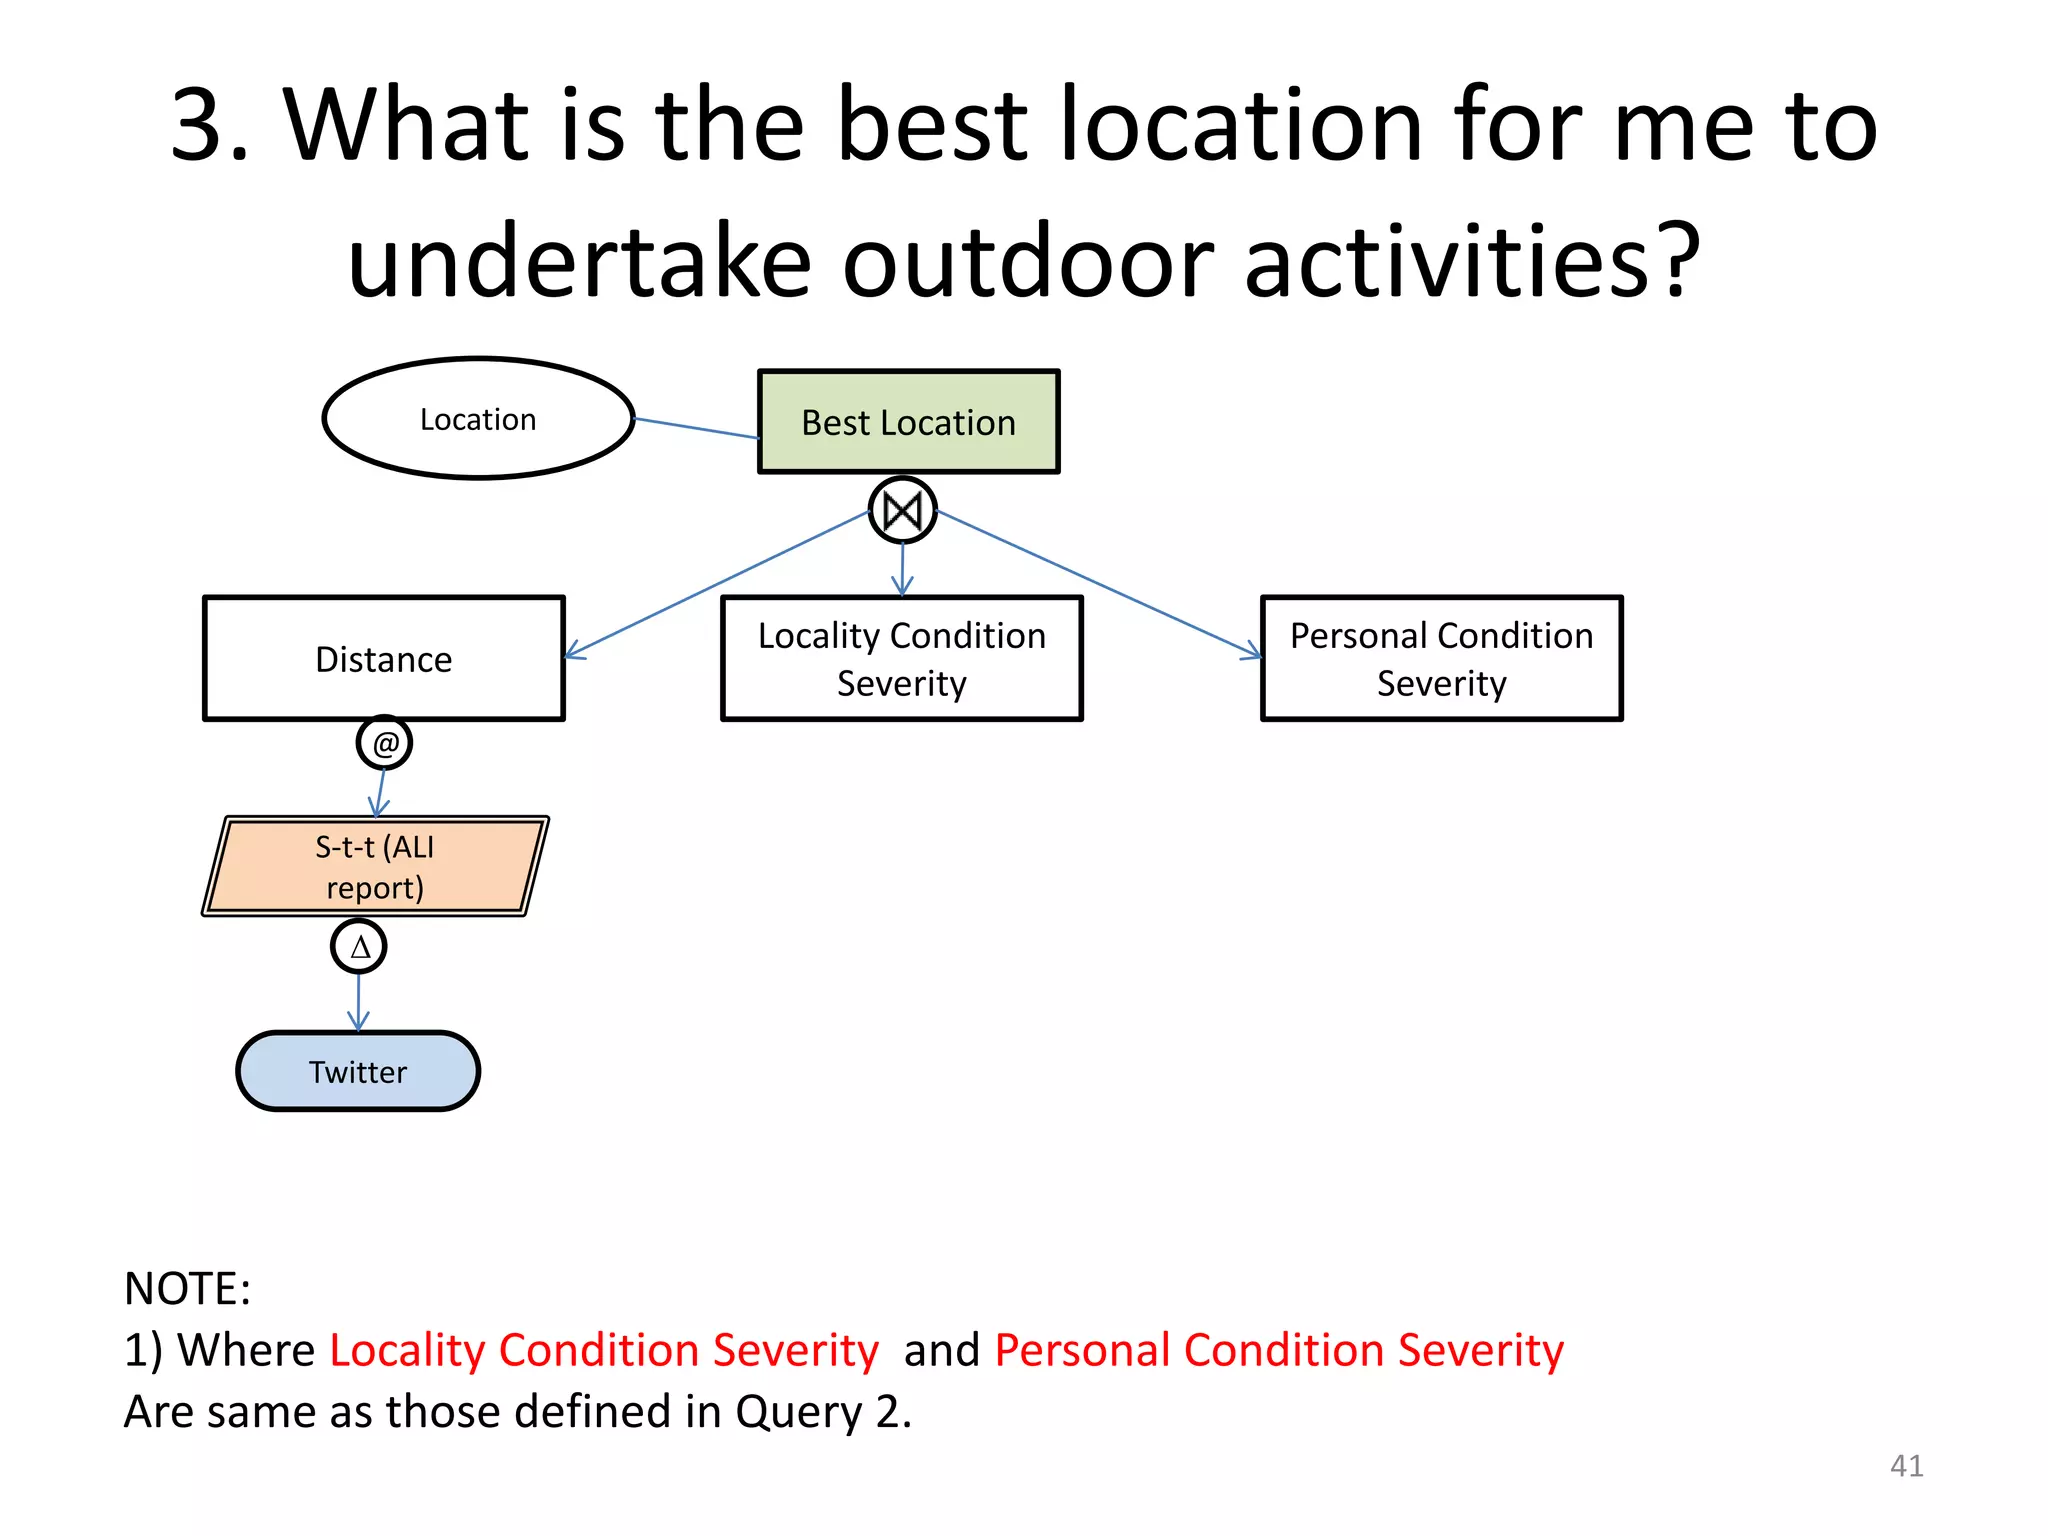
41.
3. What isthe best location for me to
undertake outdoor activities?
Location Best Location
Locality Condition Personal Condition
Distance
Severity Severity
@
S-t-t (ALI
report)
Δ
Twitter
NOTE:
1) Where Locality Condition Severity and Personal Condition Severity
Are same as those defined in Query 2.
41
42.
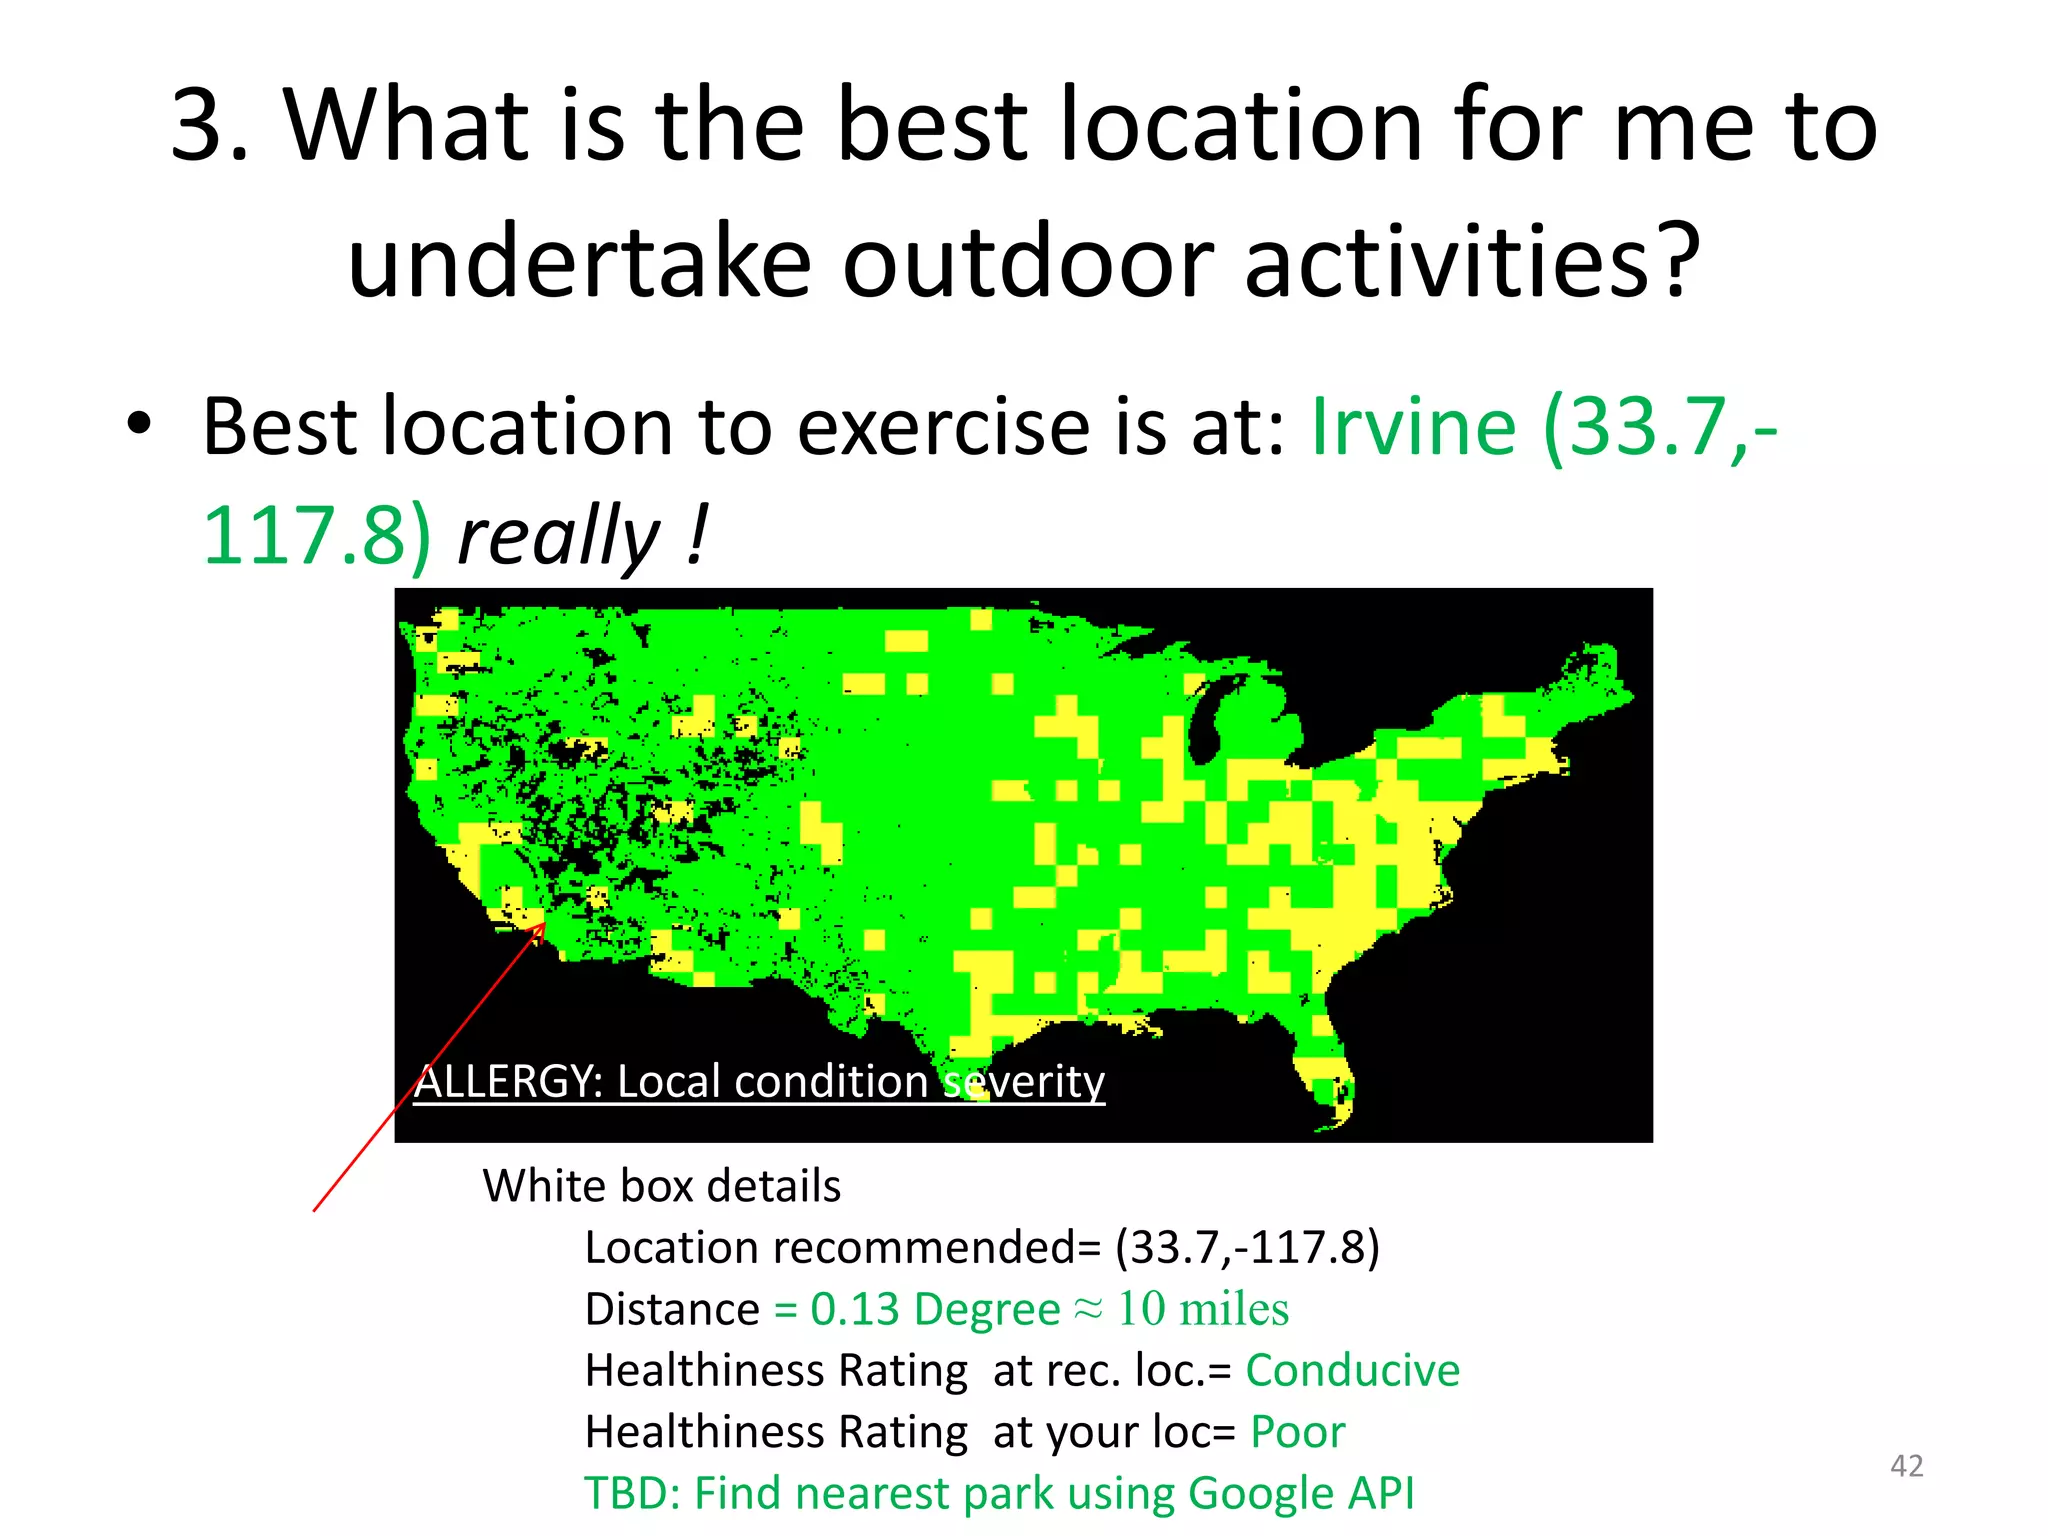
3. What isthe best location for me to
undertake outdoor activities?
• Best location to exercise is at: Irvine (33.7,-
117.8) really !
ALLERGY: Local condition severity
White box details
Location recommended= (33.7,-117.8)
Distance = 0.13 Degree ≈ 10 miles
Healthiness Rating at rec. loc.= Conducive
Healthiness Rating at your loc= Poor
42
TBD: Find nearest park using Google API
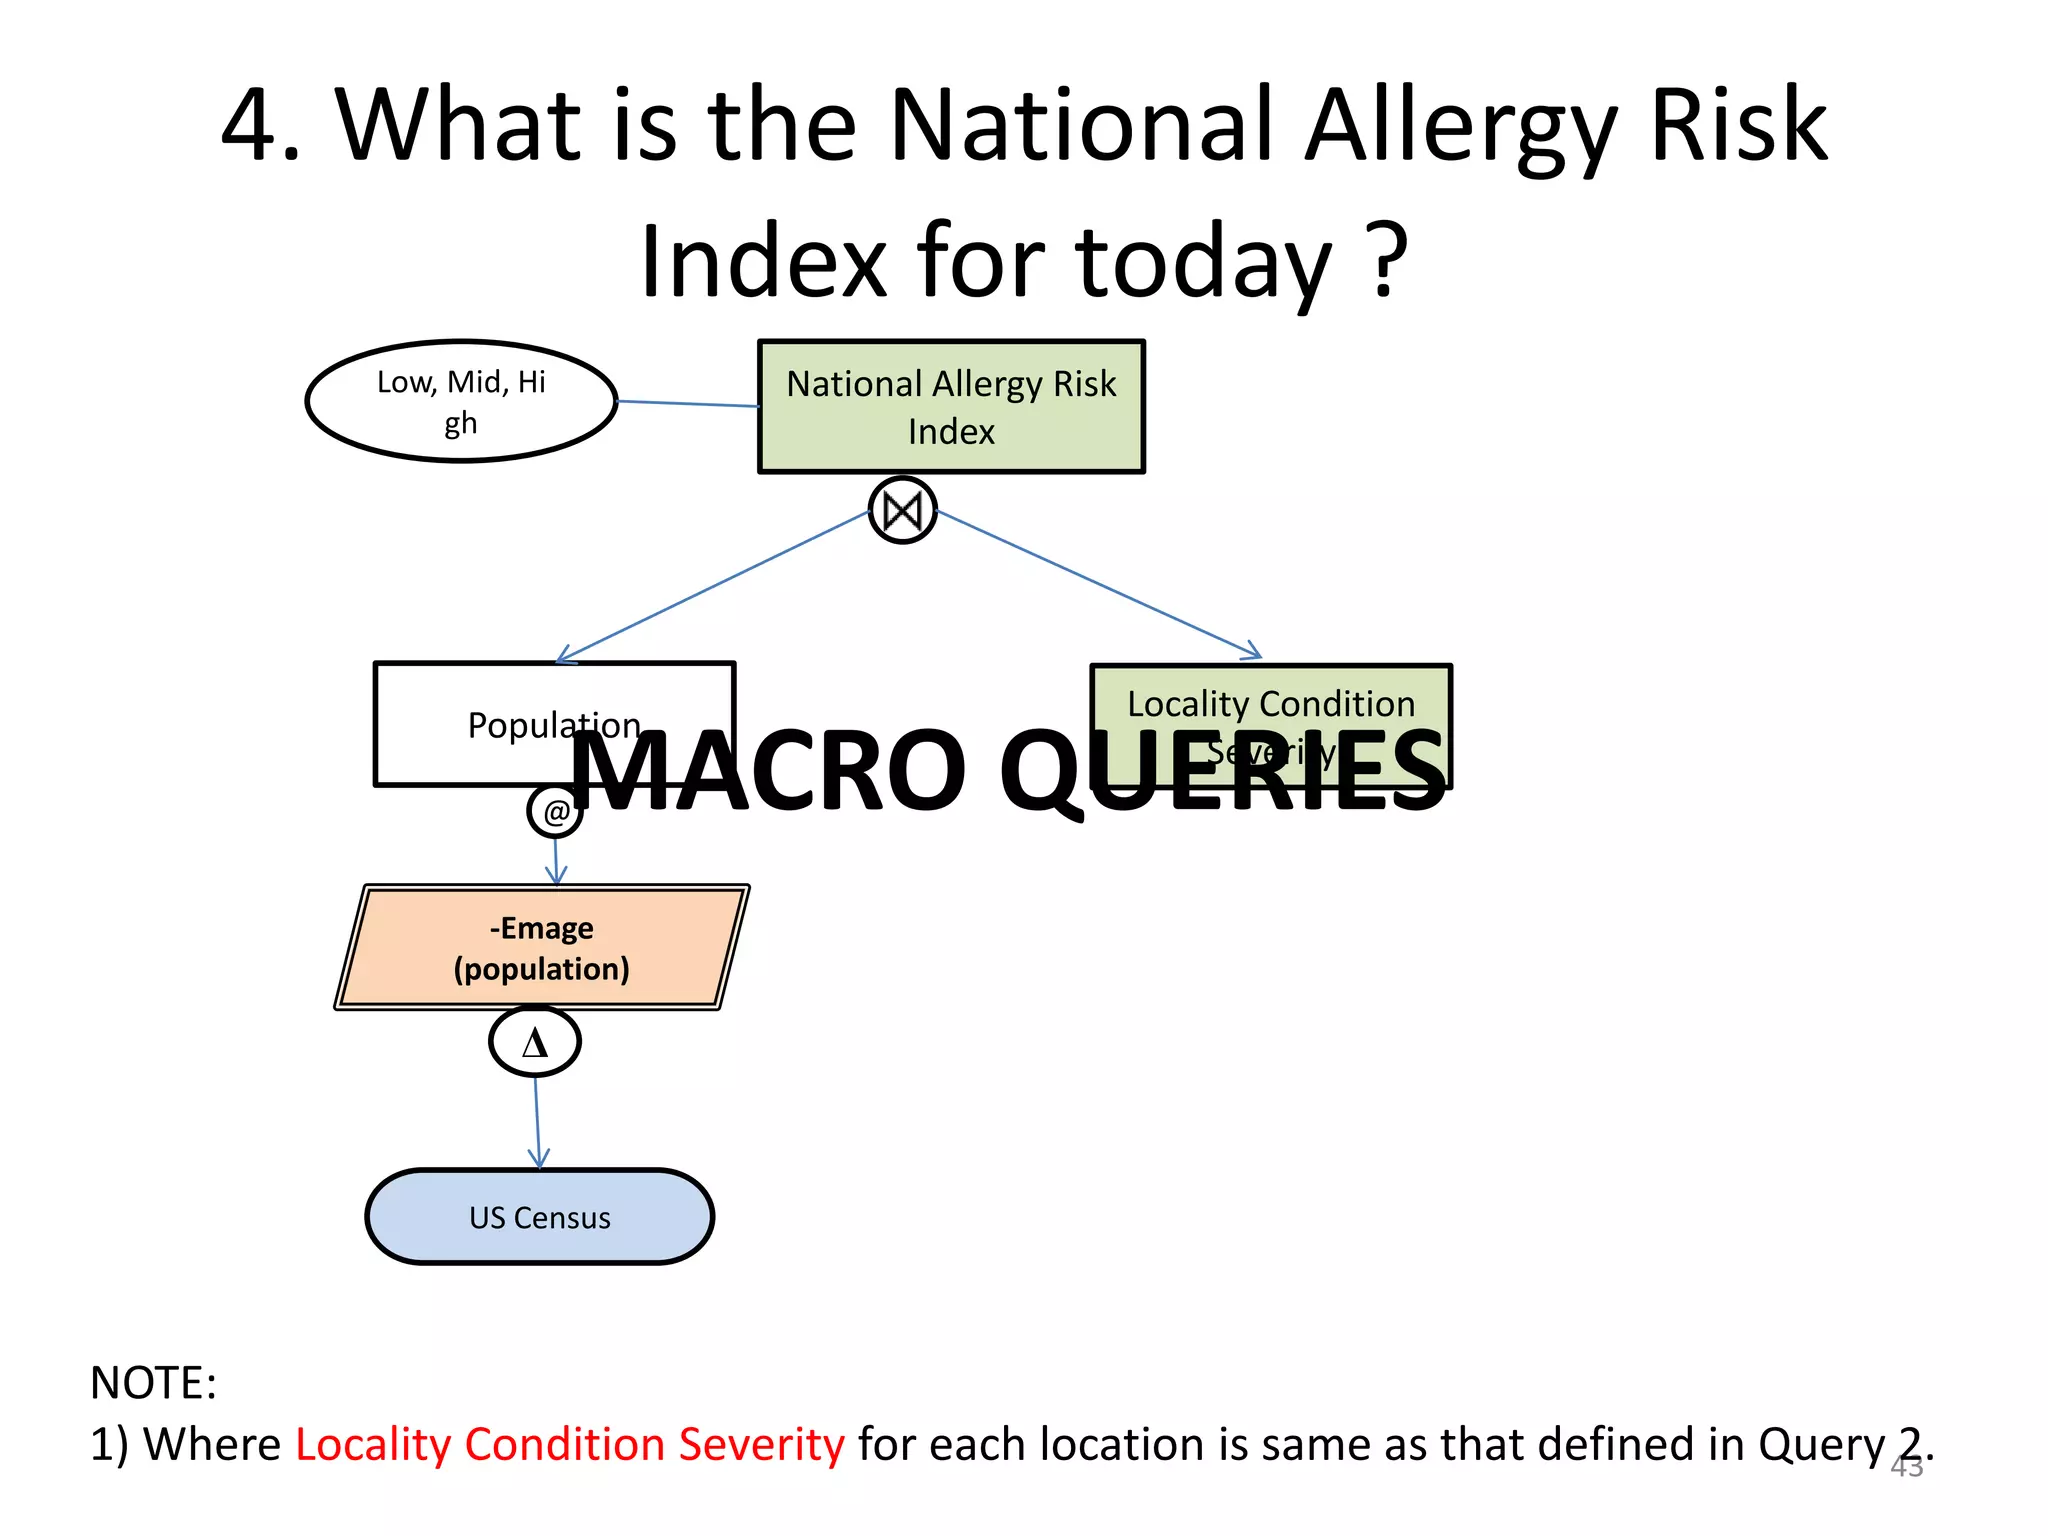
43.
4. What isthe National Allergy Risk
Index for today ?
Low, Mid, Hi National Allergy Risk
gh Index
Locality Condition
Population
@ MACRO QUERIES Severity
-Emage
(population)
Δ
US Census
NOTE:
1) Where Locality Condition Severity for each location is same as that defined in Query 43
2.
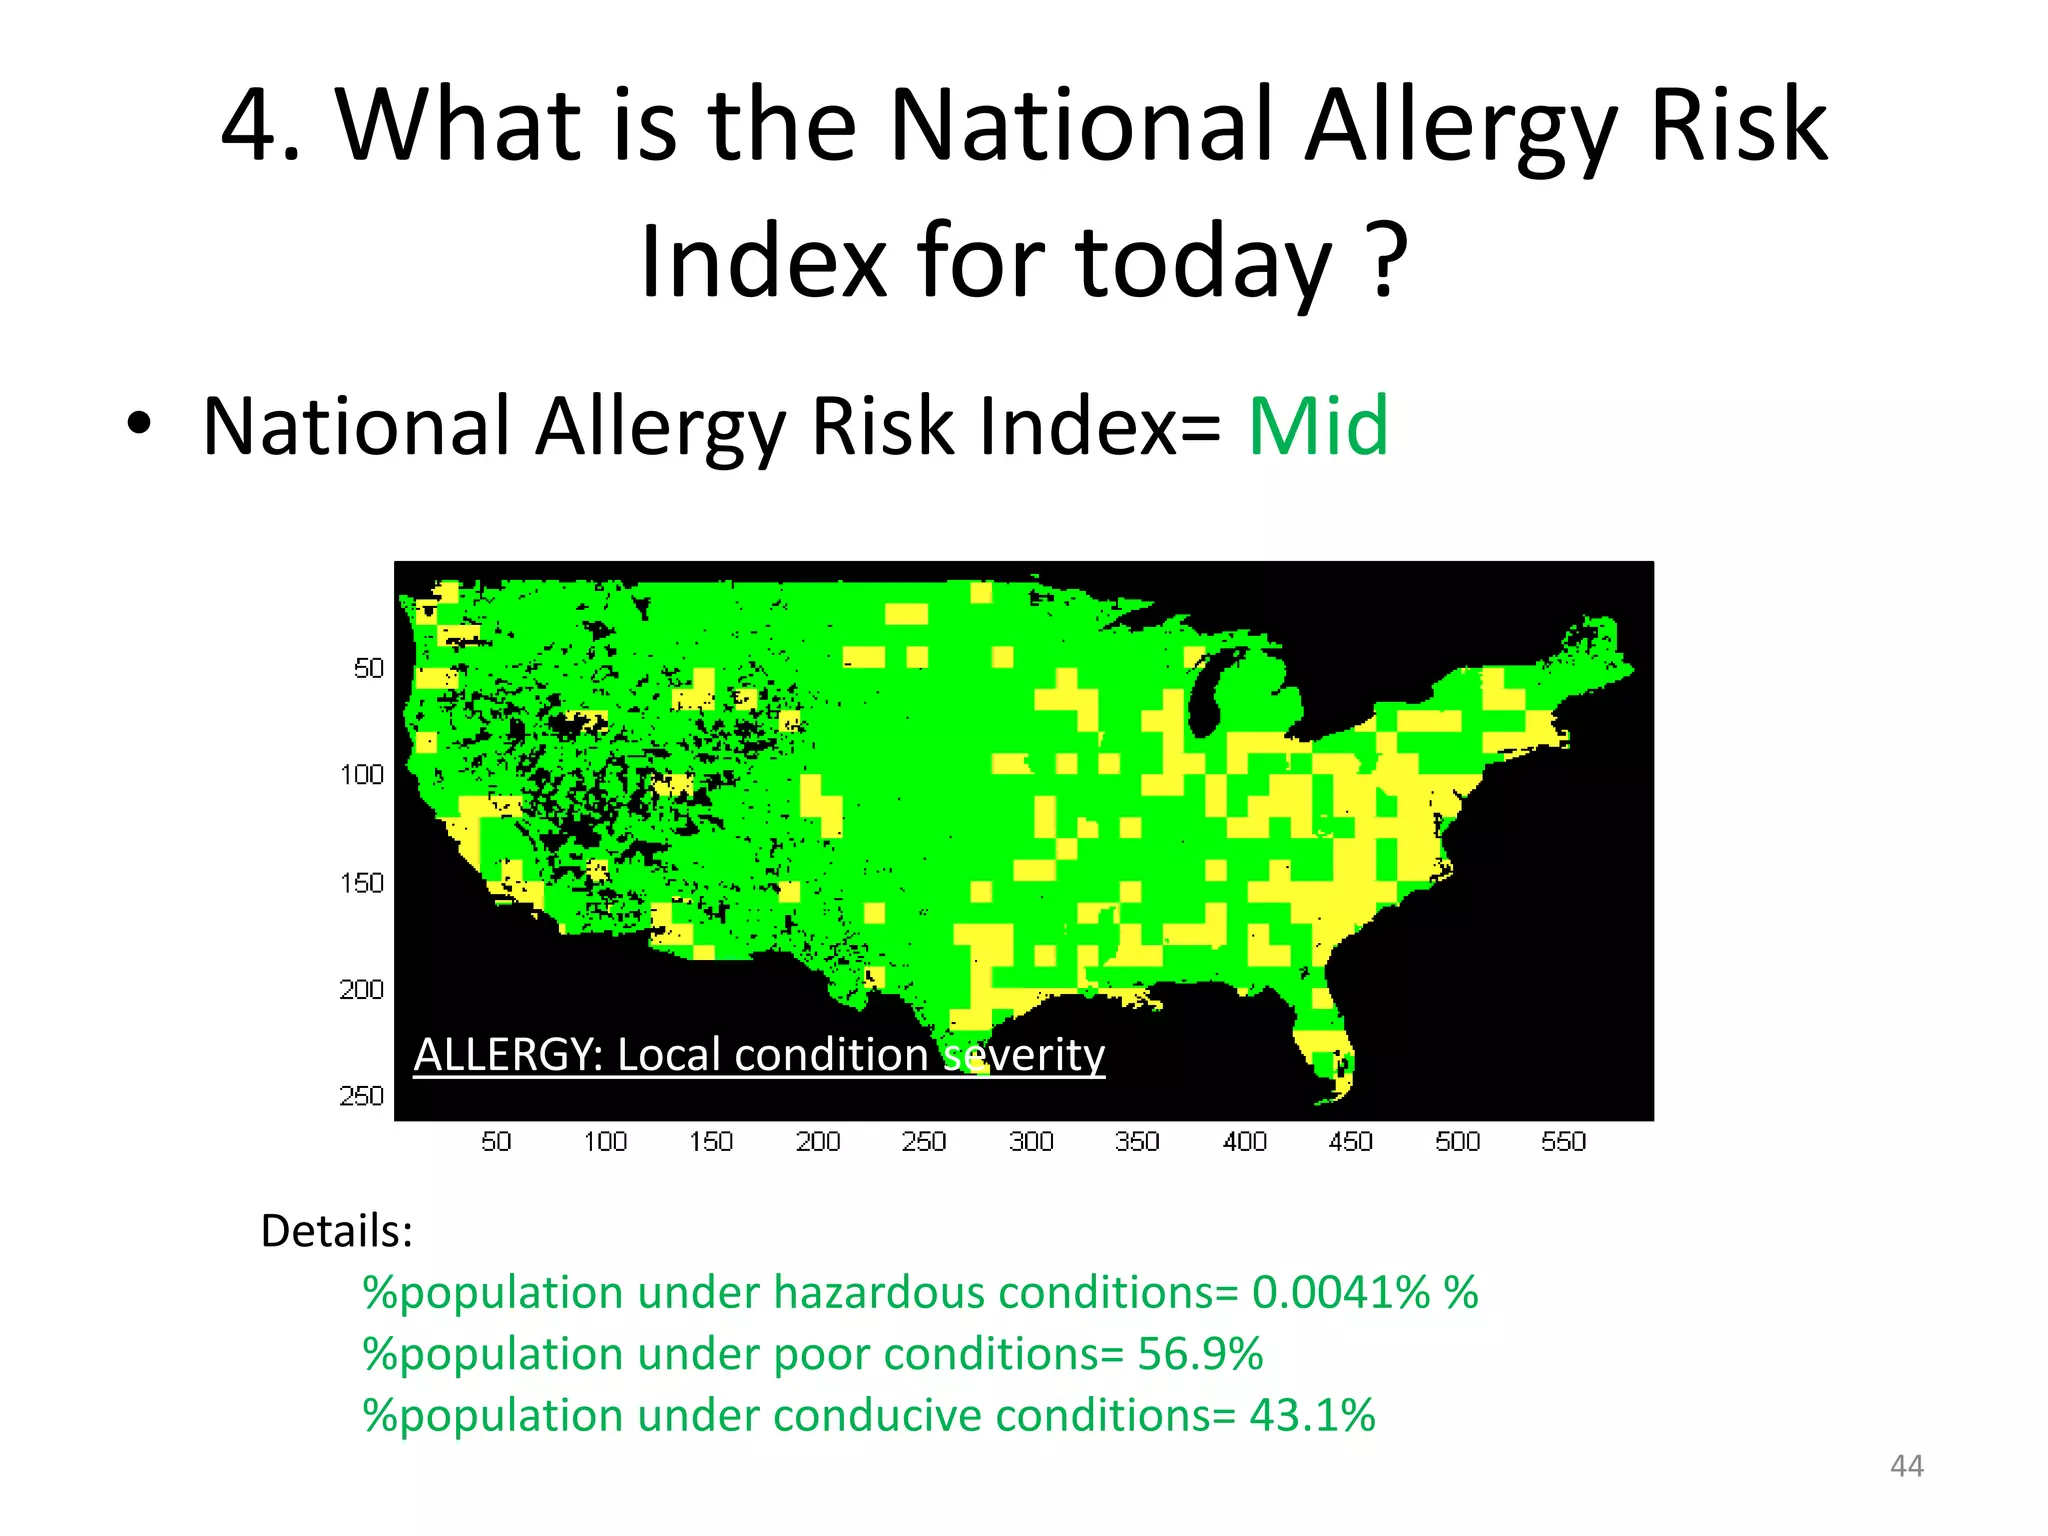
44.
4. What isthe National Allergy Risk
Index for today ?
• National Allergy Risk Index= Mid
ALLERGY: Local condition severity
Details:
%population under hazardous conditions= 0.0041% %
%population under poor conditions= 56.9%
%population under conducive conditions= 43.1%
44
45.
Related problems tackled
1.Situation based control
2. Properties: STT power laws
3. User behavior modeling
45
46.
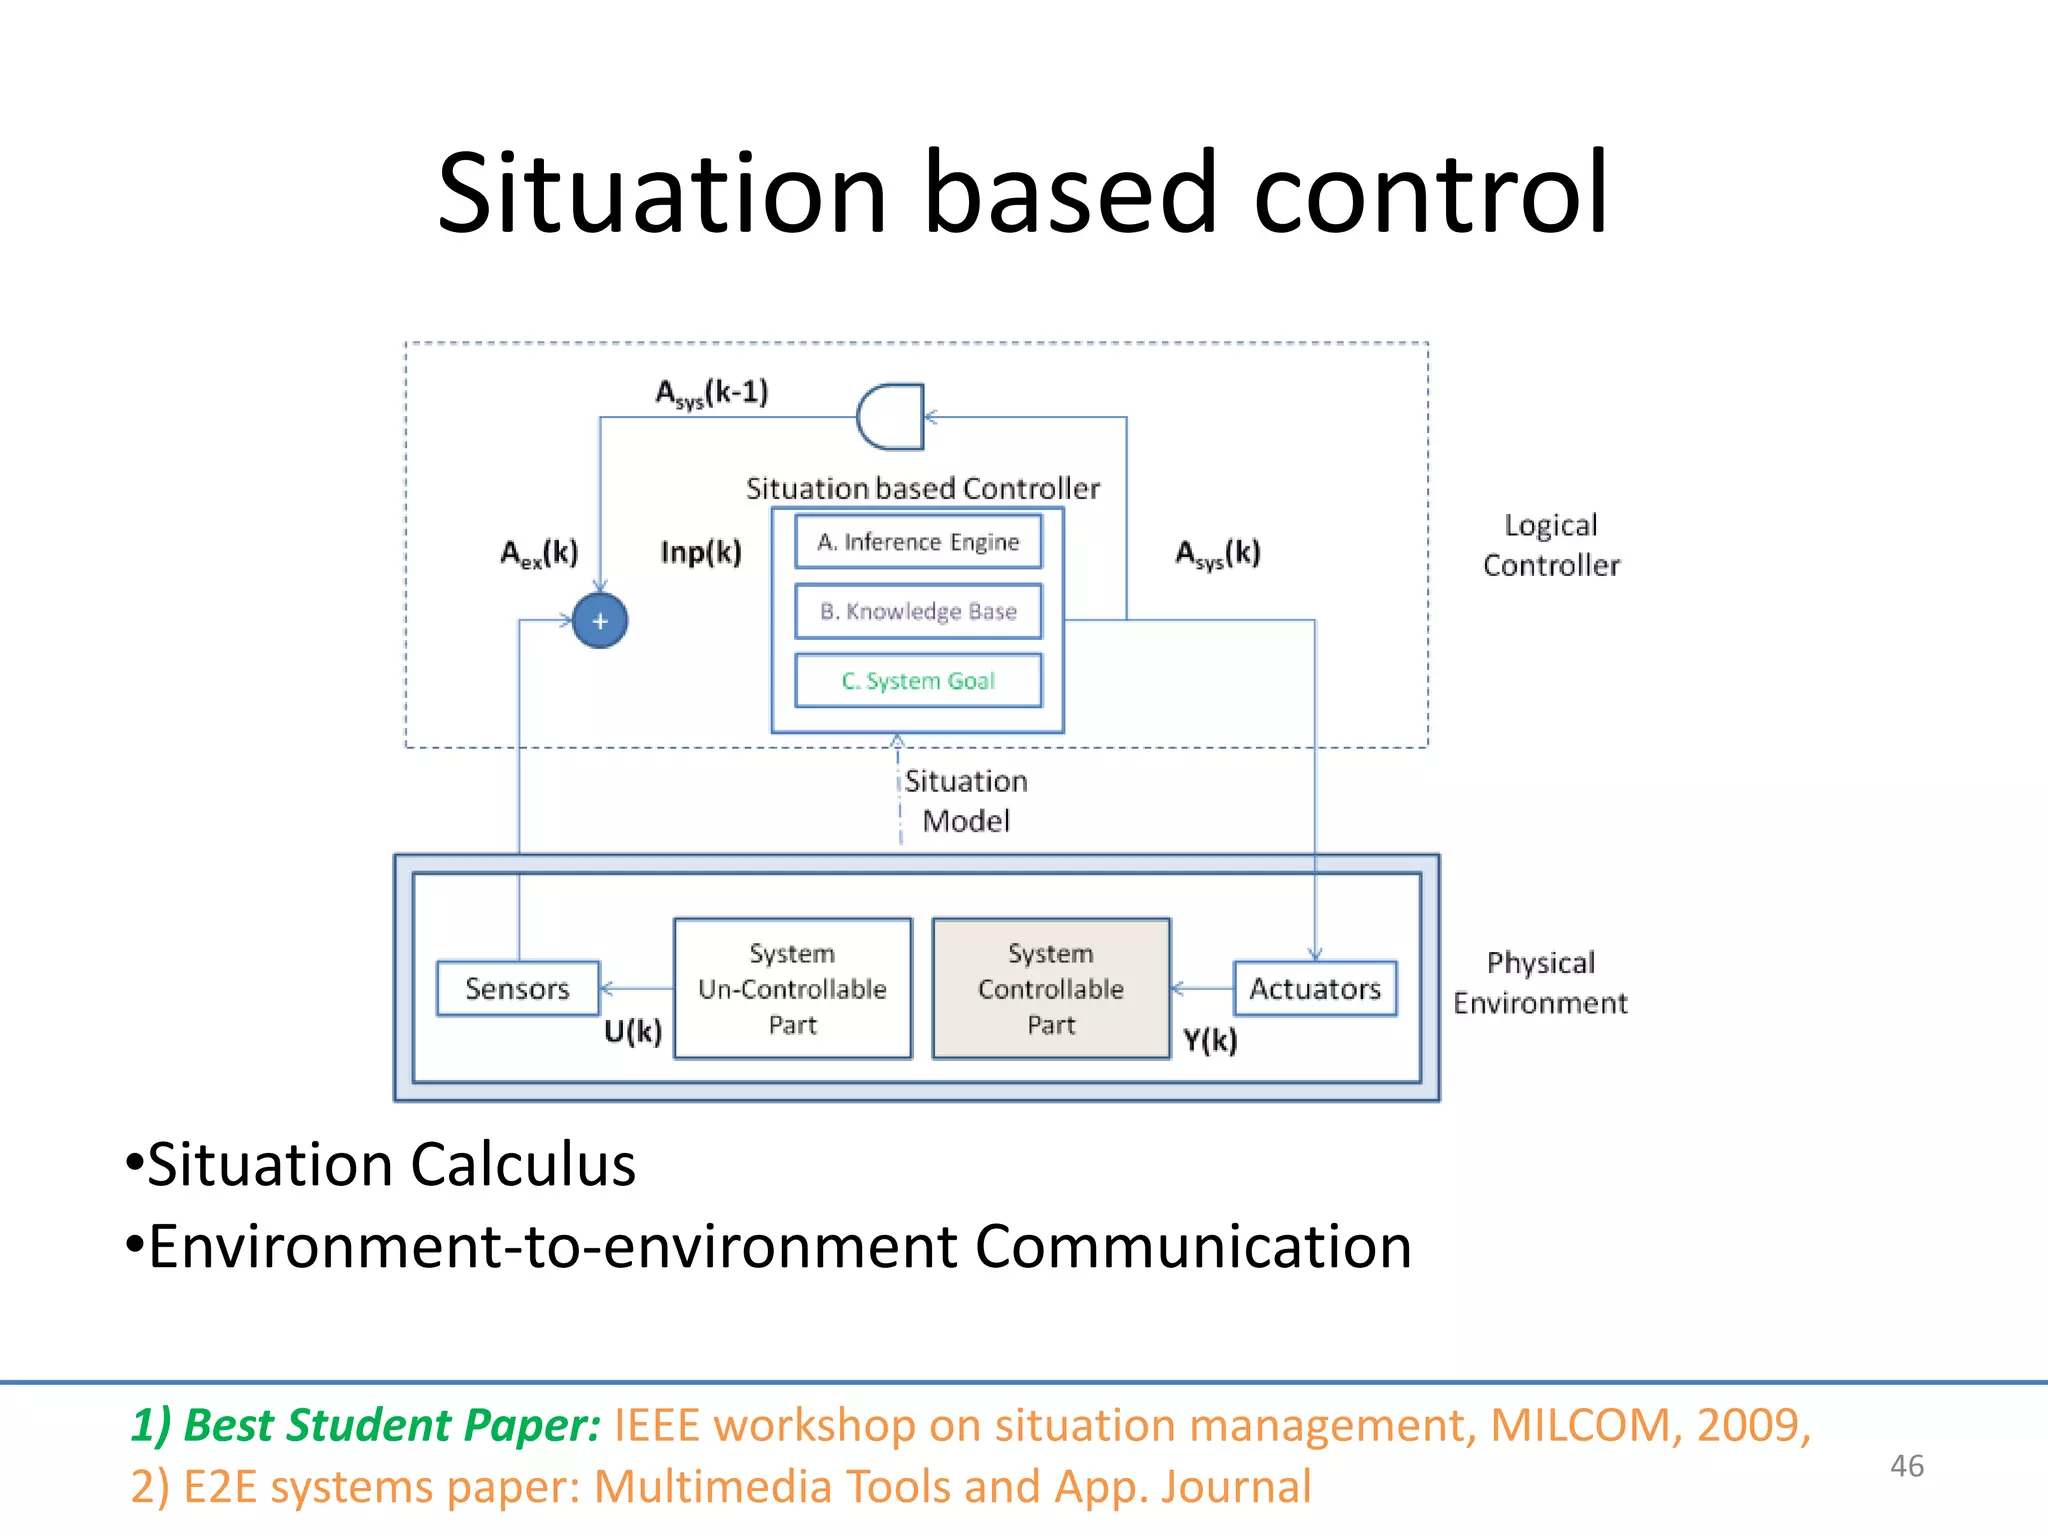
Situation based control
•SituationCalculus
•Environment-to-environment Communication
1) Best Student Paper: IEEE workshop on situation management, MILCOM, 2009,
46
2) E2E systems paper: Multimedia Tools and App. Journal
47.
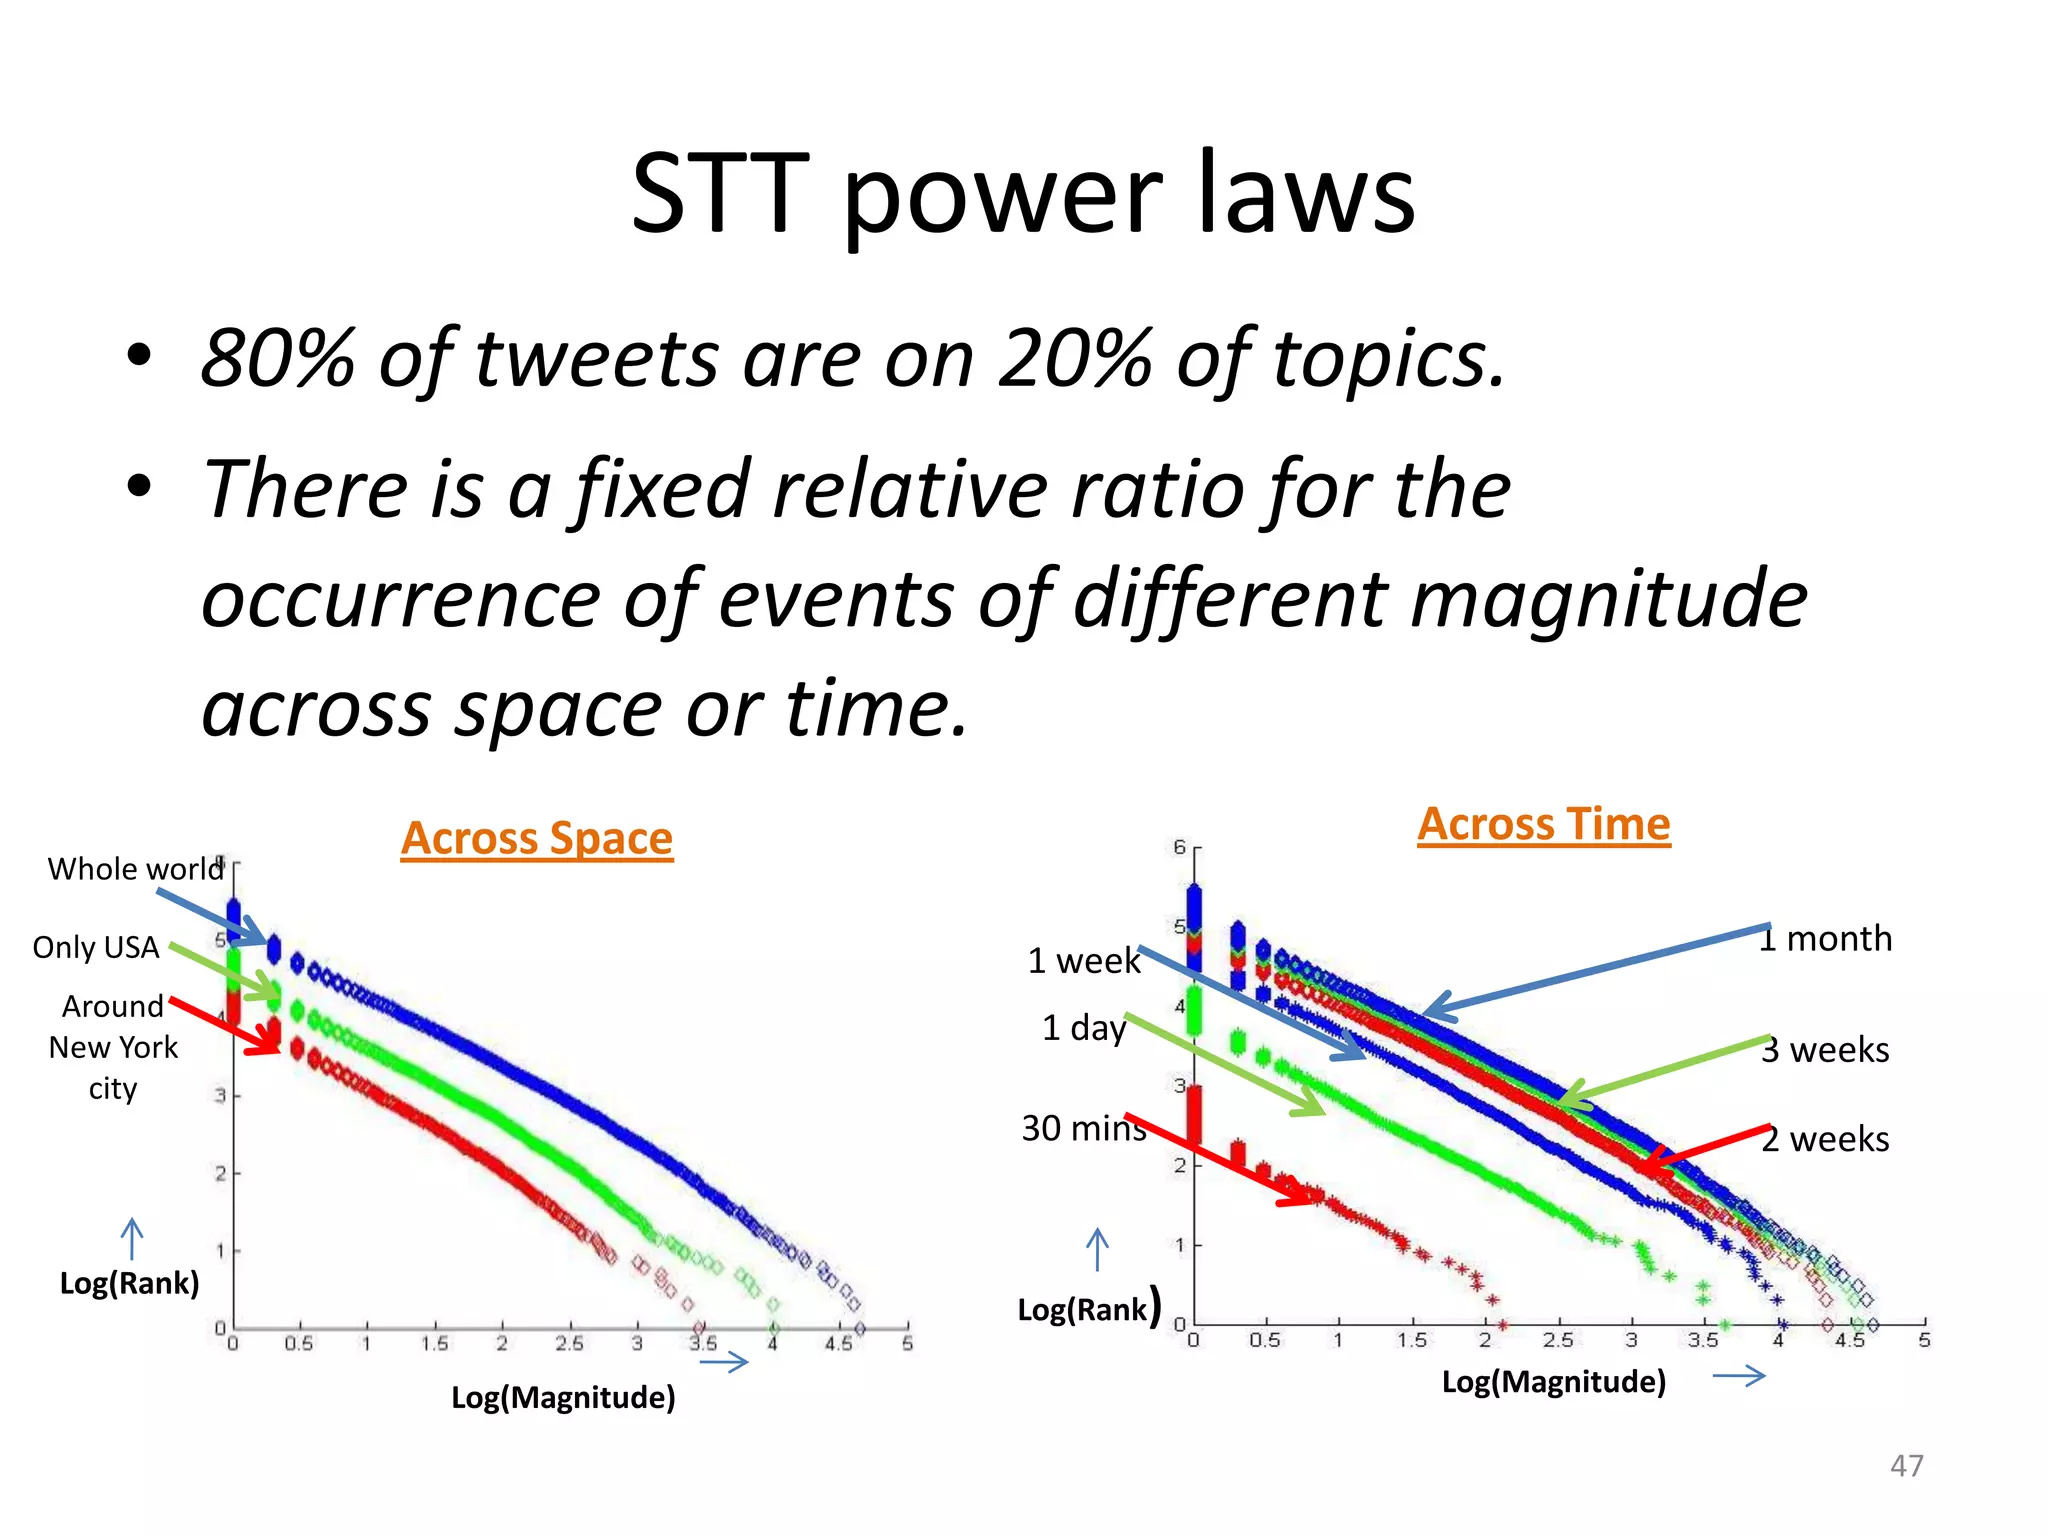
STT power laws
• 80% of tweets are on 20% of topics.
• There is a fixed relative ratio for the
occurrence of events of different magnitude
across space or time.
Across Space Across Time
Whole world
Only USA 1 month
1 week
Around
1 day
New York 3 weeks
city
30 mins 2 weeks
Log(Rank)
Log(Rank)
Log(Magnitude) Log(Magnitude)
47
48.
User behavior modeling:incentivizing
crowd sensing…
• User perspective:
• Optimal contribution strategy i.e. “when (and
when not) should she undertake the social
media task”
• System designer perspective:
• “Finding the optimal incentive levels to
influence these selfish end-users so that the
overall system utility is maximized”
Best Paper, ACM Workshop on Social Media, 2009 48
49.
Summary
• Computationally definedsituations
• Proposed a generic situation modeling
framework
– STT data representation /aggregation
– Across granularity
– Characterization Operations
– Domain knowledge
• Aggregated human and sensor network data
49
50.
Work Plan
1. MeasuringSituation Models?
2. Applications:
– More robust analysis for allergy
– Another application
3. System building?
4. Leave control aspect for future work?
5. Include/Exclude other research threads
50
![iPhone theme AT&T
based e-mage, retail
Jun 2 to Jun 11 locations
. Convolution
Store
+ Add
* catchment
area
Subtract
Aggregate AT&T total
interest - catchment
area
<geoname>
Convolution
. Maxima Decision
<name>College City</name>
<lat>39.0057303</lat>
<lng>-122.0094129</lng>
Best Location is at <geonameId>5338600</geonameId>
* Geocode [39, -122] ,
just north of Bay
Area, CA
<countryCode>US</countryCode>
<countryName>United
States</countryName>
<fcl>P</fcl>
<fcode>PPL</fcode>
<fclName>city, village,...</fclName>
<fcodeName>populated
place</fcodeName>
<population/>
Under-served <distance>1.0332</distance>
</geoname>
interest areas Store catchment 20](https://image.slidesharecdn.com/topicdefense-20110602-120313130254-phpapp02/75/Topic-defense-Situation-modeling-and-detection-20-2048.jpg)
![Seasonal characteristics analysis
• Show me the difference between red and
green colors for New England region, as it
varies throughout the year
( -( sum ( t <= 1yr theme = Green R=[(40,-76), (44,-71)] (TES)),
sum( t <= 1yr theme = Red R=[(40,-76), (44,-71)] (TES))))
22](https://image.slidesharecdn.com/topicdefense-20110602-120313130254-phpapp02/75/Topic-defense-Situation-modeling-and-detection-22-2048.jpg)
![Variations throughout the year
– Fall colors of New England
– [R-G] channel data
0
Jan Dec
• Total Energy
Jan Dec
23](https://image.slidesharecdn.com/topicdefense-20110602-120313130254-phpapp02/75/Topic-defense-Situation-modeling-and-detection-23-2048.jpg)
![Pandemic
Low, mid,
high level Φ CDC reports
Number of Size of % of Population ϵƦ
Outbreak events high activity zone at Risk [0,1]
@ @
-Emage
Events(#reports) Locations with Population at
(High activity)
high activity Locations
Δ @
∏ Δ
-Emage -Emage
(#reports) (#reports) S-t-t
Δ Δ
(population)
∏
S-t-t (#reports) S-t-t (#reports)
Census
Δ ∏
Twitter Twitter
32](https://image.slidesharecdn.com/topicdefense-20110602-120313130254-phpapp02/75/Topic-defense-Situation-modeling-and-detection-32-2048.jpg)


![Coded Agents – with UiPath SDK + LangGraph [Virtual Hands-on Workshop]](https://cdn.slidesharecdn.com/ss_thumbnails/codedagentsdeck-251215155422-5497c599-thumbnail.jpg?width=640&height=640&fit=bounds)


