Download to read offline

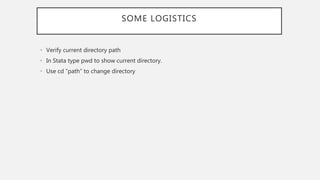
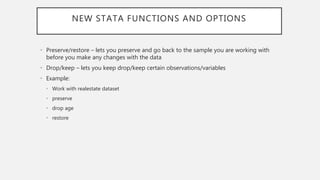
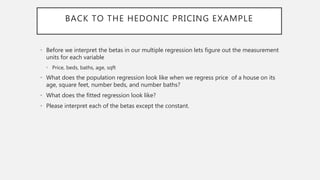
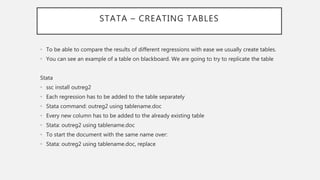
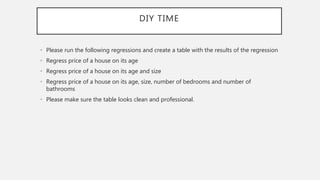
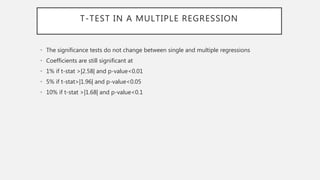
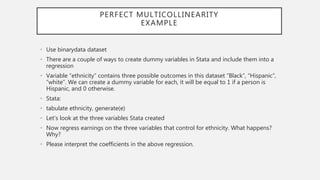

This document provides an overview of multiple regression analysis in Stata. It discusses including multiple independent variables in a regression to control for other factors, using commands like preserve and restore. It also covers creating tables of regression results in Stata using outreg2, issues like multicollinearity, and interpreting coefficients in regressions with dummy variables. Examples use housing data to examine the relationship between price, age, size and other characteristics.