Download to read offline


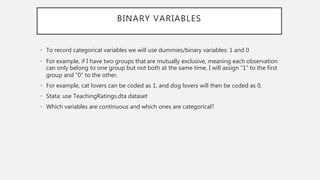

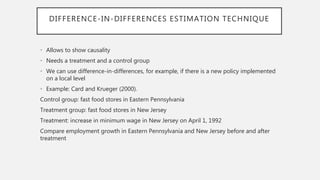


- Categorical variables are variables that are described by words rather than numbers, like "cat person" vs "dog person". Continuous variables take numerical values like income or test scores. - To analyze the effect of a categorical variable in a regression, it must be converted into a binary variable using 0s and 1s. This allows a comparison of means between the included group and omitted group. - Difference-in-differences estimation compares the change in outcomes over time between a treatment group and a control group, allowing researchers to account for other factors to isolate the causal effect of a treatment or policy. It requires the presence of a treatment and control group as well as pre- and post-treatment observations.