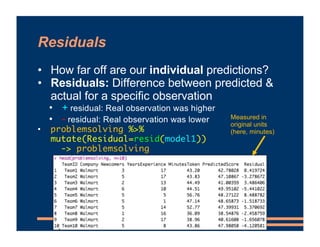
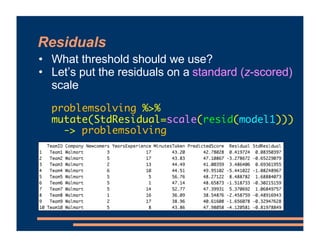
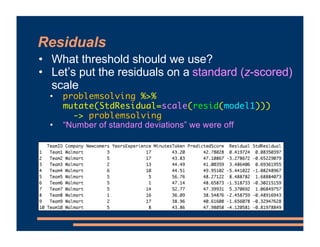
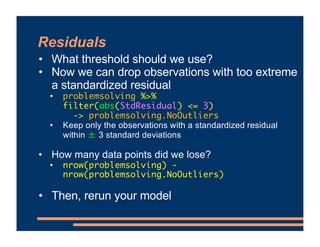
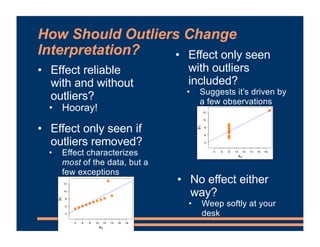
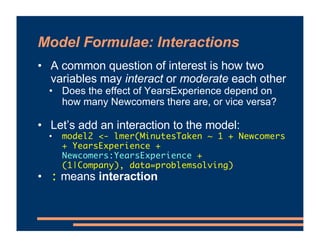
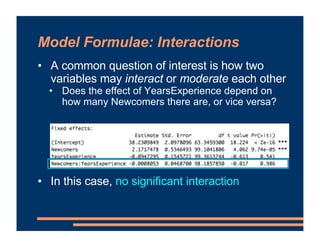
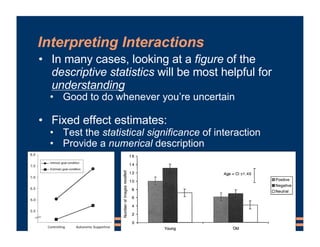
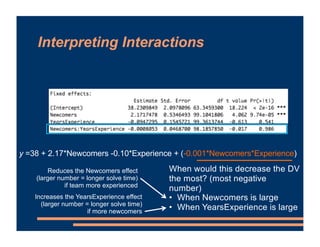
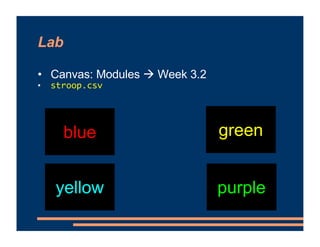
This document provides information about a business course, including that there will be class on Labor Day and lab materials are available on Canvas. It discusses fixed effects in models and how to include them in R scripts. Predicted values from models are covered, along with using residuals to detect outliers and interpreting interactions between variables in models. The document provides examples of adding interaction terms to model formulas and interpreting the results.


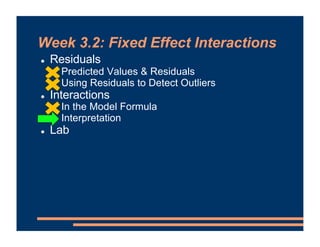
![Residuals
• How far off are our individual predictions?
• Residuals: Difference between predicted &
actual for a specific observation
• “2% or 3% [market share] is
what Apple might get.”
– former Microsoft CEO Steve Ballmer on the iPhone
• Actual iPhone market
share (2014): 43%
• Residual: 40 to 41 percentage points](https://image.slidesharecdn.com/05fixedeffectinteractions-210702022825/85/Mixed-Effects-Models-Fixed-Effect-Interactions-10-320.jpg)


![Week5-TH [Autosaved].pptx Staatistics Stab22](https://cdn.slidesharecdn.com/ss_thumbnails/week5-thautosaved-241029172531-9e9076ea-thumbnail.jpg?width=640&height=640&fit=bounds)