T-Mobile's integration of Sprint is going well and risks are narrowing. The company is on track to cover over 200M people with mid-band 5G by the end of 2021. The author projects strong subscriber growth for T-Mobile and market share gains over the next several years as its 5G network coverage expands. New opportunities in fixed wireless broadband and mobile edge computing could further increase T-Mobile's valuation beyond current estimates that only consider its traditional wireless business. The author's "Home Run Scenario" values T-Mobile reaching $294 per share by 2024 based on robust growth across both its core wireless segments and new 5G markets.
Cushman & Wakefield's Canadian Office Statistical Summary Q4 2018Guy Masse
Q4 2018
Canadian Office Statistical Summary
Driven by buoyant demand from technology companies, extremely tight CBD markets in both Vancouver and Toronto got even tighter over the final quarter of the year, helping drive the National CBD vacancy rate to 8.7% - its lowest point since Q3 2015!
KEY HIGHLIGHTS
• Canadian CBD Class A markets saw absorption of 3.6 msf in 2018, with a fourth quarter contribution of 1.5 msf. This is the strongest premium space growth since 2011.
• The arrival and partial occupancy of Stantec Tower helped drive Q4 2018 absorption in Edmonton’s downtown market to above 800,000 sf, with a final year-end 2018 tally of 1.2 msf.
• Although Calgary continues to see modest momentum in its CBD market, Suburban markets had a strong year with absorption reaching 337,000 sf. This drove vacancy to 16.9% from 19.4% one-year-ago.
• Vacancy in Downtown Toronto reached an incredibly tight 1.9% in Q4, a vacancy rate not seen in over 35 years. Conditions are expected to remain extremely tight until late 2020 when the first in a 10.7 msf wave of new developments will begin to hit the downtown market.
• Downtown Vancouver, another hot market driven by technology growth, saw its vacancy decline to 2.3% in Q4; its lowest point since Q2 2008. Like Toronto, little relief for tenants is not anticipated until the next wave of downtown new supply begins to arrive in late 2020.
Présentation des résultats financiers Ericsson (Q4 2009)Ericsson France
Ericsson a publié ce matin les résultats de l’entreprise pour l’année 2009. Hans Vestberg, nouvellement président-directeur général du groupe depuis le 1er janvier 2010, a commenté les faits saillants au cours d’une conférence de presse en Suède. L’intégralité de ses commentaires est disponible ci-dessous.
Plus d'informations : http://www.blog-ericssonfrance.com/2010/01/le-pdg-du-groupe-ericsson-commente-les-resultats-2009/
2020 has been a challenging year. Yet, amidst the various trials, widespread digital transformation has sparked several triumphs in SaaS. For instance, UiPath made history this summer when they became the first European Cloud Decacorn. Now we’re 10 months in, the question on everyone’s lips is what’s just happened and what’s coming next? In this keynote presentation, Philippe Botteri, Partner and Varun Purandare, VP at Accel will present original findings from Accel’s 2020 Euroscape. They'll explore the biggest trends in SaaS, deep dive into COVID's impacts on the ecosystem and share the region’s top 100 cloud companies.
The Effects Of Brexit On Tata Motors - Big Risk With Potential OpportunitiesColin Johnson
Examined the Multifaceted risks Brexit produced for Tata Motors, a Jaguar Land Rover company. With many moving parts such as the effects of a hard Brexit vs. soft Brexit, the fluctuation of the GBP & Euro, we make recommendations as to how to turn these risks into opportunities.
Financial Results for the Fiscal Year Ended March 2021KDDI
Statements made in these documents with respect to the KDDI Group‘s performance targets, projected subscriber numbers, future forecasts and strategies that are not historical facts are forward-looking statements about the future performance of the KDDI Group, based on company’s assumptions and beliefs in light of the information available at the time they were made. They therefore include certain risks and uncertainties. Actual results can differ from these statements due to reasons including, but not limited to, domestic and overseas situation, economic trends, competitive position, formulation, revision or abolition of laws and ordinances, regulations or systems, government actions or intervention and the success or lack thereof of new services.
Consequently, please understand that there is a possibility that actual performance, subscriber numbers, strategies and other information may differ significantly from the forecast information contained in these materials or other envisaged situations.
Financial Results for the Third Quarter of the Fiscal Year Ending March 2022KDDI
Statements made in these documents with respect to the KDDI Group‘s performance targets, projected subscriber numbers, future forecasts and strategies that are not historical facts are forward-looking statements about the future performance of the KDDI Group, based on company’s assumptions and beliefs in light of the information available at the time they were made. They therefore include certain risks and uncertainties. Actual results can differ from these statements due to reasons including, but not limited to, domestic and overseas situation, economic trends, competitive position, formulation, revision or abolition of laws and ordinances, regulations or systems, government actions or intervention and the success or lack thereof of new services.
Consequently, please understand that there is a possibility that actual performance, subscriber numbers, strategies and other information may differ significantly from the forecast information contained in these materials or other envisaged situations.
This presentation contains forward-looking statements that reflect the current views of Deutsche Telekom management with respect to future events. These forward-looking statements include statements with regard to the expected development of revenue, earnings, profits from operations, depreciation and amortization, cash flows and personnel-related measures. You should consider them with caution. Such statements are subject to risks and uncertainties, most of which are difficult to predict and are generally beyond Deutsche Telekom’s control. Among the factors that might influence our ability to achieve our objectives are the progress of our workforce reduction initiative and other cost-saving measures, and the impact of other significant strategic, labor or business initiatives, including acquisitions, dispositions and business combinations, and our network upgrade and expansion initiatives. In addition, stronger than expected competition, technological change, legal proceedings and regulatory developments, among other factors, may have a material adverse effect on our costs and revenue development. Further, the economic downturn in our markets, and changes in interest and currency exchange rates, may also have an impact on our business development and the availability of financing on favorable conditions. Changes to our expectations concerning future cash flows may lead to impairment write downs of assets carried at historical cost, which may materially affect our results at the group and operating segment levels. If these or other risks and uncertainties materialize, or if the assumptions underlying any of these statements prove incorrect, our actual performance may materially differ from the performance expressed or implied by forward-looking statements. We can offer no assurance that our estimates or expectations will be achieved. Without prejudice to existing obligations under capital market law, we do not assume any obligation to update forward-looking statements to take new information or future events into account or otherwise.
In addition to figures prepared in accordance with IFRS, Deutsche Telekom also presents non-GAAP financial performance measures, including, among others, EBITDA, EBITDA margin, adjusted EBITDA, adjusted EBITDA margin, adjusted EBIT, adjusted net income, free cash flow, gross debt and net debt. These non-GAAP measures should be considered in addition to, but not as a substitute for, the information prepared in accordance with IFRS. Non-GAAP financial performance measures are not subject to IFRS or any other generally accepted accounting principles. Other companies may define these terms in different ways.
Financial Results for the Fiscal Year Ended March 2022KDDI
Statements made in these documents with respect to the KDDI Group‘s performance targets, projected subscriber numbers, future forecasts and strategies that are not historical facts are forward-looking statements about the future performance of the KDDI Group, based on company’s assumptions and beliefs in light of the information available at the time they were made. They therefore include certain risks and uncertainties. Actual results can differ from these statements due to reasons including, but not limited to, domestic and overseas situation, economic trends, competitive position, formulation, revision or abolition of laws and ordinances, regulations or systems, government actions or intervention and the success or lack thereof of new services.
Consequently, please understand that there is a possibility that actual performance, subscriber numbers, strategies and other information may differ significantly from the forecast information contained in these materials or other envisaged situations.
#COVID19's #Digitization of the #Economy and How C19 Winners Lap the Period. #eCommerce forecasts for '20 - '23 and how those influence digital advertising growth.
Amzn q2 20 learnings and the outlook for its business, retail, and our economythomas paulson
Attached is my latest on why #AMZN will double again over the next few years and what the #Amazon Q2 results suggest about the #retail industry, the #RetailApocalypse, our #economy, and our society.
Observations from Q1 Retailer Earnings and C19 Durable Changesthomas paulson
We studied the earnings results from the 20 largest US retailers that have reported their Q1'20/C-19 period business results. From this we have distilled out what we believe to be the durable changes in consumer behavior and the retail industry.
Attached is my pitch deck for this deal:
30% Premium offered to PINS shareholders for this 1:1 all stock deal. PINS shareholders get 12% of the combined company.
60% EPS-non-GAAP earnings year-3 accretion to PYPL.
Synergies come from bringing PayPal merchants to Pinterest to significantly improve ad coverage, using PayPal user data to improve Pinterest's ad relevance, Pinterest merchants defaulting to PayPal for their customers, new ad formats, and significantly more GMV and TPV as a result of these improvements.
No significant regulatory opposition expected.
PayPal would need to set-up a Chinese-Wall and prohibit Pinterest from using PayPal consumer data to attract consumers to Pinterest. PayPal needs to maintain its merchant independence.
Neuro-symbolic is not enough, we need neuro-*semantic*Frank van Harmelen
Neuro-symbolic (NeSy) AI is on the rise. However, simply machine learning on just any symbolic structure is not sufficient to really harvest the gains of NeSy. These will only be gained when the symbolic structures have an actual semantics. I give an operational definition of semantics as “predictable inference”.
All of this illustrated with link prediction over knowledge graphs, but the argument is general.
Software Delivery At the Speed of AI: Inflectra Invests In AI-Powered QualityInflectra
In this insightful webinar, Inflectra explores how artificial intelligence (AI) is transforming software development and testing. Discover how AI-powered tools are revolutionizing every stage of the software development lifecycle (SDLC), from design and prototyping to testing, deployment, and monitoring.
Learn about:
• The Future of Testing: How AI is shifting testing towards verification, analysis, and higher-level skills, while reducing repetitive tasks.
• Test Automation: How AI-powered test case generation, optimization, and self-healing tests are making testing more efficient and effective.
• Visual Testing: Explore the emerging capabilities of AI in visual testing and how it's set to revolutionize UI verification.
• Inflectra's AI Solutions: See demonstrations of Inflectra's cutting-edge AI tools like the ChatGPT plugin and Azure Open AI platform, designed to streamline your testing process.
Whether you're a developer, tester, or QA professional, this webinar will give you valuable insights into how AI is shaping the future of software delivery.
Smart TV Buyer Insights Survey 2024 by 91mobiles.pdf91mobiles
91mobiles recently conducted a Smart TV Buyer Insights Survey in which we asked over 3,000 respondents about the TV they own, aspects they look at on a new TV, and their TV buying preferences.
JMeter webinar - integration with InfluxDB and GrafanaRTTS
Watch this recorded webinar about real-time monitoring of application performance. See how to integrate Apache JMeter, the open-source leader in performance testing, with InfluxDB, the open-source time-series database, and Grafana, the open-source analytics and visualization application.
In this webinar, we will review the benefits of leveraging InfluxDB and Grafana when executing load tests and demonstrate how these tools are used to visualize performance metrics.
Length: 30 minutes
Session Overview
-------------------------------------------
During this webinar, we will cover the following topics while demonstrating the integrations of JMeter, InfluxDB and Grafana:
- What out-of-the-box solutions are available for real-time monitoring JMeter tests?
- What are the benefits of integrating InfluxDB and Grafana into the load testing stack?
- Which features are provided by Grafana?
- Demonstration of InfluxDB and Grafana using a practice web application
To view the webinar recording, go to:
https://www.rttsweb.com/jmeter-integration-webinar
GraphRAG is All You need? LLM & Knowledge GraphGuy Korland
Guy Korland, CEO and Co-founder of FalkorDB, will review two articles on the integration of language models with knowledge graphs.
1. Unifying Large Language Models and Knowledge Graphs: A Roadmap.
https://arxiv.org/abs/2306.08302
2. Microsoft Research's GraphRAG paper and a review paper on various uses of knowledge graphs:
https://www.microsoft.com/en-us/research/blog/graphrag-unlocking-llm-discovery-on-narrative-private-data/
Builder.ai Founder Sachin Dev Duggal's Strategic Approach to Create an Innova...Ramesh Iyer
In today's fast-changing business world, Companies that adapt and embrace new ideas often need help to keep up with the competition. However, fostering a culture of innovation takes much work. It takes vision, leadership and willingness to take risks in the right proportion. Sachin Dev Duggal, co-founder of Builder.ai, has perfected the art of this balance, creating a company culture where creativity and growth are nurtured at each stage.
DevOps and Testing slides at DASA ConnectKari Kakkonen
My and Rik Marselis slides at 30.5.2024 DASA Connect conference. We discuss about what is testing, then what is agile testing and finally what is Testing in DevOps. Finally we had lovely workshop with the participants trying to find out different ways to think about quality and testing in different parts of the DevOps infinity loop.
Search and Society: Reimagining Information Access for Radical FuturesBhaskar Mitra
The field of Information retrieval (IR) is currently undergoing a transformative shift, at least partly due to the emerging applications of generative AI to information access. In this talk, we will deliberate on the sociotechnical implications of generative AI for information access. We will argue that there is both a critical necessity and an exciting opportunity for the IR community to re-center our research agendas on societal needs while dismantling the artificial separation between the work on fairness, accountability, transparency, and ethics in IR and the rest of IR research. Instead of adopting a reactionary strategy of trying to mitigate potential social harms from emerging technologies, the community should aim to proactively set the research agenda for the kinds of systems we should build inspired by diverse explicitly stated sociotechnical imaginaries. The sociotechnical imaginaries that underpin the design and development of information access technologies needs to be explicitly articulated, and we need to develop theories of change in context of these diverse perspectives. Our guiding future imaginaries must be informed by other academic fields, such as democratic theory and critical theory, and should be co-developed with social science scholars, legal scholars, civil rights and social justice activists, and artists, among others.
Transcript: Selling digital books in 2024: Insights from industry leaders - T...BookNet Canada
The publishing industry has been selling digital audiobooks and ebooks for over a decade and has found its groove. What’s changed? What has stayed the same? Where do we go from here? Join a group of leading sales peers from across the industry for a conversation about the lessons learned since the popularization of digital books, best practices, digital book supply chain management, and more.
Link to video recording: https://bnctechforum.ca/sessions/selling-digital-books-in-2024-insights-from-industry-leaders/
Presented by BookNet Canada on May 28, 2024, with support from the Department of Canadian Heritage.
UiPath Test Automation using UiPath Test Suite series, part 4DianaGray10
Welcome to UiPath Test Automation using UiPath Test Suite series part 4. In this session, we will cover Test Manager overview along with SAP heatmap.
The UiPath Test Manager overview with SAP heatmap webinar offers a concise yet comprehensive exploration of the role of a Test Manager within SAP environments, coupled with the utilization of heatmaps for effective testing strategies.
Participants will gain insights into the responsibilities, challenges, and best practices associated with test management in SAP projects. Additionally, the webinar delves into the significance of heatmaps as a visual aid for identifying testing priorities, areas of risk, and resource allocation within SAP landscapes. Through this session, attendees can expect to enhance their understanding of test management principles while learning practical approaches to optimize testing processes in SAP environments using heatmap visualization techniques
What will you get from this session?
1. Insights into SAP testing best practices
2. Heatmap utilization for testing
3. Optimization of testing processes
4. Demo
Topics covered:
Execution from the test manager
Orchestrator execution result
Defect reporting
SAP heatmap example with demo
Speaker:
Deepak Rai, Automation Practice Lead, Boundaryless Group and UiPath MVP
Mission to Decommission: Importance of Decommissioning Products to Increase E...
TMUS ICM November 2020 update 11.9.20
1. 1All rights reserved, Inflection Capital Management, LLC
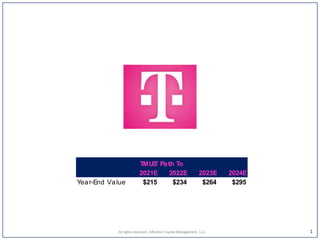
2021E 2022E 2023E 2024E
Year-End Value $215 $234 $264 $295
TMUS' Path To
2. Thesis & Returns Update on The New T-Mobile
Perspective: All are going well six months into the The New T-Mobile's customer/ systems integration, synergies, network build, and
financials. This significantly mitigates the risks of unexpected problems and adverse unknown-unknowns. Moreover, given the improving
offerings for 5G hardware, indications of strong consumer interest for 5G (per trends in Asia), and a compelling 5G network coverage story
for T-Mobile (100M POPs covered w/ mid-band spectrum by year-end), the time is nearing for T-Mobile to significantly increase their
brand and customer acquisition investment--that is to be the 1H'21. As such, we expect T-Mobile to capture most of the industries growth
over the near- to medium-term. Similar to LQ, analysts and PMs can now more confidently invest given that their forecasts are now more
grounded (given 2 quarters of numbers) and the near-term risks narrowed. Post the release, all sell-side estimates that we observed were
revised higher. Separately, for reference, we have been writing on TMUS since mid-2018 with the view that the Sprint merger would be
approved and that TMUS will disrupt the entire TMT industry with the acquired spectrum and 5G. Our July '20 viewpoint is here. Our
confidence in these views increased with the results from TMUS and across the industry.
2
Key Points:
1) Integration complete and the 5G network build pace ramped-up and rapidly bringing real 5G coverage to the country with
>200M people to have mid-band 5G coverage by T-Mobile by the end of '21.
2) Synergies ahead: $1.2B this year and $2.4B (low-ball guidance) in '21. Synergy target to be steadily raised over the next two years.
3) T-Mobile's Financial model continues to track ahead of consensus and largely in-line with our base-case expectations. However,
we have deflated our Home Run Scenario on our better understanding of the shape of the market and potential profitability.
4) TMUS' return potential is accentuated over the next few years as the potential value creation from the merger and the industry's
transformation resulting from 5G unfold and the evidence for demonstrable valuation creation becomes obvious (none of what we
illustrate here as our Home Run Scenario is in sell-side estimates; moreover, it is also likely largely missed by the buy-side as well).
5) We view the biggest risk to TMUS to be internal and not external. Do they execute an impeccable transition to the 5G network? Do
they retain / transition / grow the Sprint subscriber base? Do they capitalize on the opportunities afforded by 5G to offer brilliant and
valued services to consumer and enterprise customers, and significantly disrupt AT&T's and Verizon's legacy positions? Can they
avoid hubris and stakeholder deftness?
Allrightsreserved,InflectionCapitalManagement,LLC
2021E 2022E 2023E 2024E
Dated 11.8.20
Year-End Value $215 $233 $264 $294
Current Price $124 $115 $115 $115
IRR 73% 37% 29% 24%
The New T-Mobile Home Run Scenario
3. 2021E 2022E 2023E 2024E
Total EBITDA-NTM $31,093 $37,778 $40,527 $43,563
Free Cash Flow $1,255 $6,362 $16,092 $18,831
Debt Paydow n $0 -$6,362 -$16,092 -$18,831
Net Debt (ex. Leases) $52,990 $46,629 $30,537 $11,706
Leverage 1.7 x 1.2 x 0.8 x 0.3 x
EV/ EBITDA-FY1 8.5 x 8.3 x 8.1 x 7.8 x
Enterprise Value $321,114 $335,481 $350,942 $361,539
Equity Value $268,123 $288,853 $320,406 $349,833
Diluted Shares Out 1,249 1,249 1,249 1,249
Per Share $215 $231 $257 $280
Revenue $624 $1,969 $3,521 $5,383
EBITDA ($376) $316 $1,143 $2,177
EV/ EBITDA-FY1 8.5 x 8.3 x 8.1 x 7.8 x
Enterprise Value $2,614 $9,207 $17,051
Excess Cash $871
Equity Value $2,614 $9,206 $17,922
Diluted Shares Out 1,249 1,249 1,249
Per Share $2 $7 $14
2021E 2022E 2023E 2024E
Dated 11.8.20
Year-End Value $215 $233 $264 $294
Current Price $124 $124 $124 $124
IRR 73% 37% 29% 24%
The New T-Mobile Home Run Scenario
T-Mobile's Traditional Wireless Biz
New 5G Markets
Explaining The New T-Mobile Home Run Scenario
Part-1: Shown below is a deconstruction of the potential value creation between the traditional wireless business and
the new opportunities that we foresee with 5G . As such, vs. TMUS' current valuation of $250B, we believe that Wall
Street will begin to value TMUS' existing wireless business at $320B for the end of 2021 based upon robust growth
customer and profit growth, and a 2022 EBITDA estimate of $31B (an estimate that will fill in during 2022); moreover,
Wall Street will also begin to attach additional value for "5G optionality". Should these segments grow as we forecast,
TMUS' stock price should increase to $294/sh by the end of 2024.
3
1
2
3
5
4
6 All rights reserved, Inflection Capital Management, LLC
4. The New T-Mobile 2020e 2021e 2022e 2023e 2024e 2025e
Industry Postpay Phone 229,413 238,016 245,752 250,667 255,680 260,793
YoY # Ch 4,129 8,603 7,736 4,915 5,013 5,114
YoY % Ch 1.8% 3.8% 3.3% 2.0% 2.0% 2.0%
TMUS Postpaid Phone Subs 66,894 74,144 79,944 83,424 86,904 89,688
Net Adds 7,250 5,800 3,480 3,480 2,784
TMUS Share 29.2% 31.2% 32.5% 33.3% 34.0% 34.4%
TMUS Adds / Industry Adds 84% 75% 71% 69%
Others 162,519 163,872 165,808 167,243 168,776 171,105
YoY % Ch 0.8% 1.2% 0.9% 0.9% 1.4%
Service Revenue 54,845 60,312 65,944 71,096 74,998 79,228
EBITDA ex. Lease Revenue 22,800 22,966 31,093 37,778 40,527 43,563
Service Margin 41.6% 38.1% 47.2% 53.1% 54.0% 55.0%
2021E 2022E 2023E 2024E
Total EBITDA-NTM $31,093 $37,778 $40,527 $43,563
Free Cash Flow $1,255 $6,362 $16,092 $18,831
Debt Paydow n $0 -$6,362 -$16,092 -$18,831
Net Debt (ex. Leases) $52,990 $46,629 $30,537 $11,706
Leverage 1.7 x 1.2 x 0.8 x 0.3 x
EV/ EBITDA-FY1 8.5 x 8.3 x 8.1 x 7.8 x
Enterprise Value $321,114 $335,481 $350,942 $361,539
Equity Value $268,123 $288,853 $320,406 $349,833
Diluted Shares Out 1,249 1,249 1,249 1,249
Per Share $215 $231 $257 $280
T-Mobile's Traditional Wireless Biz
The Home Run Potential for the Existing Wireless Business
Part-2:
Shown below is our forecasts for the primary drivers of the existing wireless business' forecasted EBITDA. We are
assigning a valuation of $320B to the business as Wall Street draws onto a $31B EBITDA # for 2022. Crucial to our
forecasts are strong ongoing subscriber gains fueled by >3% industry growth and share losses by Verizon or AT&T
. Verizon is at risk due to an inferior and "late" 5G network strategy. AT&T is at risk due to unruly business complexity,
a history of mis-execution, and zero evidence that their content + wireless consumer strategy has consumer appeal and
marketplace effectiveness. We also expect, T-Mobile to earn more 5G revenue from more devices and more data usage
(i.e. higher-tier plans). Margin expansion at TMUS is also a critical driver of value creation. The forecasted margin of
55% for 2025 is far below the average of Verizon's and AT&T's, i.e. there is upside-risk. It will reach their levels in later
years as growth slows.
4
1
3
4
2
All rights reserved, Inflection Capital Management, LLC
5. The New T-Mobile New
5G Markets 2021E 2022E 2023E 2024E 2025E 2026E 2027E 2028E 2029E 2030E
Transformation Lifts $-m illions
Fixed Broadband (i.e. home broadband w/ signal going from c ellular radio to a 5G antenee plac ed in a window)
Total Broadband Sub Mkt 100,919 102,937 104,996 107,096 109,238 111,423 113,651 115,924 118,243 120,608
Market Share 1% 3% 5% 7% 8% 8% 8% 8% 8% 8%
Subsc ribers 1,009 3,088 5,250 7,497 8,739 8,914 9,092 9,274 9,459 9,649
ARPU $50.00 $50.00 $50.00 $50.00 $50.00 $50.00 $50.00 $50.00 $50.00 $50.00
Revenue $606 $1,853 $3,150 $4,498 $5,243 $5,348 $5,455 $5,564 $5,676 $5,789
Expense $750 $1,374 $2,022 $2,696 $3,069 $3,121 $3,175 $3,229 $3,285 $3,342
EBITDA (50% incremental) ($144) $479 $1,128 $1,802 $2,174 $2,227 $2,280 $2,335 $2,391 $2,447
Mobile Edge Compute MEC
PaaS/SaaS per Gartner ($ B) $37 $60 $96 $114 $133 $155 $177 $199 $221 $243
US @70% $26 $42 $67 $80 $93 $109 $124 $139 $155 $170
33% Size of PaaS/SaaS $9 $14 $22 $26 $31 $36 $41 $46 $51 $56
Penetration 2% 8% 16% 32% 64% 82% 100% 100% 100% 100%
US Industry ($B) $0 $1 $4 $8 $20 $29 $41 $46 $51 $56
Operator Take (30%) $0 $0 $1 $3 $6 $9 $12 $14 $15 $17
TMUS Market Share 35% 35% 35% 35% 35% 35% 35% 35% 35% 35%
Revenue ($ M ) $18 $116 $371 $885 $2,065 $3,083 $4,293 $4,827 $5,360 $5,894
Expense $250 $279 $356 $510 $864 $1,169 $1,533 $1,693 $1,853 $2,013
EBITDA (70% incremental) ($232) ($163) $15 $375 $1,201 $1,913 $2,761 $3,134 $3,508 $3,881
New 5G Markets
Revenue $624 $1,969 $3,521 $5,383 $7,308 $8,431 $9,748 $10,391 $11,036 $11,683
EBITDA ($376) $316 $1,143 $2,177 $3,375 $4,140 $5,041 $5,469 $5,898 $6,329
EV/ EBITDA-FY1 8.5 x 8.3 x 8.1 x 7.8 x 7.6 x 7.4 x 7.2 x 6.9 x 6.7 x 6.5 x
Enterprise Value $2,614 $9,207 $17,051 $25,691 $30,597 $36,134 $37,988 $39,660 $41,148
Excess Cash $871 $2,221 $3,877 $5,893 $8,081 $10,440 $12,972
Equity Value $2,614 $9,206 $17,922 $27,912 $34,474 $42,027 $46,069 $50,100 $54,120
Diluted Shares Out 1,237 1,237 1,237 1,237 1,237 1,219 1,184 1,149 1,109
Per Share $2 $7 $14 $23 $28 $34 $39 $44 $49
Foresee that high
competition in the
market significantly
limits pricing and
TMUS' share.
Assumes that MEC
tracks Paas/Saas with
a five year delay &
that MEC is only half
the size of these two.
Take rate for the
facilities operator for
running AMZN / MSFT
/ GOOGL edge
products.
The Value for "5G optionality" for The New T-Mobile
Part-3:
o Shown below is our forecasts for the new markets the we foresee coming from 5G.
o Both T-Mobile and Verizon were optimistic on fixed-wireless broadband.
o T-Mobile spoke of expanding fixed-wireless broadband trials (to over 450 cities) during the Q3 call and one would
expect the topic to be a meaningful part of its Q1 investor day. T-Mobile's focus is primarily rural and other
underserved markets--those without a strong incumbent.
5
Other "Platform" and "sharing-
opportunities" exist for
advertising, subscriptions,
VR/AR, payments, healthcare,
manufacturing, autonomous,
and the 5G KILLER APP.
Allrightsreserved,InflectionCapitalManagement,LLC
6. Subscribers:
o T-Mobile produced solid subscriber growth in Q3, despite the discontinuation of the Sprint brand and AT&T's aggressive phone
promotions to lock-in subscribers which materially decreased its churn of subscribers onto the market (a YoY delta of 500K).
Additionally, we suspect that T-Mobile's customer acquisition efforts have been dialed back as it put the priorities of getting Sprint
integrated and setting up to capture the merger synergies.
o Looking forward to 2021, we expect the market's growth to accelerate due to consumer interest in 5G and better connectivity (similar
to as why fixed-line broadband accelerated this year).
o In our Home Run Scenario, we foresee T-Mobile capturing the majority of that market expansion due to the reversal of that shared in
bullet-1, a step-up in business development efforts in enterprise and government (underpenetrated markets for them at only 9 pts vs.
29% overall), gains in rural markets due to more stores and better coverage (also an underpenetrated market for them), lower Sprint
churn, and a significant nationwide marketing effort touting its 2.5GHz 5G coverage of >100M POPs. This campaign's objective
would be to position T-Mobile as "the best network" and the "network that offered real 5G value to everywhere--not just mmW
hotspots." I.e. to be the provider to subscribe to if you want 5G. Historically, "network focus / prioritization" is the more premium-end of
the market; thus, T-Mobile is making a frontal assault on Verizon's and AT&T's customer base. That market share capture should
continue for the next few years until Verizon deployes its CBAN 5G (vs. its current more limited and spot-specific mmW coverage).
6All rights reserved, Inflection Capital Management, LLC
The New T-Mobile 1Q20 Q2'20 3Q20 4Q20 2020e 2021e 2022e 2023e 2024e
Industry Postpay Phone 225,894 224,748 226,873 229,413 229,413 238,016 245,752 250,667 255,680
YoY # Ch 2,125 2,540 4,129 8,603 7,736 4,915 5,013
YoY % Ch 2.7% 2.4% 2.6% 2.7% 1.8% 3.8% 3.3% 2.0% 2.0%
TMUS Postpaid Phone Subs 64,852 65,105 65,794 66,894 66,894 74,144 79,944 83,424 86,904
Net Adds 253 689 1,100 7,250 5,800 3,480 3,480
TMUS Share 28.7% 29.0% 29.0% 29.2% 29.2% 31.2% 32.5% 33.3% 34.0%
TMUS Adds / Industry Adds 84% 75% 71% 69%
In recent years, TMUS has captured 60-70% of
the market's growth. Being the "challenger" and
disruptor allowed them to do so. Over the next
few years, we expect that win rate to continue
because it will have the market's best network
and best price, and for the reasons noted
above.
Key Focal Points / Drivers Over Next Year for Home Run Scenario
7. The New T-Mobile 2020E 2021E 2022E
Service revenues $54,851 $60,363 65,995
YoY $ ch $2,824 $5,512 $5,632
Growth Factor 1.5 x 2.0 x 1.0 x
% yoy growth 5% 10% 9%
Equipment revenues 19,744 27,061 25,873
Legacy Other revenues 1,046 800 800
Total revenues $75,642 $88,224 $92,668
% yoy growth 3.4% 16.6% 5.0%
Synergies
COGS-Cumulative ($4B rgt) -600 -1,600 -4,000
SG&A-Cumulative ($2B tgt) -600 -2,000 -3,000
Total -1,200 -3,600 -7,000
Cost of equipment 17,333 24,355 23,286
% of Equipment Revenue 87.8% 90.0% 90.0%
Network expense 12,911 13,729 11,950
% of Service Revenue 23.5% 22.7% 18.1%
ex-Synergies 24.6% 25.4% 24.2%
SG&A ex. SBC 18,887 20,331 19,805
% of Service Revenue 34.4% 33.7% 30.0%
ex-Synergies 35.5% 37.0% 34.6%
YoY $ ch ex. Synergies $2,844 $474
EBITDA ex SBC 28,006 30,370 38,174
Equipment Lease Rev & EBITDA -$5,331 -$7,306 -$6,986
Historic EBITDA Definition $22,675 $23,063 $31,188
YoY $ ch Adj. $389 $8,125
YoY $ Ch ex. Synergies -$2,011 $4,725
Key Focal Points / Drivers Over Next Year for Home Run Scenario
7
Allrightsreserved,InflectionCapitalManagement,LLC
Equipment revenue and cost for new 5G phones will
be a major driver of revenue and expense in '21, as
well as the 5G network's depreciation and cost.
Guidance for 2021's synergies is $2.4B. We expect
that to be raised throughout the year to $2.6B given
prior precedent and the "beat & raise" style of
management
Additionally, we expect that total synergies exceed the
currently stated target of $6B, which is more and
earlier than guided.
Cost of Equipment relative to revenue is a critical
determinant of profits and indicator of the industry's
competitive intensity. We are modeling a slight
increase in that intensity.
We suspect that most of the near-term network
synergies are going to be obfuscated by the start-up
costs for the 5G network. However, as the penetration of
5G subscribers increases, eventually the duplicative 4G
costs will be "decommissioned" and where the 5G
network's fixed costs significantly leverage.
We expect that most of the near-term SG&A synergies to
be re-invested in growth, such as business development
efforts in the underpenetrated sub-segments of the
market and in a large nationwide marketing campaign to
drive awareness of T-Mobile's 5G network and coverage
and elevate the T-Mobile network's brand equity.
However, in '22 the synergies should show through as investments
are curtailed; that in combination with significant revenue growth, will
allow for a powerful EBITDA year in '22.