SlideShare a Scribd company logo
1 of 6
Download to read offline
OFFICE HIGHLIGHTS
ALL CLASSES
ONE YEAR
AGO
CURRENT
QUARTER
DIRECTION
Central 10.5% 8.7%
Suburban 13.7% 11.9%
Combined 11.9% 10.1%
CLASS A
Central 9.9% 7.8%
Suburban 14.8% 11.9%
Combined 11.9% 9.5%
NATIONAL AVAILABILITY SNAPSHOT
Technology continues to be the key driver of
Central area office markets and this momentum
will continue over 2019.
Moderate Suburban growth continues to erode
availability, with the overall vacancy rate falling
to 11.9% from 13.7% one year ago.
CENTRAL
TOMORROW’S MARKET
Central Class A Availability
Strong expansionary growth in Toronto, Vancouver, and Montreal helped
drive the availability rate to it’s lowest level since Q1 2015.
7.8%
Overall New Supply
As new supply eases, development announcements abound, particularly in
Toronto and Vancouver. An impressive 16.4 msf of product is set to arrive
over the next five years.
2.5 MSF
SUBURBAN
Q4 2018
Canadian Office Statistical Summary
Overall Market All Classes
©2019 Cushman & Wakefield ULC, Brokerage. All rights reserved. The information contained within this report is gathered from multiple sources believed to be reliable. The information may contain
errors or omissions and is presented without any warranty or representations as to its accuracy.
4.5 MSF
Central Absorption
2018 absorption reached levels unseen since 2011, with four major markets
individually surpassing 800,000 sf. Q4 absorption reached 1.6 MSF.
1 Year Ago 1 Quarter Ago Current Quarter Current Quarter Year to Date Current Quarter Year to Date
Vancouver 58,610,654 2,334,169 6.5% 4.3% 4.0% 144,210 701,433 942,705 2,286,532 $24.49 $15.36 $39.85
Edmonton 28,885,622 4,200,422 16.2% 15.0% 14.5% 682,492 903,992 705,037 978,018 $18.25 $15.55 $33.80
Calgary 72,422,928 15,020,099 22.1% 21.7% 20.7% 0 0 256,959 317,816 $15.25 $19.31 $34.56
Winnipeg 13,684,959 1,214,934 6.5% 9.0% 8.9% 0 365,000 17,461 (3,883) $17.10 $12.52 $29.62
Toronto 176,971,072 10,489,121 7.0% 6.5% 5.9% 99,100 533,956 692,522 1,889,646 $23.47 $20.16 $43.63
Kitchener 4,766,792 733,346 17.4% 12.1% 15.4% 0 0 (158,525) 92,218 $13.53 $11.81 $25.34
Waterloo 7,278,068 1,160,878 19.3% 16.4% 16.0% 0 21,350 33,489 284,318 $15.25 $9.87 $25.12
Ottawa 41,031,213 3,187,770 11.6% 8.5% 7.8% 0 0 287,421 1,220,246 $17.23 $17.47 $34.70
Montreal 95,038,513 10,854,287 14.6% 12.5% 11.4% 0 0 230,211 1,048,148 $16.15 $16.43 $32.58
Fredericton 1,919,986 98,296 7.4% 5.5% 5.1% 0 0 7,610 28,176 $13.80 $9.94 $23.74
Saint John 2,313,502 409,684 20.1% 18.5% 17.7% 0 0 17,661 54,985 $12.36 $10.57 $22.93
Moncton 2,954,336 278,803 10.8% 9.8% 9.4% 0 0 10,587 38,782 $12.99 $11.34 $24.33
Halifax 12,354,803 1,917,231 15.5% 15.1% 15.5% 0 0 (49,559) (46,286) $14.81 $13.10 $27.91
St. John's 3,804,632 748,141 21.4% 20.5% 19.7% 0 0 31,074 60,482 $21.49 $13.28 $34.77
National 522,037,080 52,647,181 11.9% 10.7% 10.1% 925,802 2,525,731 3,024,653 8,249,198 $19.60 $17.59 $37.19
Market
Net
Rent
Additional
Rent
Gross
Rent
Current
Inventory
Current
Availability
Availability Rate 2018 New Supply 2018 Absorption
©2019 Cushman & Wakefield ULC, Brokerage. All rights reserved. The information contained within this report is gathered from multiple sources believed to be reliable.
The information may contain errors or omissions and is presented without any warranty or representations as to its accuracy.
Q4 2018
Canadian Office Statistical Summary
Central Market All Classes
1 Year Ago 1 Quarter Ago Current Quarter Current Quarter Year to Date Current Quarter Year to Date
Vancouver 34,185,356 763,590 5.1% 2.2% 2.2% 93,910 350,106 465,399 1,236,121 $32.32 $19.14 $51.46
Edmonton 17,358,804 1,747,750 15.5% 11.7% 10.1% 616,250 616,250 808,532 1,216,606 $20.52 $17.94 $38.46
Calgary 51,229,809 11,427,944 23.2% 23.2% 22.3% 0 0 (11,211) (19,687) $15.14 $19.74 $34.88
Winnipeg 10,540,049 1,058,857 6.9% 9.8% 10.0% 0 365,000 (24,181) (12,404) $17.49 $13.11 $30.60
Toronto 89,818,048 1,773,641 2.9% 2.4% 2.0% 68,500 68,500 262,545 876,474 $30.72 $24.35 $55.07
Kitchener 2,568,745 487,505 18.3% 13.3% 19.0% 0 0 (144,692) (17,064) $13.11 $13.47 $26.58
Waterloo 1,686,273 116,533 6.2% 6.9% 6.9% 0 21,350 (33) 29,389 $16.65 $12.83 $29.48
Ottawa 18,636,932 1,290,746 9.3% 7.3% 6.9% 0 0 71,891 271,743 $19.68 $19.58 $39.26
Montreal 55,689,494 4,607,471 12.2% 9.6% 8.3% 0 0 193,137 924,774 $18.12 $19.57 $37.69
Fredericton 1,919,986 98,296 7.4% 5.5% 5.1% 0 0 7,610 28,176 $13.80 $9.94 $23.74
Saint John 2,313,502 409,684 20.1% 18.5% 17.7% 0 0 17,661 54,985 $12.36 $10.57 $22.93
Moncton 2,954,336 278,803 10.8% 9.8% 9.4% 0 0 10,587 38,782 $12.99 $11.34 $24.33
Halifax 6,155,436 1,251,303 17.6% 18.5% 20.3% 0 0 (116,068) (169,440) $15.09 $14.46 $29.55
St. John's 1,664,919 421,536 29.1% 27.3% 25.3% 0 0 33,495 57,917 $26.05 $15.35 $41.40
National 296,721,689 25,733,659 10.5% 9.3% 8.7% 778,660 1,421,206 1,574,672 4,516,372 $21.15 $20.24 $41.39
Market
Additional
Rent
Gross
Rent
2018 AbsorptionAvailability Rate
Current
Inventory
Current
Availability
2018 New Supply
Net
Rent
Q4 2018
Canadian Office Statistical Summary
Central Market All Classes
©2019 Cushman & Wakefield ULC, Brokerage. All rights reserved. The information contained within this report is gathered from multiple sources believed to be reliable.
The information may contain errors or omissions and is presented without any warranty or representations as to its accuracy.
Q4 2018
Canadian Office Statistical Summary
Suburban Market All Classes
1 Year Ago 1 Quarter Ago Current Quarter Current Quarter Year to Date Current Quarter Year to Date
Vancouver 24,425,298 1,570,579 8.6% 7.3% 6.4% 50,300 351,327 477,306 1,050,411 $20.57 $12.95 $33.52
Edmonton 11,526,818 2,452,672 17.4% 19.9% 21.3% 66,242 287,742 (103,495) (238,588) $16.57 $13.78 $30.35
Calgary 21,193,119 3,592,155 19.4% 18.2% 16.9% 0 0 268,170 337,503 $16.12 $15.71 $31.83
Winnipeg 3,144,910 156,077 5.2% 6.3% 5.0% 0 0 41,642 8,521 $14.69 $9.57 $24.26
Toronto 87,153,024 8,715,480 11.2% 10.7% 10.0% 30,600 465,456 429,977 1,013,172 $15.90 $15.71 $31.61
Kitchener 2,198,047 245,841 16.2% 10.6% 11.2% 0 0 (13,833) 109,282 $14.42 $7.74 $22.16
Waterloo 5,591,795 1,044,345 23.2% 19.3% 18.7% 0 0 33,522 254,929 $15.15 $9.65 $24.80
Ottawa 22,394,281 1,897,024 13.5% 9.6% 8.5% 0 0 215,530 948,503 $14.61 $15.13 $29.74
Montreal 39,349,019 6,246,816 17.1% 16.5% 15.9% 0 0 37,074 123,374 $13.27 $12.11 $25.38
Fredericton n/a n/a n/a n/a n/a n/a n/a n/a n/a n/a n/a n/a
Saint John n/a n/a n/a n/a n/a n/a n/a n/a n/a n/a n/a n/a
Moncton n/a n/a n/a n/a n/a n/a n/a n/a n/a n/a n/a n/a
Halifax 6,199,367 665,928 13.4% 11.8% 10.7% 0 0 66,509 123,154 $14.52 $11.73 $26.25
St. John's 2,139,713 326,605 15.4% 15.2% 15.3% 0 0 (2,421) 2,565 $17.43 $11.15 $28.58
National 225,315,391 26,913,522 13.7% 12.6% 11.9% 147,142 1,104,525 1,449,981 3,732,826 $15.80 $14.16 $29.96
Market
Net
Rent
Additional
Rent
Gross
Rent
Current
Inventory
Current
Availability
Availability Rate 2018 New Supply 2018 Absorption
©2019 Cushman & Wakefield ULC, Brokerage. All rights reserved. The information contained within this report is gathered from multiple sources believed to be reliable.
The information may contain errors or omissions and is presented without any warranty or representations as to its accuracy.
Q4 2018
Canadian Office Statistical Summary
Overall Market Class A
1 Year Ago 1 Quarter Ago Current Quarter Current Quarter Year to Date Current Quarter Year to Date
Vancouver 32,777,703 1,263,848 6.9% 4.5% 3.9% 144,210 701,433 794,959 1,815,610 $27.06 $15.24 $42.30
Edmonton 18,149,419 2,789,249 18.2% 16.5% 15.4% 682,492 903,992 762,249 1,023,816 $20.90 $17.04 $37.94
Calgary 49,657,638 9,799,214 21.8% 21.1% 19.7% 0 0 210,462 349,913 $17.06 $20.41 $37.47
Winnipeg 3,486,925 360,926 7.6% 10.5% 10.4% 0 365,000 6,939 241,936 $25.58 $16.62 $42.20
Toronto 105,042,598 5,854,302 7.0% 6.2% 5.6% 99,100 533,956 412,638 1,632,993 $26.52 $22.09 $48.61
Kitchener 2,081,928 268,810 14.2% 11.8% 12.9% 0 0 (24,146) 27,342 $14.95 $9.47 $24.42
Waterloo 4,180,162 532,881 17.5% 12.9% 12.7% 0 21,350 5,249 238,734 $15.63 $9.72 $25.35
Ottawa 26,237,436 1,450,401 10.1% 6.6% 5.5% 0 0 252,530 1,020,031 $19.96 $19.71 $39.67
Montreal 40,329,080 4,002,808 13.6% 11.1% 9.9% 0 0 115,630 885,326 $19.34 $20.22 $39.56
Fredericton 720,994 35,791 5.9% 5.0% 5.0% 0 0 0 6,862 $14.58 $11.96 $26.54
Saint John 780,461 101,565 13.4% 15.5% 13.0% 0 0 19,097 3,247 $15.09 $14.91 $30.00
Moncton 1,261,210 53,936 7.5% 4.0% 4.3% 0 0 (3,423) 40,361 $15.11 $13.48 $28.59
Halifax 5,400,976 838,264 17.1% 16.3% 15.5% 0 0 40,137 63,085 $17.29 $13.92 $31.21
St. John's 1,016,036 241,137 26.3% 24.1% 23.7% 0 0 3,855 21,093 $26.54 $16.48 $43.02
National 291,122,566 27,593,132 11.9% 10.4% 9.5% 925,802 2,525,731 2,596,176 7,370,349 $22.50 $19.66 $42.16
Market
Net
Rent
Additional
Rent
Gross
Rent
Current
Inventory
Current
Availability
Availability Rate 2018 New Supply 2018 Absorption
©2019 Cushman & Wakefield ULC, Brokerage. All rights reserved. The information contained within this report is gathered from multiple sources believed to be reliable.
The information may contain errors or omissions and is presented without any warranty or representations as to its accuracy.
Q4 2018
Canadian Office Statistical Summary
Central Market Class A
1 Year Ago 1 Quarter Ago Current Quarter Current Quarter Year to Date Current Quarter Year to Date
Vancouver 17,313,985 265,238 5.0% 1.4% 1.5% 93,910 350,106 336,806 875,560 $40.74 $20.46 $61.20
Edmonton 12,000,184 1,301,380 17.9% 13.2% 10.8% 616,250 616,250 802,208 1,153,296 $23.16 $19.07 $42.23
Calgary 36,568,927 7,279,956 21.2% 21.2% 19.9% 0 0 16,609 10,955 $16.96 $20.89 $37.85
Winnipeg 3,284,540 345,453 7.9% 10.7% 10.5% 0 365,000 6,939 248,986 $25.97 $17.88 $43.85
Toronto 57,614,689 864,350 2.5% 2.2% 1.5% 68,500 68,500 209,956 659,169 $33.58 $26.87 $60.45
Kitchener 903,212 77,948 7.3% 6.7% 8.6% 0 0 (17,305) (12,068) $15.18 $12.53 $27.71
Waterloo 1,278,504 55,292 2.9% 4.7% 4.3% 0 21,350 4,690 23,787 $20.91 $13.30 $34.21
Ottawa 10,837,160 442,768 5.3% 4.6% 4.1% 0 0 59,789 58,074 $24.70 $23.28 $47.98
Montreal 25,371,375 1,725,867 10.2% 8.4% 6.8% 0 0 86,907 536,721 $21.59 $23.10 $44.69
Fredericton 720,994 35,791 5.9% 5.0% 5.0% 0 0 0 6,862 $14.58 $11.96 $26.54
Saint John 780,461 101,565 13.4% 15.5% 13.0% 0 0 19,097 3,247 $15.09 $14.91 $30.00
Moncton 1,261,210 53,936 7.5% 4.0% 4.3% 0 0 (3,423) 40,361 $15.11 $13.48 $28.59
Halifax 2,513,760 565,002 23.0% 21.9% 22.5% 0 0 (13,659) 14,148 $19.02 $15.87 $34.89
St. John's 963,719 241,137 27.7% 25.4% 25.0% 0 0 3,855 21,093 $27.98 $17.37 $45.35
National 171,412,720 13,355,683 9.9% 8.8% 7.8% 778,660 1,421,206 1,512,469 3,640,191 $26.81 $22.84 $49.65
Market
Net
Rent
Additional
Rent
Gross
Rent
Current
Inventory
Current
Availability
Availability Rate 2018 New Supply 2018 Absorption
©2019 Cushman & Wakefield ULC, Brokerage. All rights reserved. The information contained within this report is gathered from multiple sources believed to be reliable.
The information may contain errors or omissions and is presented without any warranty or representations as to its accuracy.
Q4 2018
Canadian Office Statistical Summary
Suburban Market Class A
1 Year Ago 1 Quarter Ago Current Quarter Current Quarter Year to Date Current Quarter Year to Date
Vancouver 15,463,718 998,610 9.0% 8.0% 6.5% 50,300 351,327 458,153 940,050 $22.39 $13.11 $35.50
Edmonton 6,149,235 1,487,869 18.7% 22.7% 24.2% 66,242 287,742 (39,959) (129,480) $18.71 $15.07 $33.78
Calgary 13,088,711 2,519,258 23.3% 20.7% 19.2% 0 0 193,853 338,958 $17.90 $16.03 $33.93
Winnipeg 202,385 15,473 4.2% 7.6% 7.6% 0 0 0 (7,050) $21.24 $9.76 $31.00
Toronto 47,427,909 4,989,952 12.4% 11.2% 10.5% 30,600 465,456 202,682 973,824 $17.91 $16.24 $34.15
Kitchener 1,178,716 190,862 19.6% 15.6% 16.2% 0 0 (6,841) 39,410 $14.85 $7.82 $22.67
Waterloo 2,901,658 477,589 23.9% 16.5% 16.5% 0 0 559 214,947 $15.26 $9.46 $24.72
Ottawa 15,400,276 1,007,633 13.5% 8.0% 6.5% 0 0 192,741 961,957 $16.02 $16.64 $32.66
Montreal 14,957,705 2,276,941 18.3% 15.6% 15.2% 0 0 28,723 348,605 $15.04 $14.71 $29.75
Fredericton n/a n/a n/a n/a n/a n/a n/a n/a n/a n/a n/a n/a
Saint John n/a n/a n/a n/a n/a n/a n/a n/a n/a n/a n/a n/a
Moncton n/a n/a n/a n/a n/a n/a n/a n/a n/a n/a n/a n/a
Halifax 2,887,216 273,262 11.9% 11.3% 9.5% 0 0 53,796 48,937 $15.78 $12.25 $28.03
St. John's 52,317 0 0.0% 0.0% 0.0% 0 0 0 0 $26.00 $11.40 $37.40
National 119,709,846 14,237,449 14.8% 12.7% 11.9% 147,142 1,104,525 1,083,707 3,730,158 $17.79 $15.26 $33.05
Market
Net
Rent
Additional
Rent
Gross
Rent
Current
Inventory
Current
Availability
Availability Rate 2018 New Supply 2018 Absorption

More Related Content

What's hot

JLL Cleveland Office Outlook: Q3 2020
JLL Cleveland Office Outlook: Q3 2020JLL Cleveland Office Outlook: Q3 2020
JLL Cleveland Office Outlook: Q3 2020Andrew Batson
 
Economic Outlook - Derry Enterprise Week
Economic Outlook - Derry Enterprise WeekEconomic Outlook - Derry Enterprise Week
Economic Outlook - Derry Enterprise WeekRichard Ramsey
 
JLL Pittsburgh Industrial Insight & Statistics - Q4 2018
JLL Pittsburgh Industrial Insight & Statistics - Q4 2018JLL Pittsburgh Industrial Insight & Statistics - Q4 2018
JLL Pittsburgh Industrial Insight & Statistics - Q4 2018Tobiah Bilski
 
Before the Open June 2 2017
Before the Open June 2 2017Before the Open June 2 2017
Before the Open June 2 2017John Pendrith
 
JLL Pittsburgh Office Insight & Statistics - Q4 2018
JLL Pittsburgh Office Insight & Statistics - Q4 2018JLL Pittsburgh Office Insight & Statistics - Q4 2018
JLL Pittsburgh Office Insight & Statistics - Q4 2018Tobiah Bilski
 
European Economic CRE Outlook September 2018
European Economic CRE Outlook September 2018European Economic CRE Outlook September 2018
European Economic CRE Outlook September 2018Cushman & Wakefield
 
RMB Morgan Stanley Big Five Investor Conference Presentation September 2018
RMB Morgan Stanley Big Five Investor Conference Presentation September 2018RMB Morgan Stanley Big Five Investor Conference Presentation September 2018
RMB Morgan Stanley Big Five Investor Conference Presentation September 201871point4
 
Cushman & Wakefield Montreal Americas Marketbeat Office Q12019 #CRE #RealEstate
Cushman & Wakefield Montreal Americas Marketbeat Office Q12019  #CRE #RealEstateCushman & Wakefield Montreal Americas Marketbeat Office Q12019  #CRE #RealEstate
Cushman & Wakefield Montreal Americas Marketbeat Office Q12019 #CRE #RealEstateGuy Masse
 
Office Insight and Statistics: Fort Worth (2019-Q2)
Office Insight and Statistics: Fort Worth (2019-Q2)Office Insight and Statistics: Fort Worth (2019-Q2)
Office Insight and Statistics: Fort Worth (2019-Q2)Nick Thomas
 
Before the Open August 14 2017
Before the Open August 14 2017Before the Open August 14 2017
Before the Open August 14 2017John Pendrith
 
Itc ru2 qfy2011-291010
Itc ru2 qfy2011-291010Itc ru2 qfy2011-291010
Itc ru2 qfy2011-291010Angel Broking
 
JLL Detroit Office Insight & Statistics - Q1 2019
JLL Detroit Office Insight & Statistics - Q1 2019JLL Detroit Office Insight & Statistics - Q1 2019
JLL Detroit Office Insight & Statistics - Q1 2019Harrison West
 
Trendeo Industrial investment in Africa may 2018
Trendeo Industrial investment in Africa may 2018Trendeo Industrial investment in Africa may 2018
Trendeo Industrial investment in Africa may 2018Trendeo
 
An overview of the UK Hotels market #ATHotelDesign
An overview of the UK Hotels market #ATHotelDesignAn overview of the UK Hotels market #ATHotelDesign
An overview of the UK Hotels market #ATHotelDesignSIG Design and Technology
 
Before the Open July 19 2017
Before the Open July 19 2017Before the Open July 19 2017
Before the Open July 19 2017John Pendrith
 
JLL Pittsburgh Office Outlook - Q4 2015
JLL Pittsburgh Office Outlook - Q4 2015JLL Pittsburgh Office Outlook - Q4 2015
JLL Pittsburgh Office Outlook - Q4 2015Andrew Batson
 
Arthur D. Little Automotive Report November 2019
Arthur D. Little Automotive Report November 2019 Arthur D. Little Automotive Report November 2019
Arthur D. Little Automotive Report November 2019 Fabrizio Arena
 
JLL Detroit Industrial Insight & Statistics - Q3 2017
JLL Detroit Industrial Insight & Statistics - Q3 2017JLL Detroit Industrial Insight & Statistics - Q3 2017
JLL Detroit Industrial Insight & Statistics - Q3 2017Harrison West
 
Etude PwC sur le Top 100 des entreprises les mieux valorisées au monde en 201...
Etude PwC sur le Top 100 des entreprises les mieux valorisées au monde en 201...Etude PwC sur le Top 100 des entreprises les mieux valorisées au monde en 201...
Etude PwC sur le Top 100 des entreprises les mieux valorisées au monde en 201...PwC France
 
Arthur D. Little Automotive Report April 2020
Arthur D. Little Automotive Report April 2020 Arthur D. Little Automotive Report April 2020
Arthur D. Little Automotive Report April 2020 Fabrizio Arena
 

What's hot (20)

JLL Cleveland Office Outlook: Q3 2020
JLL Cleveland Office Outlook: Q3 2020JLL Cleveland Office Outlook: Q3 2020
JLL Cleveland Office Outlook: Q3 2020
 
Economic Outlook - Derry Enterprise Week
Economic Outlook - Derry Enterprise WeekEconomic Outlook - Derry Enterprise Week
Economic Outlook - Derry Enterprise Week
 
JLL Pittsburgh Industrial Insight & Statistics - Q4 2018
JLL Pittsburgh Industrial Insight & Statistics - Q4 2018JLL Pittsburgh Industrial Insight & Statistics - Q4 2018
JLL Pittsburgh Industrial Insight & Statistics - Q4 2018
 
Before the Open June 2 2017
Before the Open June 2 2017Before the Open June 2 2017
Before the Open June 2 2017
 
JLL Pittsburgh Office Insight & Statistics - Q4 2018
JLL Pittsburgh Office Insight & Statistics - Q4 2018JLL Pittsburgh Office Insight & Statistics - Q4 2018
JLL Pittsburgh Office Insight & Statistics - Q4 2018
 
European Economic CRE Outlook September 2018
European Economic CRE Outlook September 2018European Economic CRE Outlook September 2018
European Economic CRE Outlook September 2018
 
RMB Morgan Stanley Big Five Investor Conference Presentation September 2018
RMB Morgan Stanley Big Five Investor Conference Presentation September 2018RMB Morgan Stanley Big Five Investor Conference Presentation September 2018
RMB Morgan Stanley Big Five Investor Conference Presentation September 2018
 
Cushman & Wakefield Montreal Americas Marketbeat Office Q12019 #CRE #RealEstate
Cushman & Wakefield Montreal Americas Marketbeat Office Q12019  #CRE #RealEstateCushman & Wakefield Montreal Americas Marketbeat Office Q12019  #CRE #RealEstate
Cushman & Wakefield Montreal Americas Marketbeat Office Q12019 #CRE #RealEstate
 
Office Insight and Statistics: Fort Worth (2019-Q2)
Office Insight and Statistics: Fort Worth (2019-Q2)Office Insight and Statistics: Fort Worth (2019-Q2)
Office Insight and Statistics: Fort Worth (2019-Q2)
 
Before the Open August 14 2017
Before the Open August 14 2017Before the Open August 14 2017
Before the Open August 14 2017
 
Itc ru2 qfy2011-291010
Itc ru2 qfy2011-291010Itc ru2 qfy2011-291010
Itc ru2 qfy2011-291010
 
JLL Detroit Office Insight & Statistics - Q1 2019
JLL Detroit Office Insight & Statistics - Q1 2019JLL Detroit Office Insight & Statistics - Q1 2019
JLL Detroit Office Insight & Statistics - Q1 2019
 
Trendeo Industrial investment in Africa may 2018
Trendeo Industrial investment in Africa may 2018Trendeo Industrial investment in Africa may 2018
Trendeo Industrial investment in Africa may 2018
 
An overview of the UK Hotels market #ATHotelDesign
An overview of the UK Hotels market #ATHotelDesignAn overview of the UK Hotels market #ATHotelDesign
An overview of the UK Hotels market #ATHotelDesign
 
Before the Open July 19 2017
Before the Open July 19 2017Before the Open July 19 2017
Before the Open July 19 2017
 
JLL Pittsburgh Office Outlook - Q4 2015
JLL Pittsburgh Office Outlook - Q4 2015JLL Pittsburgh Office Outlook - Q4 2015
JLL Pittsburgh Office Outlook - Q4 2015
 
Arthur D. Little Automotive Report November 2019
Arthur D. Little Automotive Report November 2019 Arthur D. Little Automotive Report November 2019
Arthur D. Little Automotive Report November 2019
 
JLL Detroit Industrial Insight & Statistics - Q3 2017
JLL Detroit Industrial Insight & Statistics - Q3 2017JLL Detroit Industrial Insight & Statistics - Q3 2017
JLL Detroit Industrial Insight & Statistics - Q3 2017
 
Etude PwC sur le Top 100 des entreprises les mieux valorisées au monde en 201...
Etude PwC sur le Top 100 des entreprises les mieux valorisées au monde en 201...Etude PwC sur le Top 100 des entreprises les mieux valorisées au monde en 201...
Etude PwC sur le Top 100 des entreprises les mieux valorisées au monde en 201...
 
Arthur D. Little Automotive Report April 2020
Arthur D. Little Automotive Report April 2020 Arthur D. Little Automotive Report April 2020
Arthur D. Little Automotive Report April 2020
 

Similar to Cushman & Wakefield's Canadian Office Statistical Summary Q4 2018

September 2020 - Market Report - Toronto & GTA Housing Sales
September 2020 - Market Report - Toronto & GTA Housing SalesSeptember 2020 - Market Report - Toronto & GTA Housing Sales
September 2020 - Market Report - Toronto & GTA Housing SalesMichelle Makos
 
TREB - Condo report Q3-2016
TREB - Condo report Q3-2016TREB - Condo report Q3-2016
TREB - Condo report Q3-2016Gloria Yeung
 
Q4 16 earnings deck 2017.01.31 v final
Q4 16 earnings deck 2017.01.31 v finalQ4 16 earnings deck 2017.01.31 v final
Q4 16 earnings deck 2017.01.31 v finalchrobinsonir
 
September 2021 Market Watch Report
September 2021 Market Watch ReportSeptember 2021 Market Watch Report
September 2021 Market Watch ReportMichelle Makos
 
August 2021 market watch
August 2021 market watchAugust 2021 market watch
August 2021 market watchMichelle Makos
 
Condo report q1-2013
Condo report q1-2013Condo report q1-2013
Condo report q1-2013Chaba Tamasi
 
July 2021 - Market Report
July 2021 - Market Report July 2021 - Market Report
July 2021 - Market Report Michelle Makos
 
Market Watch APRIL 2015
Market Watch APRIL 2015Market Watch APRIL 2015
Market Watch APRIL 2015Chaba Tamasi
 
November Market Watch 2020
November Market Watch 2020November Market Watch 2020
November Market Watch 2020Michelle Makos
 
Q2 2017 CONDO MARKET REPORT
Q2 2017 CONDO MARKET REPORTQ2 2017 CONDO MARKET REPORT
Q2 2017 CONDO MARKET REPORTMichelle Makos
 
Market Watch - September 2019
Market Watch - September 2019Market Watch - September 2019
Market Watch - September 2019Michelle Makos
 
Toronto Condo Market Report - Third Quarter 2015
Toronto Condo Market Report - Third Quarter 2015Toronto Condo Market Report - Third Quarter 2015
Toronto Condo Market Report - Third Quarter 2015Nancy Pierce
 
Market Stats for October 2021
Market Stats for October 2021Market Stats for October 2021
Market Stats for October 2021Michelle Makos
 
June Market Report 2014
June Market Report 2014June Market Report 2014
June Market Report 2014Michelle Makos
 
1 Front Page 2 Memo TO.docx
1  Front Page 2  Memo TO.docx1  Front Page 2  Memo TO.docx
1 Front Page 2 Memo TO.docxkarisariddell
 
Market watch jul 2019 frank yu oakville
Market watch jul 2019 frank yu oakvilleMarket watch jul 2019 frank yu oakville
Market watch jul 2019 frank yu oakvilleFrank Yu
 
Market watch jul 2019 frank yu oakville
Market watch jul 2019 frank yu oakvilleMarket watch jul 2019 frank yu oakville
Market watch jul 2019 frank yu oakvilleFrank Yu
 

Similar to Cushman & Wakefield's Canadian Office Statistical Summary Q4 2018 (20)

Condo report q4-2014vby TREB
Condo report q4-2014vby TREBCondo report q4-2014vby TREB
Condo report q4-2014vby TREB
 
September 2020 - Market Report - Toronto & GTA Housing Sales
September 2020 - Market Report - Toronto & GTA Housing SalesSeptember 2020 - Market Report - Toronto & GTA Housing Sales
September 2020 - Market Report - Toronto & GTA Housing Sales
 
TREB - Condo report Q3-2016
TREB - Condo report Q3-2016TREB - Condo report Q3-2016
TREB - Condo report Q3-2016
 
Q4 16 earnings deck 2017.01.31 v final
Q4 16 earnings deck 2017.01.31 v finalQ4 16 earnings deck 2017.01.31 v final
Q4 16 earnings deck 2017.01.31 v final
 
September 2021 Market Watch Report
September 2021 Market Watch ReportSeptember 2021 Market Watch Report
September 2021 Market Watch Report
 
August 2021 market watch
August 2021 market watchAugust 2021 market watch
August 2021 market watch
 
Condo report q2-2013
Condo report q2-2013Condo report q2-2013
Condo report q2-2013
 
Condo report q1-2013
Condo report q1-2013Condo report q1-2013
Condo report q1-2013
 
Condo report q1-2013
Condo report q1-2013Condo report q1-2013
Condo report q1-2013
 
July 2021 - Market Report
July 2021 - Market Report July 2021 - Market Report
July 2021 - Market Report
 
Market Watch APRIL 2015
Market Watch APRIL 2015Market Watch APRIL 2015
Market Watch APRIL 2015
 
November Market Watch 2020
November Market Watch 2020November Market Watch 2020
November Market Watch 2020
 
Q2 2017 CONDO MARKET REPORT
Q2 2017 CONDO MARKET REPORTQ2 2017 CONDO MARKET REPORT
Q2 2017 CONDO MARKET REPORT
 
Market Watch - September 2019
Market Watch - September 2019Market Watch - September 2019
Market Watch - September 2019
 
Toronto Condo Market Report - Third Quarter 2015
Toronto Condo Market Report - Third Quarter 2015Toronto Condo Market Report - Third Quarter 2015
Toronto Condo Market Report - Third Quarter 2015
 
Market Stats for October 2021
Market Stats for October 2021Market Stats for October 2021
Market Stats for October 2021
 
June Market Report 2014
June Market Report 2014June Market Report 2014
June Market Report 2014
 
1 Front Page 2 Memo TO.docx
1  Front Page 2  Memo TO.docx1  Front Page 2  Memo TO.docx
1 Front Page 2 Memo TO.docx
 
Market watch jul 2019 frank yu oakville
Market watch jul 2019 frank yu oakvilleMarket watch jul 2019 frank yu oakville
Market watch jul 2019 frank yu oakville
 
Market watch jul 2019 frank yu oakville
Market watch jul 2019 frank yu oakvilleMarket watch jul 2019 frank yu oakville
Market watch jul 2019 frank yu oakville
 

More from Guy Masse

North America Industrial Construction Cost Guide 2023
North America Industrial Construction Cost Guide 2023North America Industrial Construction Cost Guide 2023
North America Industrial Construction Cost Guide 2023Guy Masse
 
Cushman &Wakefield Canadian-Employment-Report.pdf
 Cushman &Wakefield Canadian-Employment-Report.pdf Cushman &Wakefield Canadian-Employment-Report.pdf
Cushman &Wakefield Canadian-Employment-Report.pdfGuy Masse
 
C&W Q3 2021 Canadian Cap Rate Report
 C&W Q3 2021 Canadian  Cap Rate Report  C&W Q3 2021 Canadian  Cap Rate Report
C&W Q3 2021 Canadian Cap Rate Report Guy Masse
 
C&W Greater Montreal Area Industrial Scorecard - Q1 2021
C&W Greater Montreal Area  Industrial Scorecard - Q1 2021 C&W Greater Montreal Area  Industrial Scorecard - Q1 2021
C&W Greater Montreal Area Industrial Scorecard - Q1 2021 Guy Masse
 
C&W Greater Montreal Area Office Scorecard - Q1 2021
C&W Greater Montreal Area Office Scorecard - Q1 2021C&W Greater Montreal Area Office Scorecard - Q1 2021
C&W Greater Montreal Area Office Scorecard - Q1 2021Guy Masse
 
Cushman & Wakefield Toronto Americas Marketbeat Office Q1 2019
Cushman & Wakefield Toronto Americas Marketbeat Office Q1 2019 Cushman & Wakefield Toronto Americas Marketbeat Office Q1 2019
Cushman & Wakefield Toronto Americas Marketbeat Office Q1 2019 Guy Masse
 
Headquarters Lessons Learned - Cushman & Wakefield Report #CRE #RealEstate
Headquarters Lessons Learned - Cushman & Wakefield Report #CRE #RealEstateHeadquarters Lessons Learned - Cushman & Wakefield Report #CRE #RealEstate
Headquarters Lessons Learned - Cushman & Wakefield Report #CRE #RealEstateGuy Masse
 
C&W MARKETBEAT- U.S. Office Q4 2018
C&W MARKETBEAT- U.S. Office Q4 2018C&W MARKETBEAT- U.S. Office Q4 2018
C&W MARKETBEAT- U.S. Office Q4 2018Guy Masse
 
C&W-Marketbeat-U.S.Shopping Center-Q3-2018 #CRE #REALESTATE #RETAIL
C&W-Marketbeat-U.S.Shopping Center-Q3-2018 #CRE #REALESTATE #RETAILC&W-Marketbeat-U.S.Shopping Center-Q3-2018 #CRE #REALESTATE #RETAIL
C&W-Marketbeat-U.S.Shopping Center-Q3-2018 #CRE #REALESTATE #RETAILGuy Masse
 
C&W-Marketbeat-U.S. Industrial-Q3-2018 #CRE #REALESTATE
C&W-Marketbeat-U.S. Industrial-Q3-2018 #CRE #REALESTATEC&W-Marketbeat-U.S. Industrial-Q3-2018 #CRE #REALESTATE
C&W-Marketbeat-U.S. Industrial-Q3-2018 #CRE #REALESTATEGuy Masse
 
C&W REAL ESTATE MARKET REPORTS : WORKPLACE 2025 #CRE
C&W REAL ESTATE MARKET REPORTS : WORKPLACE 2025 #CREC&W REAL ESTATE MARKET REPORTS : WORKPLACE 2025 #CRE
C&W REAL ESTATE MARKET REPORTS : WORKPLACE 2025 #CREGuy Masse
 
90,000 SF OF CLASS A OFFICE SPACE FOR SUBLEASE
90,000 SF OF CLASS A OFFICE SPACE  FOR SUBLEASE90,000 SF OF CLASS A OFFICE SPACE  FOR SUBLEASE
90,000 SF OF CLASS A OFFICE SPACE FOR SUBLEASEGuy Masse
 
Trump100 days- Implications for the Property Markets
Trump100 days-  Implications for the Property Markets Trump100 days-  Implications for the Property Markets
Trump100 days- Implications for the Property Markets Guy Masse
 
C&W MARKETBEAT- RETAIL Q4 2016 – #CRE #REALESTATE #CCIM #SIOR @YOURTENANTREP
C&W MARKETBEAT- RETAIL Q4 2016 – #CRE #REALESTATE #CCIM #SIOR @YOURTENANTREPC&W MARKETBEAT- RETAIL Q4 2016 – #CRE #REALESTATE #CCIM #SIOR @YOURTENANTREP
C&W MARKETBEAT- RETAIL Q4 2016 – #CRE #REALESTATE #CCIM #SIOR @YOURTENANTREPGuy Masse
 
C&W MARKETBEAT- CAPITAL MARKETS Q4 2016 – #CRE #REALESTATE #CCIM #SIOR @YOURT...
C&W MARKETBEAT- CAPITAL MARKETS Q4 2016 – #CRE #REALESTATE #CCIM #SIOR @YOURT...C&W MARKETBEAT- CAPITAL MARKETS Q4 2016 – #CRE #REALESTATE #CCIM #SIOR @YOURT...
C&W MARKETBEAT- CAPITAL MARKETS Q4 2016 – #CRE #REALESTATE #CCIM #SIOR @YOURT...Guy Masse
 
C&W MARKETBEAT- U.S INDUSTRIAL Q4 2016 – #CRE #REALESTATE #CCIM #SIOR
C&W MARKETBEAT- U.S INDUSTRIAL Q4 2016 – #CRE #REALESTATE #CCIM #SIORC&W MARKETBEAT- U.S INDUSTRIAL Q4 2016 – #CRE #REALESTATE #CCIM #SIOR
C&W MARKETBEAT- U.S INDUSTRIAL Q4 2016 – #CRE #REALESTATE #CCIM #SIORGuy Masse
 
C&W MARKETBEAT- U.S OFFICE Q4 2016 – #CRE #REALESTATE
C&W MARKETBEAT- U.S OFFICE Q4 2016 – #CRE #REALESTATEC&W MARKETBEAT- U.S OFFICE Q4 2016 – #CRE #REALESTATE
C&W MARKETBEAT- U.S OFFICE Q4 2016 – #CRE #REALESTATEGuy Masse
 
Cushman & Wakefield Atlas outlook 2016
Cushman & Wakefield Atlas outlook 2016Cushman & Wakefield Atlas outlook 2016
Cushman & Wakefield Atlas outlook 2016Guy Masse
 
Atlas outlook 2016- Cushman & Wakefied
Atlas outlook 2016- Cushman & WakefiedAtlas outlook 2016- Cushman & Wakefied
Atlas outlook 2016- Cushman & WakefiedGuy Masse
 
WINNING IN GROWTH CITIES /ACushman & Wakefield Capital Markets Research Publi...
WINNING IN GROWTH CITIES /ACushman & Wakefield Capital Markets Research Publi...WINNING IN GROWTH CITIES /ACushman & Wakefield Capital Markets Research Publi...
WINNING IN GROWTH CITIES /ACushman & Wakefield Capital Markets Research Publi...Guy Masse
 

More from Guy Masse (20)

North America Industrial Construction Cost Guide 2023
North America Industrial Construction Cost Guide 2023North America Industrial Construction Cost Guide 2023
North America Industrial Construction Cost Guide 2023
 
Cushman &Wakefield Canadian-Employment-Report.pdf
 Cushman &Wakefield Canadian-Employment-Report.pdf Cushman &Wakefield Canadian-Employment-Report.pdf
Cushman &Wakefield Canadian-Employment-Report.pdf
 
C&W Q3 2021 Canadian Cap Rate Report
 C&W Q3 2021 Canadian  Cap Rate Report  C&W Q3 2021 Canadian  Cap Rate Report
C&W Q3 2021 Canadian Cap Rate Report
 
C&W Greater Montreal Area Industrial Scorecard - Q1 2021
C&W Greater Montreal Area  Industrial Scorecard - Q1 2021 C&W Greater Montreal Area  Industrial Scorecard - Q1 2021
C&W Greater Montreal Area Industrial Scorecard - Q1 2021
 
C&W Greater Montreal Area Office Scorecard - Q1 2021
C&W Greater Montreal Area Office Scorecard - Q1 2021C&W Greater Montreal Area Office Scorecard - Q1 2021
C&W Greater Montreal Area Office Scorecard - Q1 2021
 
Cushman & Wakefield Toronto Americas Marketbeat Office Q1 2019
Cushman & Wakefield Toronto Americas Marketbeat Office Q1 2019 Cushman & Wakefield Toronto Americas Marketbeat Office Q1 2019
Cushman & Wakefield Toronto Americas Marketbeat Office Q1 2019
 
Headquarters Lessons Learned - Cushman & Wakefield Report #CRE #RealEstate
Headquarters Lessons Learned - Cushman & Wakefield Report #CRE #RealEstateHeadquarters Lessons Learned - Cushman & Wakefield Report #CRE #RealEstate
Headquarters Lessons Learned - Cushman & Wakefield Report #CRE #RealEstate
 
C&W MARKETBEAT- U.S. Office Q4 2018
C&W MARKETBEAT- U.S. Office Q4 2018C&W MARKETBEAT- U.S. Office Q4 2018
C&W MARKETBEAT- U.S. Office Q4 2018
 
C&W-Marketbeat-U.S.Shopping Center-Q3-2018 #CRE #REALESTATE #RETAIL
C&W-Marketbeat-U.S.Shopping Center-Q3-2018 #CRE #REALESTATE #RETAILC&W-Marketbeat-U.S.Shopping Center-Q3-2018 #CRE #REALESTATE #RETAIL
C&W-Marketbeat-U.S.Shopping Center-Q3-2018 #CRE #REALESTATE #RETAIL
 
C&W-Marketbeat-U.S. Industrial-Q3-2018 #CRE #REALESTATE
C&W-Marketbeat-U.S. Industrial-Q3-2018 #CRE #REALESTATEC&W-Marketbeat-U.S. Industrial-Q3-2018 #CRE #REALESTATE
C&W-Marketbeat-U.S. Industrial-Q3-2018 #CRE #REALESTATE
 
C&W REAL ESTATE MARKET REPORTS : WORKPLACE 2025 #CRE
C&W REAL ESTATE MARKET REPORTS : WORKPLACE 2025 #CREC&W REAL ESTATE MARKET REPORTS : WORKPLACE 2025 #CRE
C&W REAL ESTATE MARKET REPORTS : WORKPLACE 2025 #CRE
 
90,000 SF OF CLASS A OFFICE SPACE FOR SUBLEASE
90,000 SF OF CLASS A OFFICE SPACE  FOR SUBLEASE90,000 SF OF CLASS A OFFICE SPACE  FOR SUBLEASE
90,000 SF OF CLASS A OFFICE SPACE FOR SUBLEASE
 
Trump100 days- Implications for the Property Markets
Trump100 days-  Implications for the Property Markets Trump100 days-  Implications for the Property Markets
Trump100 days- Implications for the Property Markets
 
C&W MARKETBEAT- RETAIL Q4 2016 – #CRE #REALESTATE #CCIM #SIOR @YOURTENANTREP
C&W MARKETBEAT- RETAIL Q4 2016 – #CRE #REALESTATE #CCIM #SIOR @YOURTENANTREPC&W MARKETBEAT- RETAIL Q4 2016 – #CRE #REALESTATE #CCIM #SIOR @YOURTENANTREP
C&W MARKETBEAT- RETAIL Q4 2016 – #CRE #REALESTATE #CCIM #SIOR @YOURTENANTREP
 
C&W MARKETBEAT- CAPITAL MARKETS Q4 2016 – #CRE #REALESTATE #CCIM #SIOR @YOURT...
C&W MARKETBEAT- CAPITAL MARKETS Q4 2016 – #CRE #REALESTATE #CCIM #SIOR @YOURT...C&W MARKETBEAT- CAPITAL MARKETS Q4 2016 – #CRE #REALESTATE #CCIM #SIOR @YOURT...
C&W MARKETBEAT- CAPITAL MARKETS Q4 2016 – #CRE #REALESTATE #CCIM #SIOR @YOURT...
 
C&W MARKETBEAT- U.S INDUSTRIAL Q4 2016 – #CRE #REALESTATE #CCIM #SIOR
C&W MARKETBEAT- U.S INDUSTRIAL Q4 2016 – #CRE #REALESTATE #CCIM #SIORC&W MARKETBEAT- U.S INDUSTRIAL Q4 2016 – #CRE #REALESTATE #CCIM #SIOR
C&W MARKETBEAT- U.S INDUSTRIAL Q4 2016 – #CRE #REALESTATE #CCIM #SIOR
 
C&W MARKETBEAT- U.S OFFICE Q4 2016 – #CRE #REALESTATE
C&W MARKETBEAT- U.S OFFICE Q4 2016 – #CRE #REALESTATEC&W MARKETBEAT- U.S OFFICE Q4 2016 – #CRE #REALESTATE
C&W MARKETBEAT- U.S OFFICE Q4 2016 – #CRE #REALESTATE
 
Cushman & Wakefield Atlas outlook 2016
Cushman & Wakefield Atlas outlook 2016Cushman & Wakefield Atlas outlook 2016
Cushman & Wakefield Atlas outlook 2016
 
Atlas outlook 2016- Cushman & Wakefied
Atlas outlook 2016- Cushman & WakefiedAtlas outlook 2016- Cushman & Wakefied
Atlas outlook 2016- Cushman & Wakefied
 
WINNING IN GROWTH CITIES /ACushman & Wakefield Capital Markets Research Publi...
WINNING IN GROWTH CITIES /ACushman & Wakefield Capital Markets Research Publi...WINNING IN GROWTH CITIES /ACushman & Wakefield Capital Markets Research Publi...
WINNING IN GROWTH CITIES /ACushman & Wakefield Capital Markets Research Publi...
 

Recently uploaded

Call Girls in Nehru Place Delhi 💯Call Us 🔝8264348440🔝
Call Girls in Nehru Place Delhi 💯Call Us 🔝8264348440🔝Call Girls in Nehru Place Delhi 💯Call Us 🔝8264348440🔝
Call Girls in Nehru Place Delhi 💯Call Us 🔝8264348440🔝soniya singh
 
9990771857 Call Girls in Noida Sector 06 Noida (Call Girls) Delhi
9990771857 Call Girls in Noida Sector 06 Noida (Call Girls) Delhi9990771857 Call Girls in Noida Sector 06 Noida (Call Girls) Delhi
9990771857 Call Girls in Noida Sector 06 Noida (Call Girls) Delhidelhimodel235
 
Call Girls in Janakpuri ↫8447779280↫Short 1500 Night 6000-Escorts Service In ...
Call Girls in Janakpuri ↫8447779280↫Short 1500 Night 6000-Escorts Service In ...Call Girls in Janakpuri ↫8447779280↫Short 1500 Night 6000-Escorts Service In ...
Call Girls in Janakpuri ↫8447779280↫Short 1500 Night 6000-Escorts Service In ...asmaqueen5
 
Low Rate Call Girls in Triveni Complex Delhi Call 9990771857
Low Rate Call Girls in Triveni Complex Delhi Call 9990771857Low Rate Call Girls in Triveni Complex Delhi Call 9990771857
Low Rate Call Girls in Triveni Complex Delhi Call 9990771857delhimodel235
 
Listing Turkey Sylvana Istanbul - Bahcesehir
Listing Turkey Sylvana Istanbul - BahcesehirListing Turkey Sylvana Istanbul - Bahcesehir
Listing Turkey Sylvana Istanbul - BahcesehirListing Turkey
 
Call Girls In Vasant Vihar Delhi 💯Call Us 🔝8264348440🔝
Call Girls In Vasant Vihar Delhi 💯Call Us 🔝8264348440🔝Call Girls In Vasant Vihar Delhi 💯Call Us 🔝8264348440🔝
Call Girls In Vasant Vihar Delhi 💯Call Us 🔝8264348440🔝soniya singh
 
Aparna Greenscapes Kompally Hyderabad E - Brochure.pdf
Aparna Greenscapes Kompally Hyderabad E - Brochure.pdfAparna Greenscapes Kompally Hyderabad E - Brochure.pdf
Aparna Greenscapes Kompally Hyderabad E - Brochure.pdffaheemali990101
 
Magarpatta Nova Elegance Mundhwa Pune E-Brochure.pdf
Magarpatta Nova Elegance Mundhwa Pune  E-Brochure.pdfMagarpatta Nova Elegance Mundhwa Pune  E-Brochure.pdf
Magarpatta Nova Elegance Mundhwa Pune E-Brochure.pdfManishSaxena95
 
Shapoorji Pallonji Parkwest Sequoia Tower Bangalore.pdf
Shapoorji Pallonji Parkwest Sequoia Tower Bangalore.pdfShapoorji Pallonji Parkwest Sequoia Tower Bangalore.pdf
Shapoorji Pallonji Parkwest Sequoia Tower Bangalore.pdfashiyadav24
 
Nanke Area Estate commercial ( Dir. Kat Kuo)
Nanke Area Estate commercial ( Dir. Kat Kuo)Nanke Area Estate commercial ( Dir. Kat Kuo)
Nanke Area Estate commercial ( Dir. Kat Kuo)jessica288382
 
Omaxe Dwarka In Delhi E Brochure Pdf
Omaxe Dwarka In Delhi E Brochure     PdfOmaxe Dwarka In Delhi E Brochure     Pdf
Omaxe Dwarka In Delhi E Brochure Pdfashiyadav24
 
Telibagh & Call Girls Lucknow - 450+ Call Girl Cash Payment 🎂 8923113531 🎪 Ne...
Telibagh & Call Girls Lucknow - 450+ Call Girl Cash Payment 🎂 8923113531 🎪 Ne...Telibagh & Call Girls Lucknow - 450+ Call Girl Cash Payment 🎂 8923113531 🎪 Ne...
Telibagh & Call Girls Lucknow - 450+ Call Girl Cash Payment 🎂 8923113531 🎪 Ne...gurkirankumar98700
 
Purva Palm Hills Devanahalli, Bangalore E- Brochure.pdf
Purva Palm Hills Devanahalli, Bangalore E- Brochure.pdfPurva Palm Hills Devanahalli, Bangalore E- Brochure.pdf
Purva Palm Hills Devanahalli, Bangalore E- Brochure.pdffaheemali990101
 
Raquel Thompson: Combining Creativity with Practicality in Architecture
Raquel Thompson: Combining  Creativity with Practicality in ArchitectureRaquel Thompson: Combining  Creativity with Practicality in Architecture
Raquel Thompson: Combining Creativity with Practicality in ArchitectureRaquel Thompson Barbados
 
Call Girls in Noida Sector 11 Noida 💯Call Us 🔝 9582086666 🔝 South Delhi Escor...
Call Girls in Noida Sector 11 Noida 💯Call Us 🔝 9582086666 🔝 South Delhi Escor...Call Girls in Noida Sector 11 Noida 💯Call Us 🔝 9582086666 🔝 South Delhi Escor...
Call Girls in Noida Sector 11 Noida 💯Call Us 🔝 9582086666 🔝 South Delhi Escor...delhimodel235
 
9990771857 Call Girls in Noida Sector 11 Noida (Call Girls) Delhi
9990771857 Call Girls in Noida Sector 11 Noida (Call Girls) Delhi9990771857 Call Girls in Noida Sector 11 Noida (Call Girls) Delhi
9990771857 Call Girls in Noida Sector 11 Noida (Call Girls) Delhidelhimodel235
 
9711199012 Call {Girls Delhi} Very Low rate Vaishali DownLoad PDF
9711199012 Call {Girls Delhi} Very Low rate Vaishali DownLoad PDF9711199012 Call {Girls Delhi} Very Low rate Vaishali DownLoad PDF
9711199012 Call {Girls Delhi} Very Low rate Vaishali DownLoad PDFMs Riya
 
Model Call Girl in Shastri Nagar Delhi reach out to us at 🔝8264348440🔝
Model Call Girl in Shastri Nagar Delhi reach out to us at 🔝8264348440🔝Model Call Girl in Shastri Nagar Delhi reach out to us at 🔝8264348440🔝
Model Call Girl in Shastri Nagar Delhi reach out to us at 🔝8264348440🔝soniya singh
 
Call Girls in laxmi Nagar Delhi 💯Call Us 🔝 9582086666🔝 South Delhi Escorts Se...
Call Girls in laxmi Nagar Delhi 💯Call Us 🔝 9582086666🔝 South Delhi Escorts Se...Call Girls in laxmi Nagar Delhi 💯Call Us 🔝 9582086666🔝 South Delhi Escorts Se...
Call Girls in laxmi Nagar Delhi 💯Call Us 🔝 9582086666🔝 South Delhi Escorts Se...delhimodel235
 

Recently uploaded (20)

Call Girls in Nehru Place Delhi 💯Call Us 🔝8264348440🔝
Call Girls in Nehru Place Delhi 💯Call Us 🔝8264348440🔝Call Girls in Nehru Place Delhi 💯Call Us 🔝8264348440🔝
Call Girls in Nehru Place Delhi 💯Call Us 🔝8264348440🔝
 
9990771857 Call Girls in Noida Sector 06 Noida (Call Girls) Delhi
9990771857 Call Girls in Noida Sector 06 Noida (Call Girls) Delhi9990771857 Call Girls in Noida Sector 06 Noida (Call Girls) Delhi
9990771857 Call Girls in Noida Sector 06 Noida (Call Girls) Delhi
 
Call Girls in Janakpuri ↫8447779280↫Short 1500 Night 6000-Escorts Service In ...
Call Girls in Janakpuri ↫8447779280↫Short 1500 Night 6000-Escorts Service In ...Call Girls in Janakpuri ↫8447779280↫Short 1500 Night 6000-Escorts Service In ...
Call Girls in Janakpuri ↫8447779280↫Short 1500 Night 6000-Escorts Service In ...
 
Low Rate Call Girls in Triveni Complex Delhi Call 9990771857
Low Rate Call Girls in Triveni Complex Delhi Call 9990771857Low Rate Call Girls in Triveni Complex Delhi Call 9990771857
Low Rate Call Girls in Triveni Complex Delhi Call 9990771857
 
Listing Turkey Sylvana Istanbul - Bahcesehir
Listing Turkey Sylvana Istanbul - BahcesehirListing Turkey Sylvana Istanbul - Bahcesehir
Listing Turkey Sylvana Istanbul - Bahcesehir
 
Call Girls In Vasant Vihar Delhi 💯Call Us 🔝8264348440🔝
Call Girls In Vasant Vihar Delhi 💯Call Us 🔝8264348440🔝Call Girls In Vasant Vihar Delhi 💯Call Us 🔝8264348440🔝
Call Girls In Vasant Vihar Delhi 💯Call Us 🔝8264348440🔝
 
Aparna Greenscapes Kompally Hyderabad E - Brochure.pdf
Aparna Greenscapes Kompally Hyderabad E - Brochure.pdfAparna Greenscapes Kompally Hyderabad E - Brochure.pdf
Aparna Greenscapes Kompally Hyderabad E - Brochure.pdf
 
Magarpatta Nova Elegance Mundhwa Pune E-Brochure.pdf
Magarpatta Nova Elegance Mundhwa Pune  E-Brochure.pdfMagarpatta Nova Elegance Mundhwa Pune  E-Brochure.pdf
Magarpatta Nova Elegance Mundhwa Pune E-Brochure.pdf
 
Shapoorji Pallonji Parkwest Sequoia Tower Bangalore.pdf
Shapoorji Pallonji Parkwest Sequoia Tower Bangalore.pdfShapoorji Pallonji Parkwest Sequoia Tower Bangalore.pdf
Shapoorji Pallonji Parkwest Sequoia Tower Bangalore.pdf
 
Nanke Area Estate commercial ( Dir. Kat Kuo)
Nanke Area Estate commercial ( Dir. Kat Kuo)Nanke Area Estate commercial ( Dir. Kat Kuo)
Nanke Area Estate commercial ( Dir. Kat Kuo)
 
Omaxe Dwarka In Delhi E Brochure Pdf
Omaxe Dwarka In Delhi E Brochure     PdfOmaxe Dwarka In Delhi E Brochure     Pdf
Omaxe Dwarka In Delhi E Brochure Pdf
 
Telibagh & Call Girls Lucknow - 450+ Call Girl Cash Payment 🎂 8923113531 🎪 Ne...
Telibagh & Call Girls Lucknow - 450+ Call Girl Cash Payment 🎂 8923113531 🎪 Ne...Telibagh & Call Girls Lucknow - 450+ Call Girl Cash Payment 🎂 8923113531 🎪 Ne...
Telibagh & Call Girls Lucknow - 450+ Call Girl Cash Payment 🎂 8923113531 🎪 Ne...
 
Purva Palm Hills Devanahalli, Bangalore E- Brochure.pdf
Purva Palm Hills Devanahalli, Bangalore E- Brochure.pdfPurva Palm Hills Devanahalli, Bangalore E- Brochure.pdf
Purva Palm Hills Devanahalli, Bangalore E- Brochure.pdf
 
Raquel Thompson: Combining Creativity with Practicality in Architecture
Raquel Thompson: Combining  Creativity with Practicality in ArchitectureRaquel Thompson: Combining  Creativity with Practicality in Architecture
Raquel Thompson: Combining Creativity with Practicality in Architecture
 
Call Girls in Noida Sector 11 Noida 💯Call Us 🔝 9582086666 🔝 South Delhi Escor...
Call Girls in Noida Sector 11 Noida 💯Call Us 🔝 9582086666 🔝 South Delhi Escor...Call Girls in Noida Sector 11 Noida 💯Call Us 🔝 9582086666 🔝 South Delhi Escor...
Call Girls in Noida Sector 11 Noida 💯Call Us 🔝 9582086666 🔝 South Delhi Escor...
 
Low Rate Call Girls in Triveni Complex Delhi Call 9873940964
Low Rate Call Girls in Triveni Complex Delhi Call 9873940964Low Rate Call Girls in Triveni Complex Delhi Call 9873940964
Low Rate Call Girls in Triveni Complex Delhi Call 9873940964
 
9990771857 Call Girls in Noida Sector 11 Noida (Call Girls) Delhi
9990771857 Call Girls in Noida Sector 11 Noida (Call Girls) Delhi9990771857 Call Girls in Noida Sector 11 Noida (Call Girls) Delhi
9990771857 Call Girls in Noida Sector 11 Noida (Call Girls) Delhi
 
9711199012 Call {Girls Delhi} Very Low rate Vaishali DownLoad PDF
9711199012 Call {Girls Delhi} Very Low rate Vaishali DownLoad PDF9711199012 Call {Girls Delhi} Very Low rate Vaishali DownLoad PDF
9711199012 Call {Girls Delhi} Very Low rate Vaishali DownLoad PDF
 
Model Call Girl in Shastri Nagar Delhi reach out to us at 🔝8264348440🔝
Model Call Girl in Shastri Nagar Delhi reach out to us at 🔝8264348440🔝Model Call Girl in Shastri Nagar Delhi reach out to us at 🔝8264348440🔝
Model Call Girl in Shastri Nagar Delhi reach out to us at 🔝8264348440🔝
 
Call Girls in laxmi Nagar Delhi 💯Call Us 🔝 9582086666🔝 South Delhi Escorts Se...
Call Girls in laxmi Nagar Delhi 💯Call Us 🔝 9582086666🔝 South Delhi Escorts Se...Call Girls in laxmi Nagar Delhi 💯Call Us 🔝 9582086666🔝 South Delhi Escorts Se...
Call Girls in laxmi Nagar Delhi 💯Call Us 🔝 9582086666🔝 South Delhi Escorts Se...
 

Cushman & Wakefield's Canadian Office Statistical Summary Q4 2018

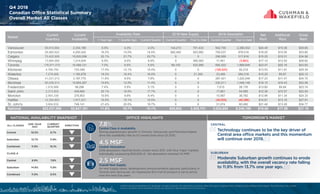
  • 1. OFFICE HIGHLIGHTS ALL CLASSES ONE YEAR AGO CURRENT QUARTER DIRECTION Central 10.5% 8.7% Suburban 13.7% 11.9% Combined 11.9% 10.1% CLASS A Central 9.9% 7.8% Suburban 14.8% 11.9% Combined 11.9% 9.5% NATIONAL AVAILABILITY SNAPSHOT Technology continues to be the key driver of Central area office markets and this momentum will continue over 2019. Moderate Suburban growth continues to erode availability, with the overall vacancy rate falling to 11.9% from 13.7% one year ago. CENTRAL TOMORROW’S MARKET Central Class A Availability Strong expansionary growth in Toronto, Vancouver, and Montreal helped drive the availability rate to it’s lowest level since Q1 2015. 7.8% Overall New Supply As new supply eases, development announcements abound, particularly in Toronto and Vancouver. An impressive 16.4 msf of product is set to arrive over the next five years. 2.5 MSF SUBURBAN Q4 2018 Canadian Office Statistical Summary Overall Market All Classes ©2019 Cushman & Wakefield ULC, Brokerage. All rights reserved. The information contained within this report is gathered from multiple sources believed to be reliable. The information may contain errors or omissions and is presented without any warranty or representations as to its accuracy. 4.5 MSF Central Absorption 2018 absorption reached levels unseen since 2011, with four major markets individually surpassing 800,000 sf. Q4 absorption reached 1.6 MSF. 1 Year Ago 1 Quarter Ago Current Quarter Current Quarter Year to Date Current Quarter Year to Date Vancouver 58,610,654 2,334,169 6.5% 4.3% 4.0% 144,210 701,433 942,705 2,286,532 $24.49 $15.36 $39.85 Edmonton 28,885,622 4,200,422 16.2% 15.0% 14.5% 682,492 903,992 705,037 978,018 $18.25 $15.55 $33.80 Calgary 72,422,928 15,020,099 22.1% 21.7% 20.7% 0 0 256,959 317,816 $15.25 $19.31 $34.56 Winnipeg 13,684,959 1,214,934 6.5% 9.0% 8.9% 0 365,000 17,461 (3,883) $17.10 $12.52 $29.62 Toronto 176,971,072 10,489,121 7.0% 6.5% 5.9% 99,100 533,956 692,522 1,889,646 $23.47 $20.16 $43.63 Kitchener 4,766,792 733,346 17.4% 12.1% 15.4% 0 0 (158,525) 92,218 $13.53 $11.81 $25.34 Waterloo 7,278,068 1,160,878 19.3% 16.4% 16.0% 0 21,350 33,489 284,318 $15.25 $9.87 $25.12 Ottawa 41,031,213 3,187,770 11.6% 8.5% 7.8% 0 0 287,421 1,220,246 $17.23 $17.47 $34.70 Montreal 95,038,513 10,854,287 14.6% 12.5% 11.4% 0 0 230,211 1,048,148 $16.15 $16.43 $32.58 Fredericton 1,919,986 98,296 7.4% 5.5% 5.1% 0 0 7,610 28,176 $13.80 $9.94 $23.74 Saint John 2,313,502 409,684 20.1% 18.5% 17.7% 0 0 17,661 54,985 $12.36 $10.57 $22.93 Moncton 2,954,336 278,803 10.8% 9.8% 9.4% 0 0 10,587 38,782 $12.99 $11.34 $24.33 Halifax 12,354,803 1,917,231 15.5% 15.1% 15.5% 0 0 (49,559) (46,286) $14.81 $13.10 $27.91 St. John's 3,804,632 748,141 21.4% 20.5% 19.7% 0 0 31,074 60,482 $21.49 $13.28 $34.77 National 522,037,080 52,647,181 11.9% 10.7% 10.1% 925,802 2,525,731 3,024,653 8,249,198 $19.60 $17.59 $37.19 Market Net Rent Additional Rent Gross Rent Current Inventory Current Availability Availability Rate 2018 New Supply 2018 Absorption
  • 2. ©2019 Cushman & Wakefield ULC, Brokerage. All rights reserved. The information contained within this report is gathered from multiple sources believed to be reliable. The information may contain errors or omissions and is presented without any warranty or representations as to its accuracy. Q4 2018 Canadian Office Statistical Summary Central Market All Classes 1 Year Ago 1 Quarter Ago Current Quarter Current Quarter Year to Date Current Quarter Year to Date Vancouver 34,185,356 763,590 5.1% 2.2% 2.2% 93,910 350,106 465,399 1,236,121 $32.32 $19.14 $51.46 Edmonton 17,358,804 1,747,750 15.5% 11.7% 10.1% 616,250 616,250 808,532 1,216,606 $20.52 $17.94 $38.46 Calgary 51,229,809 11,427,944 23.2% 23.2% 22.3% 0 0 (11,211) (19,687) $15.14 $19.74 $34.88 Winnipeg 10,540,049 1,058,857 6.9% 9.8% 10.0% 0 365,000 (24,181) (12,404) $17.49 $13.11 $30.60 Toronto 89,818,048 1,773,641 2.9% 2.4% 2.0% 68,500 68,500 262,545 876,474 $30.72 $24.35 $55.07 Kitchener 2,568,745 487,505 18.3% 13.3% 19.0% 0 0 (144,692) (17,064) $13.11 $13.47 $26.58 Waterloo 1,686,273 116,533 6.2% 6.9% 6.9% 0 21,350 (33) 29,389 $16.65 $12.83 $29.48 Ottawa 18,636,932 1,290,746 9.3% 7.3% 6.9% 0 0 71,891 271,743 $19.68 $19.58 $39.26 Montreal 55,689,494 4,607,471 12.2% 9.6% 8.3% 0 0 193,137 924,774 $18.12 $19.57 $37.69 Fredericton 1,919,986 98,296 7.4% 5.5% 5.1% 0 0 7,610 28,176 $13.80 $9.94 $23.74 Saint John 2,313,502 409,684 20.1% 18.5% 17.7% 0 0 17,661 54,985 $12.36 $10.57 $22.93 Moncton 2,954,336 278,803 10.8% 9.8% 9.4% 0 0 10,587 38,782 $12.99 $11.34 $24.33 Halifax 6,155,436 1,251,303 17.6% 18.5% 20.3% 0 0 (116,068) (169,440) $15.09 $14.46 $29.55 St. John's 1,664,919 421,536 29.1% 27.3% 25.3% 0 0 33,495 57,917 $26.05 $15.35 $41.40 National 296,721,689 25,733,659 10.5% 9.3% 8.7% 778,660 1,421,206 1,574,672 4,516,372 $21.15 $20.24 $41.39 Market Additional Rent Gross Rent 2018 AbsorptionAvailability Rate Current Inventory Current Availability 2018 New Supply Net Rent Q4 2018 Canadian Office Statistical Summary Central Market All Classes
  • 3. ©2019 Cushman & Wakefield ULC, Brokerage. All rights reserved. The information contained within this report is gathered from multiple sources believed to be reliable. The information may contain errors or omissions and is presented without any warranty or representations as to its accuracy. Q4 2018 Canadian Office Statistical Summary Suburban Market All Classes 1 Year Ago 1 Quarter Ago Current Quarter Current Quarter Year to Date Current Quarter Year to Date Vancouver 24,425,298 1,570,579 8.6% 7.3% 6.4% 50,300 351,327 477,306 1,050,411 $20.57 $12.95 $33.52 Edmonton 11,526,818 2,452,672 17.4% 19.9% 21.3% 66,242 287,742 (103,495) (238,588) $16.57 $13.78 $30.35 Calgary 21,193,119 3,592,155 19.4% 18.2% 16.9% 0 0 268,170 337,503 $16.12 $15.71 $31.83 Winnipeg 3,144,910 156,077 5.2% 6.3% 5.0% 0 0 41,642 8,521 $14.69 $9.57 $24.26 Toronto 87,153,024 8,715,480 11.2% 10.7% 10.0% 30,600 465,456 429,977 1,013,172 $15.90 $15.71 $31.61 Kitchener 2,198,047 245,841 16.2% 10.6% 11.2% 0 0 (13,833) 109,282 $14.42 $7.74 $22.16 Waterloo 5,591,795 1,044,345 23.2% 19.3% 18.7% 0 0 33,522 254,929 $15.15 $9.65 $24.80 Ottawa 22,394,281 1,897,024 13.5% 9.6% 8.5% 0 0 215,530 948,503 $14.61 $15.13 $29.74 Montreal 39,349,019 6,246,816 17.1% 16.5% 15.9% 0 0 37,074 123,374 $13.27 $12.11 $25.38 Fredericton n/a n/a n/a n/a n/a n/a n/a n/a n/a n/a n/a n/a Saint John n/a n/a n/a n/a n/a n/a n/a n/a n/a n/a n/a n/a Moncton n/a n/a n/a n/a n/a n/a n/a n/a n/a n/a n/a n/a Halifax 6,199,367 665,928 13.4% 11.8% 10.7% 0 0 66,509 123,154 $14.52 $11.73 $26.25 St. John's 2,139,713 326,605 15.4% 15.2% 15.3% 0 0 (2,421) 2,565 $17.43 $11.15 $28.58 National 225,315,391 26,913,522 13.7% 12.6% 11.9% 147,142 1,104,525 1,449,981 3,732,826 $15.80 $14.16 $29.96 Market Net Rent Additional Rent Gross Rent Current Inventory Current Availability Availability Rate 2018 New Supply 2018 Absorption
  • 4. ©2019 Cushman & Wakefield ULC, Brokerage. All rights reserved. The information contained within this report is gathered from multiple sources believed to be reliable. The information may contain errors or omissions and is presented without any warranty or representations as to its accuracy. Q4 2018 Canadian Office Statistical Summary Overall Market Class A 1 Year Ago 1 Quarter Ago Current Quarter Current Quarter Year to Date Current Quarter Year to Date Vancouver 32,777,703 1,263,848 6.9% 4.5% 3.9% 144,210 701,433 794,959 1,815,610 $27.06 $15.24 $42.30 Edmonton 18,149,419 2,789,249 18.2% 16.5% 15.4% 682,492 903,992 762,249 1,023,816 $20.90 $17.04 $37.94 Calgary 49,657,638 9,799,214 21.8% 21.1% 19.7% 0 0 210,462 349,913 $17.06 $20.41 $37.47 Winnipeg 3,486,925 360,926 7.6% 10.5% 10.4% 0 365,000 6,939 241,936 $25.58 $16.62 $42.20 Toronto 105,042,598 5,854,302 7.0% 6.2% 5.6% 99,100 533,956 412,638 1,632,993 $26.52 $22.09 $48.61 Kitchener 2,081,928 268,810 14.2% 11.8% 12.9% 0 0 (24,146) 27,342 $14.95 $9.47 $24.42 Waterloo 4,180,162 532,881 17.5% 12.9% 12.7% 0 21,350 5,249 238,734 $15.63 $9.72 $25.35 Ottawa 26,237,436 1,450,401 10.1% 6.6% 5.5% 0 0 252,530 1,020,031 $19.96 $19.71 $39.67 Montreal 40,329,080 4,002,808 13.6% 11.1% 9.9% 0 0 115,630 885,326 $19.34 $20.22 $39.56 Fredericton 720,994 35,791 5.9% 5.0% 5.0% 0 0 0 6,862 $14.58 $11.96 $26.54 Saint John 780,461 101,565 13.4% 15.5% 13.0% 0 0 19,097 3,247 $15.09 $14.91 $30.00 Moncton 1,261,210 53,936 7.5% 4.0% 4.3% 0 0 (3,423) 40,361 $15.11 $13.48 $28.59 Halifax 5,400,976 838,264 17.1% 16.3% 15.5% 0 0 40,137 63,085 $17.29 $13.92 $31.21 St. John's 1,016,036 241,137 26.3% 24.1% 23.7% 0 0 3,855 21,093 $26.54 $16.48 $43.02 National 291,122,566 27,593,132 11.9% 10.4% 9.5% 925,802 2,525,731 2,596,176 7,370,349 $22.50 $19.66 $42.16 Market Net Rent Additional Rent Gross Rent Current Inventory Current Availability Availability Rate 2018 New Supply 2018 Absorption
  • 5. ©2019 Cushman & Wakefield ULC, Brokerage. All rights reserved. The information contained within this report is gathered from multiple sources believed to be reliable. The information may contain errors or omissions and is presented without any warranty or representations as to its accuracy. Q4 2018 Canadian Office Statistical Summary Central Market Class A 1 Year Ago 1 Quarter Ago Current Quarter Current Quarter Year to Date Current Quarter Year to Date Vancouver 17,313,985 265,238 5.0% 1.4% 1.5% 93,910 350,106 336,806 875,560 $40.74 $20.46 $61.20 Edmonton 12,000,184 1,301,380 17.9% 13.2% 10.8% 616,250 616,250 802,208 1,153,296 $23.16 $19.07 $42.23 Calgary 36,568,927 7,279,956 21.2% 21.2% 19.9% 0 0 16,609 10,955 $16.96 $20.89 $37.85 Winnipeg 3,284,540 345,453 7.9% 10.7% 10.5% 0 365,000 6,939 248,986 $25.97 $17.88 $43.85 Toronto 57,614,689 864,350 2.5% 2.2% 1.5% 68,500 68,500 209,956 659,169 $33.58 $26.87 $60.45 Kitchener 903,212 77,948 7.3% 6.7% 8.6% 0 0 (17,305) (12,068) $15.18 $12.53 $27.71 Waterloo 1,278,504 55,292 2.9% 4.7% 4.3% 0 21,350 4,690 23,787 $20.91 $13.30 $34.21 Ottawa 10,837,160 442,768 5.3% 4.6% 4.1% 0 0 59,789 58,074 $24.70 $23.28 $47.98 Montreal 25,371,375 1,725,867 10.2% 8.4% 6.8% 0 0 86,907 536,721 $21.59 $23.10 $44.69 Fredericton 720,994 35,791 5.9% 5.0% 5.0% 0 0 0 6,862 $14.58 $11.96 $26.54 Saint John 780,461 101,565 13.4% 15.5% 13.0% 0 0 19,097 3,247 $15.09 $14.91 $30.00 Moncton 1,261,210 53,936 7.5% 4.0% 4.3% 0 0 (3,423) 40,361 $15.11 $13.48 $28.59 Halifax 2,513,760 565,002 23.0% 21.9% 22.5% 0 0 (13,659) 14,148 $19.02 $15.87 $34.89 St. John's 963,719 241,137 27.7% 25.4% 25.0% 0 0 3,855 21,093 $27.98 $17.37 $45.35 National 171,412,720 13,355,683 9.9% 8.8% 7.8% 778,660 1,421,206 1,512,469 3,640,191 $26.81 $22.84 $49.65 Market Net Rent Additional Rent Gross Rent Current Inventory Current Availability Availability Rate 2018 New Supply 2018 Absorption
  • 6. ©2019 Cushman & Wakefield ULC, Brokerage. All rights reserved. The information contained within this report is gathered from multiple sources believed to be reliable. The information may contain errors or omissions and is presented without any warranty or representations as to its accuracy. Q4 2018 Canadian Office Statistical Summary Suburban Market Class A 1 Year Ago 1 Quarter Ago Current Quarter Current Quarter Year to Date Current Quarter Year to Date Vancouver 15,463,718 998,610 9.0% 8.0% 6.5% 50,300 351,327 458,153 940,050 $22.39 $13.11 $35.50 Edmonton 6,149,235 1,487,869 18.7% 22.7% 24.2% 66,242 287,742 (39,959) (129,480) $18.71 $15.07 $33.78 Calgary 13,088,711 2,519,258 23.3% 20.7% 19.2% 0 0 193,853 338,958 $17.90 $16.03 $33.93 Winnipeg 202,385 15,473 4.2% 7.6% 7.6% 0 0 0 (7,050) $21.24 $9.76 $31.00 Toronto 47,427,909 4,989,952 12.4% 11.2% 10.5% 30,600 465,456 202,682 973,824 $17.91 $16.24 $34.15 Kitchener 1,178,716 190,862 19.6% 15.6% 16.2% 0 0 (6,841) 39,410 $14.85 $7.82 $22.67 Waterloo 2,901,658 477,589 23.9% 16.5% 16.5% 0 0 559 214,947 $15.26 $9.46 $24.72 Ottawa 15,400,276 1,007,633 13.5% 8.0% 6.5% 0 0 192,741 961,957 $16.02 $16.64 $32.66 Montreal 14,957,705 2,276,941 18.3% 15.6% 15.2% 0 0 28,723 348,605 $15.04 $14.71 $29.75 Fredericton n/a n/a n/a n/a n/a n/a n/a n/a n/a n/a n/a n/a Saint John n/a n/a n/a n/a n/a n/a n/a n/a n/a n/a n/a n/a Moncton n/a n/a n/a n/a n/a n/a n/a n/a n/a n/a n/a n/a Halifax 2,887,216 273,262 11.9% 11.3% 9.5% 0 0 53,796 48,937 $15.78 $12.25 $28.03 St. John's 52,317 0 0.0% 0.0% 0.0% 0 0 0 0 $26.00 $11.40 $37.40 National 119,709,846 14,237,449 14.8% 12.7% 11.9% 147,142 1,104,525 1,083,707 3,730,158 $17.79 $15.26 $33.05 Market Net Rent Additional Rent Gross Rent Current Inventory Current Availability Availability Rate 2018 New Supply 2018 Absorption