Downloaded 733 times


![LIST OF FIGURES
Page
Figure 2.1 Primary relay protection zones [21] .......................................................... 17
Figure 2.2 Distance relay protection zones [2] ........................................................... 20
Figure 2.3 Distance relay protection zones in the impedance plane for relays
provided at buses G and H (of Figure 2.2) for protecting the line from
Bus G to Bus H [2] .................................................................................... 22
Figure 2.4 (a) Definition of the impedance characteristic phase comparator.
Operating condition ................................................................................... 26
Figure 2.4 (b) Definition of the impedance characteristic phase comparator. Non-
operating condition .................................................................................... 26
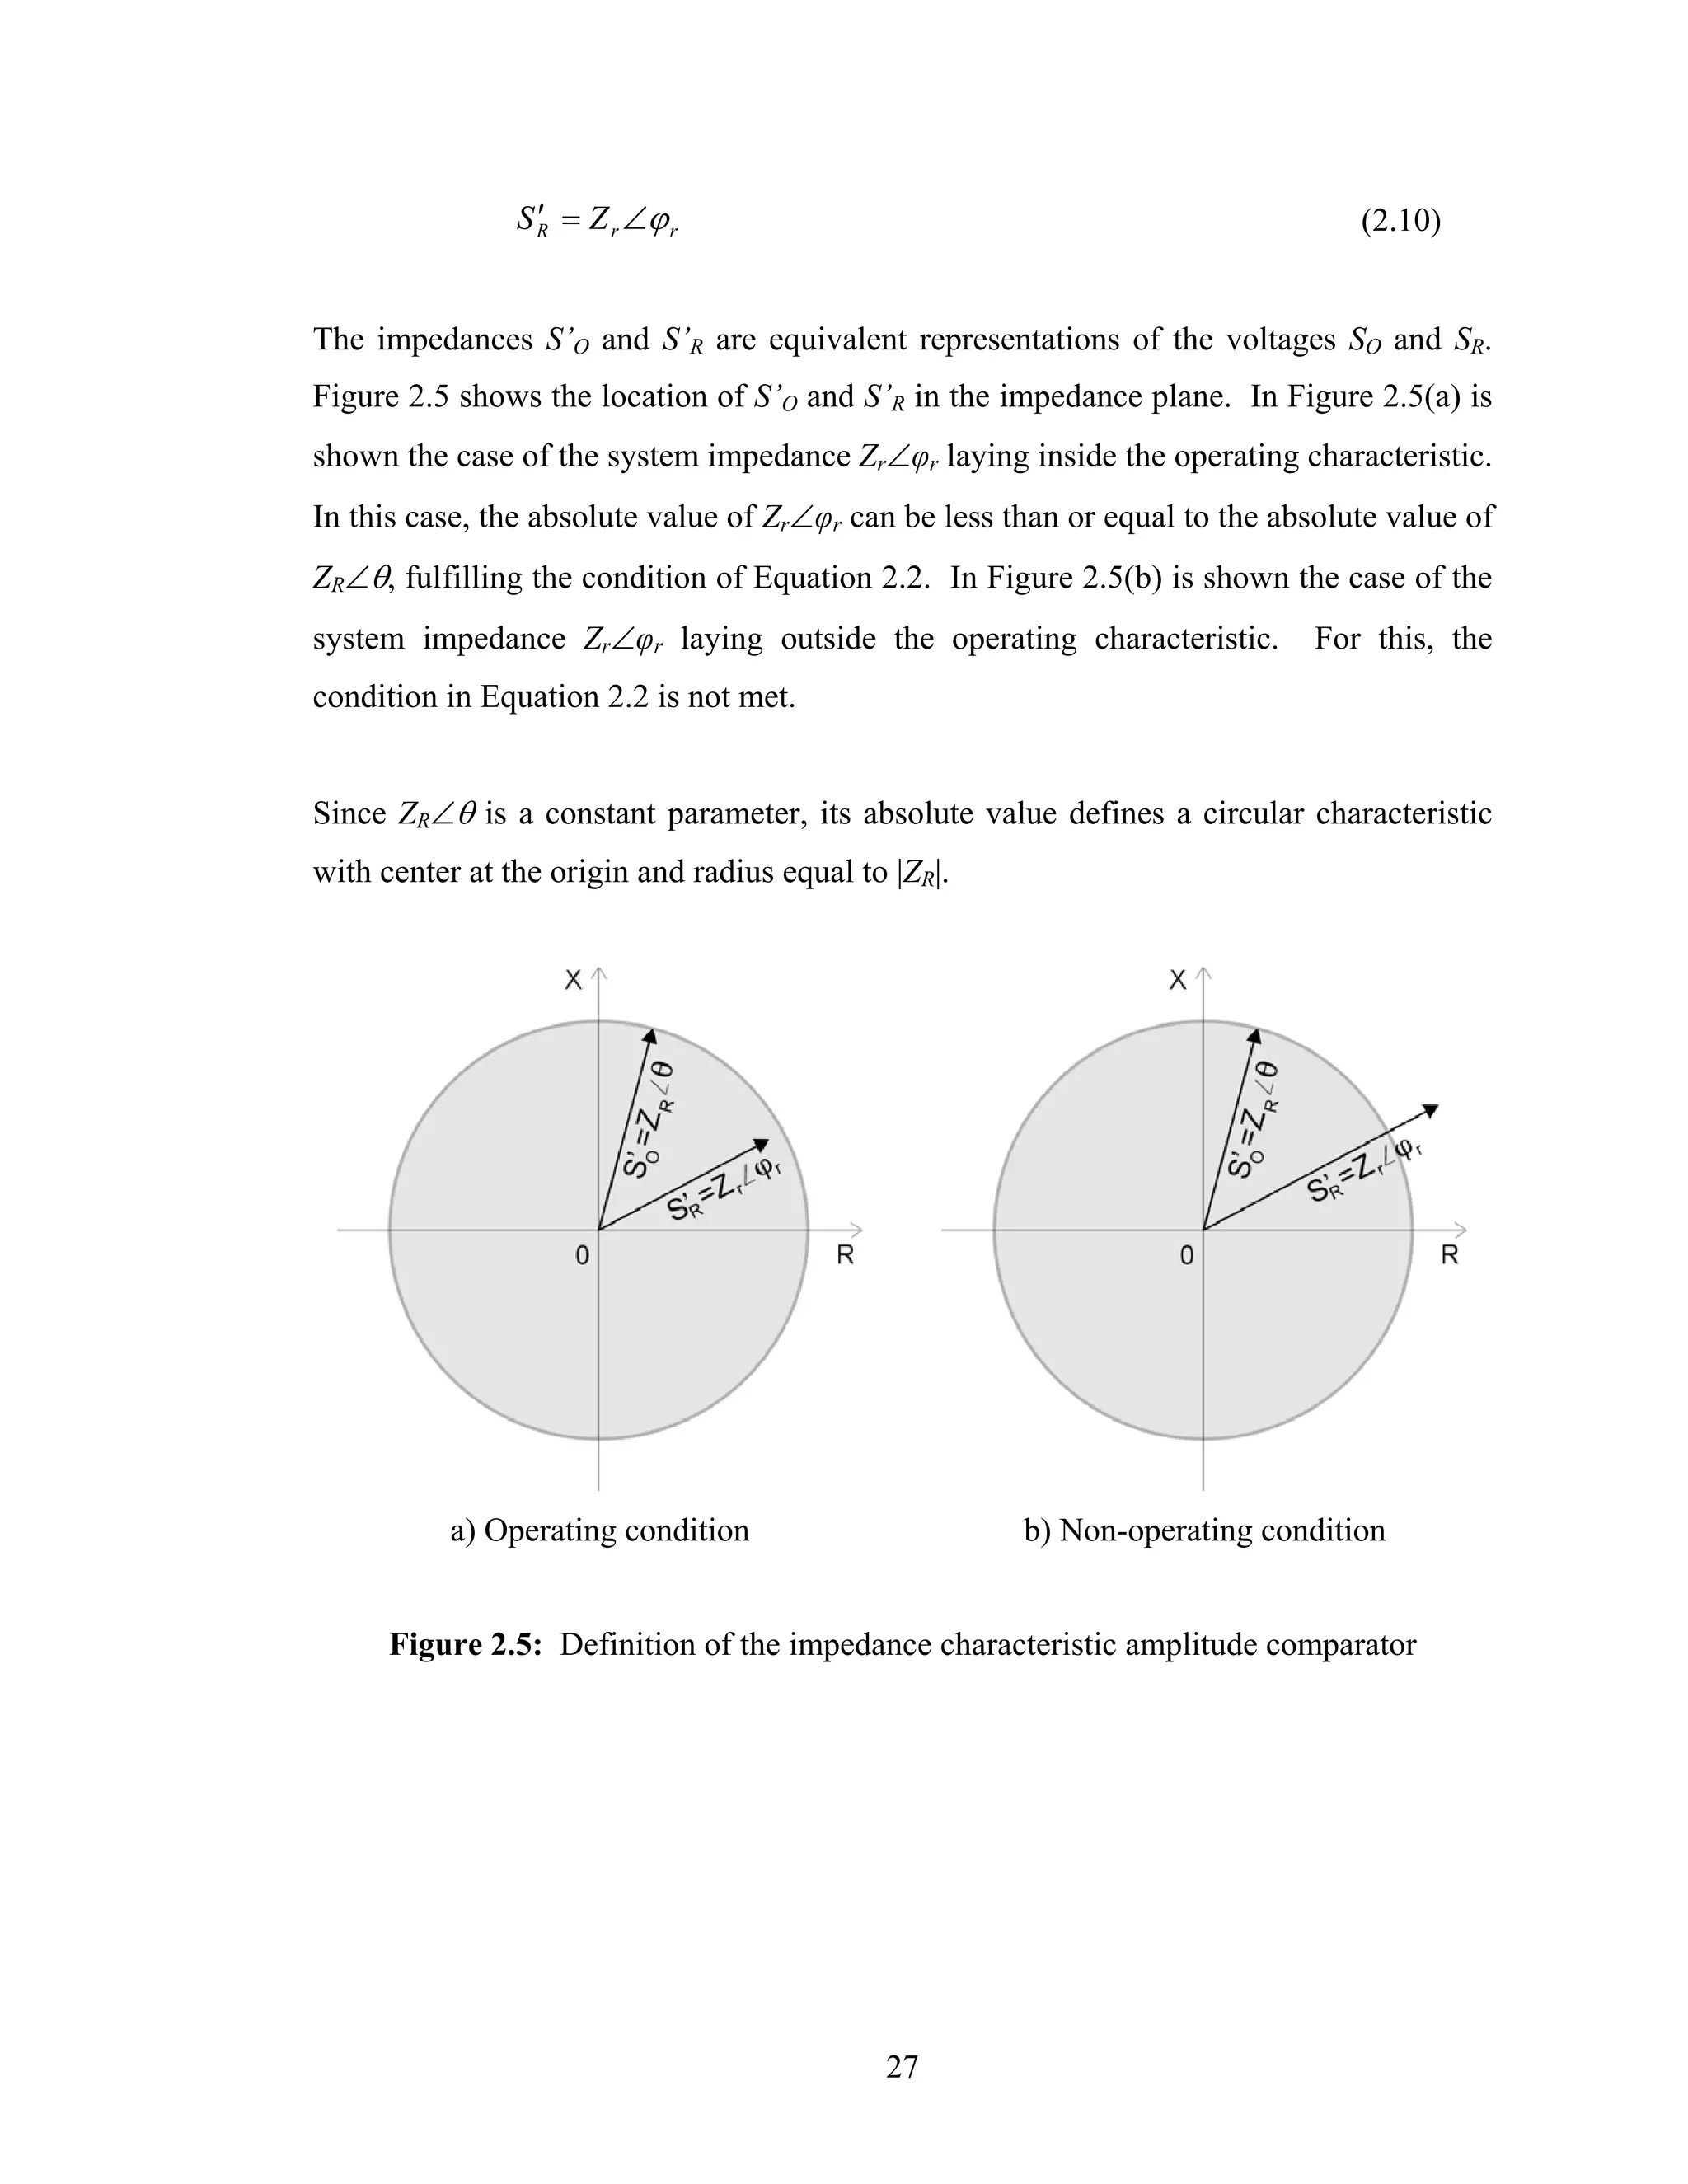
Figure 2.5 (a) Definition of the impedance characteristic amplitude comparator.
Operating condition ................................................................................... 27
Figure 2.5 (b) Definition of the impedance characteristic amplitude comparator.
Non-operating condition............................................................................ 27
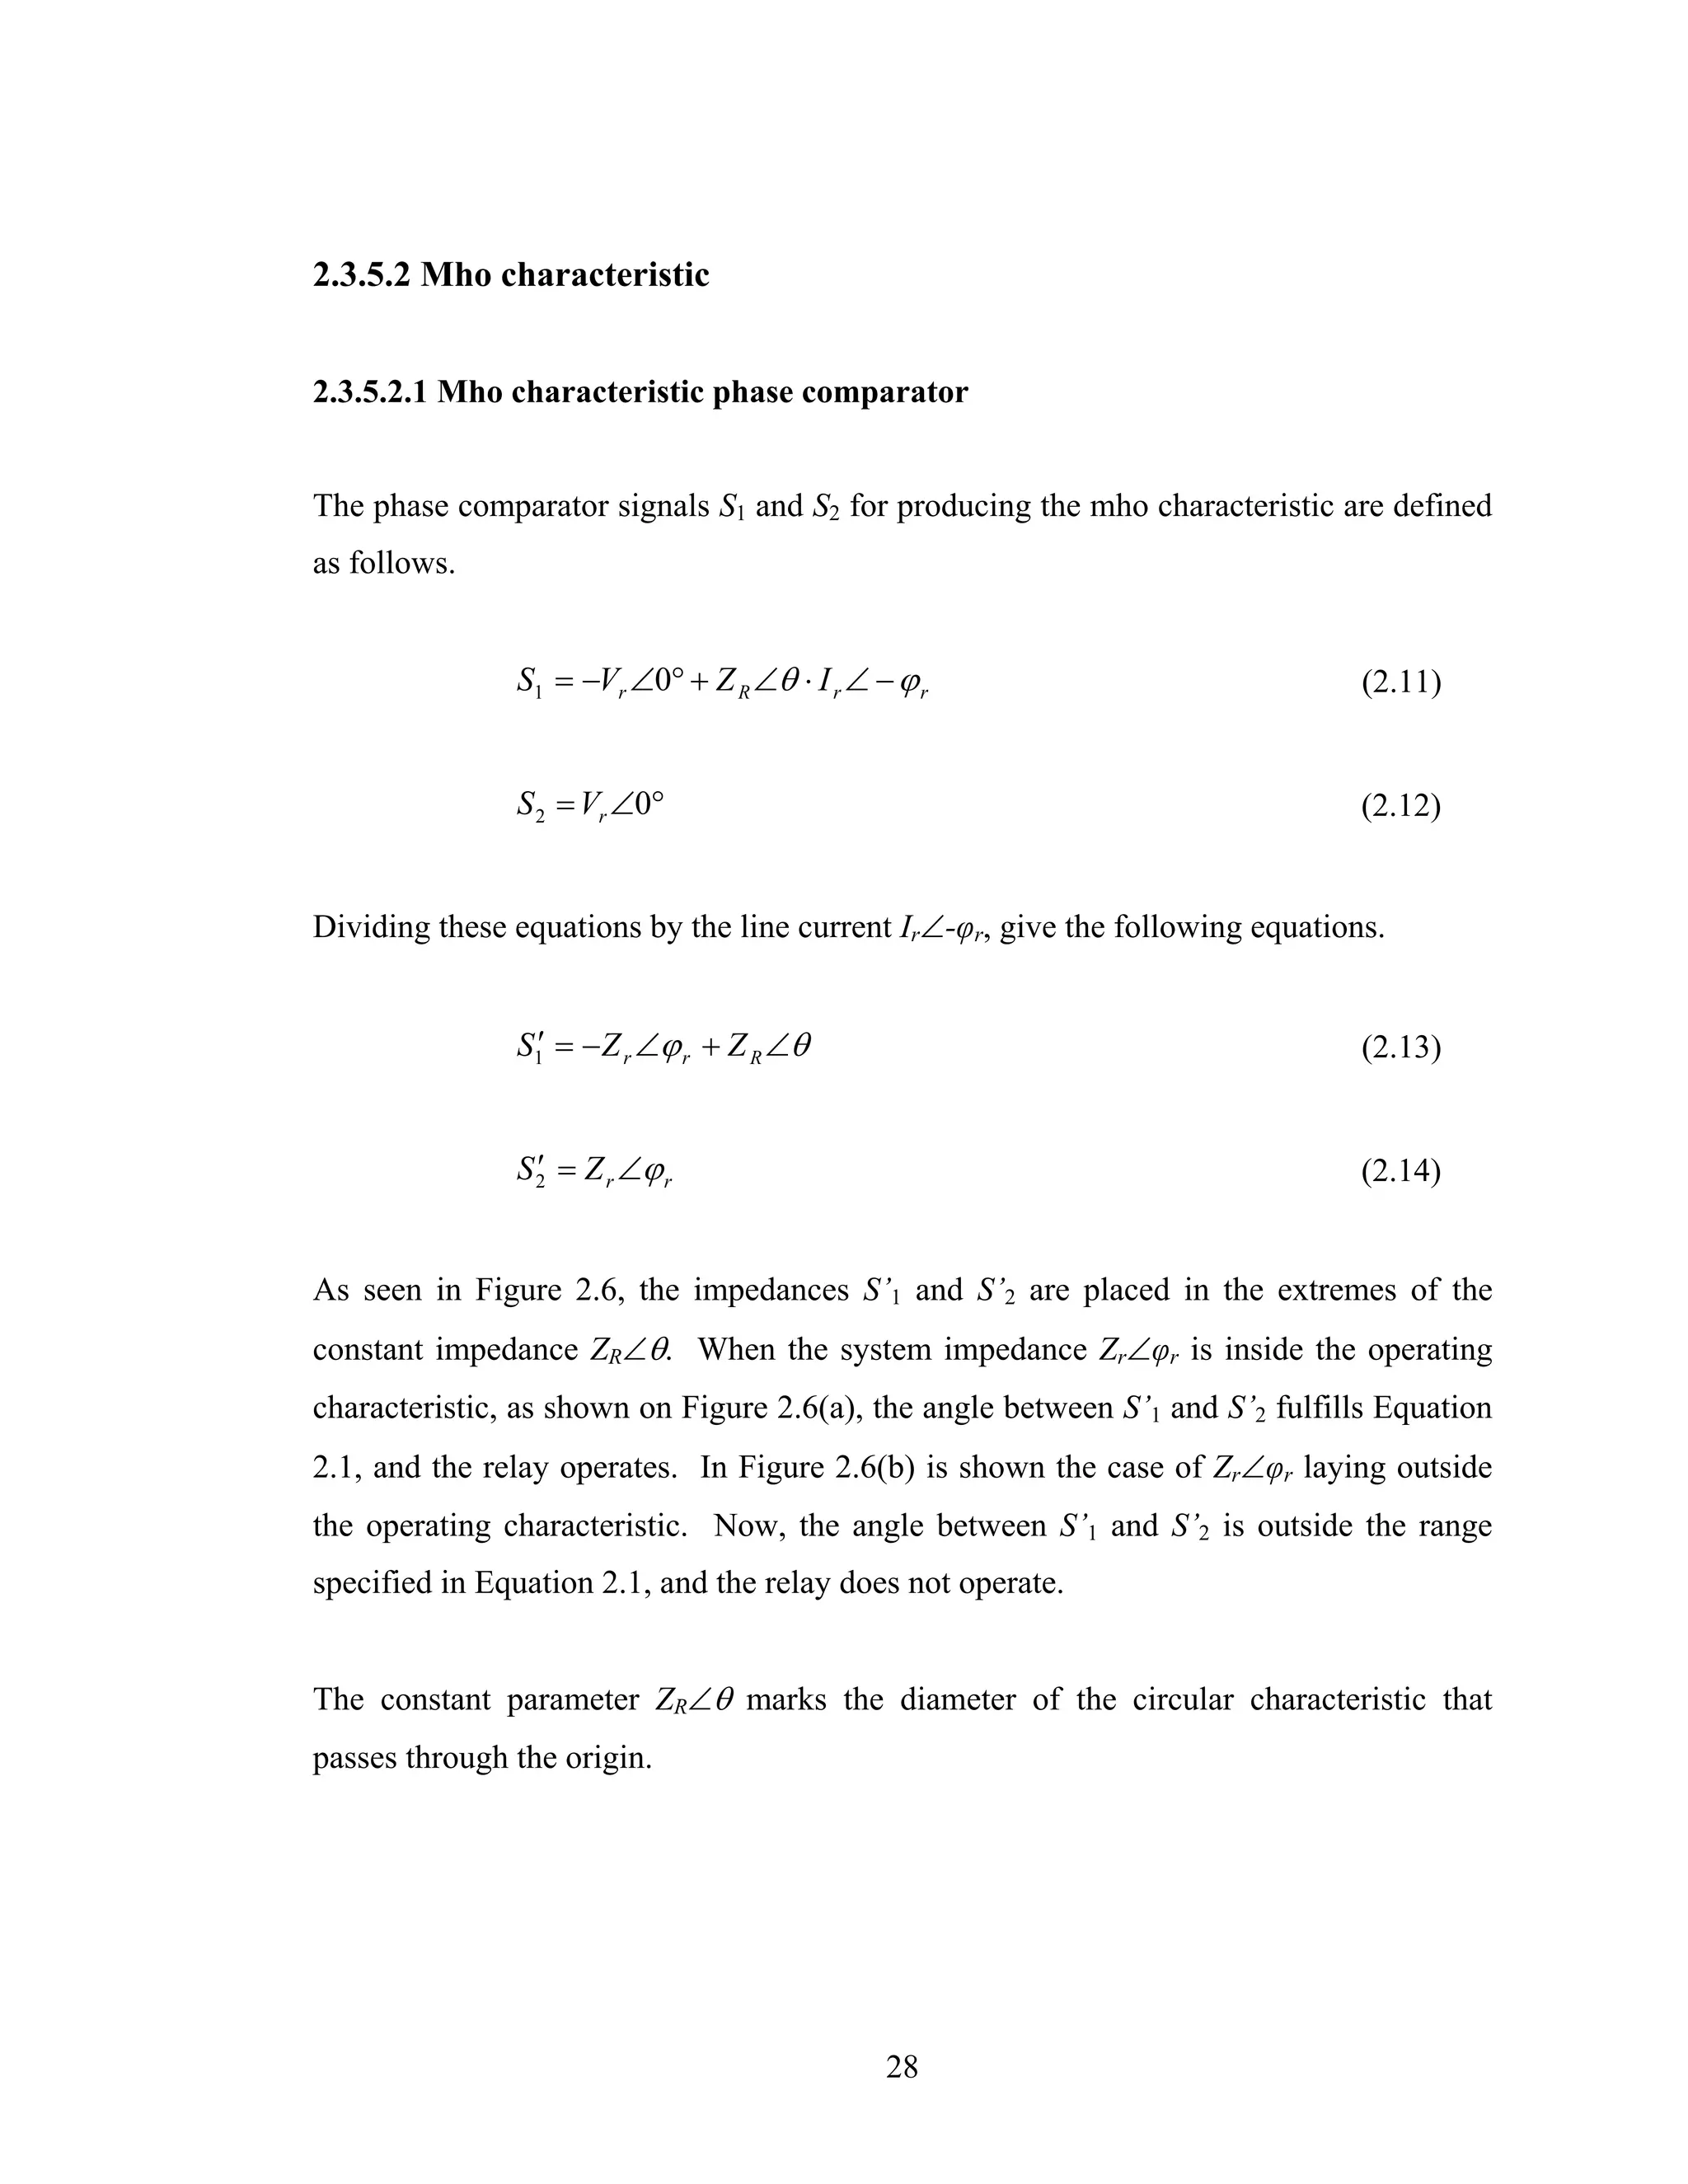
Figure 2.6 (a) Definition of the mho characteristic phase comparator. Operating
condition .................................................................................................... 29
Figure 2.6 (b) Definition of the mho characteristic phase comparator. Non-operating
condition .................................................................................................... 29
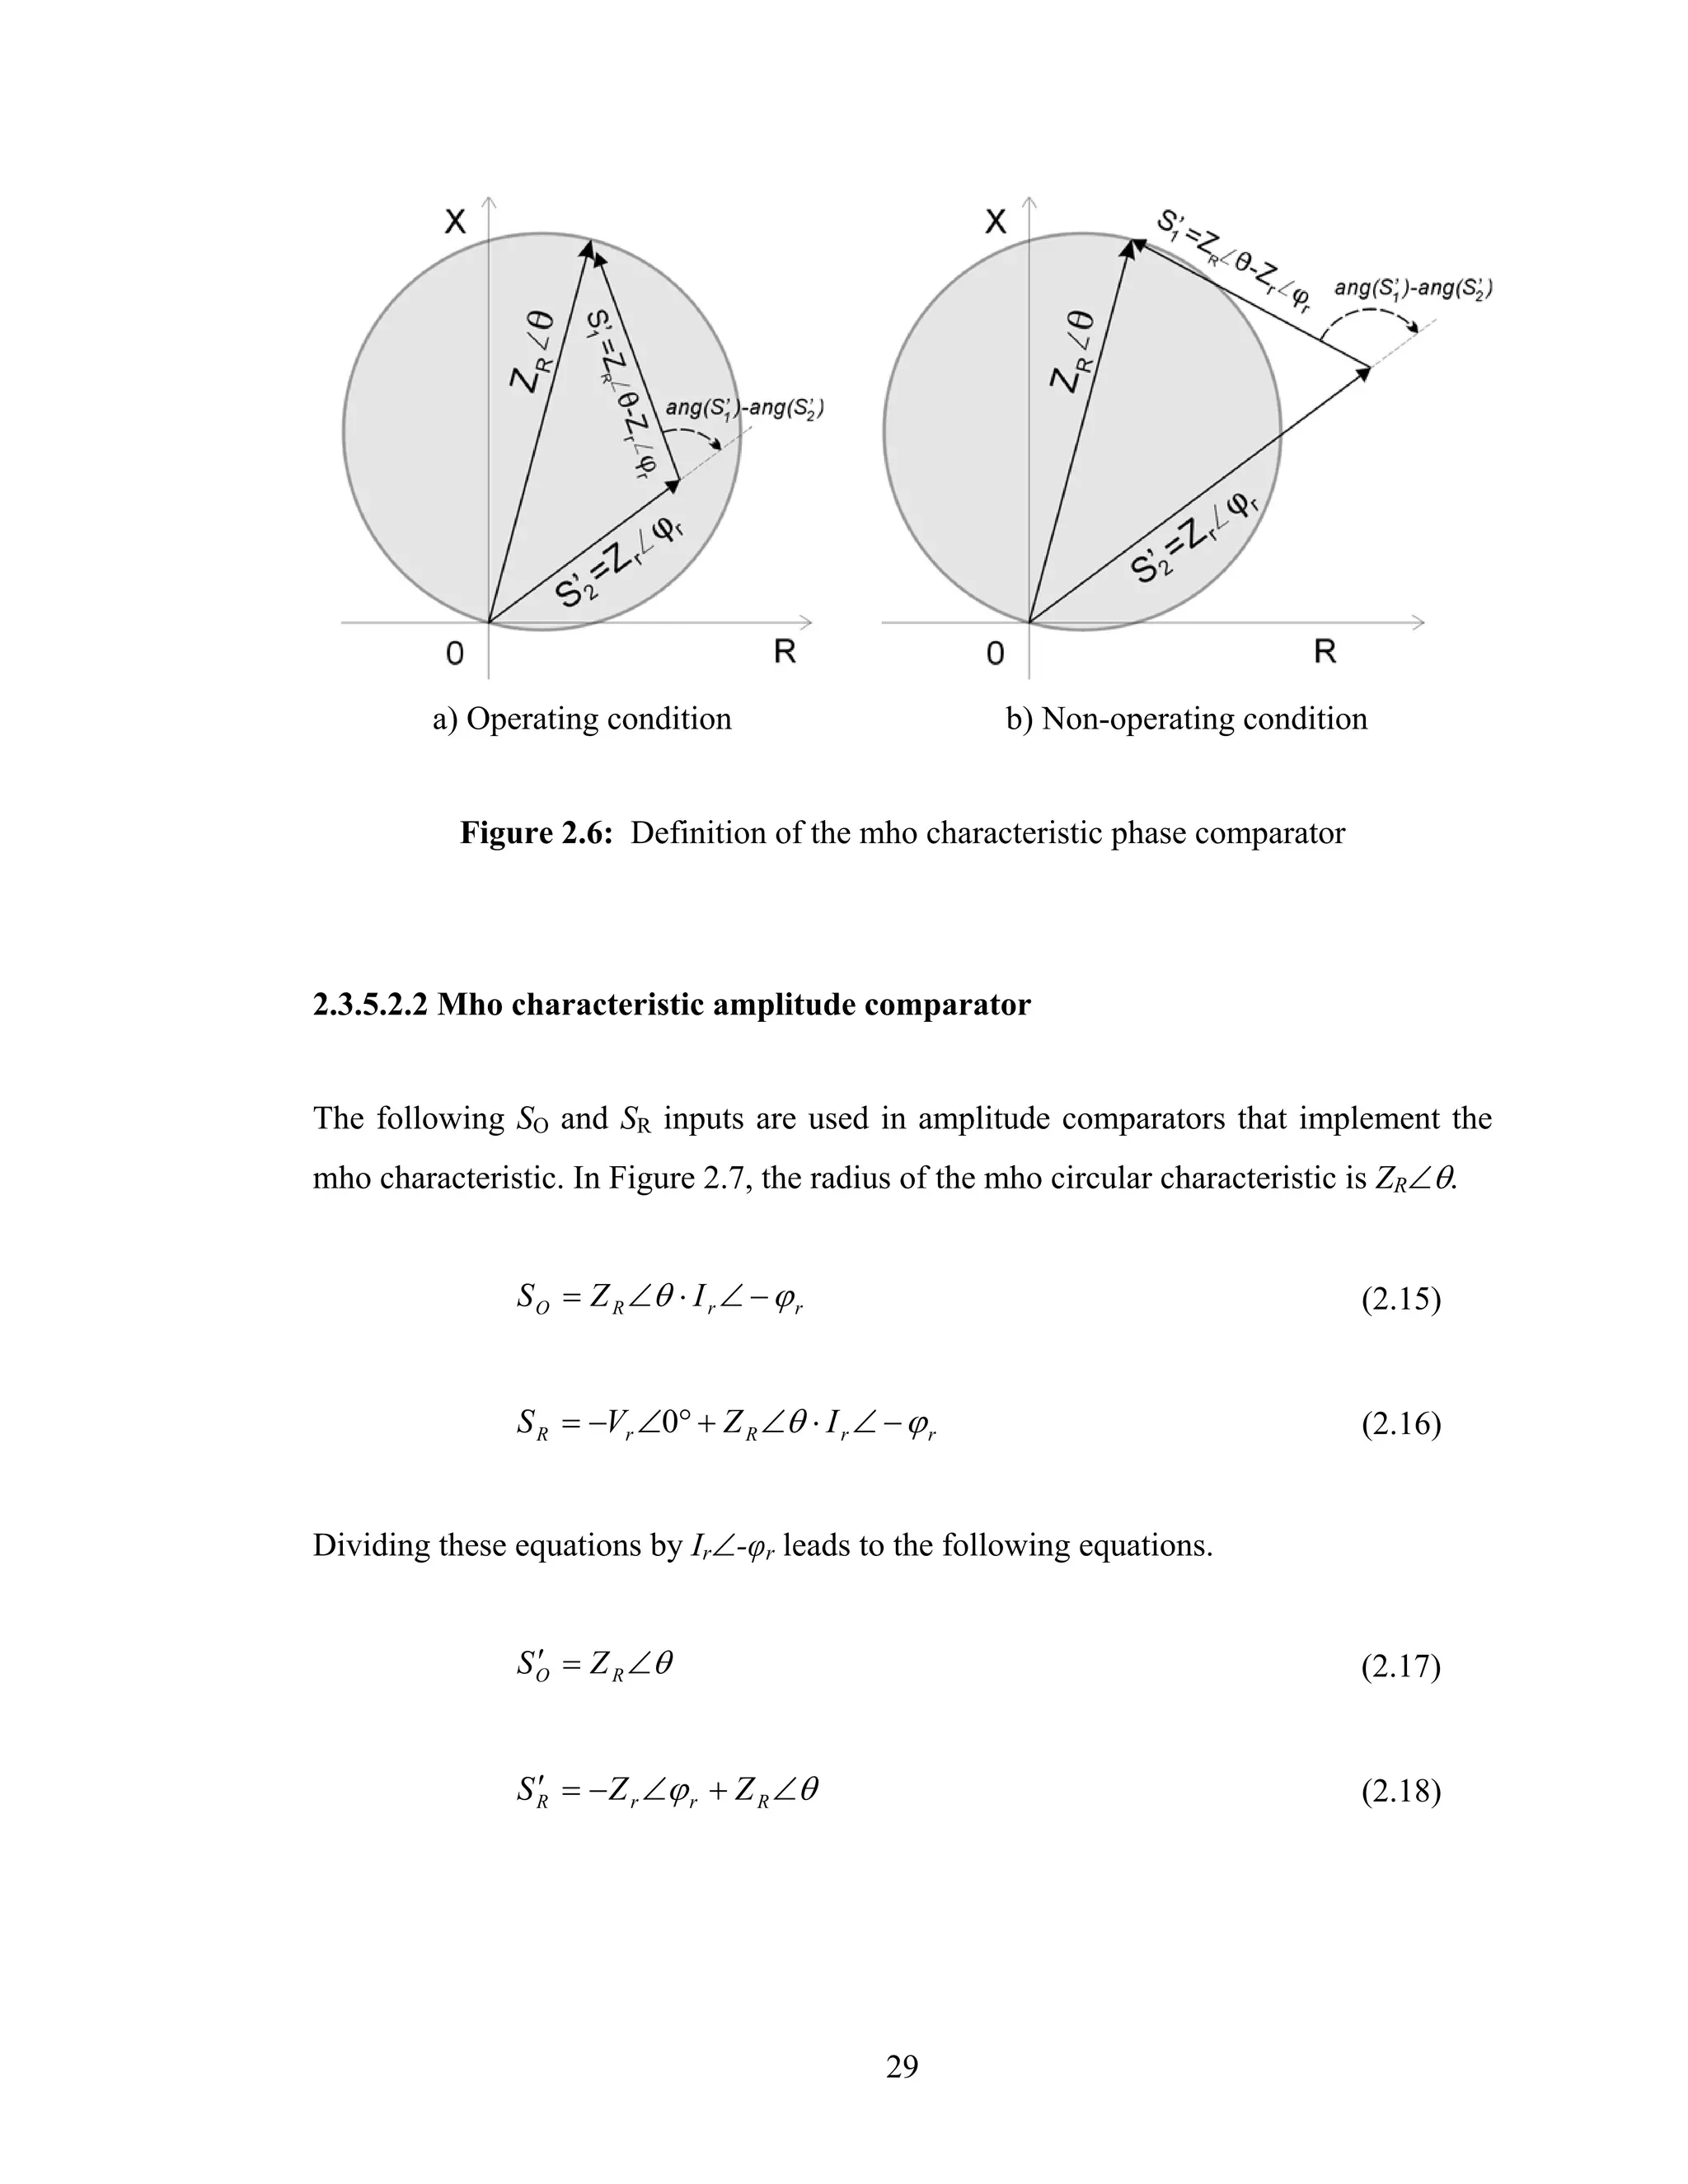
Figure 2.7 (a) Definition of the mho characteristic amplitude comparator. Operating
condition .................................................................................................... 30
Figure 2.7 (b) Definition of the mho characteristic amplitude comparator. Non-
operating condition .................................................................................... 30
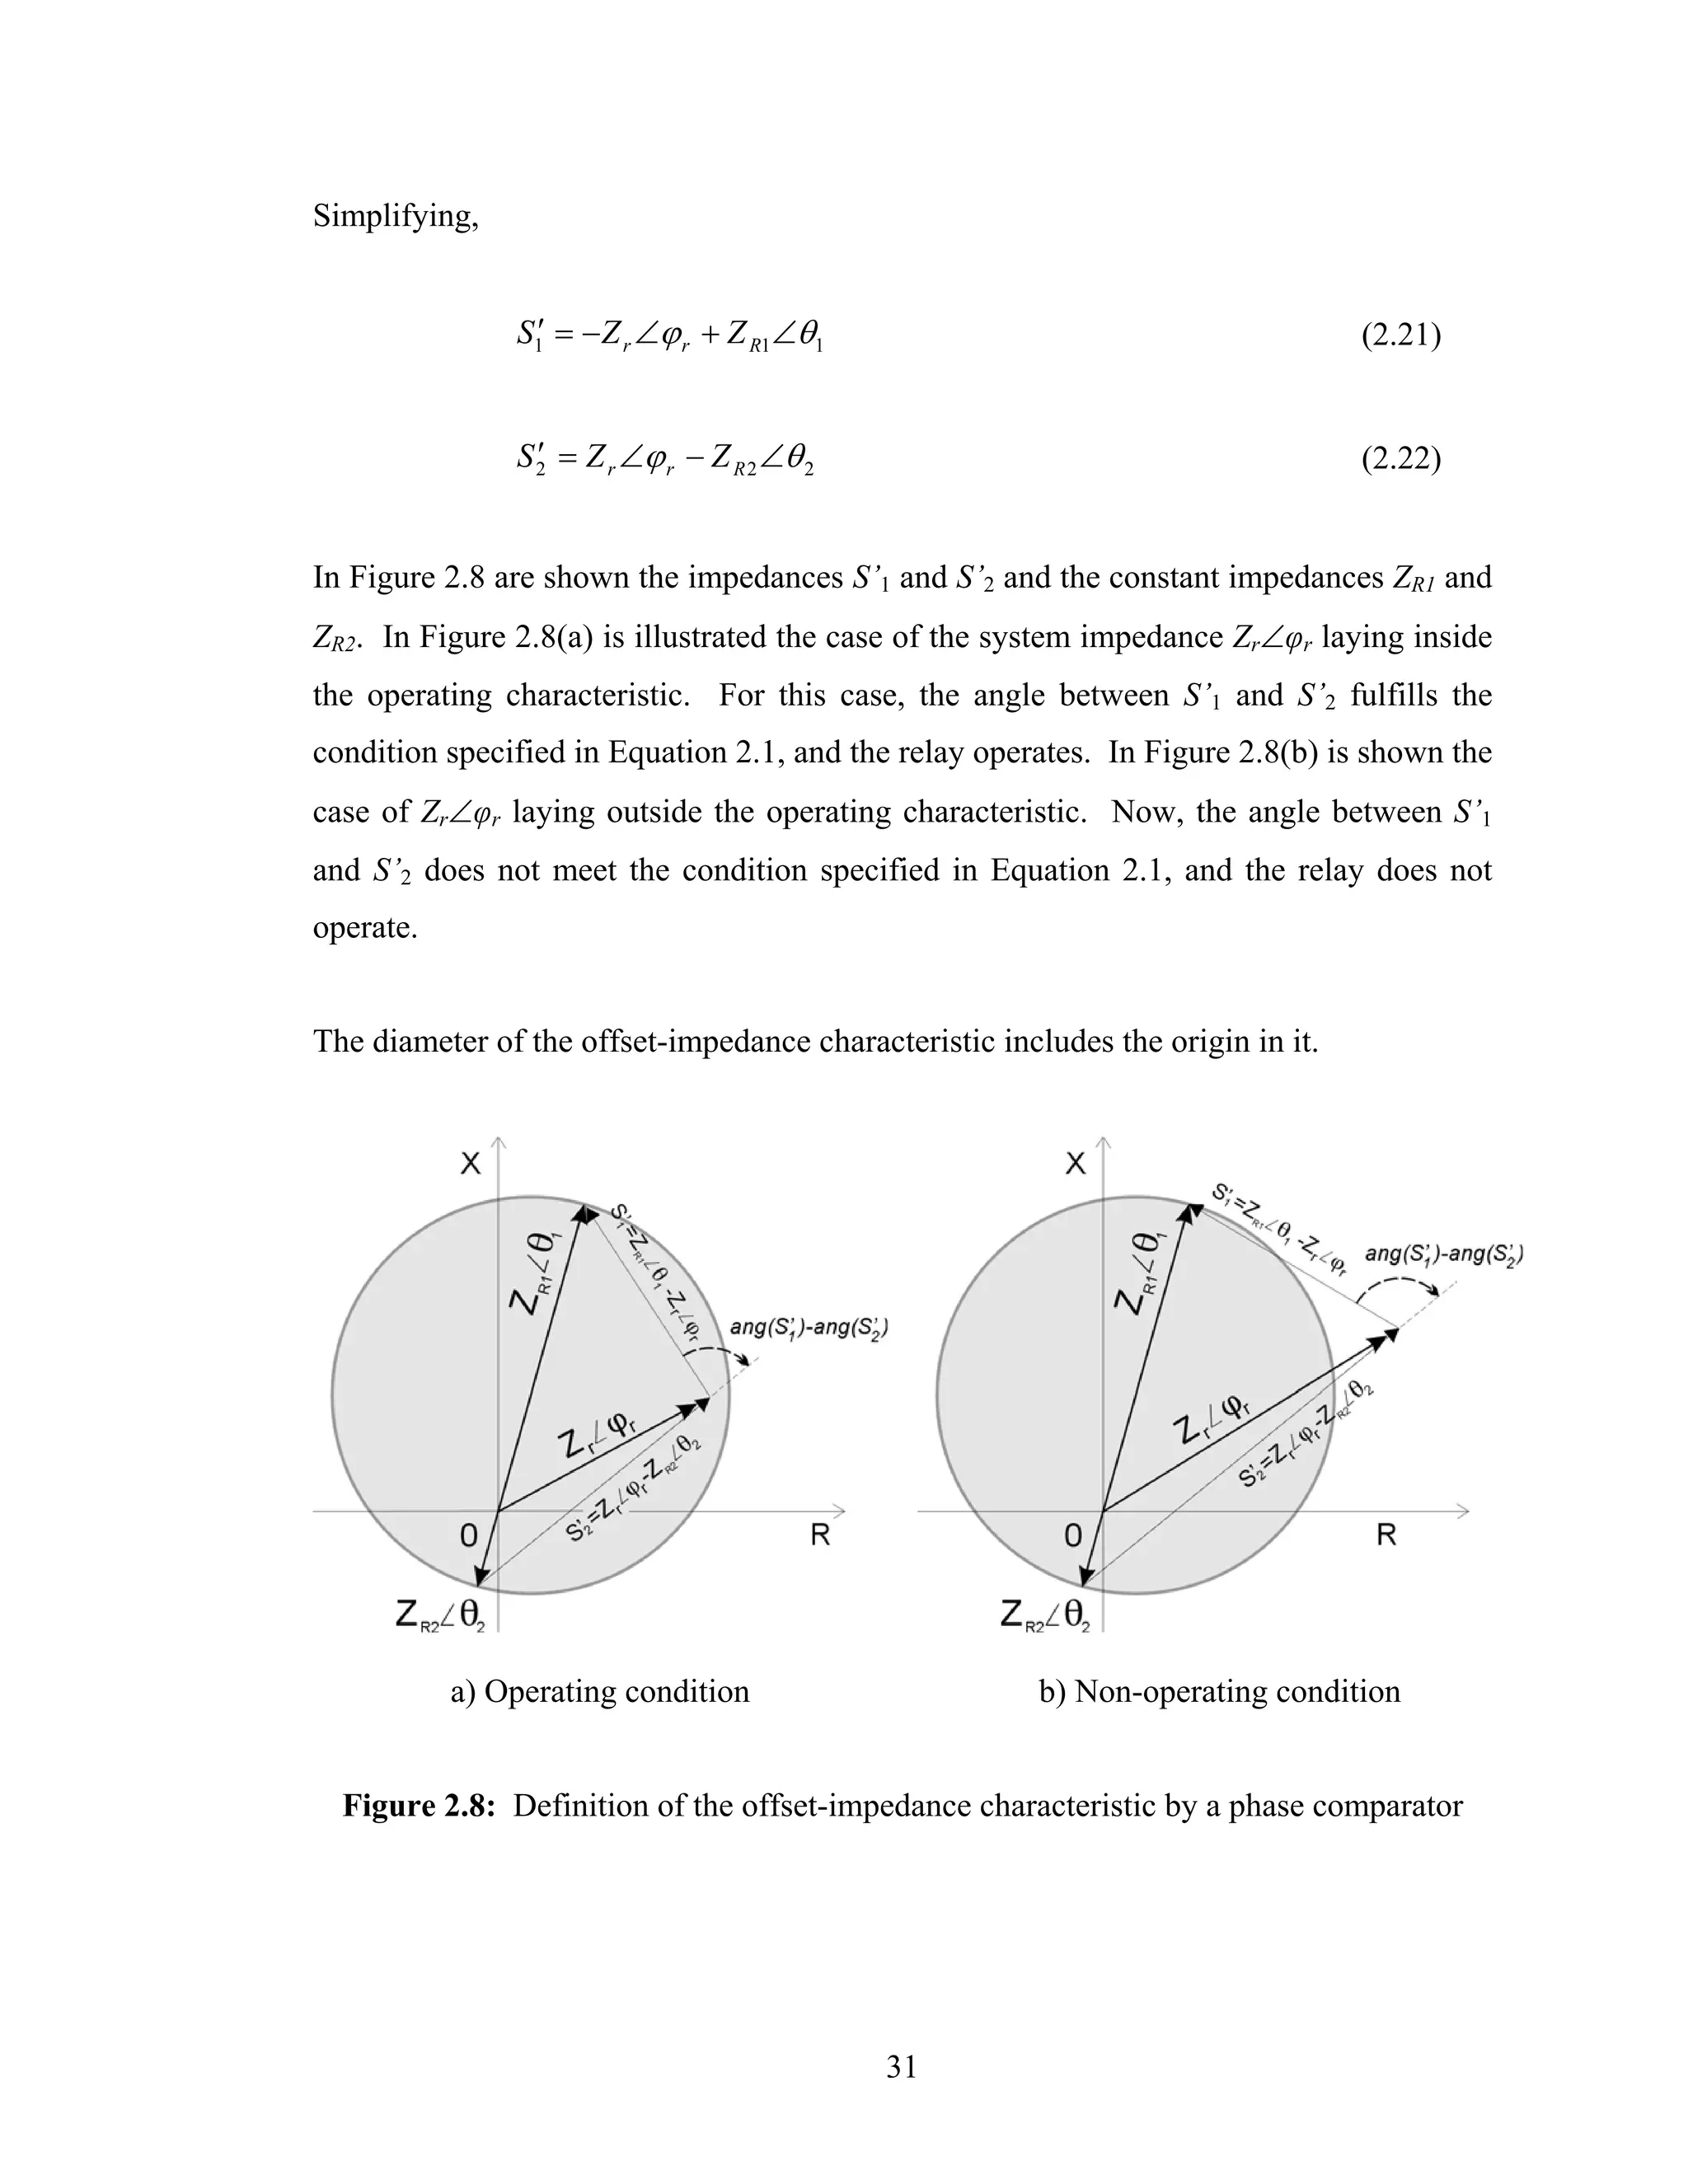
Figure 2.8 (a) Definition of the offset-impedance characteristic phase comparator.
Operating condition ................................................................................... 31
Figure 2.8 (b) Definition of the offset-impedance characteristic phase comparator.
Non-operating condition............................................................................ 31
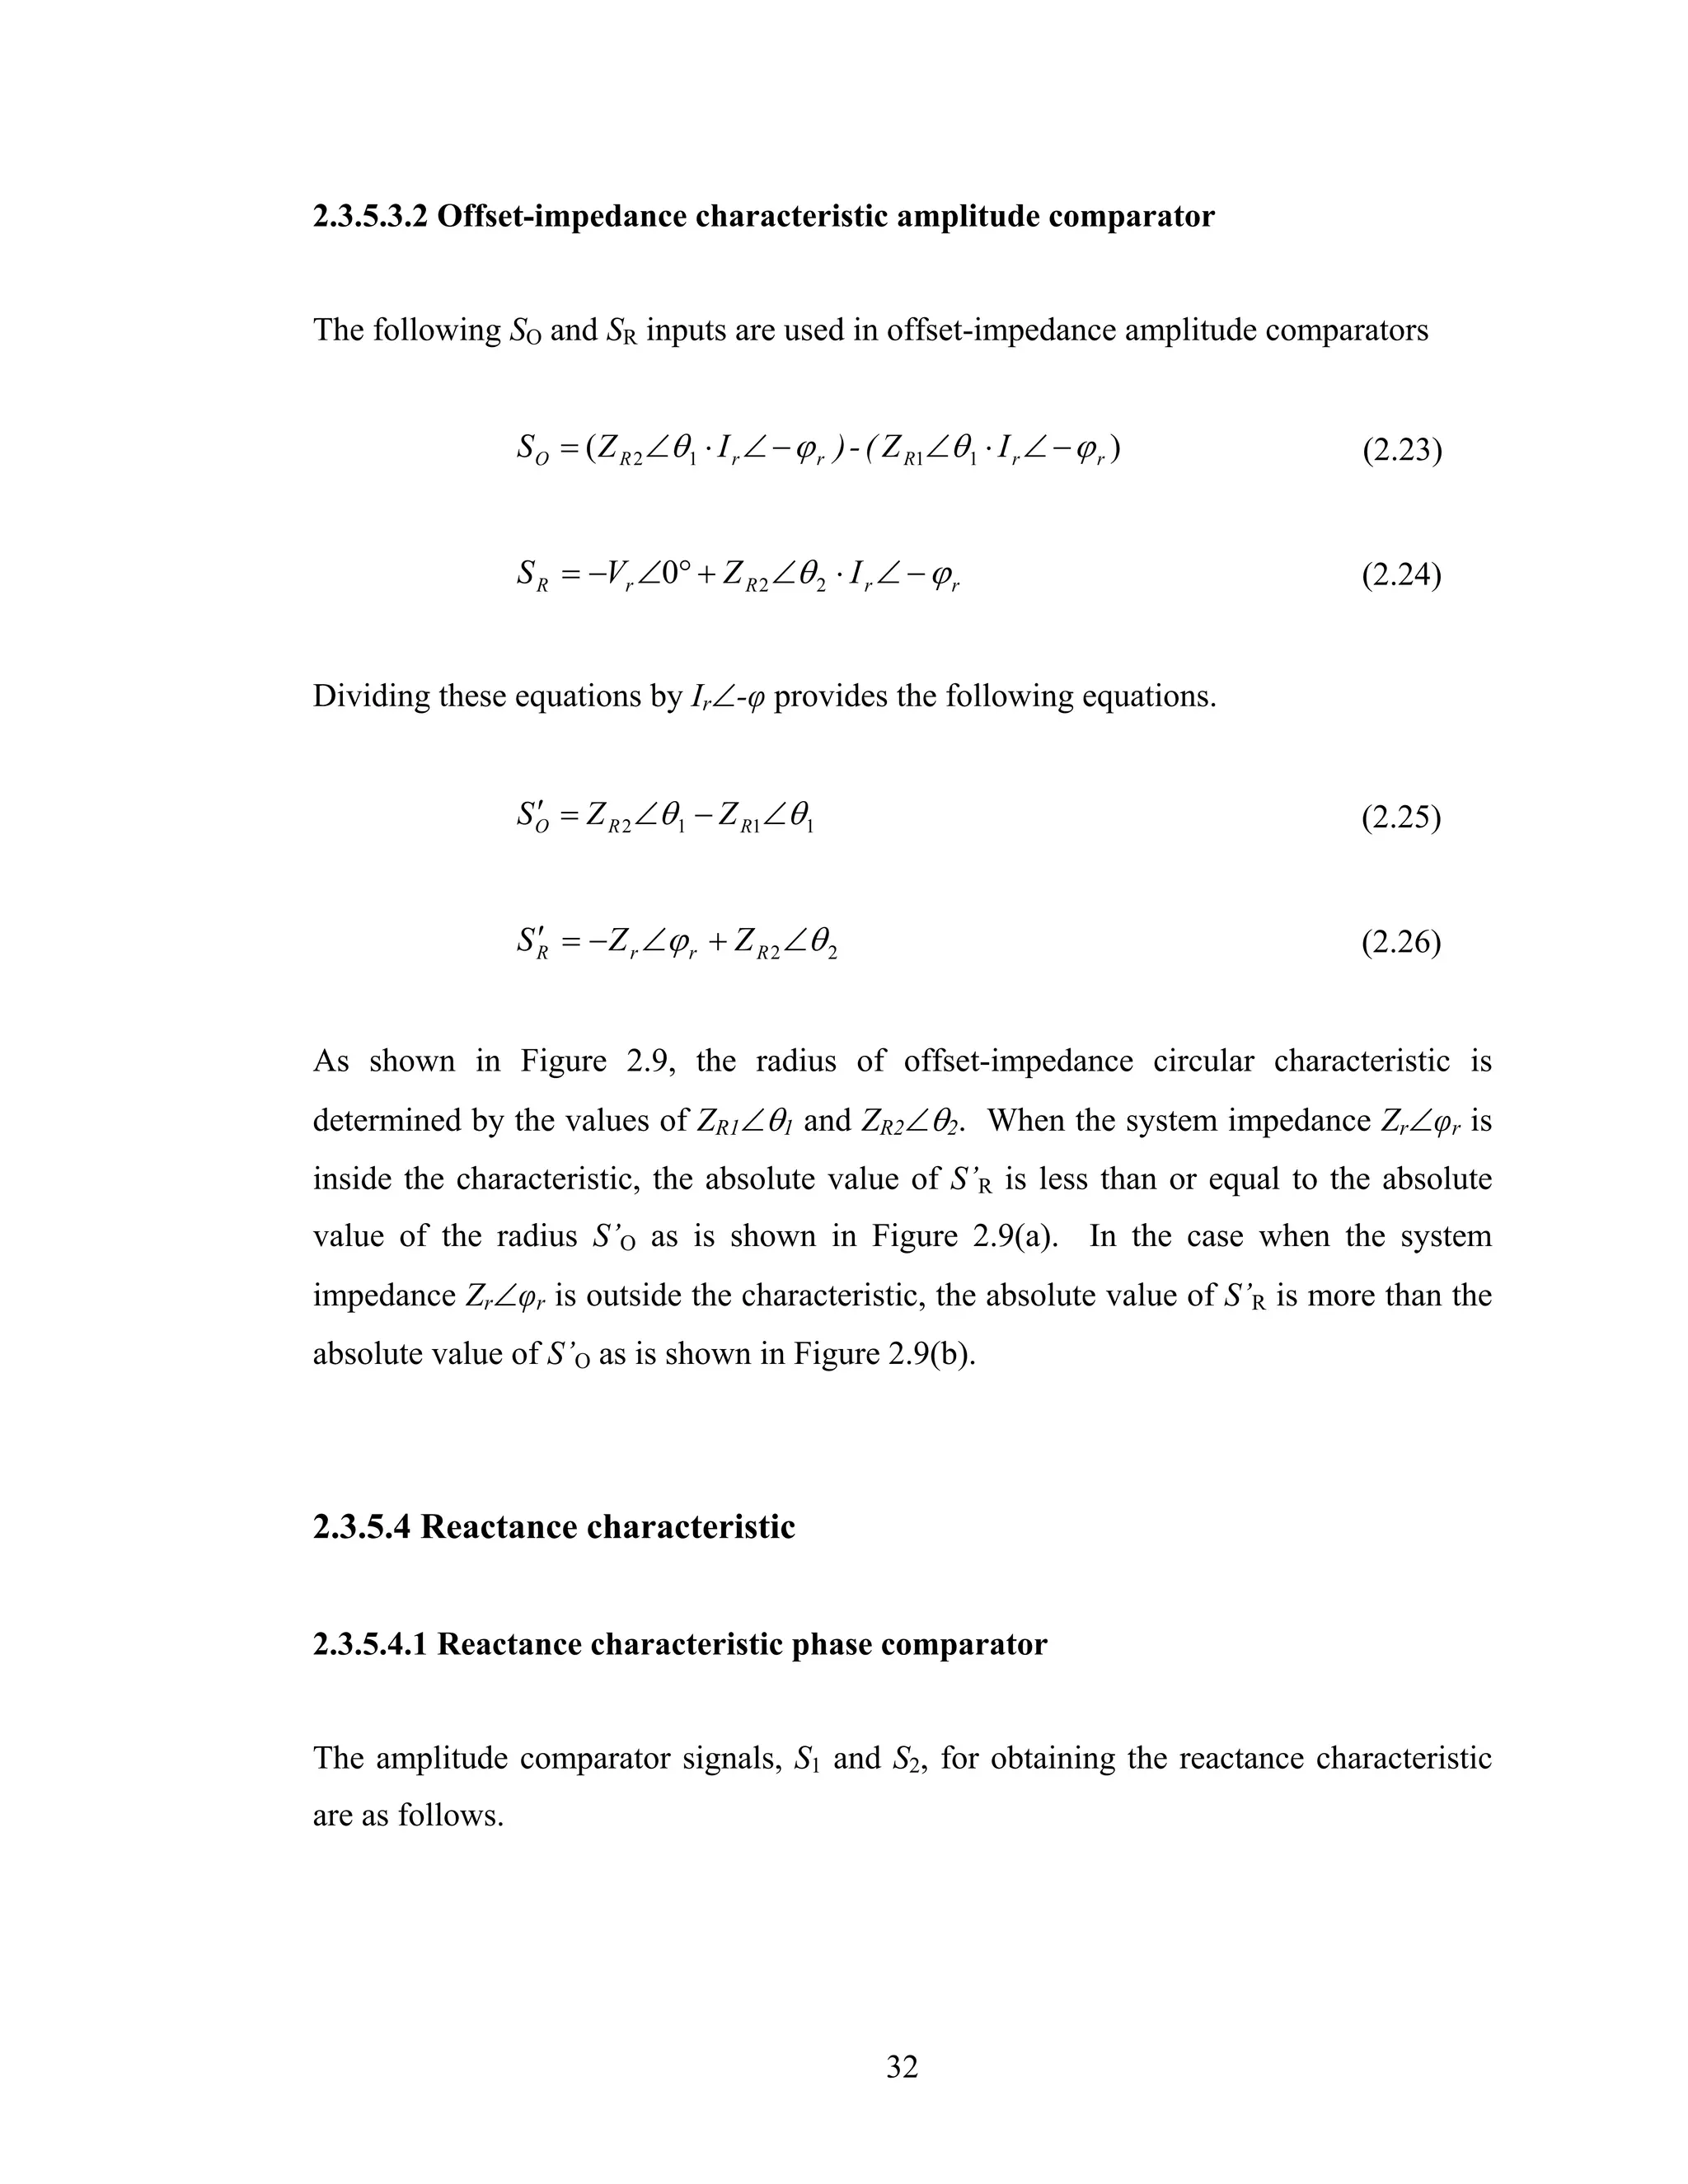
Figure 2.9 (a) Definition of the offset-impedance characteristic amplitude
comparator. Operating condition .............................................................. 33
xiv](https://image.slidesharecdn.com/phdthesissandroaquiles060724-121017023005-phpapp01/75/Thesis-for-Power-System-protection-in-Brief-15-2048.jpg)

![Gp Pass band gain in dB
Gs Stop band gain in dB
N Order of an IIR filter
ω0 Cutoff frequency
T Sampling interval
s Laplace transform variable
z Z-transform variable
CT Current Transformer
VT Voltage Transformer
Is Secondary current of a current transformer
Es Secondary excitation current of a current transformer
ZB Impedance burden connected to the secondary of a current transformer
Ip Current in the primary circuit of a current transformer
CTR Current transformer rate
ADC, A/D Analog-to-Digital Converter
Z10 Integer value of base 10
b Word size of a microprocessor
FP Equivalent floating-point output on an analog-to-digital converter
DSP Digital Signal Processor
DFT Discrete Fourier Transform
LSE Least Square Error
θ Displacement angle of the signal from a reference on a phasor
estimation algorithm
Vp Peak value of the signal on a phasor estimation algorithm
[A]-L Left pseudo-inverse matrix of [A]
MOV Metal Oxide Varistor
PLSA Program to generate digital relay models developed in the present thesis
CPLSADoc Document object in PLSA
CRelay Relay object in PLSA
CPLSAView View object in PLSA
UCCS.f Subroutine of distance relay comparators generated by PLSA
PhDsP Phase Distance Relay P, designed for protection system studies
PhDsQ Phase Distance Relay Q, designed for protection system studies
GrDsP Ground Distance Relay P, designed for protection system studies
xxxiii](https://image.slidesharecdn.com/phdthesissandroaquiles060724-121017023005-phpapp01/75/Thesis-for-Power-System-protection-in-Brief-34-2048.jpg)
![provide different schemes and equipments to detect and to react to each and every one of
these fault scenarios, from the most simple of them to the most complex and compelling.
1.2 Introduction to protective relays
One of the most important equipments employed in the protection of power systems are
protective relays. These are one of the most flexible, economic and well-known devices
that provide reliable, fast and inexpensive protection.
Relay is defined by the IEEE as “an electric device that is designed to interpret input
conditions in a prescribed manner, and; after specified conditions are met, to respond to
cause contact operation or similar abrupt changes in associated electric control circuits
[32]”. Relays acquire signals from the power system (electrical, magnetic, heat,
pressure, etc.) and process them with a designed process or algorithm. IEEE defines a
protective relay as “a relay whose function is to detect defective lines or apparatus or
other power conditions of an abnormal or dangerous nature and to initiate appropriate
control circuit action [32]”.
Protective relays have provided protection since the beginning of the electric industry,
and have encountered great transformations with time as power systems have grown in
size and complexity. Early protective relays were constructed using solenoids and
electromagnetic actuators. Those relays were bulky and heavy devices that needed lot of
space to be mounted. Because of their development and use over several decades,
electromechanical relays evolved to become standard accepted devices. Even modern
relays use most of the principles of operation of electromechanical relays.
Solid-state relays replaced electromechanical actuators by analog electronic elements.
Even when the protection systems based on electromechanical relays had proved to be
reliable, solid-state relays gained confidence of protection engineers because of their
2](https://image.slidesharecdn.com/phdthesissandroaquiles060724-121017023005-phpapp01/75/Thesis-for-Power-System-protection-in-Brief-37-2048.jpg)
![advantages of lower costs, reduced space and weight, and ease to set, maintain and
operate.
The developments in digital technology led to the incorporation of microprocessors in
the construction of relays. Digital and numerical relays are sophisticated, multiple-
purpose equipment with the capacity to record signals during faults, monitor themselves
and communicate with their peers. Numerical relays employ microprocessors especially
constructed to process digital signals, which make them faster and more powerful, while
preserving their economic advantages.
1.3 Investigation topics on protective relaying
The developments in relaying technology have not solved definitively all the protection
issues, and, therefore, substantial investigations and research on protection and
protective relaying continues [25]. The following are the most relevant topics currently
being investigated in the field of protective relaying.
• Setting and adjustment of relays and interrelation of protective relays with
different component of the power system, especially control elements
• Behavior of relays during different operating states of power systems (steady-
state, faulted system, etc.)
• Designing of new relay algorithms, relay functions and protection schemes
• Engineering of new relay products
• Education and training of protection personal
Most of the times, it is impossible to investigate the mentioned topics on real systems
due to operation, security and economical restrictions. Several approaches and resources
have been developed to overcome these difficulties. These include Real Time Digital
Simulators (RTDS), Real Time Playback Simulators (RTPS) and software packages for
modeling protective relays.
3](https://image.slidesharecdn.com/phdthesissandroaquiles060724-121017023005-phpapp01/75/Thesis-for-Power-System-protection-in-Brief-38-2048.jpg)
![Computer models of protective relays offer an economical and feasible alternative to
investigate the performance of relays and protection systems. Computer models of
relays permit investigators to observe in a very detailed way the performance of
processes in each internal module of the relay.
Designing new relaying algorithms or new relaying equipment is also improved with
relay modeling because relay designs are refined before prototypes are built and tested.
For specific problems and conflicting scenarios, use of models open the possibility of
creating new solutions when known approaches do not work satisfactorily.
1.4 Literature review on modeling of protection systems
Relay models have been used for a long time by manufacturers, consultants and
academics for designing new prototypes and algorithms, to check and optimize the
performance of relays already installed in power systems and to train new protection
personnel.
Relay manufacturers were the first to develop relay models for evaluating the
performance of their designs. Those models implemented the processes by substituting
the values of inputs in equations representing the relays to check if the outcomes were
acceptable. The characteristics of overcurrent relays were the first to be modeled.
Mathematical models [45], [46] were developed in the form of algebraic equations for
representing time-current characteristics of overcurrent relays. The first transient model
of a distance relay was presented in [47], where the ninth-order state space mathematical
model of a mho element was developed.
Electromagnetic transient programs are computer software developments that simulate
transients of multiphase networks, and their use has been popular and generally
4](https://image.slidesharecdn.com/phdthesissandroaquiles060724-121017023005-phpapp01/75/Thesis-for-Power-System-protection-in-Brief-39-2048.jpg)
![approved. When working with computer models of relay, electromagnetic transient
programs are powerful tools for protection investigations and studies.
The Electromagnetic Transient Program (EMTP) was the first software that simulates
the transient nature of power systems [43]. EMTP, which is based on the algorithm
proposed by Hermann W. Dommel [42], was presented to the public domain by the
Bonneville Power Administration (BPA) in the late 1960’s.
To rationalize the development of the program, the EMTP Development Coordination
Group (DCG) was founded in 1982. Original members of the DCG included BPA, the
US Bureau of Reclamation, Western Area Power Administration (WAPA), the Canadian
Electrical Association, Ontario Hydro and Hydro-Quebec. The DCG and the Electric
Power Research Institute (EPRI) started the initiative of commercial sale of the EMTP in
1984. The first version of the DCG EMTP was released in 1987.
The Alternative Transient Program (ATP) is the free version of EMTP, and today it is
widely used for power system simulation [26, 43]. Complex networks and control
systems can be simulated with ATP. ATP has extensive modeling capabilities and
additional features such as the Transient Analysis of Control Systems (TACS) and
MODELS, which enable modeling of control systems and components with non-linear
characteristics, respectively. However, while having strong features for programming in
simulation tasks, MODELS has limited memory allocation size for data arrays [49].
PSCAD/EMTDC is an electromagnetic transient analysis program developed by the
Manitoba HVDC Research Center. The program encompasses a wide variety of steady
state and transient power system studies [44]. The primary solution engine is EMTDC,
which represents and solves differential equations for the entire power system in time
domain employing the electromagnetic transient algorithm proposed by Dommel [42].
The graphical user interface is named PSCAD, and it provides powerful means of
visualizing the transient performance of the systems. Together, PSCAD and EMTDC
5](https://image.slidesharecdn.com/phdthesissandroaquiles060724-121017023005-phpapp01/75/Thesis-for-Power-System-protection-in-Brief-40-2048.jpg)
![provide a fast, accurate and flexible solution for the simulation of electrical equipments
or systems.
MATLAB integrates mathematical computing, visualization, and a powerful language to
provide a flexible environment for technical computing [54]. MATLAB possesses a
flexible software structure comprising libraries, models and programs that enable
integration of different model components in a single package. SIMULINK is a package
in MATLAB for obtaining time domain solutions. This package shows an open system
where new libraries and models can be added with relative ease [55]. The Power
System Block Set enables transient modeling of basic components of power systems
[56]. The combination of MATLAB, SIMULINK and the Power System Block Set
permits users to model and simulate real-time power and related protection systems with
high accuracy.
Some techniques that have been developed towards computational interfacing between
electromagnetic transient programs and external programs are outlined in the paragraphs
that follow.
J. Mahseredjian, G. Benmouyal, X. Lombard, M. Zouiti, B. Bressac, L. Gérin-Lajolie
presented in 1998 a programmed link between MATLAB and EMTP [28]. The link
permits the users to call FORTRAN routines contained in the MATLAB library and
Toolboxes of the MATLAB from the general network simulator of EMTP. This enables
external run-time access to the computational engine of MATLAB [51].
A. M. Gole and A. Daneshpooy developed in 1997 an open-system interface between
MATLAB and PSCAD/EMTDC [57]. The authors employed a PSCAD/EMTDC
application called DSDYN to call a FORTRAN subroutine. The FORTRAN subroutine
starts the MATLAB engine and sets up the data communication pipe between the
PSCAD/EMTDC and the MATLAB engine. Data from the transient simulation in
PSCAD/EMTDC is passed through this data communication pipe to the MATLAB and
6](https://image.slidesharecdn.com/phdthesissandroaquiles060724-121017023005-phpapp01/75/Thesis-for-Power-System-protection-in-Brief-41-2048.jpg)
![processed. However, the literature survey has not found a development in relay
modeling that had used this technique.
The works presented in the past on modeling of digital and numerical relays have used
two different approaches: The first approach has modeled the power system and the
relay in the same electromagnetic transient program ([27], [48], [49], [53], [59]), while
the second approach has modeled the power system in the electromagnetic transient
program and the relay in an external program [29]. In the second approach, the interface
between the electromagnetic transient program and relay models is crucial. The
following is a description of the works developed in the past on modeling of digital and
numerical relays. The works were found by a literature survey conducted for this thesis
and are presented in the ascendant chronological order.
One of the earliest works on modeling relay algorithms was presented in 1990 by M. S.
Sachdev, M. Nagpal, and T. Adu [22]. The authors introduced an interactive software
programmed in APL for evaluating algorithms of digital relays. The software included
signal processing and protection modules used in typical digital relays. The data for
testing the performance of digital relay designs could be generated either by facilities
included in the software, recorded from a power system location or generated by other
softwares.
In 1993, Wilson and Nordstrom modeled one measuring unit of a distance digital relay
using MODELS of EMTP [48]. The input filter, analog-to-digital converter,
fundamental frequency phasor calculator and relay measuring principle were modeled
separately in MODELS. The simulations were compared with laboratory test results
obtained by applying digitally generated waveforms to the actual relay.
In 1994, A. K. S. Chaudhary, Kwa-Sur Tam and A. G. Phadke developed specific
models of relays for line protection and transformer differential protection and models of
current and capacitor voltage transformers for the EPRI/DCG EMTP version 2.0 [27].
The authors made several changes to the main subroutine of EMTP to link it with user-
7](https://image.slidesharecdn.com/phdthesissandroaquiles060724-121017023005-phpapp01/75/Thesis-for-Power-System-protection-in-Brief-42-2048.jpg)
![defined FORTRAN subroutines that simulate relay algorithms. The elements modeled
permitted the user to simulate dynamic interactions between the power system and the
protection system.
In 1995, P. G. McLaren, G. W. Swift, Z. Zhang, E. Dirks, R. P. Jayasinghe, and I.
Fernando modeled a new positive-sequence directional element of a numerical distance
relay simulated in PSCAD/EMTDC [59]. The subroutines representing the relay were
linked to the electromagnetic transient engine of EMTDC, and the model was
incorporated to the relay library of the graphical routine PSCAD. The relay models
were tested using a Real Time Digital Simulator (RTDS).
In 1997, T.S. Sidhu, M. Hfuda, and M. S. Sachdev presented a unified approach in
MATLAB to produce computer models of distance, differential and overcurrent relays
[23]. The approach is composed of two MATLAB programs. The first program is an
interactive environment for collecting the design specifications. The second program
produces the program code and logic of the relay model. The input data entered to the
relay model is generated by direct mathematic function sampled at specific rates.
M. Kezunovic and Q. Chen presented in 1997 a work where the power system transients
are simulated using ATP and the protective relay is modeled in MATLAB [29]. The
interaction between both systems was implemented in a closed-loop employing an
“interaction buffer” for communication. The approach also permitted the simulation of
the relay model in other high level languages while maintaining the link. Minor
modifications to the ATP program were included to establish the interaction between the
power system modeled in ATP and the external relay model.
In 1997, R. W. Wall and B. K. Johnson developed an educational tool for investigating
relay concepts by modeling digital relays using TACS functions within EMTP in a
closed-loop [58]. The TACS functions were used to model dynamics associated with
analog-to-digital conversion and sampling systems.
8](https://image.slidesharecdn.com/phdthesissandroaquiles060724-121017023005-phpapp01/75/Thesis-for-Power-System-protection-in-Brief-43-2048.jpg)
![M. Kezunovic and B. Kasztenny presented in 1999 new SIMULINK libraries for
modeling digital protective relays for teaching protective relay concepts [53]. The
MATLAB software package with SIMULINK was utilized for developing customized
relay model libraries. Power systems were modeled in the Power Block Set Toolbox
and were set to interact with the digital relay libraries in the open-system environment of
SIMULINK.
In 2000, Chul-Hwan Kim, Myung-Hee Lee, R. K. Aggarwal and A. T. Johns presented
the implementation of a distance relay algorithm using EMTP MODELS for educational
purposes [49]. All the procedures for the simulation of a digital relay system were
integrated in an EMTP file. The modeling of the power system and the protective
system were integrated in one program module. The authors implemented an anti-
aliasing low-pass filter and the DC-offset removal filter in order to extract the
fundamental frequency current and voltage phasors, which were used for calculating the
apparent impedance.
1.5 Objectives of the research
Digital and numerical relays offer flexible, economic and feasible protection to electric
power systems. These relays are widely used in today’s power systems. Designing and
modeling of numerical relays are crucial tasks in developing new devices and
algorithms. Modeling of digital and numerical relays is employed by utility engineers
and educators to assess the performance of relays installed in power systems and to train
new protection personnel. Digital and numerical relay models are employed by
manufacturers and researchers to develop new relay prototypes and protection
algorithms.
The literature survey reported in the previous section outlines the principal research
works that have been done in the area of relay modeling. An important part of these
activities was focused on the modeling of numerical relays. The survey has shown that
9](https://image.slidesharecdn.com/phdthesissandroaquiles060724-121017023005-phpapp01/75/Thesis-for-Power-System-protection-in-Brief-44-2048.jpg)
![the modeling of relays is a powerful tool when working along with an electromagnetic
transient programs either in an open- or closed-loop structure. At the same time, the
literature survey has revealed the following issues related to the modeling techniques.
• Most of the techniques show a lack of automation and generalization in their
processes. This means that the modeling techniques are not computer-aided for
successive relay model designing. A whole new modeling process has to be
planned and carried out thoroughly every time a new relay model has to be
produced.
• The techniques that offer generality in the modeling process [53] employ
software that is not the standard in the industry to perform power transient
studies.
• The techniques modeling the power system and the digital relay in the same emtp
present the difficulty of setting a link between the electromagnetic transient
engine and the relay model. To set up the link, it is necessary to have an in depth
knowledge of the structure of the emtp to make proper modifications. The
amount of work that this task takes can be as big as the modeling process itself.
The objective of the proposed research was to develop a methodology for designing
protection systems. This methodology should facilitate the process of designing
numerical relay models. The methodology should embed the models within a power
system modeled in an electromagnetic transient program in a closed-loop structure to
recreate the protection system working along with the modeled power system. With this
arrangement, the methodology should help in investigating the interaction between the
protection system and the power system under specific scenarios.
A computer program should be developed to design custom relay models. This program
should be provided with relevant data related to the relay of interest. With this
information, the program must generate computational products that mimic the relay
performance. These computational products might not have direct one to one
correspondence to the actual microprocessor machine language coding within the
10](https://image.slidesharecdn.com/phdthesissandroaquiles060724-121017023005-phpapp01/75/Thesis-for-Power-System-protection-in-Brief-45-2048.jpg)
![To achieve these objectives, power systems are divided in generation, transformation,
transmission and distribution subsystems.
Generation consists of converting energy from different forms, such as thermal,
hydraulic or nuclear, to electrical energy. Transformation consists of changing the
voltage levels to those that are convenient for transmitting or distributing electrical
energy. The role of transmission is to transport energy from generally geographically
far away locations, where electric energy is generated, to load centers where it is
consumed. The distribution consists of supplying energy to customers at a convenient
voltage level.
All subsystems described above are composed of costly components and machines.
Protection of these elements is crucial. However, the principal elements to protect in a
power system are generators, power transformers, transmission lines and distribution
circuits.
The philosophy of protection ensures that, in the event of a fault, the faulted element
must be disconnected from the system for isolating the fault to prevent further damage to
the components of the system through which the fault currents were flowing. To
achieve this objective, it is a common practice to interconnect major elements, such as
generators, power transformers, transmission lines, etc, by using circuit breakers.
However, it is a usual practice to control one element with a set of circuit breakers.
In Figure 2.1 are shown the protection zones of a simple power system. Each zone
protects a single element of the power system. The protection zones overlap around
circuit breakers. The purpose is to make certain that no section of the system is left
unprotected. The consequence of this practice is that a fault in an overlapping zone
opens circuit breakers to isolate more than one element from the system. [21].
Back-up protection is provided to ensure that the faulted element of the system is
disconnected even if the primary protection fails to isolate the faulted element. Back-up
16](https://image.slidesharecdn.com/phdthesissandroaquiles060724-121017023005-phpapp01/75/Thesis-for-Power-System-protection-in-Brief-51-2048.jpg)
![protection can be provided locally or from a remote location. Local back-up protection
is provided by equipment that is in addition to the equipment provided for primary
protection whereas remote back-up protection is provided by equipment that is
physically located at substations away from the location where equipment for primary
protection is located.
Figure 2.1: Primary relay protection zones [21]
This research project is dedicated mainly to study and model two of the most widely
used relays, namely, distance relays and differential relays. Distance relays are studied
and modeled for protection of transmission lines and differential relays are studied and
modeled for protection of power transformers.
2.3 Distance protection
Transmission lines electrically connect different elements in a power system. Electrical
power that is generated at relatively low voltage levels is raised to a higher voltage level
to be transported on transmission lines for supplying energy to loads.
Transmission lines generally use voltages of 115 kV and higher. The level of voltage of
transmission lines requires that line conductors be supported on adequate insulation and
17](https://image.slidesharecdn.com/phdthesissandroaquiles060724-121017023005-phpapp01/75/Thesis-for-Power-System-protection-in-Brief-52-2048.jpg)
![remain sufficiently clear of the ground to assure proper operation of the system and
safety of personnel. These requirements result in high cost in the construction of
transmission lines and their maintenance. To safeguard the investment in a transmission
line, several types of protection techniques are used. Directional, over-current, distance
and pilot are some of these techniques.
A single technique or combinations of two or more techniques are employed to detect
line to ground and line-to-line faults on transmission lines.
Distance protection has been widely used for protecting transmission and
subtransmission circuits because of its suitability, simplicity, economy and reliability.
In addition, selectivity and remote back-up protection are natural advantages of this type
of protection.
Distance relays use voltages and currents acquired at the relay location to calculate the
apparent impedance of the protected line. The calculated apparent impedance is
compared with predetermined impedance that is called reach of the relay. During
normal operation, the apparent impedance must be larger that the impedance-reach of
the relay. If the apparent impedance is less than the impedance-reach, then it is
concluded that a fault has occurred in the protected line between the relay location and
the impedance reach of the relay. Under these conditions, the distance relay energizes
the circuits to trip appropriate circuit breakers to isolate the faulted line from the rest of
the system.
2.3.1 Distance relay zones
Selectivity in distance relays is provided by using different impedance reaches in
conjunction with different time delays associated with those settings [3]. The
combination of an impedance reach and its associated time delay is known as a
protection zone. It is common to provide distance relays with three protection zones but,
18](https://image.slidesharecdn.com/phdthesissandroaquiles060724-121017023005-phpapp01/75/Thesis-for-Power-System-protection-in-Brief-53-2048.jpg)
![depending on the application, extra zones can be included in the relay. The incidence of
a fault within a protection zone of a distance relay must initiate and complete the
operation of the relay.
The impedance reach of zone-1 is usually set between 80% and 85% of the transmission
line impedance, leaving the remaining 20% to 15% of the line impedance as a safety
margin. This is done because errors are introduced by inaccuracies of current and
voltage transformers and processes used in the relay for calculating impedances. These
errors could make the relay over-reach causing the relay to operate for faults in other
than its own protection zone. No intentional delay is provided to zone-1 protection.
To allow selectivity, time setting of zone-2 must be graded with the operating time of
zone-1 relays. Zone-2 setting must cover the 15% of the transmission line not protected
by zone-1 and a substantial part of the lines emanating from the remote bus. A usual
practice is to set the impedance-reach to include a maximum of 50% impedance of the
shortest line emanating from the remote bus.
The main function of zone-3 is to offer remote back-up protection for faults occurring in
lines emanating from the remote bus. For a radial system, it is a common practice to set
the reach of zone-3 to cover 100% of the shortest line emanating from the remote bus.
Some times, zone-3 is set to reach to 120% the impedance of the shortest line out of the
remote bus. When multiple lines emanate from the remote bus and a fault occurs on one
of those lines, the currents contributed via the healthy buses connected to the remote bus
affect the calculation of the apparent impedance by the local distance relay. The current
contribution by the healthy lines is known as in-feed and must be taken into account in
determining the setting of zone-3 relays.
In Figure 2.2 are shown typical distance zones that provide local and back-up protection
to a transmission system. In this figure, protection zones are specified according to the
numerical identification of the associated breakers [2].
19](https://image.slidesharecdn.com/phdthesissandroaquiles060724-121017023005-phpapp01/75/Thesis-for-Power-System-protection-in-Brief-54-2048.jpg)
![Figure 2.2: Distance relay protection zones [2]
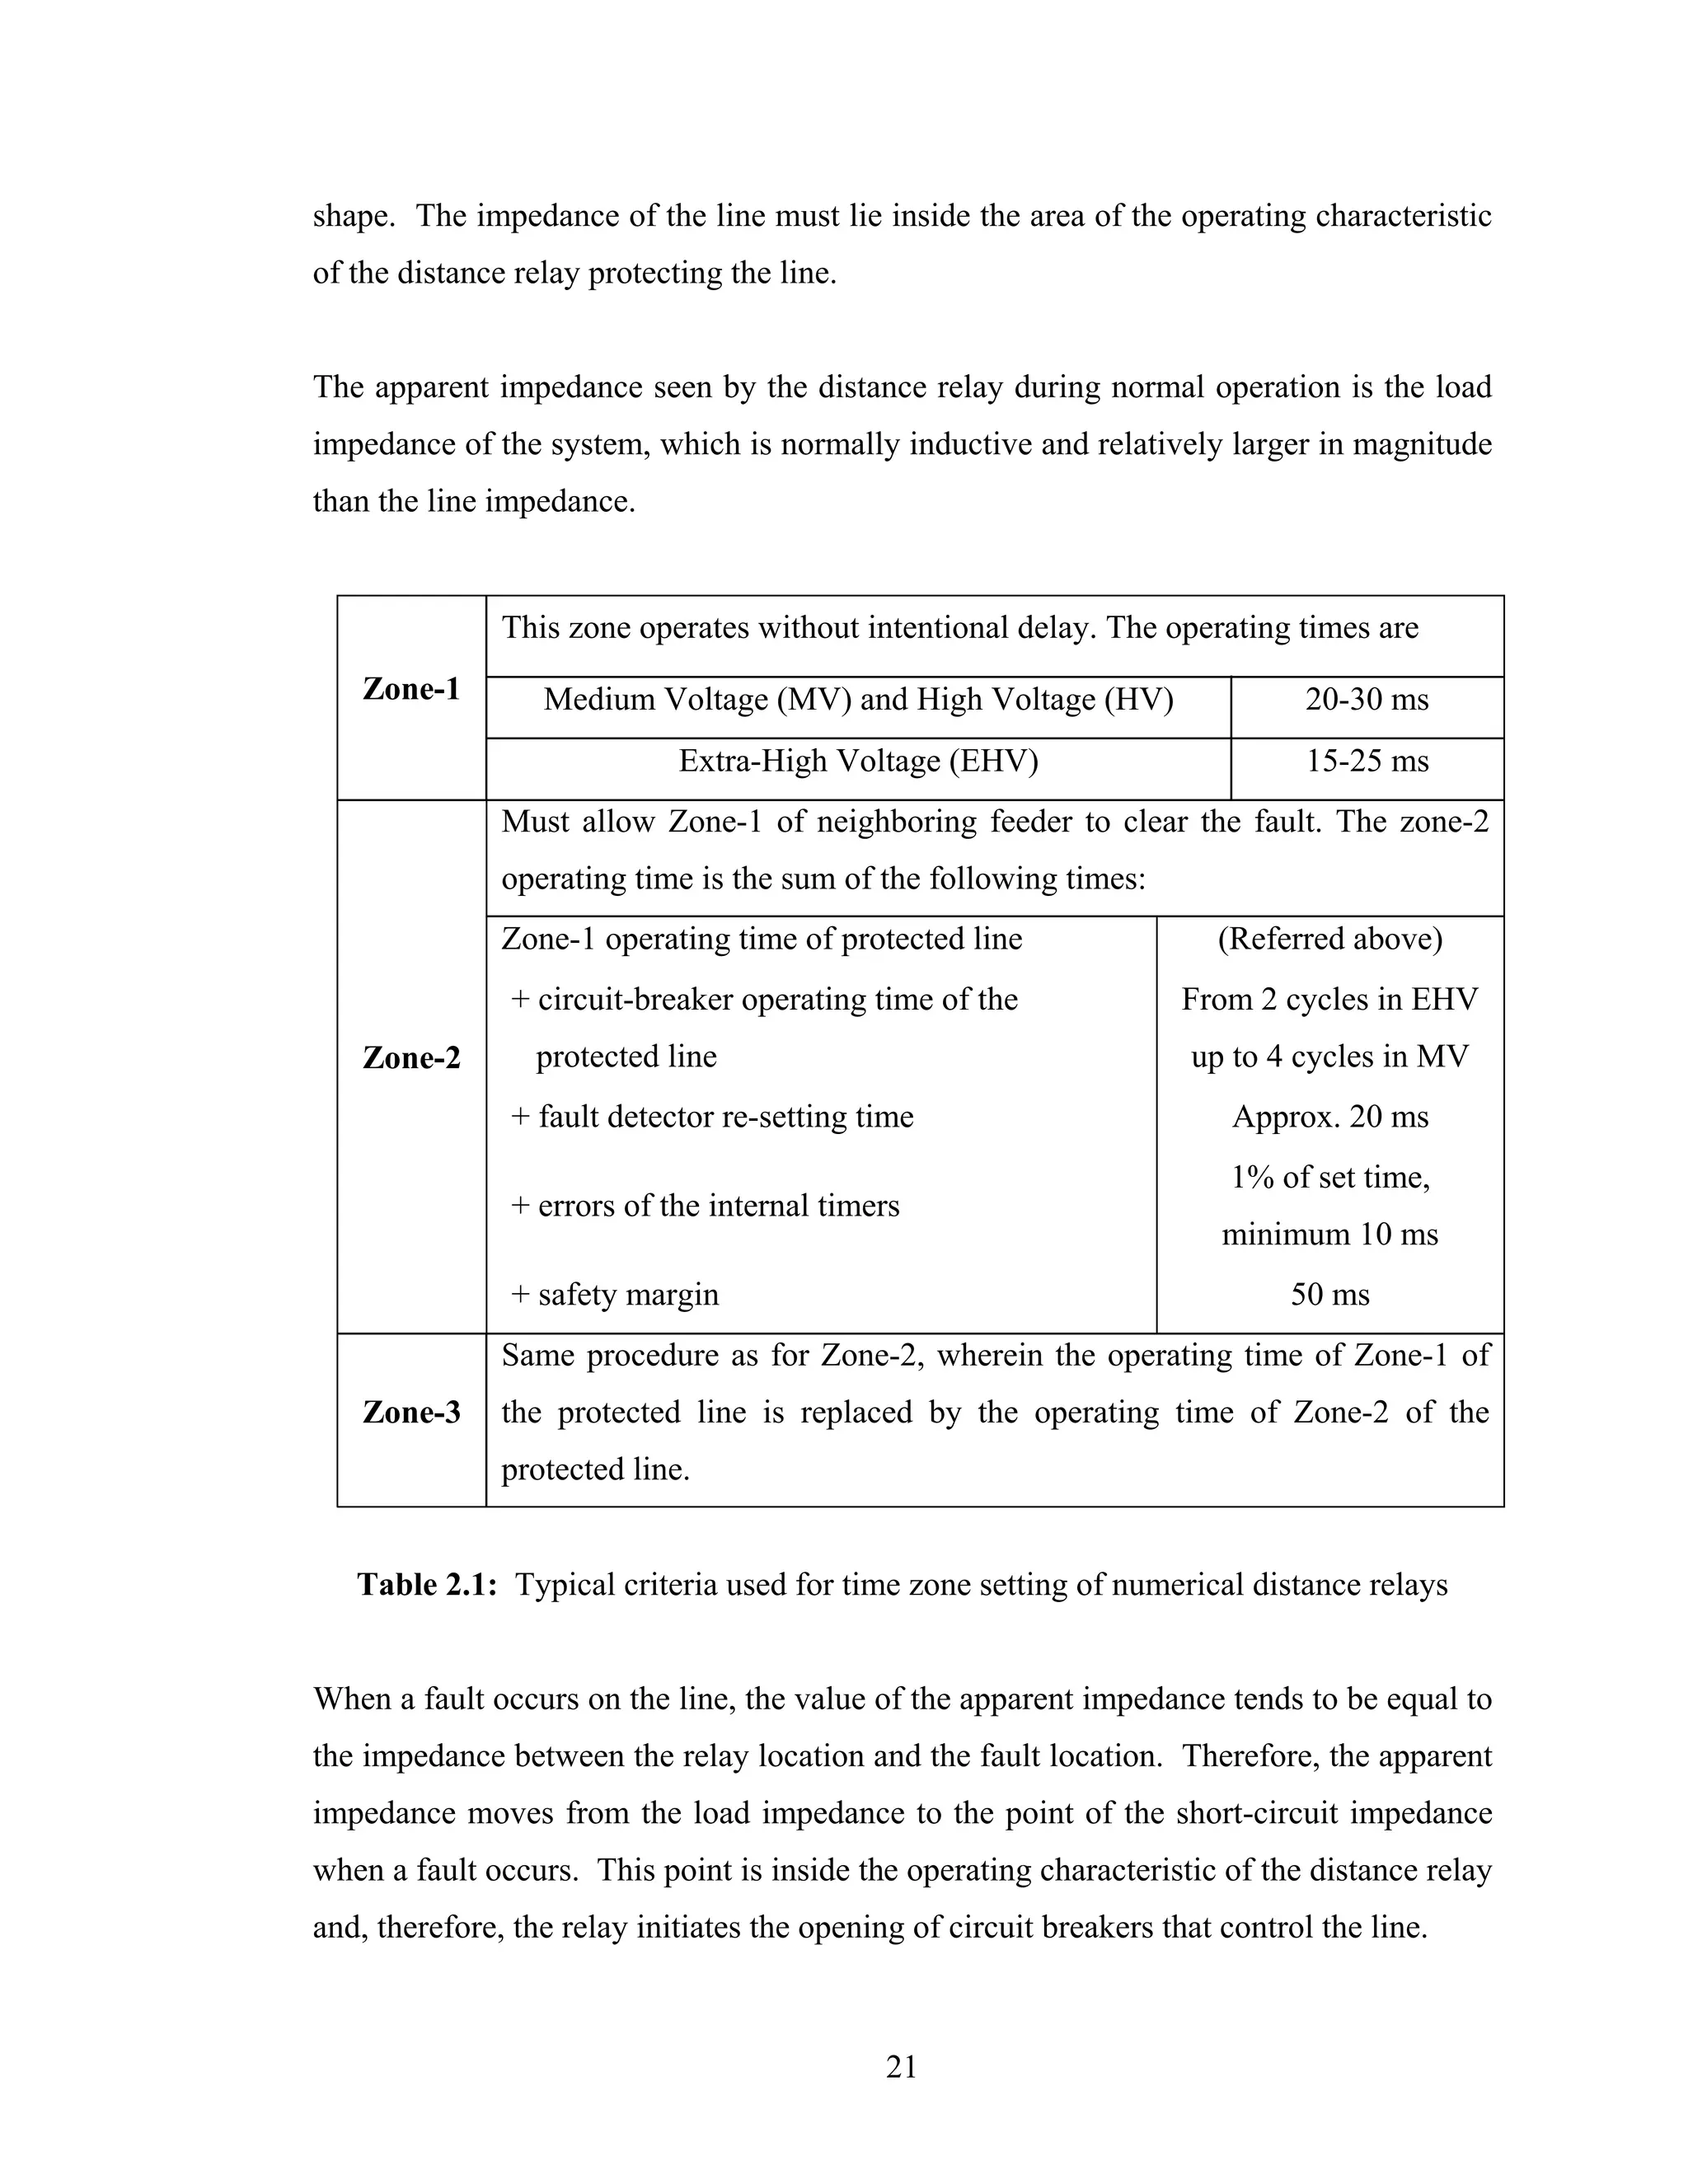
In some situations, it is convenient to provide distance relays with a fourth protection
zone. Zone-4 is employed to provide back-up protection to the local bus bar, normally
by establishing a reverse reach setting of 25% of the impedance of zone-1 [3]. Zone-4 is
also used as a fault detector in some logics to control the operation of the zone timers
[40]. In Table 2.1 are summarized some of the typical criteria used for selecting the
time delay settings of numerical distance relays [40].
2.3.2 Impedance diagram
The calculated apparent impedance of the system, the locus of the impedance of the
protected line and the impedance-reach of distance relays can be represented in a
complex plane that has the resistance and the reactance as coordinate axes. This
complex plane is known as impedance plane.
In the impedance plane the protected line is represented by a straight line, drawn from
the origin to the point corresponding to the impedance of the line in steady state; the
impedance-reach or operating characteristic of a distance relay is represented by a fixed
20](https://image.slidesharecdn.com/phdthesissandroaquiles060724-121017023005-phpapp01/75/Thesis-for-Power-System-protection-in-Brief-55-2048.jpg)
![In Figure 2.3 is shown a plot, in the impedance plane, of the operating characteristics of
the three zones of distance relays located at bus G (shown as solid lines) and at bus H
(shown as dotted lines) of the power system shown in Figure 2.2 [3].
Figure 2.3: Distance relay protection zones in the impedance plane for relays provided
at buses G and H (of Figure 2.2) for protecting the line from Bus G to Bus H [2]
2.3.3 Input signals of distance relays
In Table 2.2 are shown the input signals employed by ground and phase distance relays.
In this table, K0 is a compensating factor. The determination and use of K0 is explained
in section 2.3.6.
2.3.4 Comparators for distance protection
Comparators are measuring units that combine voltages and currents acquired by the
relay to form two composite signals. The difference in phase or magnitude of these
22](https://image.slidesharecdn.com/phdthesissandroaquiles060724-121017023005-phpapp01/75/Thesis-for-Power-System-protection-in-Brief-57-2048.jpg)
![composite signals is used to discriminate between a normal operating condition and a
fault on the protected line. A phase comparator checks the difference between the phase
angles of the two composite signals and operates if the difference is within a specified
range. A magnitude comparator compares the amplitude of the two composite signals
and operates if the amplitude of one signal is greater than the amplitude of the other
signal.
Distance Element Voltage signal Current signals
Phase A Va Ia+K03I0
Phase B Vb Ib+K03I0
Phase C Vc Ic+K03I0
Phase A – Phase B Va - Vb Ia - Ib
Phase B – Phase C Vb - Vc Ib - Ic
Phase C – Phase A Vc - Va Ic - Ia
Table 2.2: Input signals of ground and phase distance relays
The composite signals in a phase comparator are denoted by S1 and S2. An angular
displacement is considered positive if S1 leads S2. A phase comparator operates if the
following condition is satisfied [39].
− 90° ≤ arg(S1 ) − arg(S 2 ) ≤ 90° (2.1)
The composite signals in an amplitude comparator are denoted by SO and SR, operating
and restraining signals, respectively. The comparator operates if the following condition
is satisfied.
SO ≥ S R (2.2)
23](https://image.slidesharecdn.com/phdthesissandroaquiles060724-121017023005-phpapp01/75/Thesis-for-Power-System-protection-in-Brief-58-2048.jpg)
![2.3.5 Distance protection characteristics
The parameters of the composite signals in a comparator determine the shape, size and
position of the operating characteristic in the impedance plane. The operating
characteristics of distance relays are usually geometric figures, such as circles, straight
lines or their combinations. However, in numerical relays it is possible to design
operating characteristics of almost any shape. The most common operating
characteristics employed by distance relays are impedance, offset impedance, mho, mho
polarized, reactance, and quadrilateral characteristics.
The methods used for obtaining different operating characteristics by the phase and
magnitude comparators are presented in the following sections [39]. Special attention is
given to the mho-polarized characteristic because this has been the most commonly used
characteristic for a long time.
2.3.5.1 Impedance characteristic
2.3.5.1.1 Impedance characteristic phase comparator
The phase comparator signals S1 and S2 for obtaining impedance characteristics are
defined by the following expressions.
S1 = −Vr ∠0° + Z R ∠θ ⋅ I r ∠ − ϕ r (2.3)
S 2 = Vr ∠0° + Z R ∠θ ⋅ I r ∠ − ϕ r , (2.4)
where,
S1, S2 are the phase comparator signals
Vr is the voltage applied to the relay
24](https://image.slidesharecdn.com/phdthesissandroaquiles060724-121017023005-phpapp01/75/Thesis-for-Power-System-protection-in-Brief-59-2048.jpg)
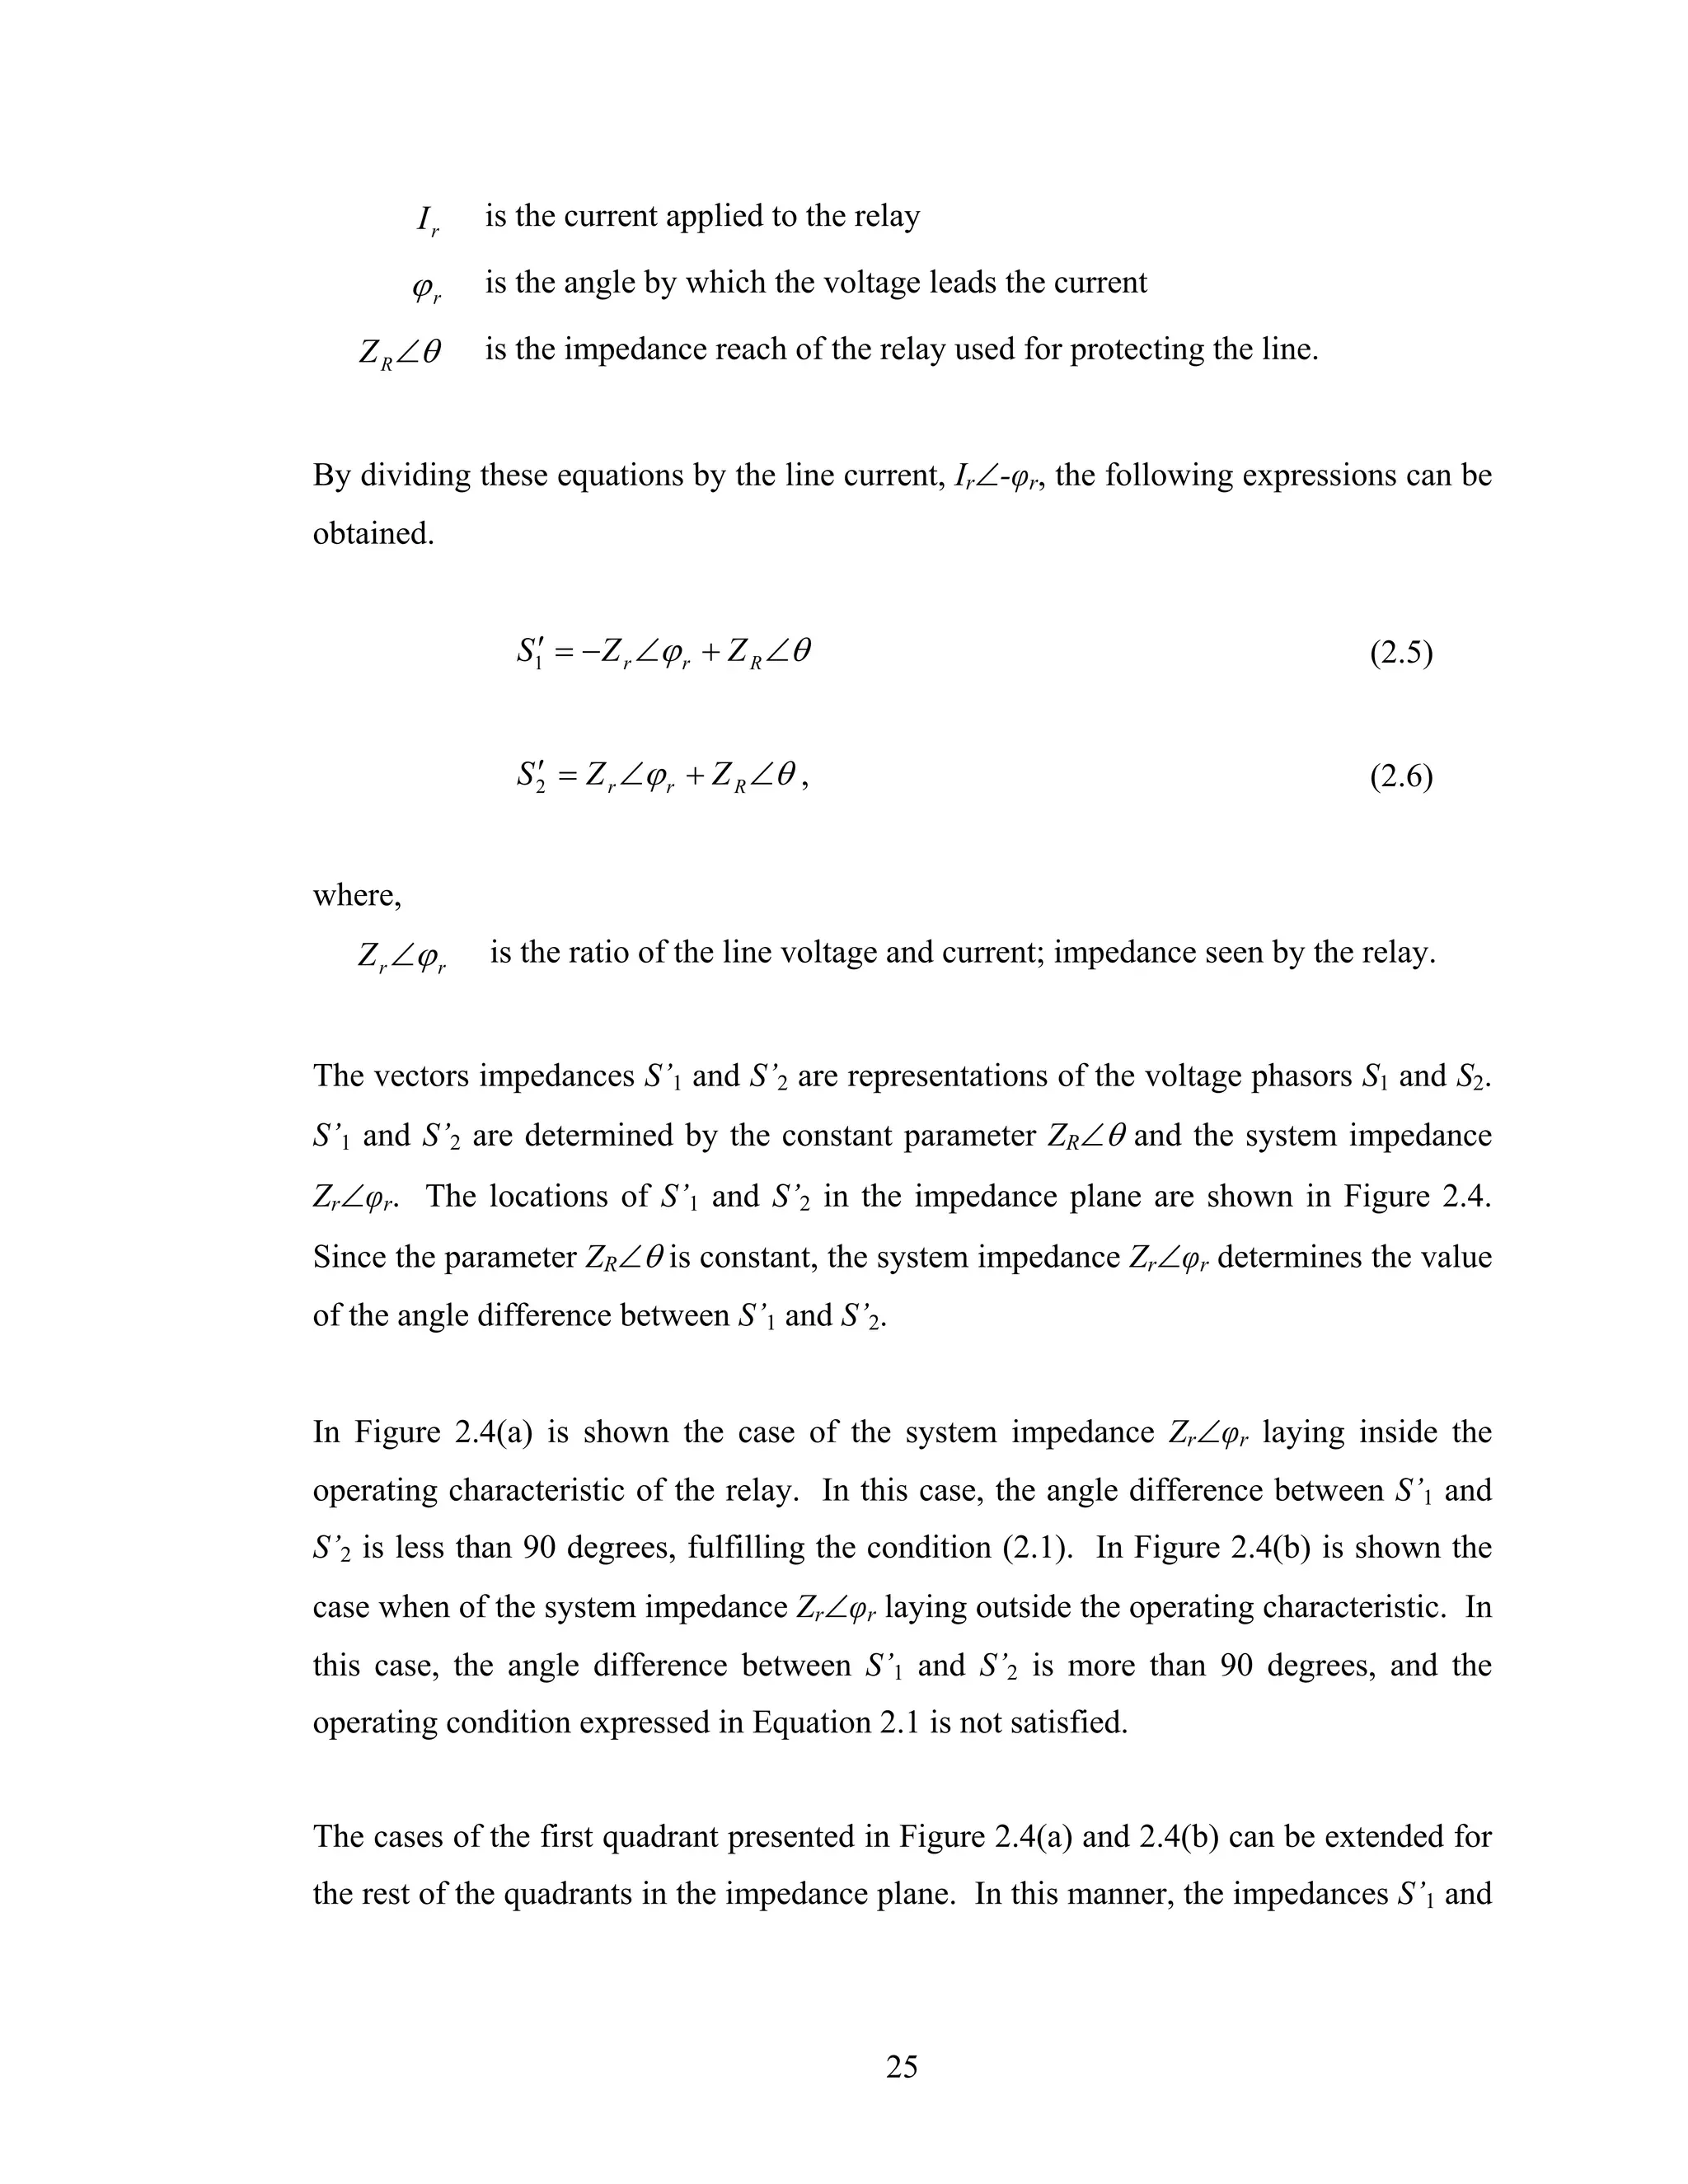
![When the system impedance Zr∠φr is inside the operating characteristic, the magnitude
of S’R is less than or equal to the magnitude of S’R, as is shown in Figure 2.11(a). When
the system impedance Zr∠φr is outside the operating characteristic, the magnitude of S’R
is greater than S’O as is shown in Figure 2.11(b).
a) Operating condition b) Non-operating condition
Figure 2.11: Definition of the reactance characteristic amplitude comparator.
2.3.5.5 Quadrilateral characteristic
In numerical relays, the computed apparent impedance is compared with the borders of a
pre-defined operating characteristic that could be of any predetermined shape of the
operating characteristic [40]. A quadrilateral characteristic can be defined in numerical
relays by specifying the corners of the quadrilateral, as shown in Figure 2.12.
Quadrilateral characteristics are commonly employed for protecting transmission lines
because they can be set to accommodate pre-determined arc resistance while
maintaining sufficient margin from the load region. These features make quadrilateral
characteristic very useful for protecting short transmission lines, where arc resistances
could be a major part of the apparent impedance.
35](https://image.slidesharecdn.com/phdthesissandroaquiles060724-121017023005-phpapp01/75/Thesis-for-Power-System-protection-in-Brief-70-2048.jpg)
![Figure 2.12: Quadrilateral characteristic of a distance relay
2.3.5.6 Polarized mho characteristic
Mho characteristics have been used worldwide for many years because they combine
distance protection and directionality. Their advantages and limitations are well
understood. For these reasons, mho elements continue to be emulated in the algorithms
of relays built with numerical technology [3]. During faults directly in front of or
behind the voltage transformers, short circuit impedance becomes practically zero and a
secure relay decision is no longer possible. To achieve directional sensitivity in such
cases, cross-polarized and memory polarized mho elements are designed and built for
use on high voltage systems [40].
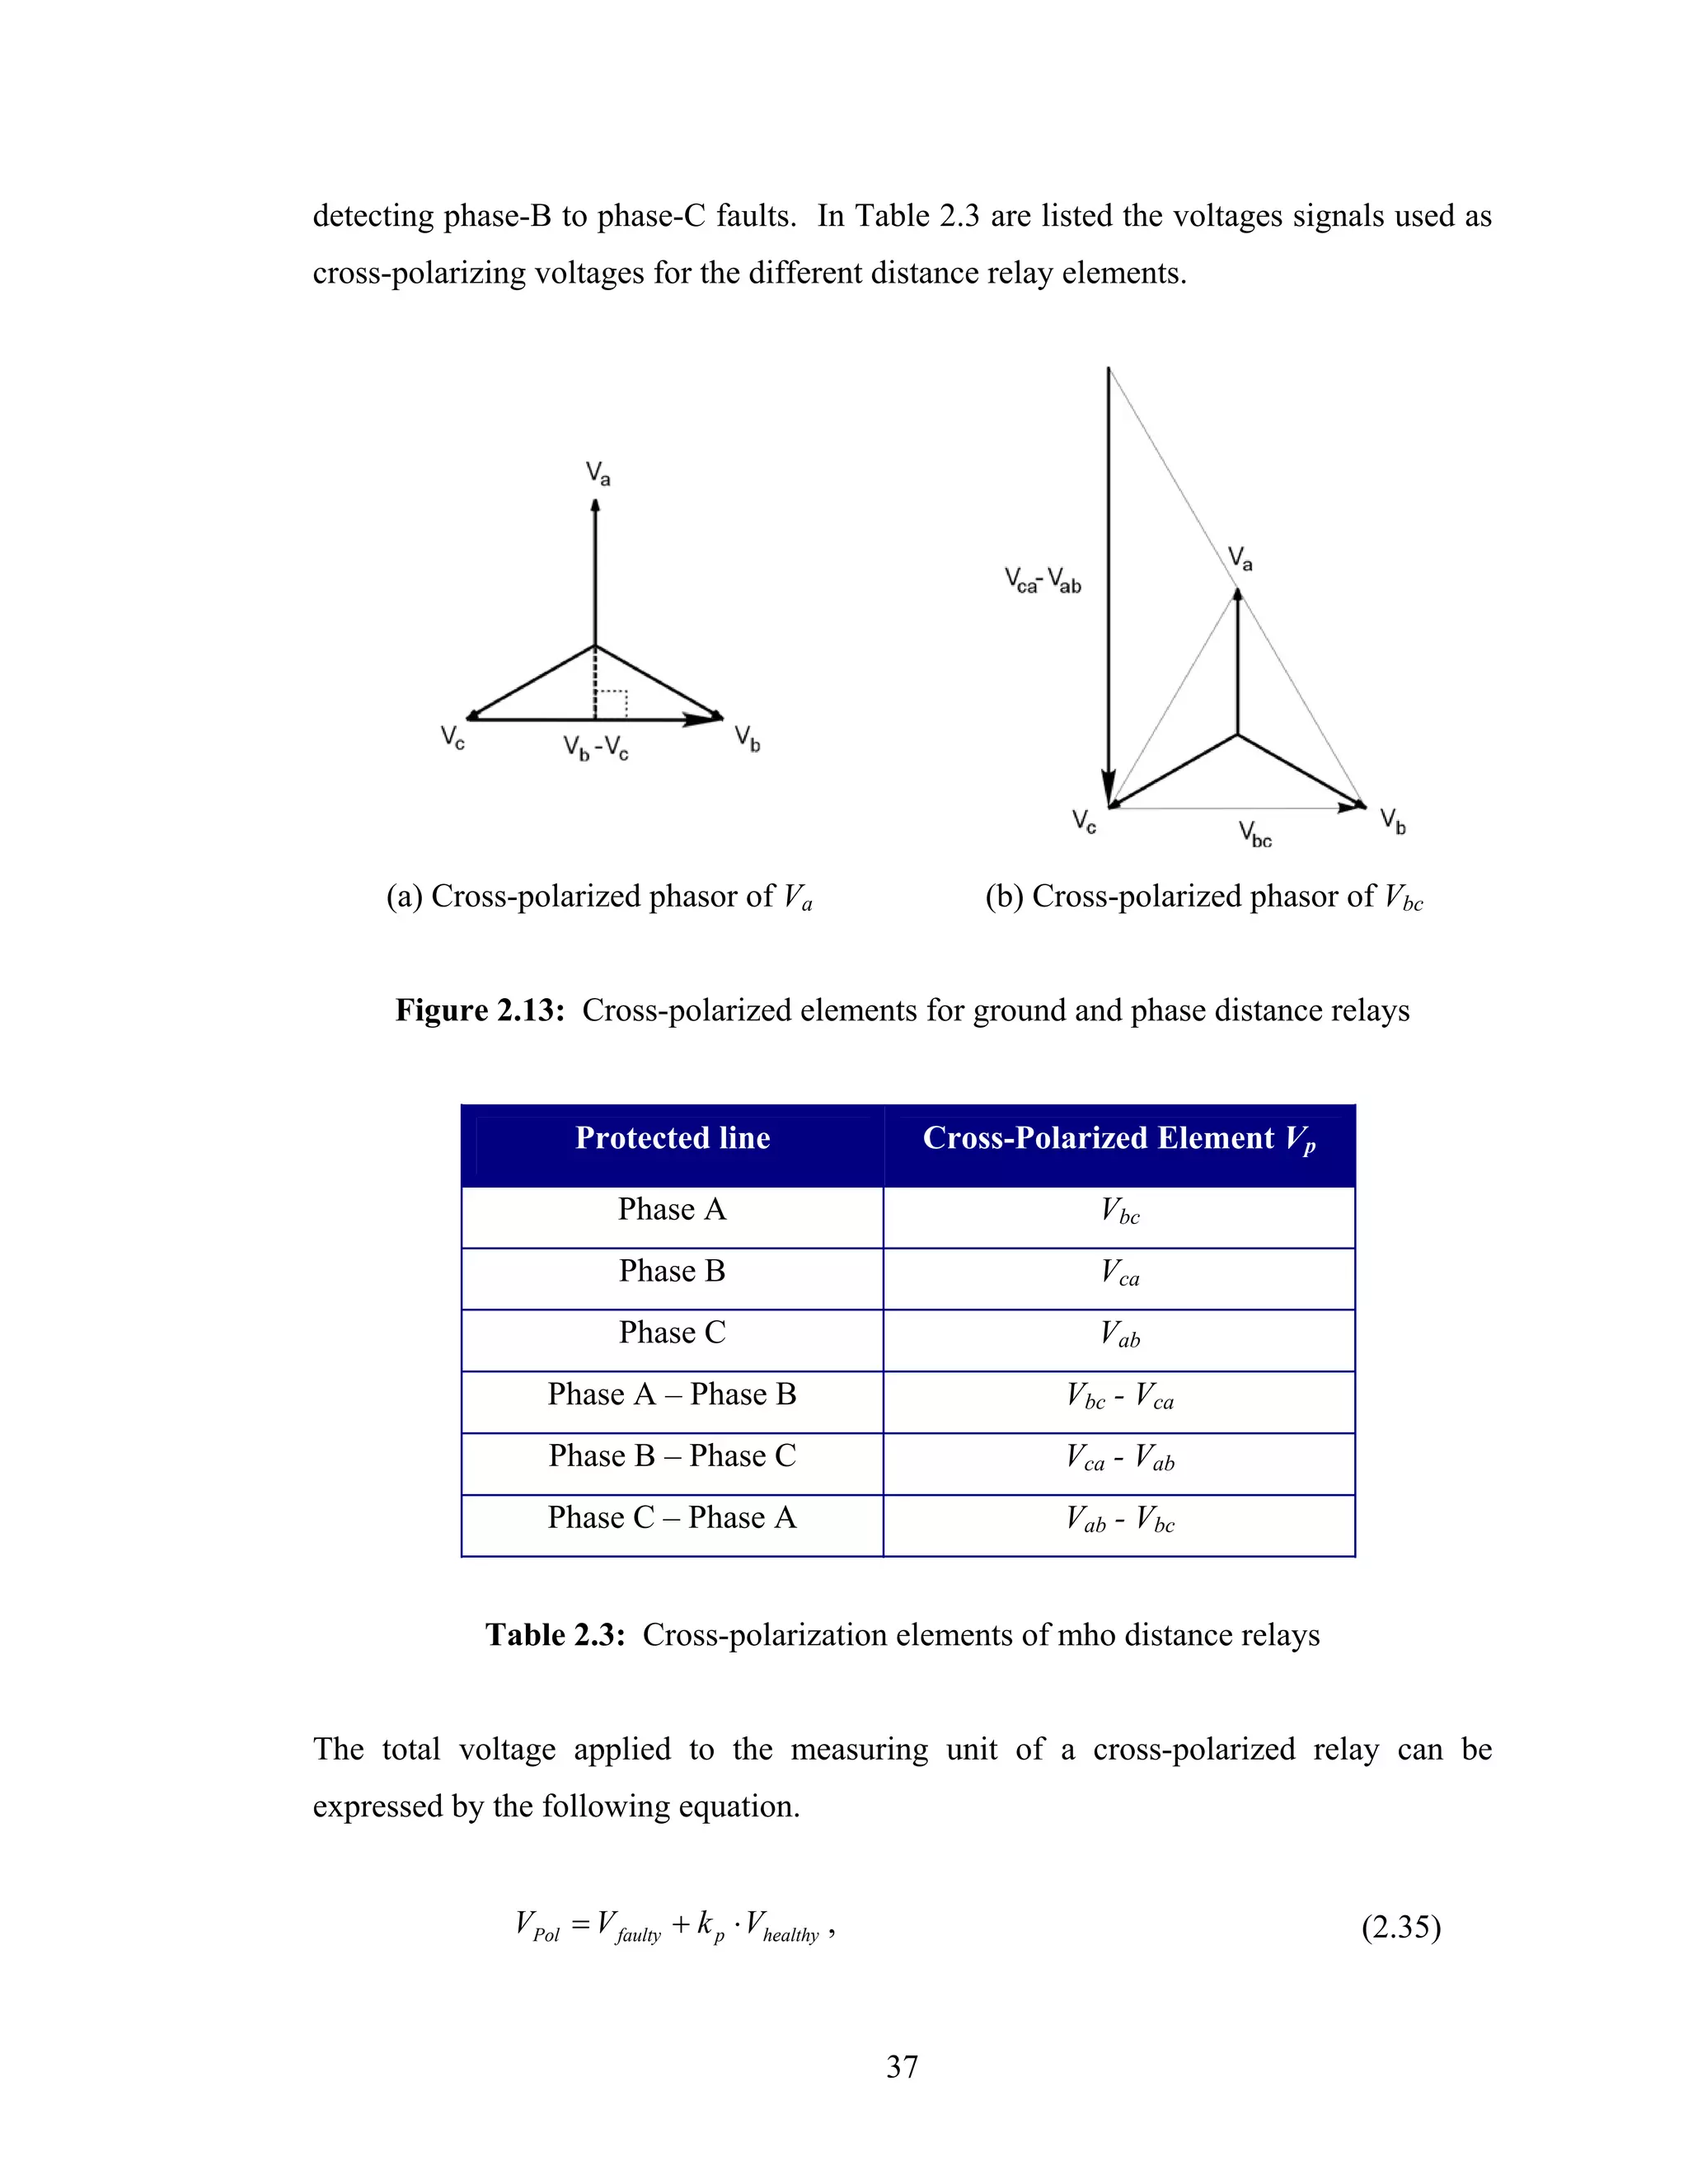
2.3.5.6.1 Cross-polarization
Cross-polarization consists of supplementing the voltage of the faulted phase with a
voltage of the healthy phase that is in quadrature with the voltage of the faulted phase
[40]. In Figure 2.13 are shown the selection of the cross-polarization voltages for a
ground distance relay and a phase distance relay. In Figure 2.13(a), the voltage Vbc is
the cross-polarized voltage used in relays trying to detect phase A to ground faults. In
Figure 2.13(b), the voltage phasor Vca-Vab is the cross-polarized voltage used in relays
36](https://image.slidesharecdn.com/phdthesissandroaquiles060724-121017023005-phpapp01/75/Thesis-for-Power-System-protection-in-Brief-71-2048.jpg)
![where,
Vpol is the polarization voltage
Vfaulty is the input voltage of the mho distance relay
Vhealthy is the cross-polarized voltage applied to the mho distance relay
kp is the multiplication constant in polarized mho distance relay
To bring the cross-polarizing voltage in phase with the voltage of the faulted phase, the
cross-polarizing voltage is rotated by 90° in the positive direction and is divided by a
factor of √3. The healthy voltage and the modified polarizing voltage become equal as
expressed mathematically by the following equation.
π
1 j
Vhealthy = ⋅ e 2 ⋅ Vp (2.36)
3
Vp is the cross-polarized element of polarized mho distance relays
2.3.5.6.2 Voltage memory
In the event of a close-in three-phase fault, no healthy phase voltage is available. To
solve this problem, a phase voltage memory system, which provides a signal of pre-fault
voltage reference during a fault, is employed. Numerical technology has made it
possible to generate a voltage reference for as long as desired, but frequency
compensation to avoid deviation from the system frequency must be implemented. The
following equation defines the polarized voltage when memory polarization is used [40].
VPol = V faulty + k p ⋅ Vmemory (2.37)
A value of 0.1 to 0.2 for kp is sufficient and is generally used.
38](https://image.slidesharecdn.com/phdthesissandroaquiles060724-121017023005-phpapp01/75/Thesis-for-Power-System-protection-in-Brief-73-2048.jpg)
![2.3.6 Zero-sequence current compensation
In Figure 2.14(b) is shown the sequence-networks connection for the phase A-to-ground
fault on a transmission line shown in Figure 2.14(a) [41].
(a) Single phase-to-ground fault (b) Sequence network
Figure 2.14: Sequence-networks connection for a phase A-to-ground fault in a
transmission line
From Figure 2.14(b), the voltage at the relay location Va can be calculated as follows:
Va = V1 + V2 + V0 , (2.38)
where,
V1 is the positive-sequence voltage at the relay location
V2 is the negative-sequence voltage at the relay location
V0 is the zero-sequence voltage at the relay location
The sequence voltages are equal to
39](https://image.slidesharecdn.com/phdthesissandroaquiles060724-121017023005-phpapp01/75/Thesis-for-Power-System-protection-in-Brief-74-2048.jpg)
![⎛ Z − Z L1 ⎞
Va = I a Z L1 + 3I 0 ⎜ L 0
⎜ 3Z ⎟ Z L1
⎟
⎝ L1 ⎠ (2.43)
= I a Z L1 + K 0 3I 0 Z L1
The compensated current Ia(comp) can be defined as
I a ( comp ) = I a + K 0 3I 0 . (2.44)
The ratio of the voltage Va to the compensated current Ia(comp) now yields
Va
= Z L1 . (2.46)
I a ( comp )
Depending on the manner I0 is provided to the relay, the K0 factor may be expressed as
[60]
Z L 0 − Z L1
K0 = . (2.47)
3Z L1
2.3.7 Computation of the apparent impedance
In the case of phase distance relays, phase-to-phase voltages and differences between
line currents are used. For example, a relay designed to detect phase-B to phase-C faults
computes the impedance as expressed in the following equation
Vb − Vc Vbc
Z seen = = . (2.48)
Ib − Ic I bc
In terms of the real and imaginary parts of the phasors, Equation 2.48 can be written in
the following form.
41](https://image.slidesharecdn.com/phdthesissandroaquiles060724-121017023005-phpapp01/75/Thesis-for-Power-System-protection-in-Brief-76-2048.jpg)
![Vbc Re(Vbc ) + j Im(Vbc ) Vr + jVi
Z seen = = = (2.49)
I bc Re( I bc ) + j Im( I bc ) I r + jI i
It can be shown that the impedance seen in this phase distance relay can be expressed as
follows.
⎛ V ⋅ I r + Vi ⋅ I i ⎞ ⎛ V ⋅ I − Vr ⋅ I i ⎞
Z seen = ⎜ r 2 ⎟+ j⎜ i r ⎟. (2.50)
⎜ I +I2 ⎟ ⎜ I 2+I2 ⎟
⎝ r i ⎠ ⎝ r i ⎠
The ground distance relay protecting phase-A computes the apparent impedance using
the following equation.
Va
Z seen = (2.51)
I a + K 0 3I 0
2.4 Differential protection
Differential protection is one of the most reliable and popular techniques in power
system protection. Differential protection compares the currents that enter with the
currents that leave a zone. If the net sum of the currents that enter and the currents that
leave a protection zone is essentially zero, it is concluded that there is no fault in the
protection zone. However, if the net sum is not zero, the differential protection
concludes that a fault exists in the zone and takes steps to isolate the zone from the rest
of the system.
In 1904, British engineers Charles H. Merz and Bernard Price developed the first
approach for differential protection. The advantages of the scheme proposed by Merz
and Price were soon recognized and the technique has been extensively applied since
then [4]. However, it soon became apparent that differential protection operated
42](https://image.slidesharecdn.com/phdthesissandroaquiles060724-121017023005-phpapp01/75/Thesis-for-Power-System-protection-in-Brief-77-2048.jpg)
![incorrectly due to mismatch of current transformers provided at the two ends of the
zone, differences in the relay circuitry and due to inrush currents or excessive currents
caused by system over-voltages at the transformer terminals. Over the years, various
methods have been developed to ensure correct operation of differential relays.
2.4.1 Differential principle
In Figure 2.15 is shown one phase of a three-phase differential protection system.
Multiple circuits may exist, but the example is sufficient to explain the basic principle of
differential protection [2]. It can be observed from Figure 2.15 that the protection zone
is delimited by a couple of current transformers. Due to its very nature, differential
protection does not provide backup protection to other system components. For this
reason, differential protection is categorized as unit protective scheme. The conductors
bringing the current from the current transformers to the differential relay are in some
situations called pilot wires.
Figure 2.15: Differential relay currents during normal operation or external fault
43](https://image.slidesharecdn.com/phdthesissandroaquiles060724-121017023005-phpapp01/75/Thesis-for-Power-System-protection-in-Brief-78-2048.jpg)
![I op = a ( I F 1 + I F 2 ) − I Ae − I Be (2.55)
Figure 2.16: Differential relay currents during internal fault
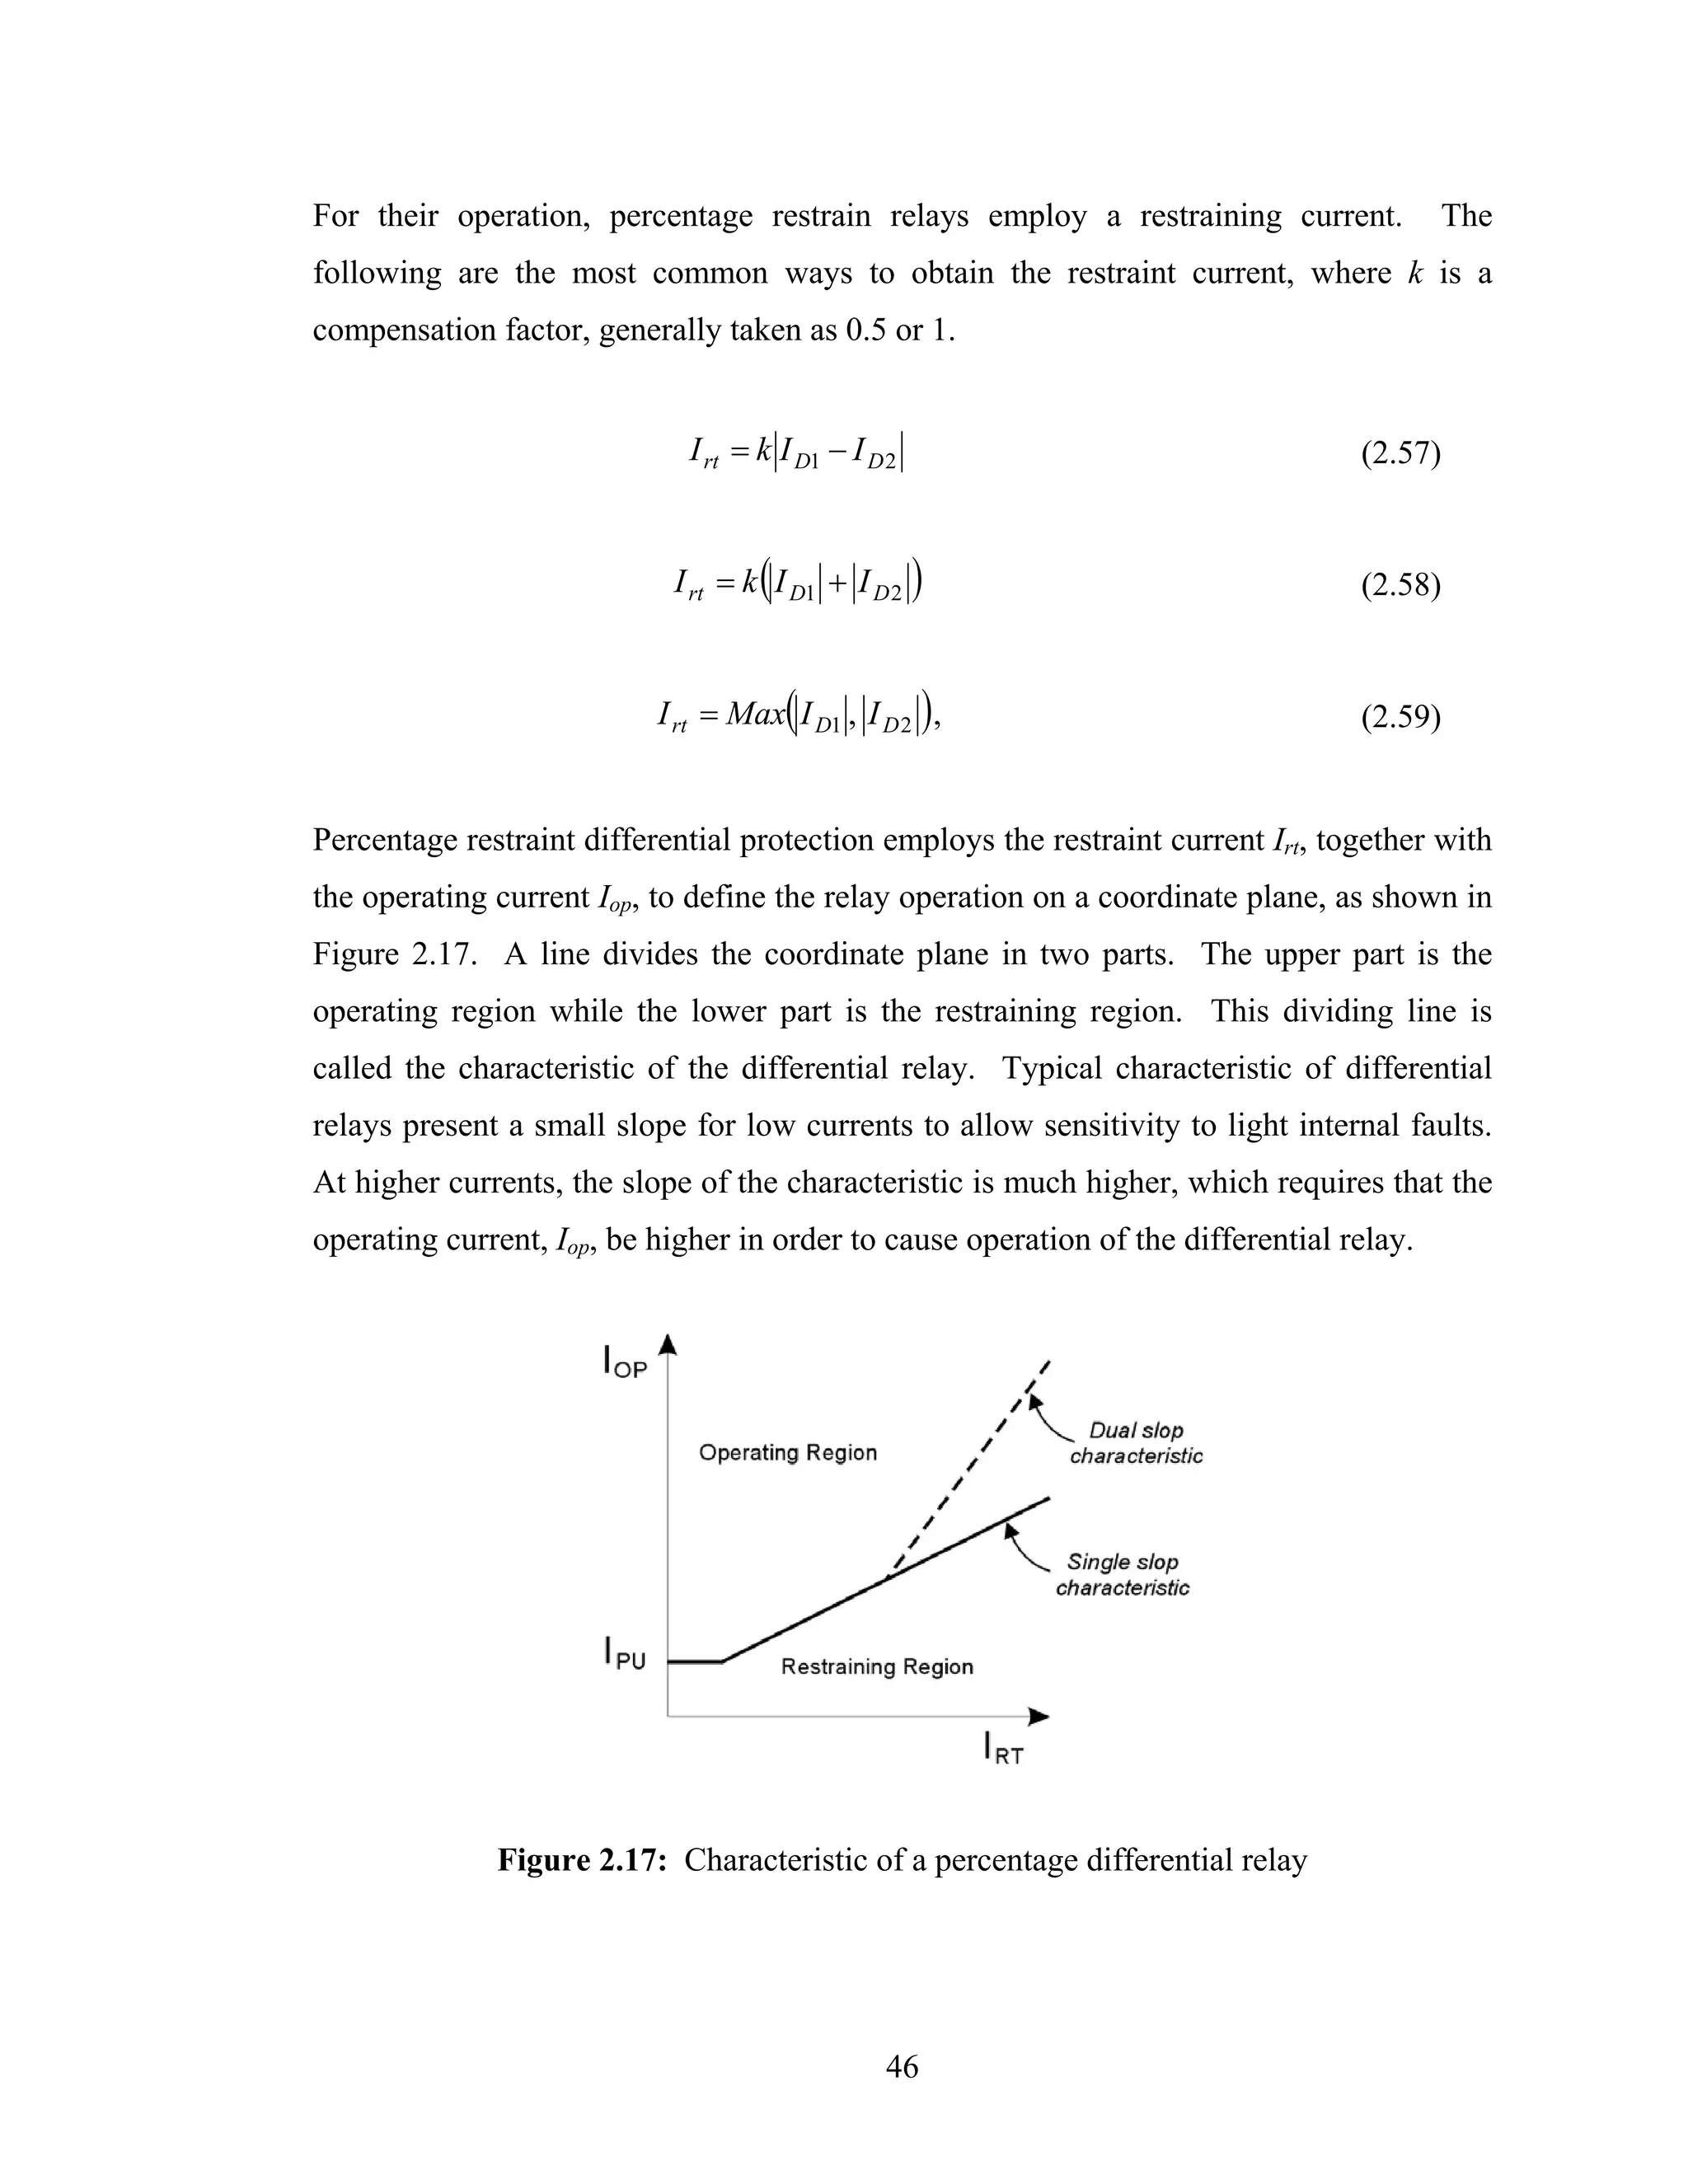
2.4.2 Percentage restraint differential protection
Except for very light internal faults, good discrimination is available to detect faults
inside the differential zone. Percentage differential protection overcomes the problems
related with the identification of light internal faults while keeping the advantages of the
basic differential scheme [1]. In general, the operating current in the differential relay is
equal to
I op = I D1 + I D 2 , (2.56)
where,
I D1 , I D 2 are the currents on the pilot wires of the current transformers
45](https://image.slidesharecdn.com/phdthesissandroaquiles060724-121017023005-phpapp01/75/Thesis-for-Power-System-protection-in-Brief-80-2048.jpg)
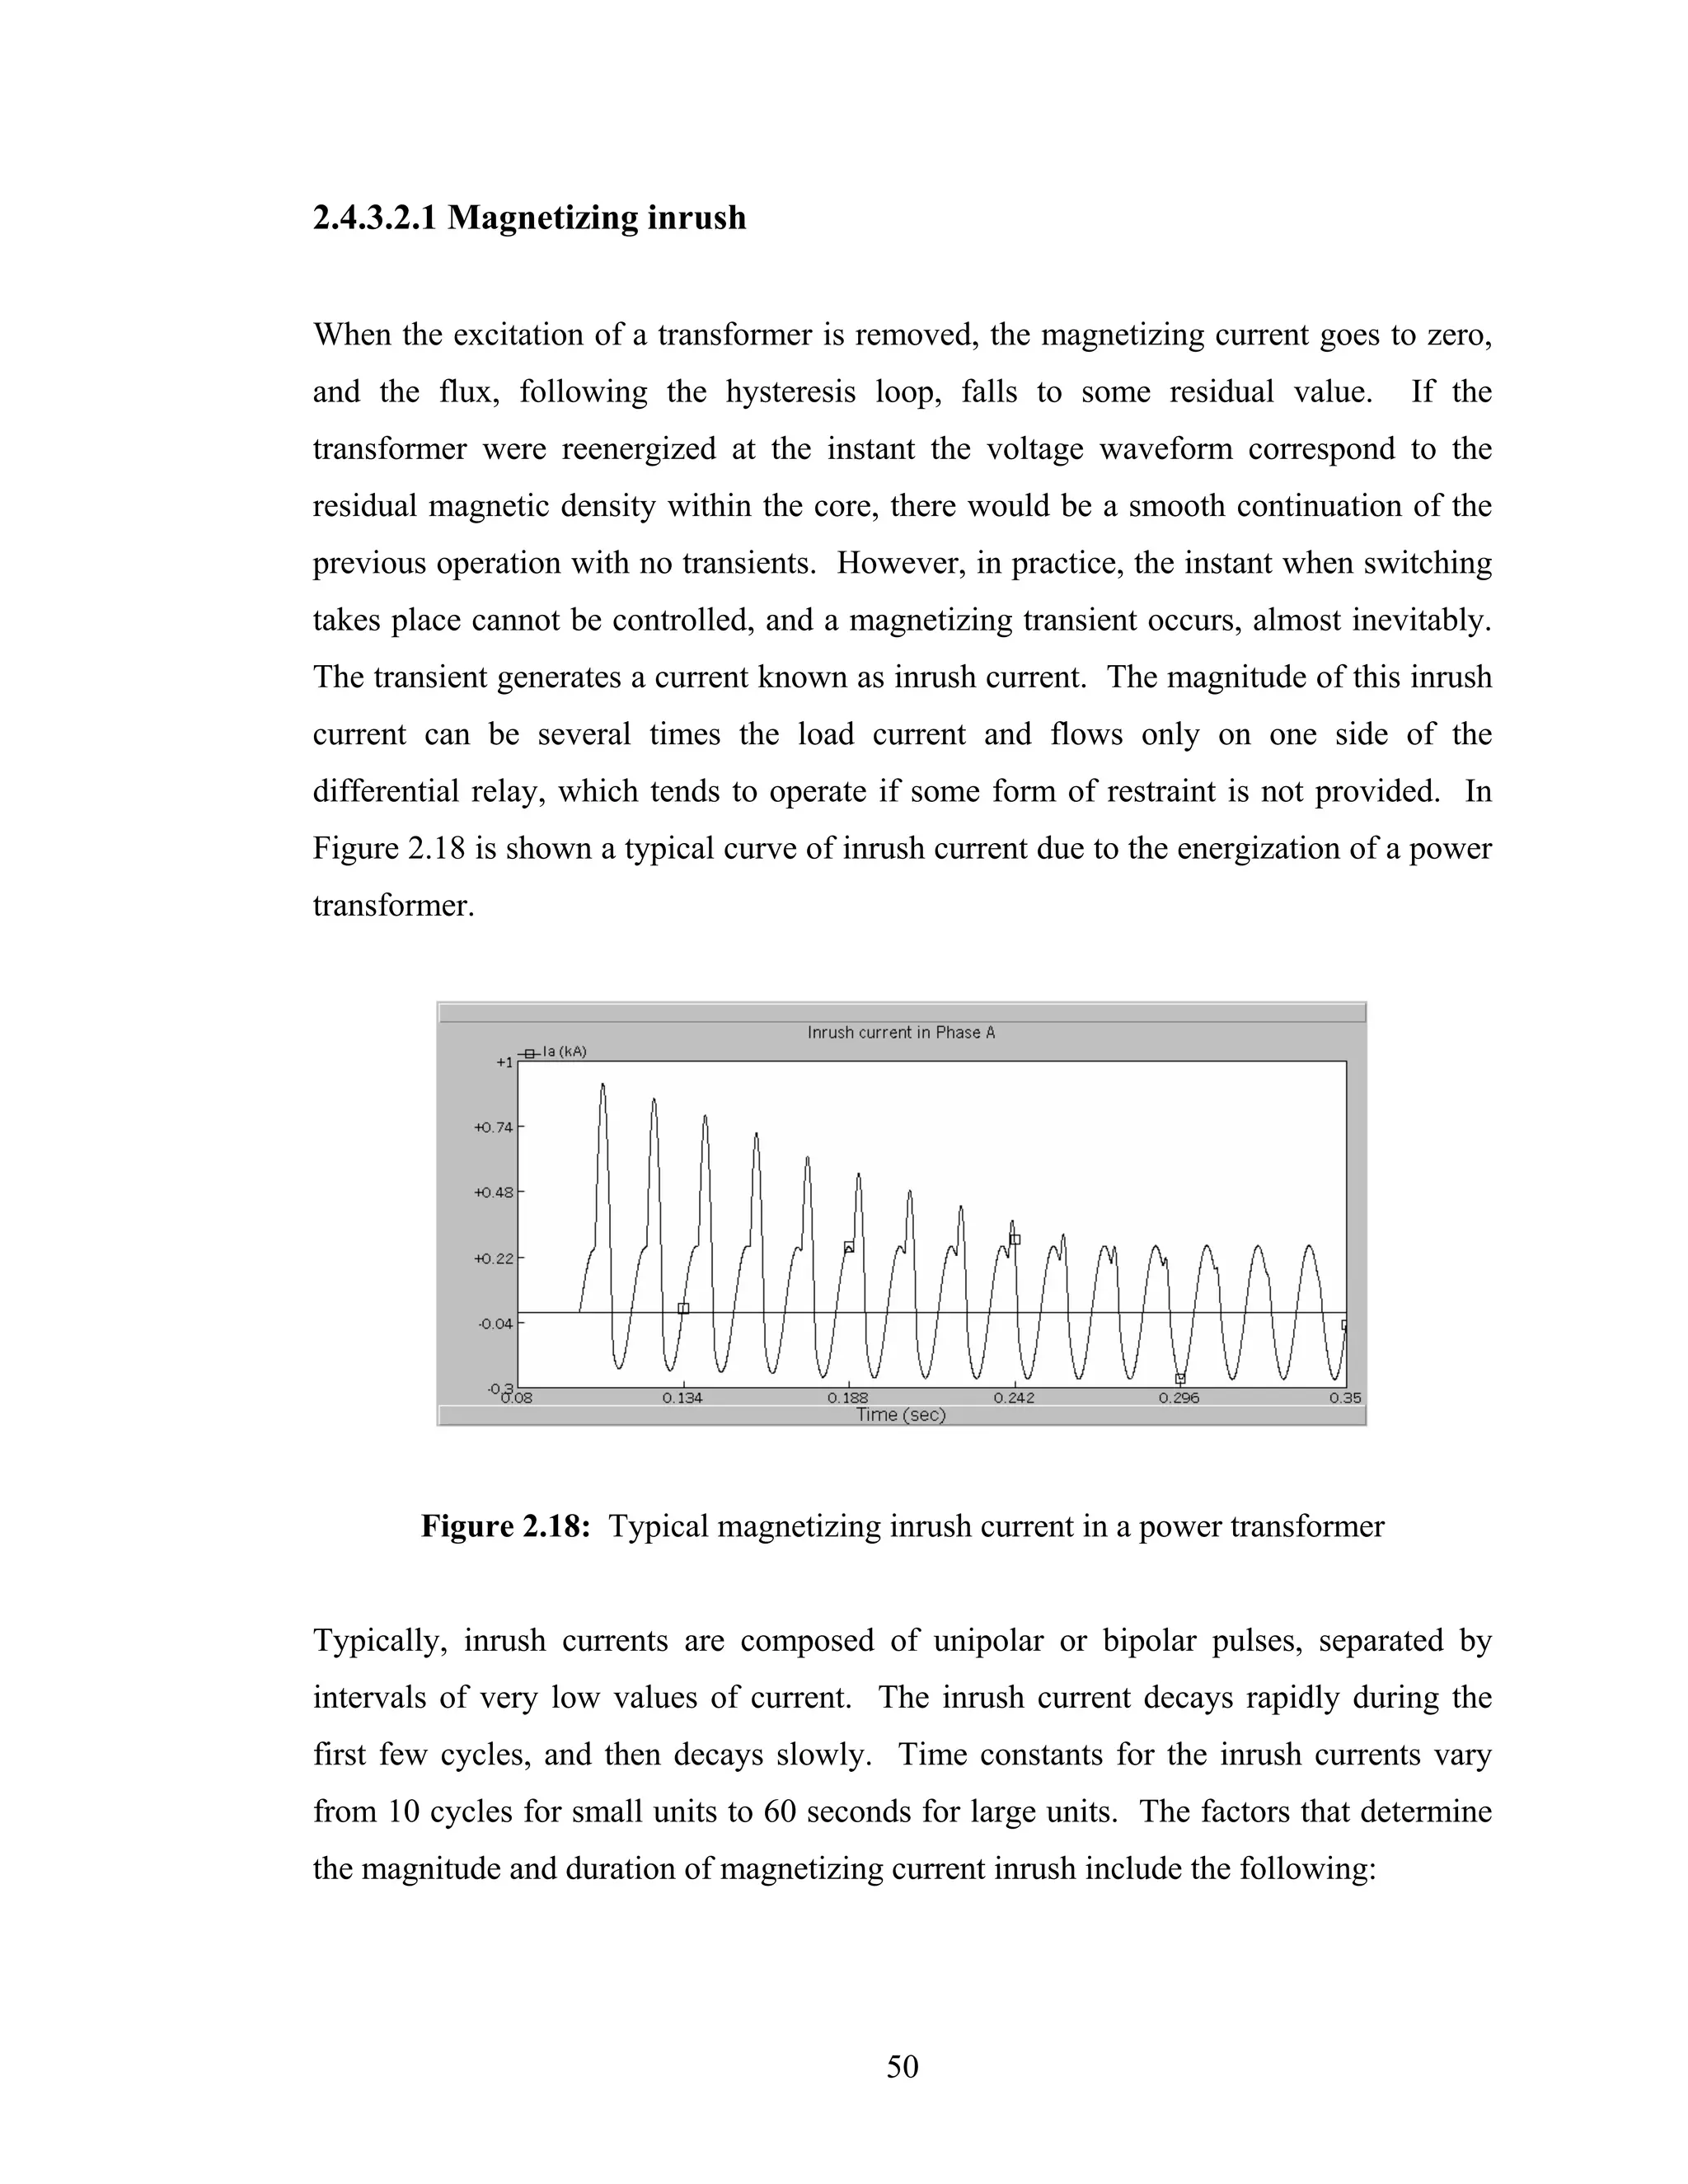
![• Size of transformer
• Size of power system
• Type of magnetic material in the core
• Residual flux in the transformer before switching on
Maximum inrush current occurs if the transformer is energized when voltage wave is
passing through zero. At this instant, the current and flux reach their maximum value in
highly inductive circuit. If there is residual flux in the transformer, the required flux
may be in the same or opposite direction. Accordingly, the magnetizing current will be
less or more. If the magnetizing current is more, it will saturate the core and increase the
magnetizing current component further.
2.4.3.3 Differential protection restraint for magnetizing inrush current
Early transformer differential relay designs used time delay, or a temporary
desensitization of the relay to override the inrush current. This technique increased the
time to operate. Other designs used an additional voltage signal on a substation to
restrain or to block the differential relay operation. However, for a stand-alone
differential relay the additional voltage signal is not always available.
The methods presently used to discriminate inrush currents from internal faults fall in
two groups: those using harmonics to restrain or block relay operation, and those based
on wave shape identification.
2.4.3.3.1 Harmonic-based methods
The magnetizing inrush currents have high component of even and odd harmonics. In
Table 2.4 are shown typical amplitudes of the harmonics, compared with the
fundamental (100%) [1].
51](https://image.slidesharecdn.com/phdthesissandroaquiles060724-121017023005-phpapp01/75/Thesis-for-Power-System-protection-in-Brief-86-2048.jpg)
![Harmonic components
Amplitude
in magnetizing inrush
(% of fundamental)
current
D. C. 55
2nd harmonic 63
3rd harmonic 26.8
4th harmonic 5.1
5th harmonic 4.1
6th harmonic 3.7
7th harmonic 2.4
Table 2.4: Percentage of harmonics in typical magnetizing inrush current
Given that harmonic content of the short circuit currents is negligible, the harmonic-
based methods are used for either restraining or blocking the relay from operation during
initial current inrush. Harmonic-based methods allow the differential relay to remain
sensitive to fault currents while keeping the relay from operating due to magnetizing
currents.
Harmonic restrain techniques: The original harmonic-restrained differential relay used
all harmonics to provide the restrain function [7], [8], [9]. The resulting high level of
harmonics restraint provided security for inrush conditions at the expense of operating
speed for internal faults with CT saturation. As a result, the harmonic-restrained
differential relay compares the fundamental component of the operating current with a
restraint signal consisting of the unfiltered restraint current plus the harmonics of the
operating current. The differential relay operation condition can be expressed as
I op > SLPi ⋅ I rt + k 2 I 2 h + k 3 I 3h + ... , (2.61)
where,
52](https://image.slidesharecdn.com/phdthesissandroaquiles060724-121017023005-phpapp01/75/Thesis-for-Power-System-protection-in-Brief-87-2048.jpg)
![Iop is the fundamental component of the operating current
I2h, I3h, … are higher harmonics of the operating current
Irt is the unfiltered restrain current
k1, k2, … are constant coefficients
A more recent set of techniques use only the second harmonic to identify inrush currents
and the fifth harmonic to avoid misoperations for transformer due to over-excitation [10,
11]. The basic operating equation for one phase can be expressed as follows.
I op > SLPi ⋅ I rt + k 2 I 2 h + k 5 I 5 h (2.62)
Common harmonic restrain for three-phase transformer differential protection is a
technique where the harmonic restrain quantity is proportional to the sum of the second
and fifth-harmonic components of the three relay elements. The relay operation is of the
following form:
3
I op > SLPi ⋅ I rt + ∑ (k 2 I 2 hn + k5 I 5 hn ) (2.63)
n =1
Harmonic blocking techniques: Typically, numerical transformer differential relays
use second- and fifth-harmonic blocking logic [10]. A tripping signal requires that
Equation 2.60 and the following conditions are satisfied
I op < k 2 I 2 h (2.64)
I op < k 5 I 5 h (2.65)
In Figure 2.19 are shown the logic diagrams of harmonic restraint and harmonic
blocking differential elements.
53](https://image.slidesharecdn.com/phdthesissandroaquiles060724-121017023005-phpapp01/75/Thesis-for-Power-System-protection-in-Brief-88-2048.jpg)
![(a) Harmonic restraint
(b) Harmonic blocking
Figure 2.19: Logic diagrams of differential elements employing harmonic-based
methods
In Figure 2.20 are shown the three-phase version of the logic diagrams of independent
harmonic blocking differential element and independent harmonic restrain. The relay is
composed of three differential elements of the types shown in Figure 2.19. In both
cases, a tripping signal results when any one of the relay elements asserts.
2.4.3.3.2 Wave shape recognition methods
Other methods for discriminating internal faults from inrush conditions are based on
direct recognition of the shape of the differential current [1]. Wave shape recognition
methods are divided between those methods that are based on the identification of the
separation of different current peaks [12], [13], [14], [15], [16] and those methods that
use DC offset or asymmetry in the differential current [17], [18], [19], [20].
54](https://image.slidesharecdn.com/phdthesissandroaquiles060724-121017023005-phpapp01/75/Thesis-for-Power-System-protection-in-Brief-89-2048.jpg)
![(a) Independent harmonic restraint
(b) Independent harmonic blocking
Figure 2.20: Logic diagrams of three-phase differential elements employing harmonic-
based methods
A well-known principle [14], [15] recognizes the length of the time intervals during
which the differential current is near zero. In Figure 2.21 is depicted the basic concept
behind this low current differential method.
(a) Inrush current (b) Internal fault current
Figure 2.21: Differential relay blocking based on recognition of low-currents intervals
55](https://image.slidesharecdn.com/phdthesissandroaquiles060724-121017023005-phpapp01/75/Thesis-for-Power-System-protection-in-Brief-90-2048.jpg)
![The differential current is compared with equal positive and negative thresholds to
determine the duration of the intervals during which the absolute value of the current is
less than the absolute value of the threshold. The time intervals are then compared with
a value equal to one-quarter cycle. If the low current intervals of currents tA are greater
than one-quarter cycle as shown in Figure 2.21(a) the relay is blocked. On the other
hand, if the low current intervals tB are less than one-quarter cycle, shown in Figure
B
2.21(b), the relay operates.
Some techniques belonging to the second group of wave shape recognition methods
compare the amplitudes of the positive and negative semi-cycles of the differential
current with given thresholds [13], [18]. Another alternative [19] used difference of the
absolute values of the positive and negative semi-cycles of the differential current for
restrain. More recently, another technique [20] proposed making separate percentage-
differential comparison on both semi-cycles of the differential current.
2.5 Summary
The description and operating principles of distance and differential protection have
been described in this chapter. Key aspects of distance relay protection, such as
protection zones, comparators and operating characteristic, have been discussed.
Methods of calculating the apparent impedance and zero-sequence compensation have
been reviewed. The differential protection principle and the percentage restraint
differential protection have been introduced. The differential protection of power
transformers, together with the problems and issues of their application, has also been
presented.
56](https://image.slidesharecdn.com/phdthesissandroaquiles060724-121017023005-phpapp01/75/Thesis-for-Power-System-protection-in-Brief-91-2048.jpg)
![3. DIGITAL AND NUMERICAL RELAYS
3.1 Introduction
Previous chapters presented basic concepts of protection and principles of operation of
distance and differential relays. Modern digital and numerical relays are widely
employed in protection systems nowadays. Designing and modeling of numerical relay
require establishing a generalized numerical relay structure, which is composed by the
more relevant and common internal modules employed by typical numerical relays. The
present chapter discusses the functionality of each of the internal modules of the
generalized numerical relay, namely signal conditioning and scaling module, analog
anti-aliasing filtering module, analog-to-digital conversion module, phasor estimation
algorithm and relay logic. The most common techniques and methods employed in each
of these internal modules are enumerated and reviewed.
3.2 Relay performance and relay technology
The following characteristics are related with a good performance of a relay in a power
system [2], [3].
Reliability: The reliability of a relay is directly in correspondence with the concepts of
dependability and security. A relay is said to be dependable when it operates in the
occurrence of a fault relevant to its protection zone. Security is reached either when the
relay will not operate for a fault outside its operating zone, or when the system is in a
healthy state.
57](https://image.slidesharecdn.com/phdthesissandroaquiles060724-121017023005-phpapp01/75/Thesis-for-Power-System-protection-in-Brief-92-2048.jpg)
![Selectivity: Selectivity is the ability that a relay has to only open those breakers that
isolate the faulted element. Selectivity discrimination can be achieved by time grading
or by unit protection. Selectivity by time grading means that different zones of
operation are graded by time and that in the occurrence of a fault, although a number of
protections equipment respond, only those relevant to the faulty zone complete the
tripping function. Selectivity by unit protection means that the relay will only operate
under certain fault conditions occurring within a clearly defined zone.
Speed: In the occurrence of a fault, the greater the time in which the fault is affecting
the power system, the greater is the risk that the power system falls into an unstable
operation point. Relays are therefore required to clear the fault as quickly as possible.
Sensitivity: The relay is said to be sensitive if the relay operates to the minimum value
of faulted input signals.
3.2.1 Relay technology
The relay application for protection of power system date back nearly 100 years ago.
Since then, the technology employed to construct relays have improved dramatically
relay size, weight, cost and functionality. Based on the technology employed for their
construction, relays can be chronologically classified as electromechanical, static or
solid-state, digital and numerical [3].
Electromechanical relays: The first relays employed in the electric industry were
electromechanical devices. These relays worked based on creating a mechanical force to
operate the relay contacts in response to a fault situation. The mechanical force was
established by the flow of a current that reflected the fault current through windings
mounted in magnetic cores. Due to the nature of its principle of operation,
electromechanical relays are relatively heavier and bulkier than relays constructed with
58](https://image.slidesharecdn.com/phdthesissandroaquiles060724-121017023005-phpapp01/75/Thesis-for-Power-System-protection-in-Brief-93-2048.jpg)

![3.3 Digital and numerical relay models
Modeling and simulation of electric power systems has been a common practice for
more than thirty years. Computer models of major power system components have been
used in software packages such as short circuit programs, load flow, stability programs,
and electromagnetic transient programs. Relay system modeling has been performed in
a lesser degree.
A successful relay model must produce the same output for the same inputs than its real
counterpart, even when there would not be a direct correspondence to the actual
microprocessor machine language coding within the relay.
Utility engineers and consultants use relay models to select the relay types suited for a
particular application, and to analyze the performance of relays that appear to either
operate incorrectly or fail to operate on the occurrence of a fault. Instead of using actual
prototypes, manufacturers use relay model designing to expedite and economize the
process of developing new relays. Electric power utilities use computer-based relay
models to confirm how the relay would perform during systems disturbances and normal
operating conditions and to make the necessary corrective adjustment on the relay
settings. The software models could be used for training young and inexperienced
engineers and technicians. Researchers use relay model designing to investigate and
improve protection design and algorithms. However, choosing appropriate settings for
the steady state operation of overcurrent relays and distance relays is presently the most
familiar use of relay models [25].
The purpose for which a relay model is to be used determines the amount of detail
required in the representation of the actual relay. Based on this, digital and numerical
relay models can be divided into two categories. The models of the first category
consider only the fundamental frequency components of voltages and currents. Phasor-
based models were the first to be widely used to design and apply relays. The models of
the second category take into consideration the high frequency and decaying DC
60](https://image.slidesharecdn.com/phdthesissandroaquiles060724-121017023005-phpapp01/75/Thesis-for-Power-System-protection-in-Brief-95-2048.jpg)
![components of voltages and currents in addition to the fundamental frequency
components [25]. These models are called transient models of relays.
3.3.1 Phasor relay models
The primary limitation of phasor models is their inability to handle and account for some
components of the inputs, such as the DC offset, nonlinearities of current transformers
and voltage transformers, and protective relay memory circuits losing stored voltage or
current data.
In spite of their limitations, phasor models provide the ability to observe, usually by
graphical plots, the margin between the boundary of operation and the parameters that
are calculated by the relay. This ability, which is common to all relay models, is very
helpful in developing reliable protection applications and settings. Phasor-based models
can be used, among others, for the following purposes.
• Modeling of time-graded overcurrent characteristics
• Setting and adjustment of instantaneous relays
• Modeling of the characteristic of a directional overcurrent relay on the complex
plane
• Modeling of the characteristic of a power relay plotted in the P-Q plane
• Modeling of the characteristic of a percentage restrained differential relay plotted
in the differential-restrain current plane
3.3.2 Transient relay models
Transient relay models mimic the behavior of digital and numerical relays including
their performance in the transient state and the impact of the transient components in the
61](https://image.slidesharecdn.com/phdthesissandroaquiles060724-121017023005-phpapp01/75/Thesis-for-Power-System-protection-in-Brief-96-2048.jpg)
![Manufacturers are in position to design accurate transient models, particularly for new
digital relays, for the reason that, in the designing process, the software model may
precede the hardware design. Where algorithms and hardware are known in detail very
precise performance can be achieved in the modeling.
3.4 Generalized numerical relay structure
McLaren was the first to propose the concept of Open System Relaying, where different
relay functions can be obtained from the same hardware just by modifying
microprocessor programming [3]. Modern relay technology has shown recently a
tendency towards this direction.
The generalized numerical relay concept, which is directly derived from open system
relaying, consists of a minimum set of hardware modules and functions of modern
digital and numerical relays. With the generalized numerical relay and with the amount
of information commonly available, it is possible to recreate the majority of modern
digital and numerical relay equipment. The following hardware modules and functions
constitute the generalized numerical relay.
• Isolation and analog signal scaling: Current and voltage waveforms from
instrument transformers are acquired and scaled down to convenient voltage
levels for use in the digital and numerical relays.
• Analog anti-aliasing filtering: Low-pass filters are used to avoid the
phenomena of aliasing in which the high frequency components of the inputs
appear to be parts of the fundamental frequency components.
• Analog-to-digital conversion: Because digital processors can process
numerical or logical data only, the waveforms of inputs must be sampled at
discrete times. To achieve this, each analog signal is passed through a sample-
63](https://image.slidesharecdn.com/phdthesissandroaquiles060724-121017023005-phpapp01/75/Thesis-for-Power-System-protection-in-Brief-98-2048.jpg)
![and-hold module, and conveyed, one at a time, to an Analog-to-Digital Converter
(ADC) by a multiplexer.
• Phasor estimation algorithm: A software algorithm implemented in a
microprocessor estimates the amplitude and phase of the waveforms provided to
the relay.
• Relay algorithm and trip logic: The equations and parameters specific to the
protection algorithm and the associated trip logic are implemented in the
software of the microprocessor used in the relay. The microprocessor calculates
the phasors representing the inputs, acquires the status of the switches, performs
protective relay calculations, and finally provides outputs for controlling the
circuit breakers. The processor may also support communications, self-testing,
target display, time clocks, and other tasks [25].
In Figure 3.1 is shown the schematic of a generalized numerical relay structure. The
functionalities of each module of the generalized relay model are developed in next
sections.
Figure 3.1: Generalized numerical relay structure
3.4.1 Isolation and analog signal scaling module
The isolation and analog signal scaling module acquires the voltage and current signals
from the transducers of the power system. This module provides electrical isolation
64](https://image.slidesharecdn.com/phdthesissandroaquiles060724-121017023005-phpapp01/75/Thesis-for-Power-System-protection-in-Brief-99-2048.jpg)
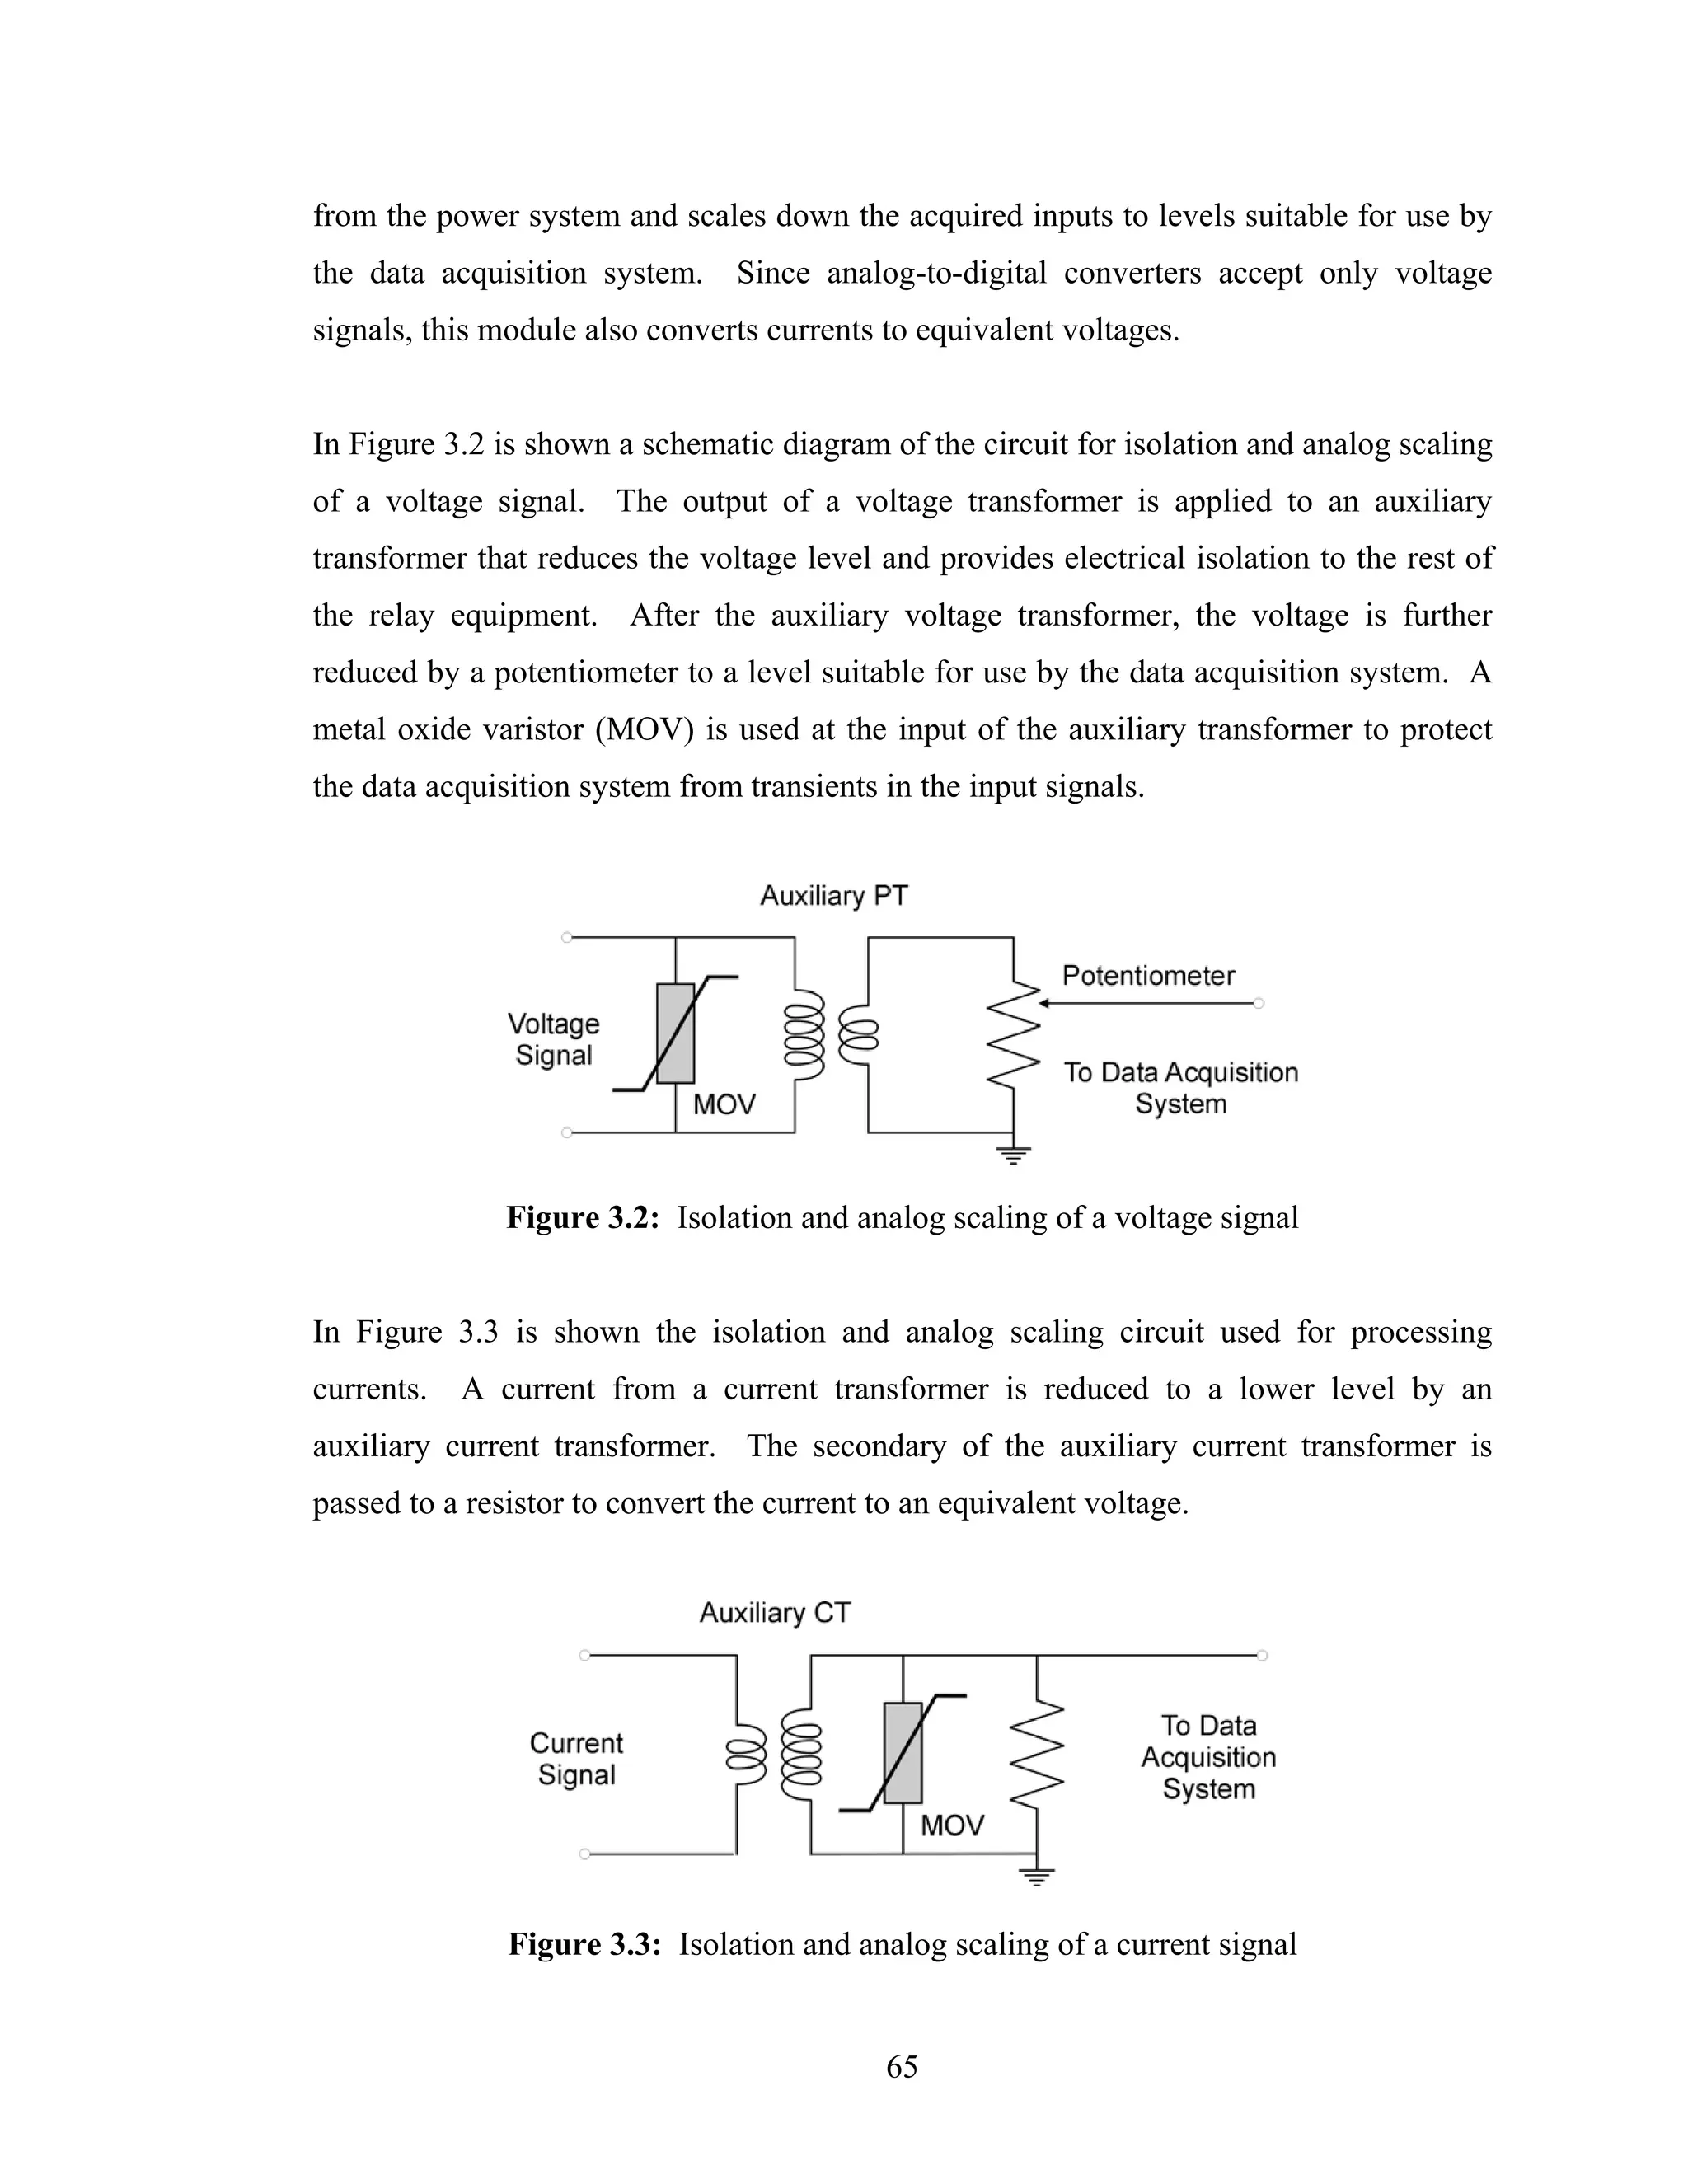
![3.4.2 Anti-aliasing filter module
The analog inputs must be applied to low-pass filters and their outputs should be
sampled and quantized. The use of low-pass filter is necessary to limit the effects of
noise and unwanted components of frequencies over the folding frequency (half of the
sampling frequency).
The nature of the relaying task dictates the total amount of filtering required. Distance
protection based on impedance measurements uses information contained in the
sinusoidal steady state components of 60 Hz. Therefore, filtering must preserve the
steady state components and reject other components. Common analog low-pass filters
used in these relays are of third to fifth order with cutoff frequency of about 90 Hz. The
cutoff frequency of 90 Hz implies that a sampling rate of at least three samples per cycle
(180 Hz) must be used in order that that the information needed to perform the distance
relay functions is retained and errors due to aliasing are avoided. In practice, the
sampling rate must be at least four samples per cycle (240 Hz).
In a transformer differential relay, inrush currents may be detected by checking the
levels of second and fifth harmonics in the differential current. A cutoff frequency of
360 Hz is a practical choice. To guarantee proper observation of the fundamental,
second and fifth harmonics, and to avoid aliasing, a sampling rate of at least 720 Hz (12
samples per second) is required [33].
3.4.2.1 Practical filters specifications
An ideal filter has a pass band with unity gain and a stop band of zero gain. The
transition from the pass band to the stop band is abrupt. However, in practical filters the
transition from pass band to stop band is gradual, and takes place over a finite band of
frequencies [35]. Moreover, for realizable filters, the gain cannot be zero over a finite
band (Paley-Wiener conditions). As a result, there cannot be a true stop band for
66](https://image.slidesharecdn.com/phdthesissandroaquiles060724-121017023005-phpapp01/75/Thesis-for-Power-System-protection-in-Brief-101-2048.jpg)
![practical filters. Therefore, stop band is better defined as a band over which the gain is
less than a specified level. Similarly, pass band is also a band over which the gain is
between 1 and a specified level.
3.4.2.2 Low-pass filter specifications
Low-pass filters are designed to pass frequencies, from zero to a frequency ωp with an
approximately unity gain [34]. The frequency range [0, ωp] is called the pass band of
the filter. High frequencies, from a frequency ωs and up, are attenuated. The frequency
range [ωs, ∞] is called the stop band of the filter. The frequency range [ωp, ωs], between
the pass and the stop band, is called the transition band.
A graphical description of the specifications of a low-pass filter is provided in Figure
3.4. The hatched areas in the pass band and in the stop band indicate forbidden
magnitude values in these bands. In the transition band there are no forbidden values,
but it is usually required that the magnitude decrease monotonically in this band.
Figure 3.4: Specifications of a low-pass filter
The parameter δp is the tolerance of the magnitude response in the pass band. The
desired (nominal) magnitude response in the pass band is 1. The parameter δs is the
tolerance of the magnitude response in the stop band. The nominal magnitude response
67](https://image.slidesharecdn.com/phdthesissandroaquiles060724-121017023005-phpapp01/75/Thesis-for-Power-System-protection-in-Brief-102-2048.jpg)
![in the stop band is zero. The –3 dB frequency is called the cutoff frequency, and it is
defined as the frequency at which the magnitude response of the filter is 1/√2 of its
nominal value in the pass band. In Procedures for designing a family of IIR filters,
which includes Butterworth, Chebyshev, and Elliptic filters, is presented.
3.4.2.3 Butterworth filters
The amplitude response |H(ω)| of an Nth order Butterworth low pass filter is given by
[35]
1
H (ω ) = , (3.1)
1 + (ω ω 0 )
2N
where,
N is the order of the filter
ω0 is the cutoff frequency
The procedure for designing Butterworth filters starts calculating the order of the filter
(N) using the following expression.
N≥
( )
log 10 −Gs 10 − 1 − log 10 ( − G p 10
),
−1
2 log(ω s ω p )
(3.2)
where,
Gp is the pass band gain in dB
Gs is the stop band gain in dB
[0, ωp] is the pass band frequency in radians
[ωs, +∞] is the stop band frequency in radians
68](https://image.slidesharecdn.com/phdthesissandroaquiles060724-121017023005-phpapp01/75/Thesis-for-Power-System-protection-in-Brief-103-2048.jpg)
![1446625279 .519
H ( s) = .
s + 2261.9449 s + 2558197.25 76 s + 1446625279 .519
3 2
Figure 3.5: Frequency response of a Butterworth filter
3.4.2.4 Chebyshev filters
Chebyshev has noted that cos (Nα) is a polynomial of degree N in cos α. Even more,
cosh (Nα) is the same polynomial of degree N in cosh α. Correspondingly, Chebyshev
polynomial of degree N is defined as [34]:
⎧ cos( N cos -1 x), x ≤ 1,
TN ( x ) = ⎨ (3.8)
-1
⎩cosh( N cosh x), x > 1,
Chebyshev polynomials can be constructed by the following recursive formula:
TN ( x) = 2 xTN −1 ( x) − TN − 2 ( x), T0 ( x) = 1, T1 ( x) = x (3.9)
The main properties of Chebyshev polynomials are:
70](https://image.slidesharecdn.com/phdthesissandroaquiles060724-121017023005-phpapp01/75/Thesis-for-Power-System-protection-in-Brief-105-2048.jpg)
![• For |x|≤1, |TN(x)|≤1, and it oscillates between +1 and –1 proportional to N.
• For |x|>1, |TN(x)|>1, and it is monotonically increasing in |x|.
• Chebyshev polynomials of odd orders are odd functions of x, and Chebyshev
polynomials of even orders are even functions of x.
These properties are used for the construction of filters that are equiripple in either the
pass band or stop band. The equiripple property provides sharp transition between the
pass band and the stop band. As a result, the order of a Chebyshev filter needed to
achieve given specifications is usually smaller than that of a Butterworth filter.
There are two kinds of Chebyshev filters: The first is equiripple in the pass band and
monotonically decreasing in the stop band; it is known commonly as Chebyshev I. The
second filter is monotonically decreasing in the pass band and equiripple in the stop
band; it is known as Chebyshev II or Inverse Chebyshev.
3.4.2.4.1 Chebyshev I filters
Chebyshev I filter is defined by the square magnitude frequency response [34]:
2 1
H (ω ) = , (3.10)
1 + ε TN (ω ω 0 )
2 2
where,
N is the order of the filter
ε = 1 − δ p ) −2 − 1
δp is the ripple band
ω0 is the cutoff frequency
71](https://image.slidesharecdn.com/phdthesissandroaquiles060724-121017023005-phpapp01/75/Thesis-for-Power-System-protection-in-Brief-106-2048.jpg)
![The properties of Chebyshev I filters are:
• For 0 ≤ ω ≤ ω0, the properties of Chebyshev functions are as follows.
1 2
≤ H (ω ) ≤ 1 (3.11)
1+ ε 2
• It can be shown that
⎧ 1
⎪
H (0) = ⎨ 1 + ε 2 , N even (3.12)
⎪ 1,
⎩ N odd
• For ω > ω0, the response is monotonically decreasing, because of the monotonic
behavior of TN(x) for |x|>1. Furthermore, since TN(x) is an Nth-order polynomial,
the asymptotic attenuation of the filter is 20 dB per decade.
• The poles of the Nth-order low pass filter of Chebyshev I type are given by
⎛1 1 ⎞ ⎡ (2k + 1)π ⎤
s k = −ω 0 sinh ⎜ sinh −1 ⎟ sin ⎢
⎝N ε ⎠ ⎣ 2N ⎥ ⎦
(3.13)
⎛1 1 ⎞ ⎡ (2k + 1)π ⎤
+ jω 0 cosh ⎜ sinh −1 ⎟ cos ⎢
⎝N ε ⎠ ⎣ 2N ⎥ ⎦
For 0 ≤ k ≤N-1
• The poles are located on an ellipse whose principal horizontal radius is sinh[N-1
(sinh-1 ε-1)], and its principal vertical radius is cosh[(N-1 sinh-1 ε-1)].
• A low pass Chebyshev I filter has no zeros.
• The transfer function of a Chebyshev I filter is given by
72](https://image.slidesharecdn.com/phdthesissandroaquiles060724-121017023005-phpapp01/75/Thesis-for-Power-System-protection-in-Brief-107-2048.jpg)
![N −1
− sk
H ( s) = H (0)∏ (3.14)
k = 0 s − sk
In Figure 3.6 is shown the frequency response of a 3rd order, 180 Hz cutoff frequency
Chebyshev I filter whose transfer function is
1005963718 .4905
H ( s) = .
s + 1647.9864 s + 1899804.62 59 s + 1005963718 .4905
3 2
Figure 3.6: Frequency response of a Chebyshev I filter
3.4.2.4.2 Chebyshev II filters
Chebyshev II filter is defined by the frequency response defined by the following
equation [34].
2 1
H (ω ) = 1 −
1 + ε TN (ω ω 0 )
2
2
(3.15)
ε 2TN2 (ω ω 0 )
=
1 + ε 2TN (ω ω 0 )
2
73](https://image.slidesharecdn.com/phdthesissandroaquiles060724-121017023005-phpapp01/75/Thesis-for-Power-System-protection-in-Brief-108-2048.jpg)
![N −1
vk ( s − u k )
H ( s) = ∏ (3.19)
k =0 u k ( s − vk )
Where (s-uk) / uk is replaced by –1 if uk = ∞.
In Figure 3.7 is shown the frequency response of a 3rd order, 180 Hz cutoff frequency
Chebyshev II filter defined by the transfer function
379.33 s 2 + 2023093451.6247
H ( s) = .
s 3 + 2430.0089 s 2 + 2880525.9979 s + 2023093451.6247
Figure 3.7: Frequency response of a Chebyshev II filter
3.4.2.5 Elliptic filters
An elliptic integral of the first kind is defined as follows [36].
φ dy
u (φ , k ) = ∫ (3.20)
0
1 − k sin 2 ( y )
2
75](https://image.slidesharecdn.com/phdthesissandroaquiles060724-121017023005-phpapp01/75/Thesis-for-Power-System-protection-in-Brief-110-2048.jpg)
![A special evaluation of Equation 3.20, known as the complete elliptic integral, is as
follows.
K = u (π 2 , k ) (3.21)
The trigonometric functions of the inverse of Equation 3.21 are defined as Jacobian
elliptic trigonometric functions of u with modulus k; the functions are as follows.
sn(u, k ) = sin[φ (u, k )]; nc(u, k ) = sec[φ (u, k )];
cn(u, k ) = cos[φ (u, k )]; ns(u, k ) = csc[φ (u, k )]; (3.22)
sc(u, k ) = tan[φ (u, k )]; cs(u, k ) = cot[φ (u, k )].
These Jacobian elliptic trigonometric functions are periodic functions with period of 4K,
if u is real. Hence, K is also called the quarter period. The quarter period or complete
elliptic integral, as a function of the modulus k, is K = π/2 when the modulus k = 0. The
value of K does not change too much until k approaches 1, when K increases rapidly and
tends to infinite.
Another parameter, the complementary modulus k’, is defined as follows
k 2 + k '2 = 1 (3.23)
Some of the most important properties for the elliptic functions, as functions of a
complex variable, are as follows.
sn( jv, k ) = j sc(v, k ' ); cn( jv, k ) = nc(v, k ' ) (3.24)
These relationships indicate that the elliptic functions are periodic in both the real and
imaginary part of the argument, with periods related to K and K’ respectively.
76](https://image.slidesharecdn.com/phdthesissandroaquiles060724-121017023005-phpapp01/75/Thesis-for-Power-System-protection-in-Brief-111-2048.jpg)
![Noticing the similarity between the Chebyshev polynomials defined in Equation 3.8, the
Chebyshev rational function is defined as a function of moduli k and k1 as follows.
RN ( x) = sn[n angsn(ω , k ), k1 ] (3.25)
The Chebyshev rational functions present equiripple properties, and are used in the
construction of filters. Elliptic filters are equiripple in both the pass band and the stop
band. They achieve the minimal possible order for given specifications. A low pass
elliptic filter is defined by the frequency response as follows [34].
2 1
H (ω ) = , (3.26)
1 + ε R N (ω ω 0 )
2 2
In this equation, RN(x) is a Chebyshev rational function of degree N. The main
properties of this function are as follows.
• It is an even function of x for even values of N, and an odd function of x for odd
values of N (similar to Chebyshev polynomials).
• In the range of -1 ≤ x ≤ 1, the function oscillates between –1 and 1 and all its
zeros are in this range. Therefore, |H(ω)|2 oscillates between 1 and 1 / (1 + ε2) for
-0 ≤ |ω| ≤ ω0.
• In the range 1 < |x| < ∞, |RN(x)| oscillates between 1/d and ∞, where
1/ 2
⎛ 10Gp 10 − 1 ⎞
d = ⎜ Gs 10
⎜ 10 ⎟ (3.27)
⎝ −1 ⎟⎠
As a result, |H(ω)| oscillates between 0 and 1 / (1 + ε2 / d2) in the range ω0 ≤ |ω| ≤.∞.
The order of the filter N is the smallest integer satisfying
77](https://image.slidesharecdn.com/phdthesissandroaquiles060724-121017023005-phpapp01/75/Thesis-for-Power-System-protection-in-Brief-112-2048.jpg)
![KK '1
N= (3.28)
K ' K1
The locations of the zeros of the filter transfer function are defined by
±1 ⎧0, 2, 4, ..., N − 1 N odd
ω zi = for i = ⎨ (3.29)
k sn(iK N , k ) ⎩ 1, 3, 5, ..., N − 1 N even
The locations of the poles of the transfer function are defined by
⎛ Ki angsn[ j (1 / ε ), k1 ] ⎞ ⎧0, 2, 4, ..., N − 1 N odd
s pi = j sn⎜ + j , k ⎟ for i = ⎨ (3.30)
⎝N n ⎠ ⎩ 1, 3, 5, ..., N − 1 N even
In Figure 3.8 is shown the frequency response of a 3rd order, 180 Hz cutoff frequency
Elliptic filter whose transfer function
307.7872 s 2 + 1.2189 -10 s + 1326185001.3231
H ( s) = .
s 3 + 1695.2265 s 2 + 2018954.6201 s + 1326185001.3231
Figure 3.8: Frequency response of an Elliptic filter
78](https://image.slidesharecdn.com/phdthesissandroaquiles060724-121017023005-phpapp01/75/Thesis-for-Power-System-protection-in-Brief-113-2048.jpg)
![3.4.2.6 Bilinear transformation
In order to be modeled, an analog filter must be transformed into an IIR digital filter.
Several transformation methods can be used for this purpose but bilinear transformation
is commonly used because of its simplicity and convenience in implementation. The
bilinear transformation consists of the following substitution [34].
2 z −1
s← ⋅ , (3.31)
T z +1
where,
T is the sampling interval
s is the Laplace transform variable
z is the z-transform variable
If the transfer function of an analog filter is H(s), the transfer function of its
corresponding digital filter is
H ( z) = H (s) 2 ( z −1) (3.32)
s=
T ( z +1)
The bilinear transformation preserves the number of poles and the order of the filter.
The number of zeroes increases to match the number of poles.
Ideally, the frequency response of the digital filter should be close to that of the analog
filter, fulfilling
Ω = ωT (3.33)
where,
79](https://image.slidesharecdn.com/phdthesissandroaquiles060724-121017023005-phpapp01/75/Thesis-for-Power-System-protection-in-Brief-114-2048.jpg)
![Ω is the digital-domain frequency
ω is the analog-domain frequency
However, the relationship of digital and analog frequencies in the bilinear
transformation is given by
⎛ ωT ⎞
Ω = 2 ⋅ tan −1 ⎜ ⎟. (3.34)
⎝ 2 ⎠
The digital frequency Ω is warped with respect to the analog frequency ω. At low
frequencies, Ω ≈ ωT , which is a linear relationship. The analog high frequencies are
mapped to Ω = ±π .
To overcome the frequency warping introduced by bilinear transformation, it is a
common practice to prewarp the specifications of the analog filter, in order that, after
warping, they will be located at the desired frequencies. For this reason, it is necessary
to design the analog filter using the following band edges equations:
2 ⎛ Ωp ⎞ Ω
⎟ , ω s = tan ⎛ s ⎞ .
2
ωp = tan⎜
⎜ 2 ⎟ ⎜ ⎟ (3.35)
T ⎝ ⎠ T ⎝ 2 ⎠
After the analog filter has been transformed using the bilinear transformation, the
resulting digital filter will have its band edges placed in the desired places.
3.4.2.7 Digital filter realization
Realization of a digital filter is made in two stages [34]:
1. Construction of a block diagram of the filter. Such a block diagram is known as
realization of the filter. A realization is essentially a flow graph of signals in the
80](https://image.slidesharecdn.com/phdthesissandroaquiles060724-121017023005-phpapp01/75/Thesis-for-Power-System-protection-in-Brief-115-2048.jpg)
![filter. It includes operations such as delays, additions, and multiplication of
signals by constant coefficients.
2. Implementation of the realization, in either software or hardware.
3.4.2.7.1 Building blocks of digital filters
Any digital system that is linear, time invariant, rational, and causal can be realized
using three basic types of elements [34].
Unit delay: Its purpose is to hold the input for a unit of time (physically equal to the
sampling interval T) before it is delivered to the output. Mathematically, it performs the
following operation.
y[n] = x[n − a ] (3.36)
Unit delay is depicted schematically in Figure 3.9(a). The letter D, indicating delay,
sometimes is replaced by z-1, which is the delay operator in the z domain. Unit delay can
be implemented in software in a storage variable, which changes its value when
instructed by the program.
Adder: The purpose of the adder is to add two or more signals appearing at the input at
a specific time. Mathematically, it performs the operations like the one shown in the
following equation.
y[n] = x1 [n] + x 2 [n] + ... (3.37)
An adder is depicted schematically in Figure 3.9(b).
Multiplier: The purpose of this element is to multiply a signal (a varying quantity) by a
constant number, such as the one shown in the following equation.
81](https://image.slidesharecdn.com/phdthesissandroaquiles060724-121017023005-phpapp01/75/Thesis-for-Power-System-protection-in-Brief-116-2048.jpg)
![y[n] = ax[n] (3.38)
A multiplier is depicted schematically in Figure 3.9(c). There is no specific symbol for
the multiplier, but to show its operation, a constant factor is placed above or besides the
signal line.
Figure 3.9: Basic elements to build digital filters
(a) Unit delay, (b) Adder, (c) Multiplier
3.4.2.7.2 Direct realization of IIR systems
Let H(z) be a rational, causal, stable transfer function in which the order of the
polynomials in the numerator and denominator are equal. This transfer function can be
mathematically expresses as follow [34].
b( z ) b0 + b1 z −1 + ... + b N z − N
H ( z) = = (3.39)
a ( z ) 1 + a1 z −1 + ... + a N z − N
82](https://image.slidesharecdn.com/phdthesissandroaquiles060724-121017023005-phpapp01/75/Thesis-for-Power-System-protection-in-Brief-117-2048.jpg)
![It can be shown that an auxiliary signal u[n], the input x[n] and the output y[n] defined
by the following equations represent the use of the transfer function defined by Equation
3.39.
u[n] = −a1u[n − 1] − ... − a N u[n − N ] + x[n] (3.40)
y[n] = −b0 u[n] + b1u[n − 1] + ... + b N u[n − N ] (3.41)
In Figure 3.10 is shown a realization of these equations. By passing u[n] through a
chain of N delay elements, signals {u[n-1], u[n-2], …, u[n-N]} are obtained. Then u[n]
is formed as a linear combination of the delayed signals and the input signal x[n]. N
multipliers are needed for using the coefficients {-a1, …, -aN}, and N binary adders to
form the sum. The realization uses feedback; it builds the present value of the signal
u[n] from its past values and the present value of the input signal x[n].
Figure 3.10: Direct realization of a digital IIR system
To generate the output y[n] from the auxiliary signal u[n] and its delayed values, N+1
multipliers for using the coefficients {b0, …, bN} are added in addition to N delay
elements. The realization shown in Figure 3.10 is called a direct realization. In this
83](https://image.slidesharecdn.com/phdthesissandroaquiles060724-121017023005-phpapp01/75/Thesis-for-Power-System-protection-in-Brief-118-2048.jpg)
![realization, the number of delay elements, N, is equal to the orders of the polynomials in
the numerator and denominator of the transfer function. As well, there are 2N+1
multipliers and 2N adders. The realization is recursive, since it generates present values
of its internal signals from past values of these signals.
3.4.3 Analog-to-digital converter
An analog-to-digital converter (A/D converter or ADC) takes the instantaneous value of
an analog voltage and converts it into an n-bit binary number that can be easily
manipulated by a microprocessor. The n-bit number is a binary fraction representing the
ratio between the input voltage and the full-scale voltage of the converter. A number of
techniques can be used to achieve this conversion. The full-input voltage ranges for an
ADC are typically 0 to +5 or 0 to +10 volts for unipolar operations, and –5 to +5 or –10
to +10 volts for bipolar operation [37].
3.4.3.1 Sample-and-hold techniques
The basic function of a sample-and-hold in an analog input system is to capture an input
signal and hold it constant during the subsequent ADC conversion cycle. For the sake of
illustration, a very simple circuit consisting of only a switch and a hold capacitor CH is
shown in Figure 3.11. When the switch is closed, the capacitor charges up to the level
of the input signal. The capacitor holds the charge to this level when the switch is
opened.
Figure 3.11: Simple sample-and-hold circuit
84](https://image.slidesharecdn.com/phdthesissandroaquiles060724-121017023005-phpapp01/75/Thesis-for-Power-System-protection-in-Brief-119-2048.jpg)
![In Figure 3.12 is shown the operation of a sample-and-hold system in the time domain.
Up until time T1, the output is in the hold mode. At time T1, the circuit is told to
reacquire the input. The acquisition time TAC is the time required for the circuit output
to become equal to its input. The output then follows the input until the circuit is again
put in the hold mode at T2. A small amount of time TAP, the aperture time, is required
for the circuit to actually switch to hold mode. During this time the output signal may
change slightly from the value at T2, such variation is called aperture uncertainty.
Typical values for acquisition time, aperture time, and aperture uncertainty are 5, 0.005
and 0.01 microseconds, respectively [37].
Figure 3.12: Operation of the sample-and-hold circuit in the time domain
The sample-and-hold is used in the numerical relay for analog–to-digital conversion. A
comparison of the most common ADC techniques is displayed in Table 3.1 [37]. The
medium-speed, medium-cost successive approximation ADC is a common choice in
digital protection and control systems.
85](https://image.slidesharecdn.com/phdthesissandroaquiles060724-121017023005-phpapp01/75/Thesis-for-Power-System-protection-in-Brief-120-2048.jpg)
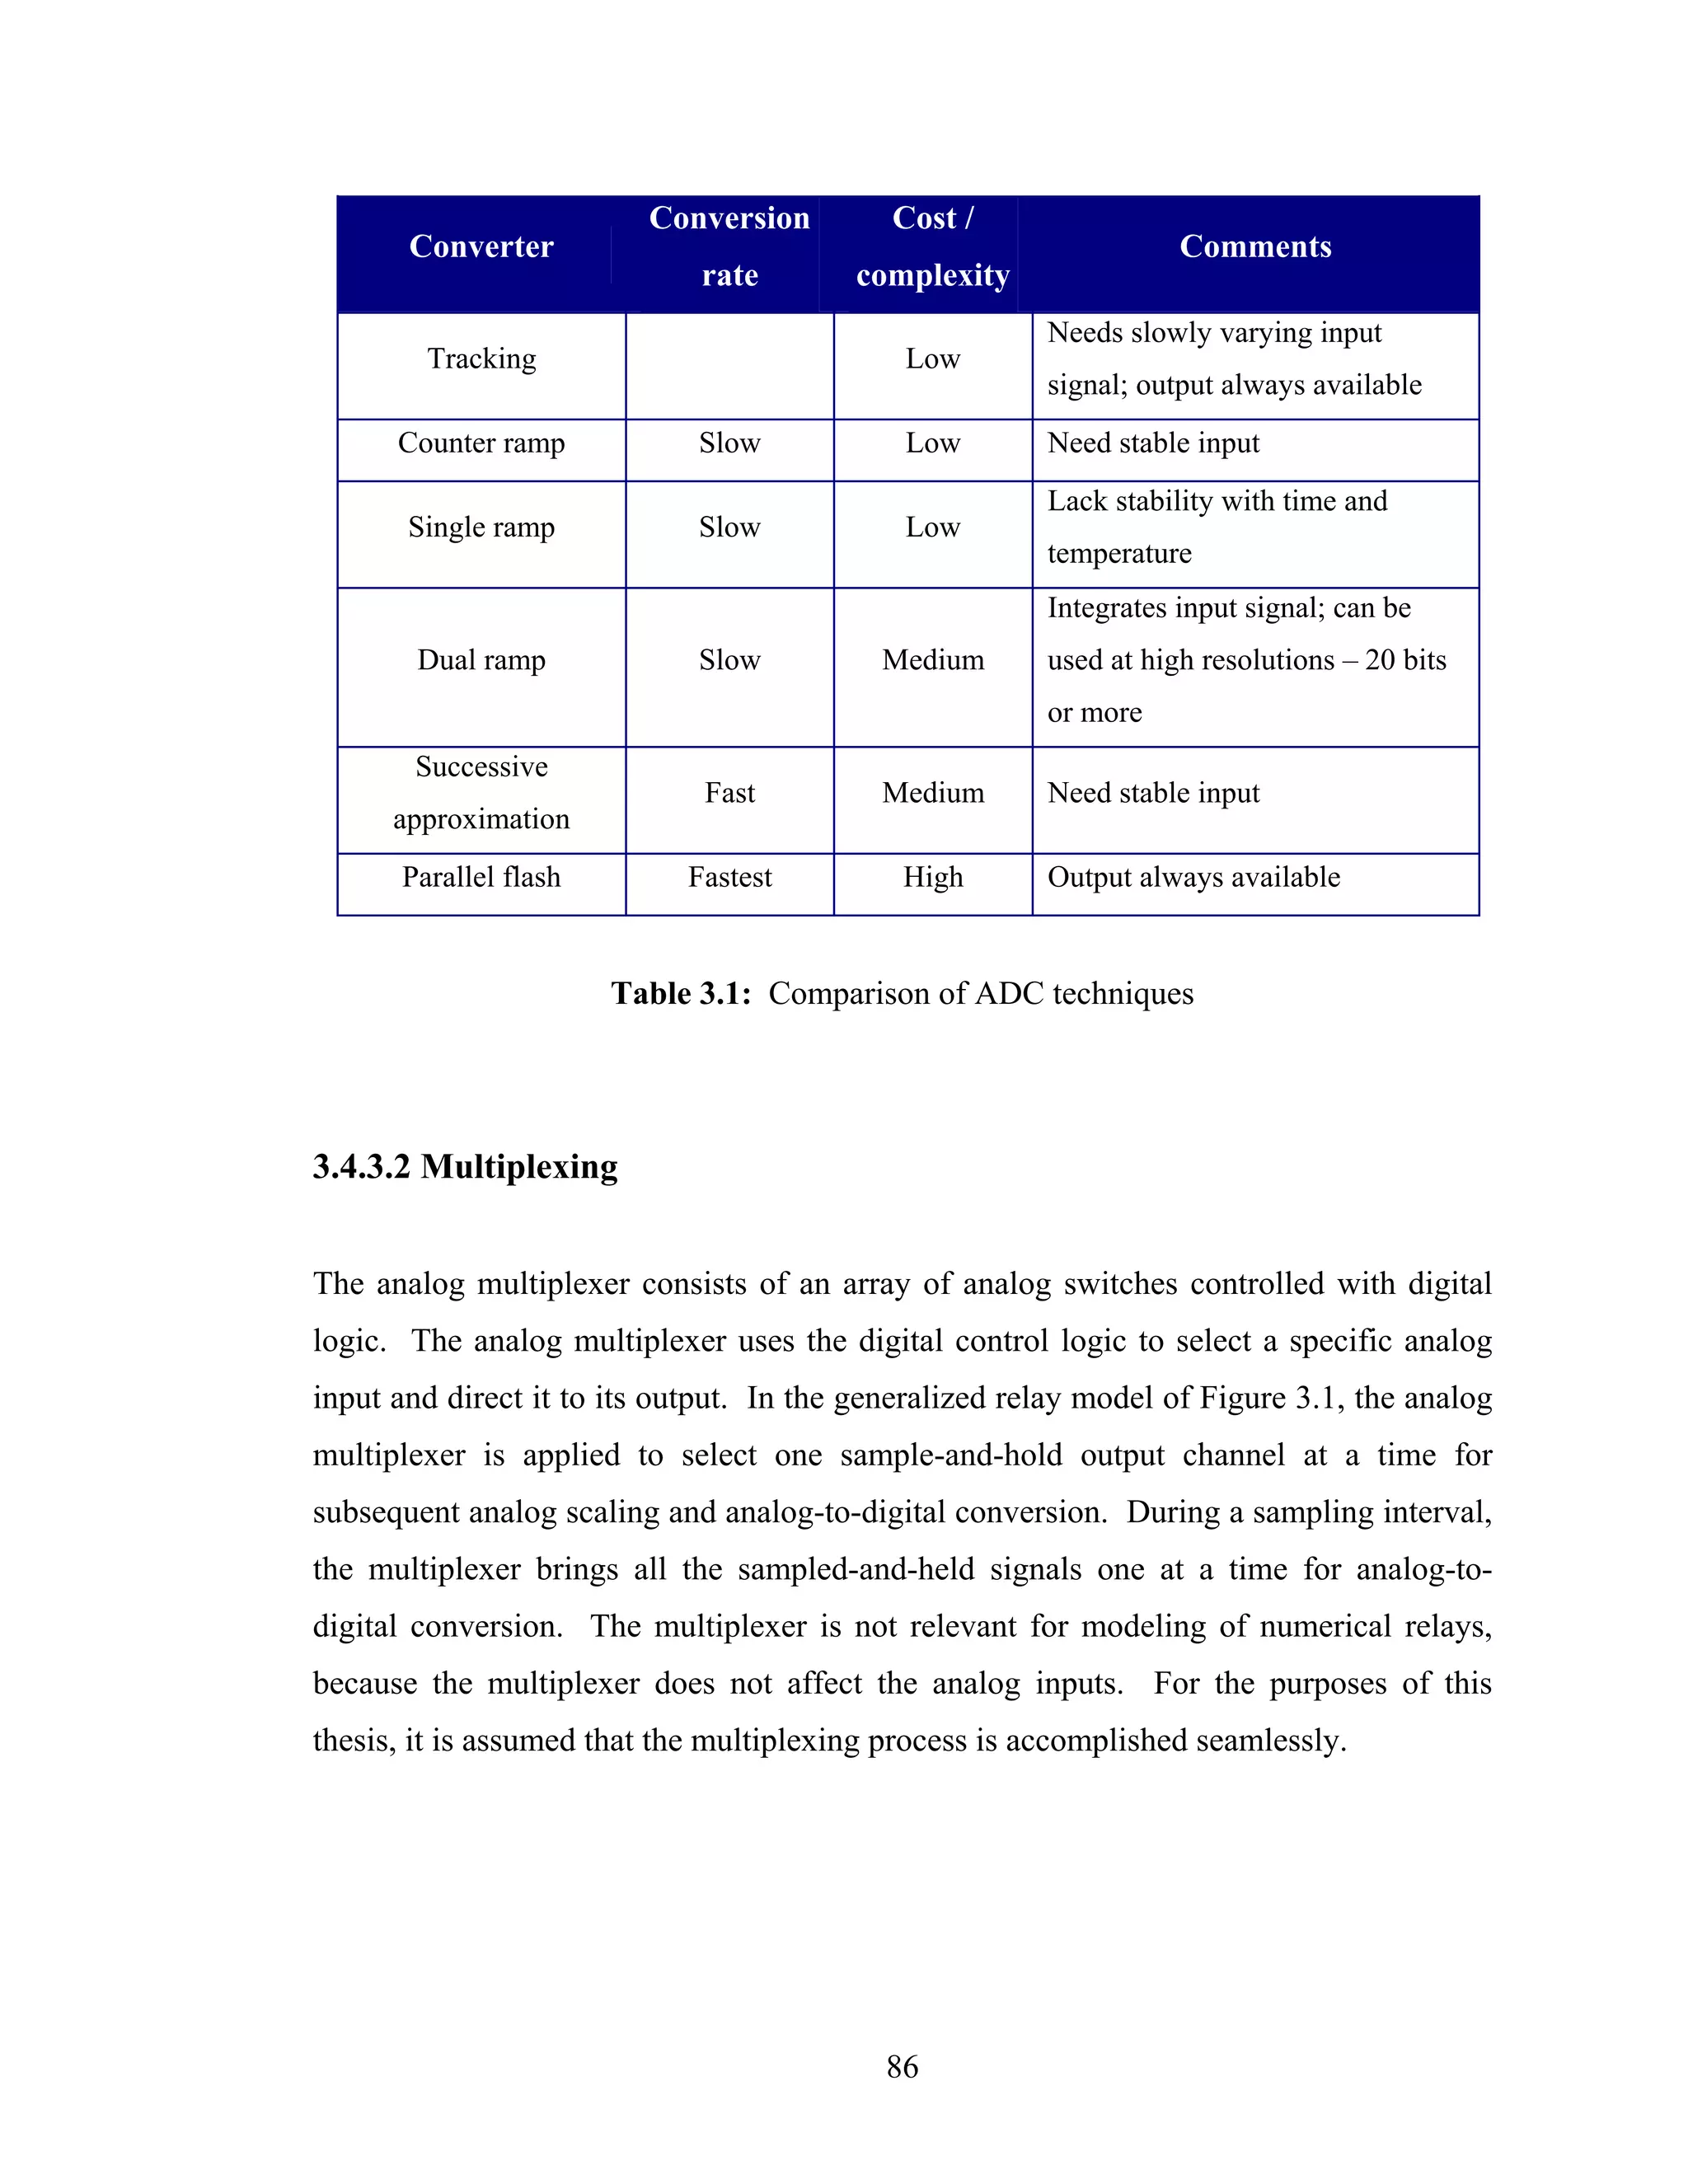
![3.4.3.3 Software modeling of ADC
Software modeling of an ADC is reduced to calculating the number that is proportional
to the level of the analog input. Software modeling of the ADC requires that the
following information is available.
• Word size of the converter in number of bits used in the quantization process
• Range of the analog input quantized by the converter without saturation
• Whether the ADC truncates or rounds the input to the next higher integer value
• The method used for representing the negative numbers
Suppose that the ADC has a word size of (b+1) bits and a range of –Y to +Y. For a
positive input of X volts, the digitized value Z10 is defined as follows.
Z10 = INT or RON ⎢
(
⎡ X 2b − 1 ⎤
⎥,
) (3.42)
⎣ Y ⎦
where,
Z10 is the integer value of base 10
INT is the truncation operation
RON is the rounding operation
For a negative input of X volts, the digitized value Z10 is calculated by one of the
following representations.
• One’s complement representation
[ ]
Z10 = 2 b+1 − 1 − INT or RON ⎢
(
⎡ X 2b − 1 ⎤
⎥
) (3.43)
⎢
⎣ Y ⎥
⎦
87](https://image.slidesharecdn.com/phdthesissandroaquiles060724-121017023005-phpapp01/75/Thesis-for-Power-System-protection-in-Brief-122-2048.jpg)
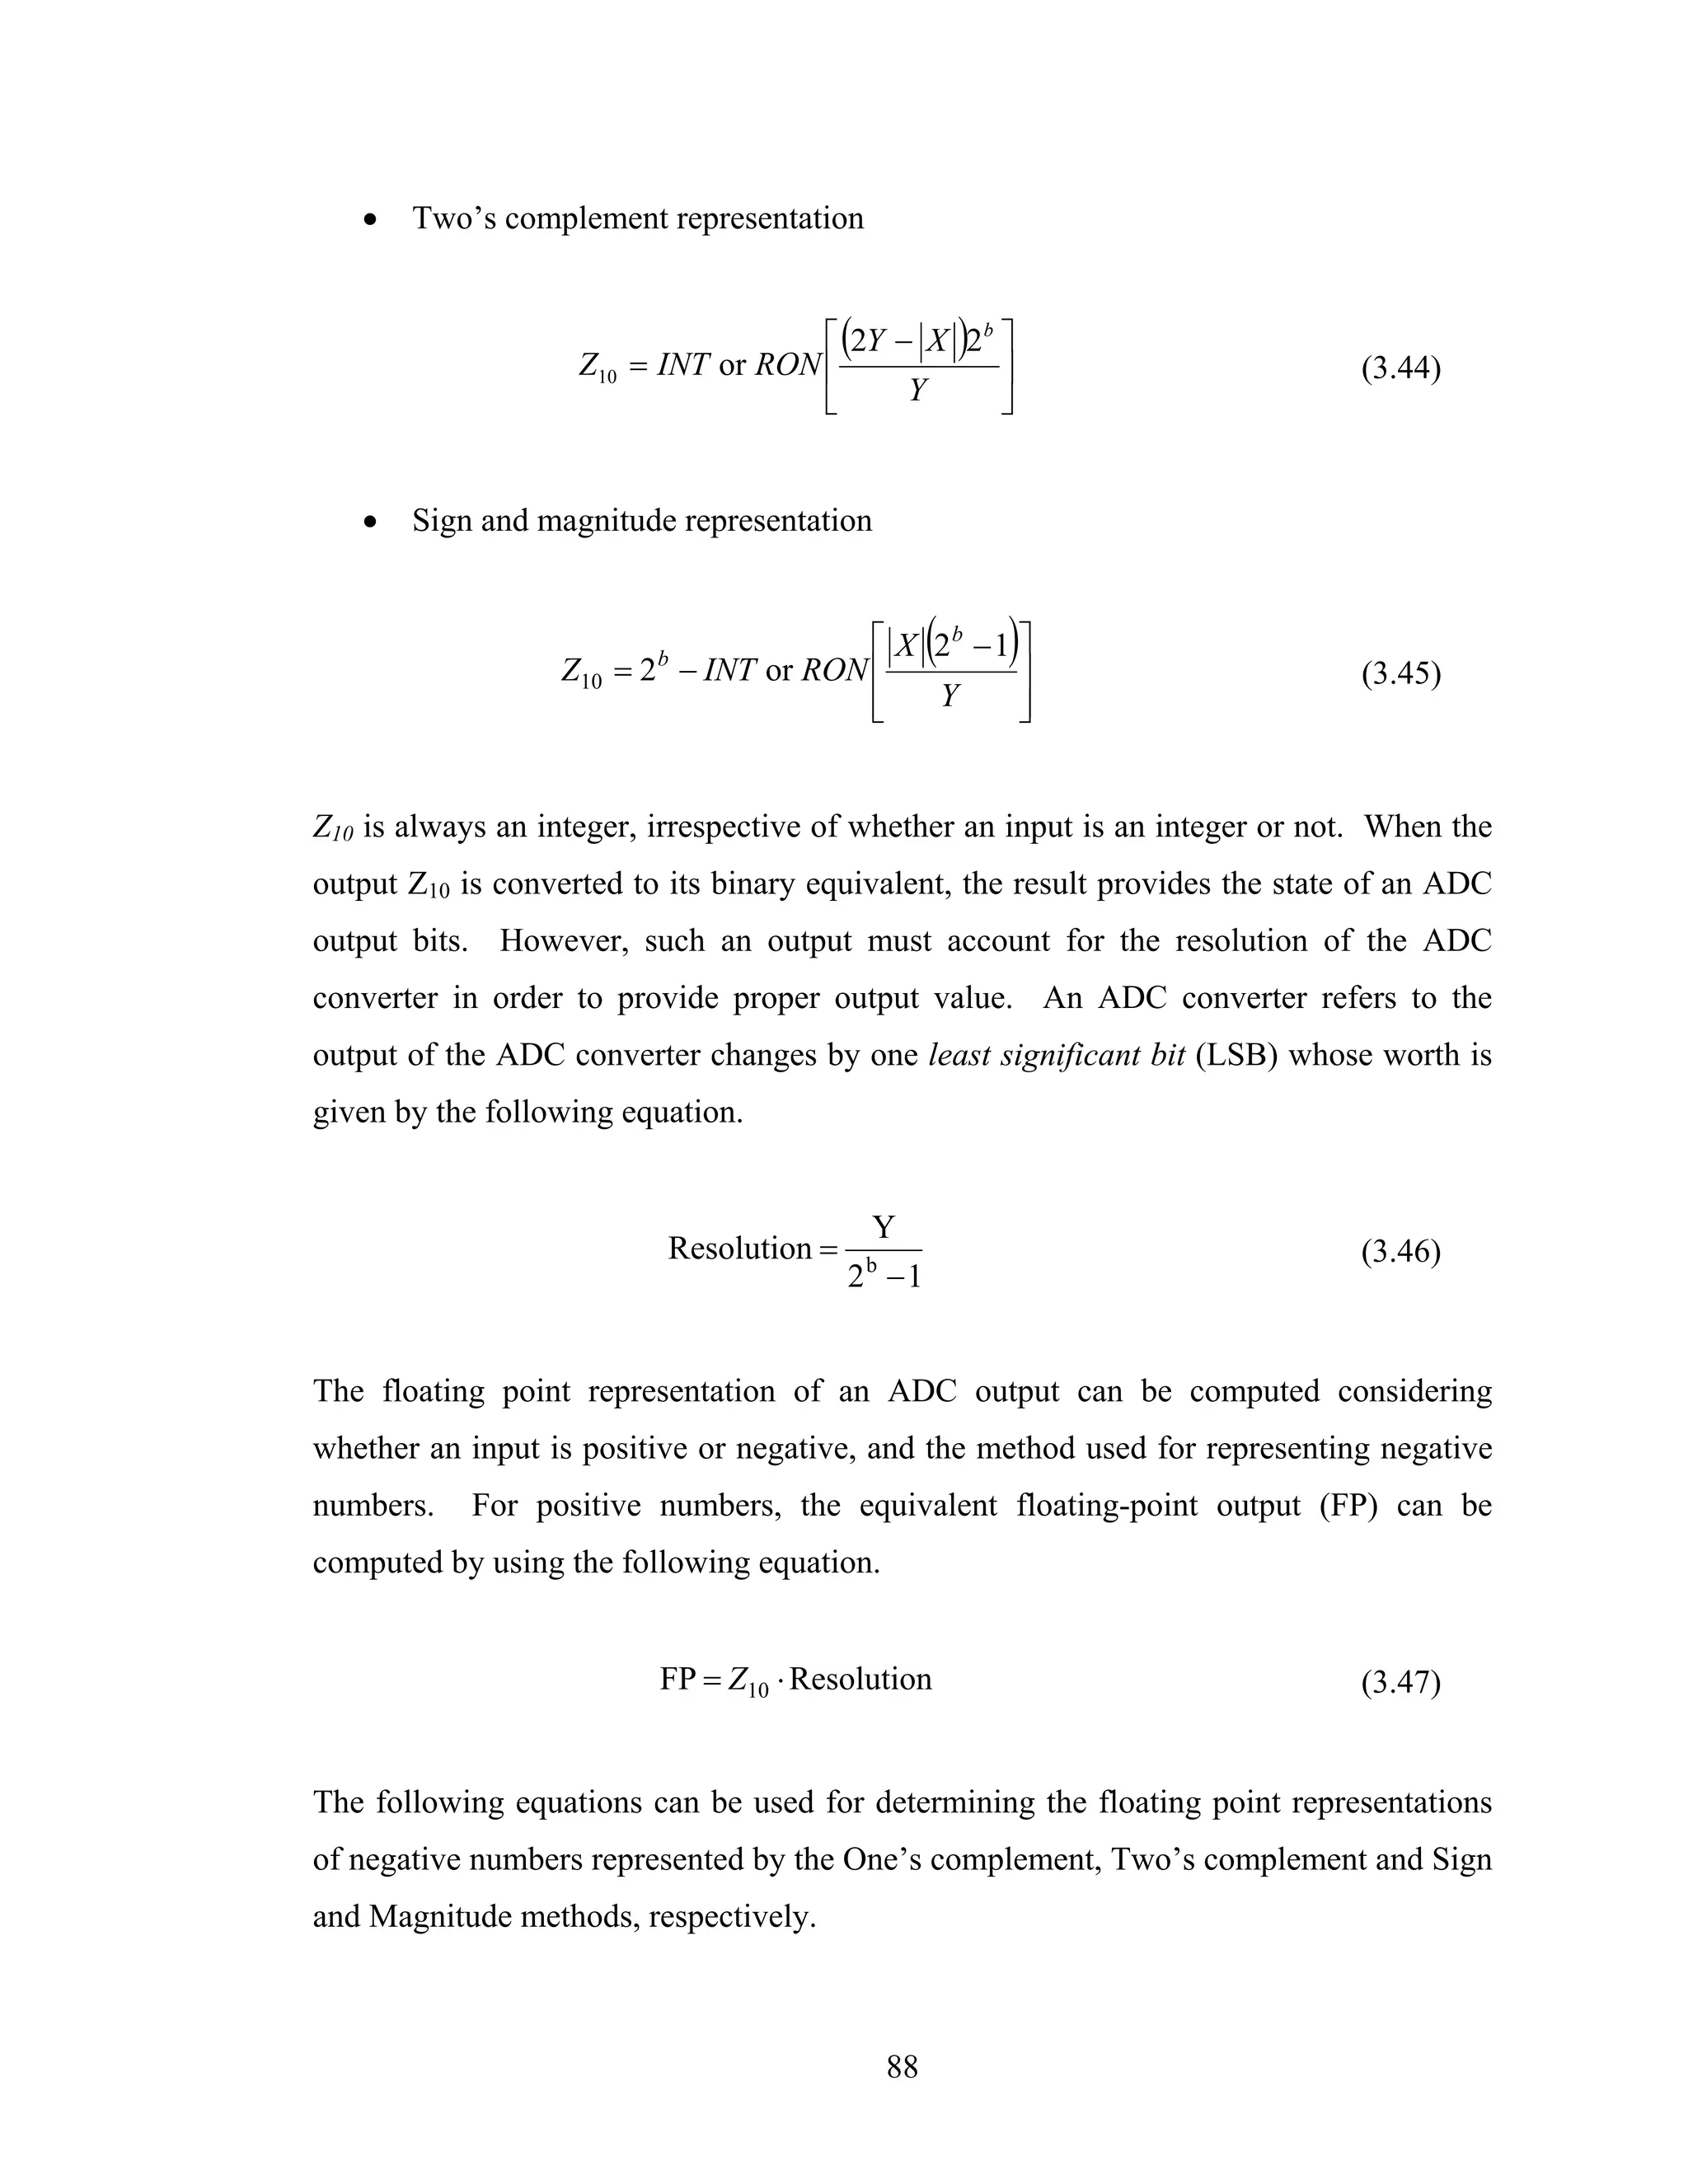
![[ ]
FP = Z10 − 2b+1 + 1 ⋅ Resolution (3.48)
[ ]
FP = Z10 − 2b+1 ⋅ Resolution (3.49)
[ ]
FP = Z 10 − 2 b ⋅ Resolution (3.50)
3.4.3.4 Numerical example of analog-to-digital conversion
The following examples illustrate the application of the conversion formulas given in the
previous section. The integer representation, resolution and floating-point output for an
input voltage of 1.25 volts applied to a 16-bit ADC that can receive inputs in the –10 to
10 volts range are calculated in this example.
Word size = b+1 = 16 bits
Y = 10
X = 1.25
⎡ (1.25)(215 − 1) ⎤
Z10 = RON ⎢ ⎥
⎣ 10 ⎦
= 4096
10
Resolution =
2 −1
15
= 0.0003052782611 350246
FP = Z10 ⋅ Resolution
= 1.25041975760906
89](https://image.slidesharecdn.com/phdthesissandroaquiles060724-121017023005-phpapp01/75/Thesis-for-Power-System-protection-in-Brief-124-2048.jpg)
![The integer representation, resolution and floating-point output for an input voltages of –
1.25 volts applied to a 16-bit ADC that can receive inputs in the –10 to 10 volts range
are calculated using the One’s complement, the Two’s complement and the Sign and
Magnitude methods in the following examples.
X = –1.25
• One’s complement method
(
⎡ − 1.25 215 − 1 ⎤
Z10 = (2 − 1) − RON ⎢
16 )
⎥
⎣ 10 ⎦
= 61439
[ ]
FP = 61439 − 216 + 1 ⋅ 0.0003052782 611
= −1.25041975760906
• Two’s complement method
⎡ (2[10] − − 1.25 )215 ⎤
Z10 = RON ⎢ ⎥
⎣ 10 ⎦
= 61440
[ ]
FP = 61440 − 216 ⋅ 0.0003052792611
= −1.25041975760906
• Sign and Magnitude method
(
⎡ − 1.25 215 − 1 ⎤
Z10 = 215 − RON ⎢
)
⎥
⎣ 10 ⎦
= 28672
[ ]
FP = 28672 − 215 ⋅ 0.0003052782 611
= −1.25041975 760906
90](https://image.slidesharecdn.com/phdthesissandroaquiles060724-121017023005-phpapp01/75/Thesis-for-Power-System-protection-in-Brief-125-2048.jpg)
![3.4.4 Phasor estimation algorithms
Algorithms are programs used in microprocessors that manipulate the samples of
voltages and currents to produce parameters of interest. Most of the existing algorithms
proposed for use in numerical relays can be grouped in two categories. The first type is
based on a model of the waveform itself. The second type involves a model of the
element being protected, such a transmission line or a power transformer [25].
The types of algorithms applied in the present thesis are related with waveform-model
algorithms. The parameters of interest for the relaying application are contained in the
waveform description. Application of the waveform-model algorithms includes the
following processes.
• The peak value of sinusoidal current for overcurrent protection
• The fundamental frequency voltage and current phasors for distance relaying
• The magnitude of harmonics in waveforms of currents for harmonic restrain in
transformer protection
• The fundamental frequency of a periodic signal for frequency relays
The information necessary for waveform algorithms is taken from sampling the signals
at equal intervals over a pre-specified time period usually referred to as a data window.
After the required parameters are calculated, a new sample is incorporated to the data
window, and the oldest sample is discarded. The calculations of the required parameters
are performed and the process continues seamlessly. Some of the waveform-model
algorithms are described in this section. These algorithms can be divided in the
following categories.
• Non-recursive
o Short window algorithms
Miki and Mikano
Mann and Morrison
91](https://image.slidesharecdn.com/phdthesissandroaquiles060724-121017023005-phpapp01/75/Thesis-for-Power-System-protection-in-Brief-126-2048.jpg)
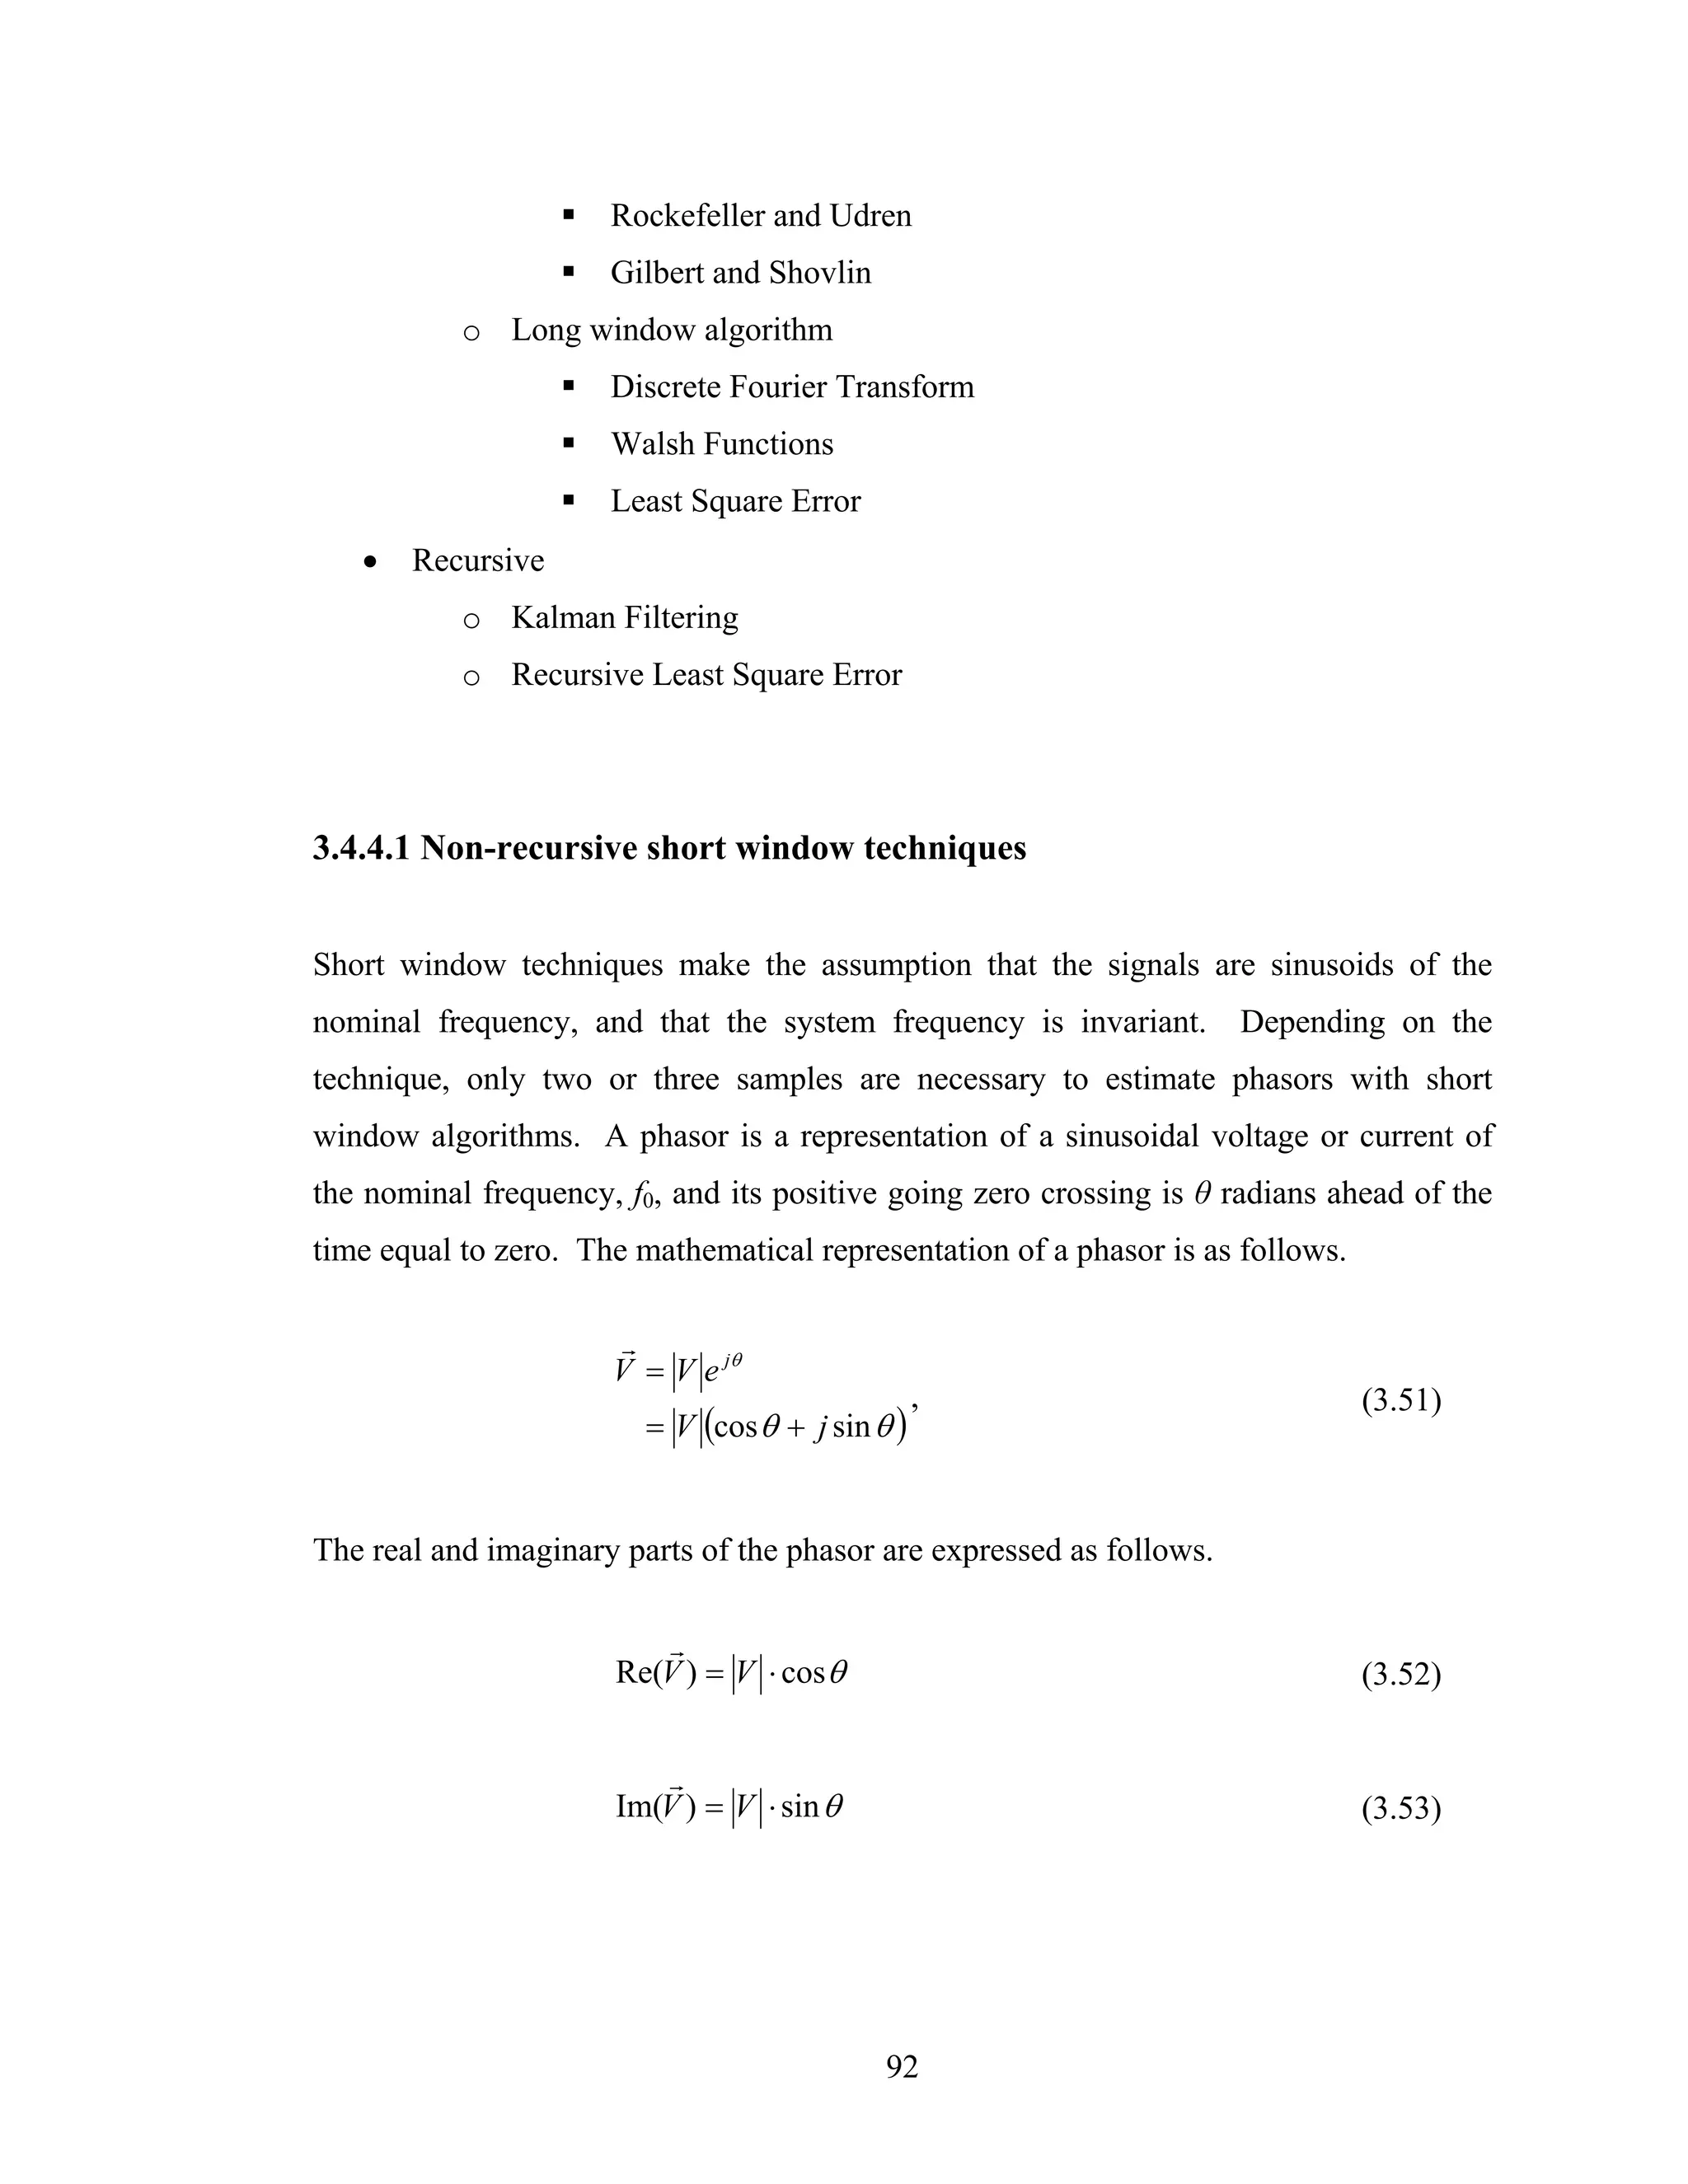
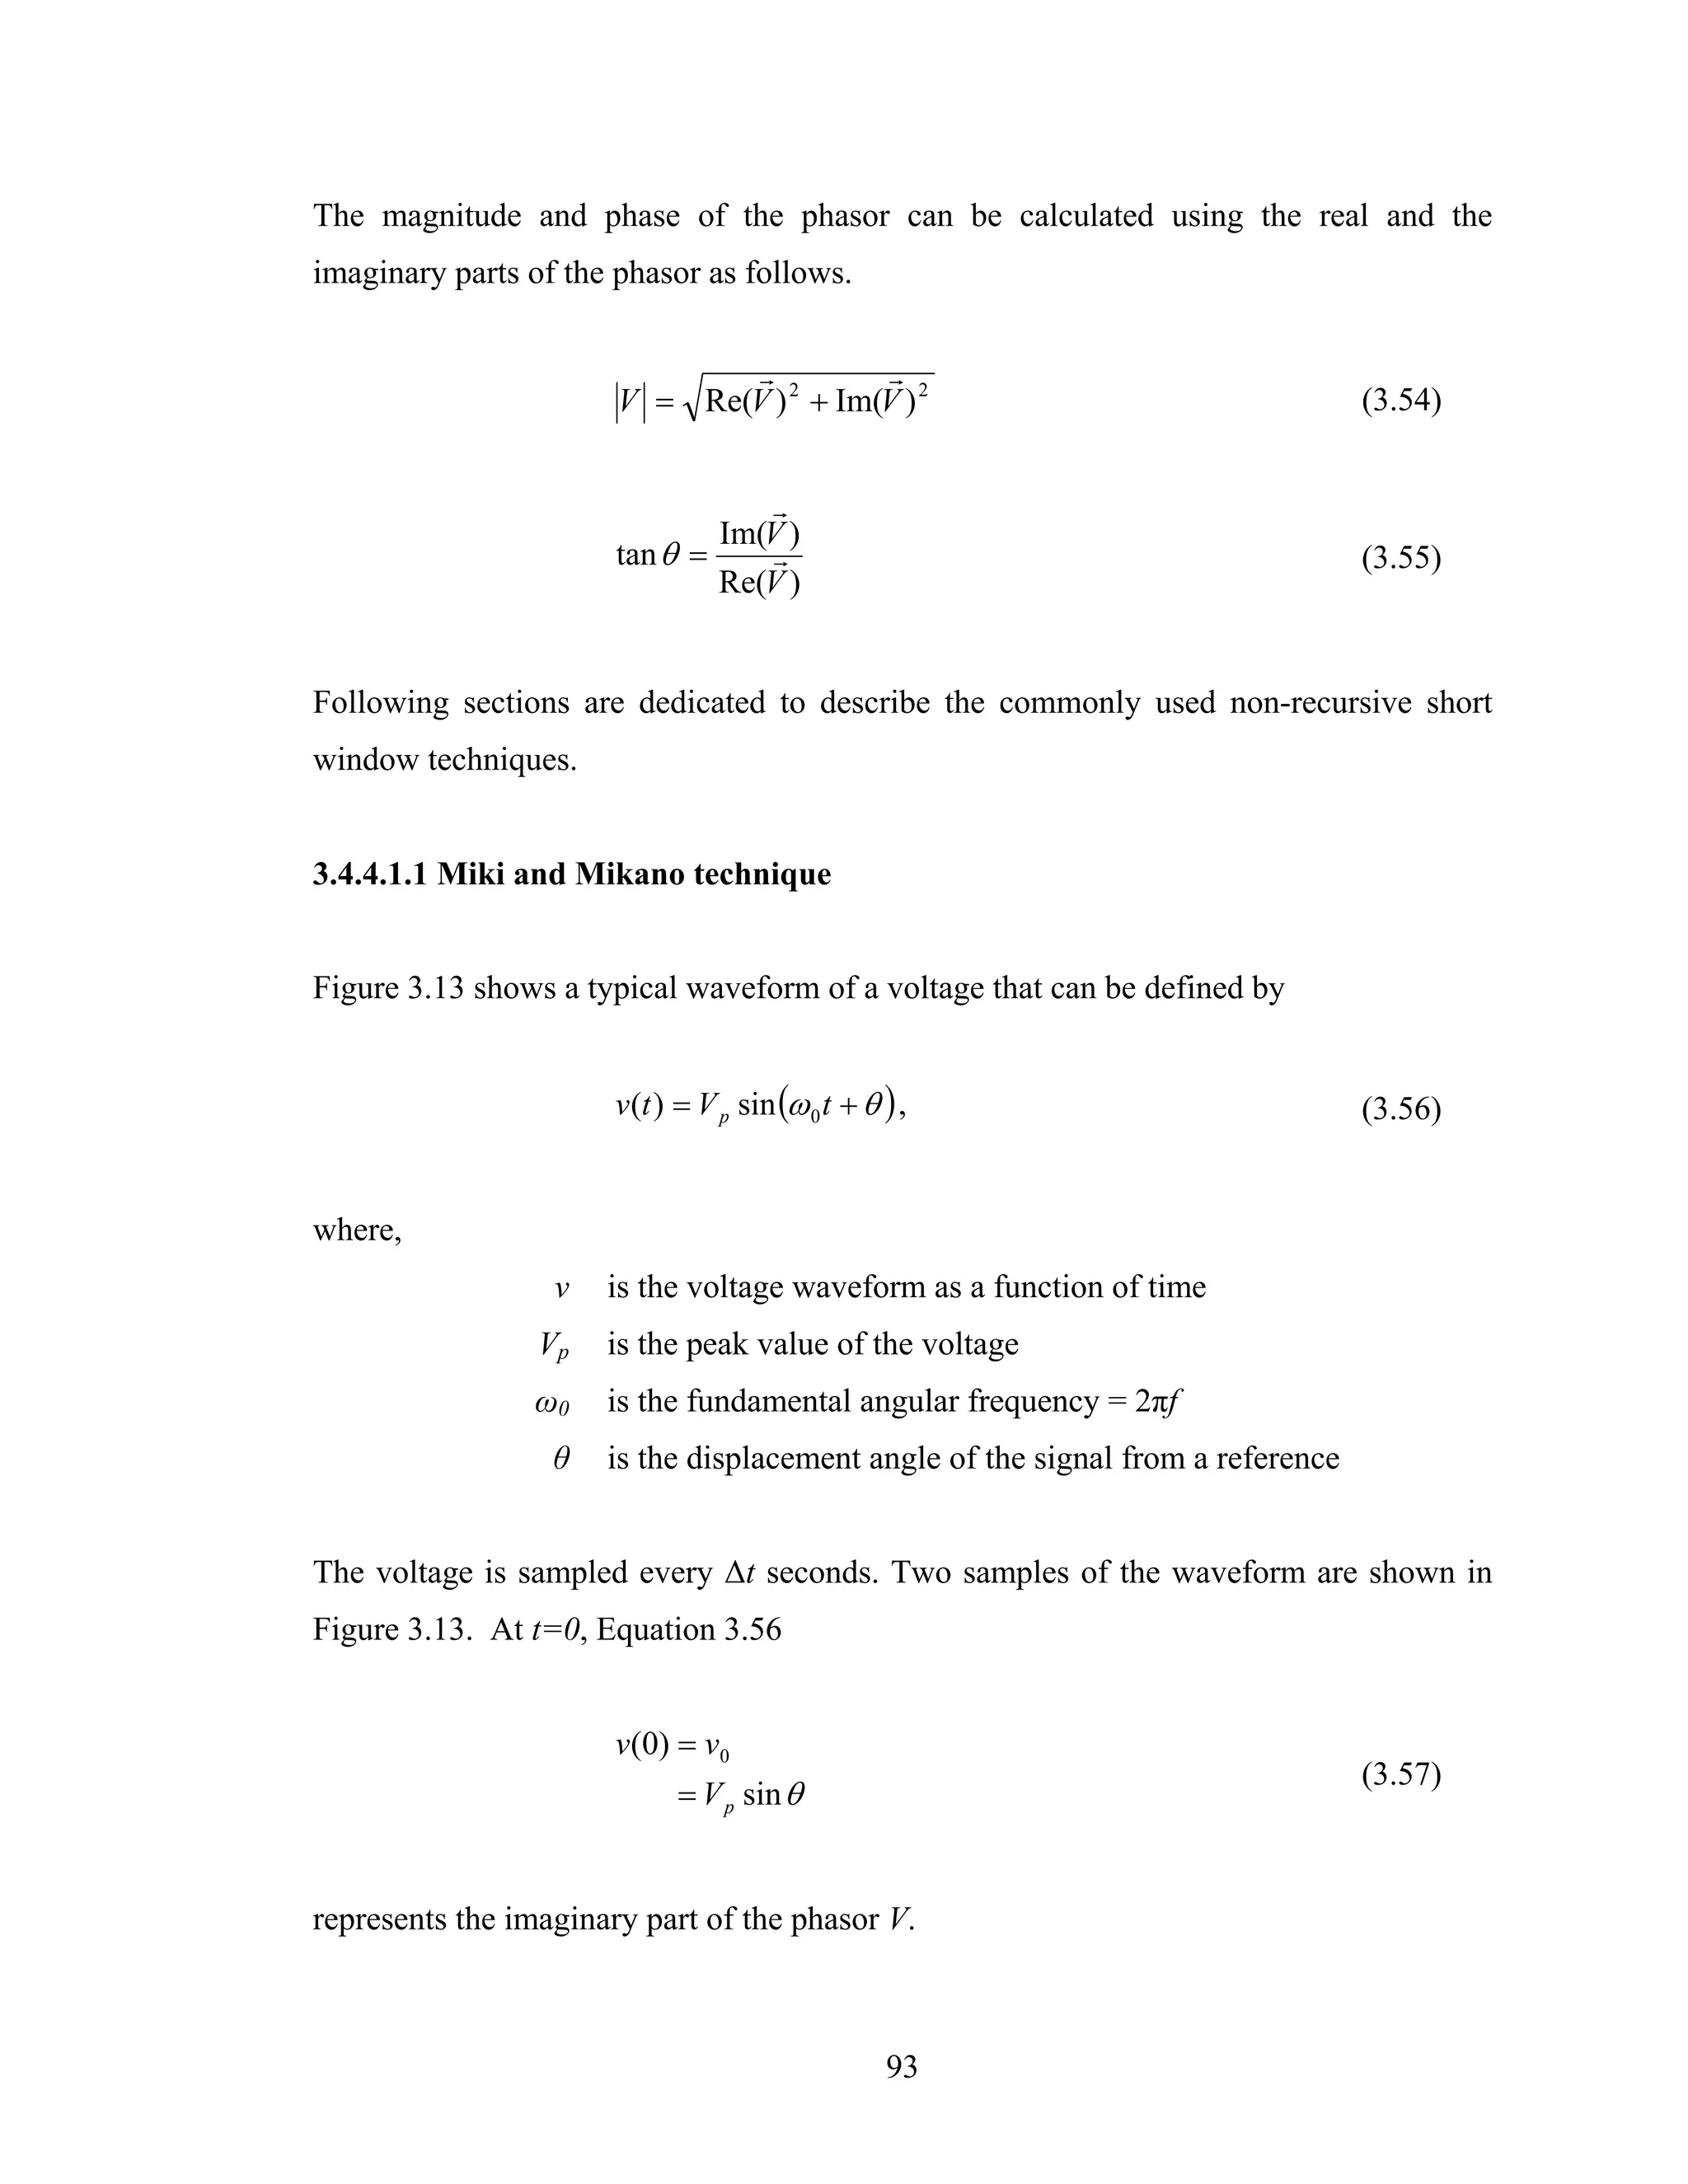
![Figure 3.13: A voltage waveform sampled two times
Evaluating Equation 3.56 at t=Δt, and at t=-Δt, becomes
v(Δt ) = v+1
(3.58)
= V p sin (ω0 Δt + θ )
v(−Δt ) = v−1
(3.59)
= V p sin ( −ω0 Δt + θ )
Expanding the sine (-Δt+θ) by using the well known trigonometric identity provides
v−1 = Vp [sin(−ω0 Δt ) cos θ + cos(−ω0 Δt )sin θ ] . (3.60)
Substituting Vp sinθ from Equation 3.57 and rearranging provides
v−1 − v0 cos(−ω0 Δt )
V p cos θ = , (3.61)
sin( −ω0 Δt )
This is the real part of the voltage phasor.
94](https://image.slidesharecdn.com/phdthesissandroaquiles060724-121017023005-phpapp01/75/Thesis-for-Power-System-protection-in-Brief-129-2048.jpg)
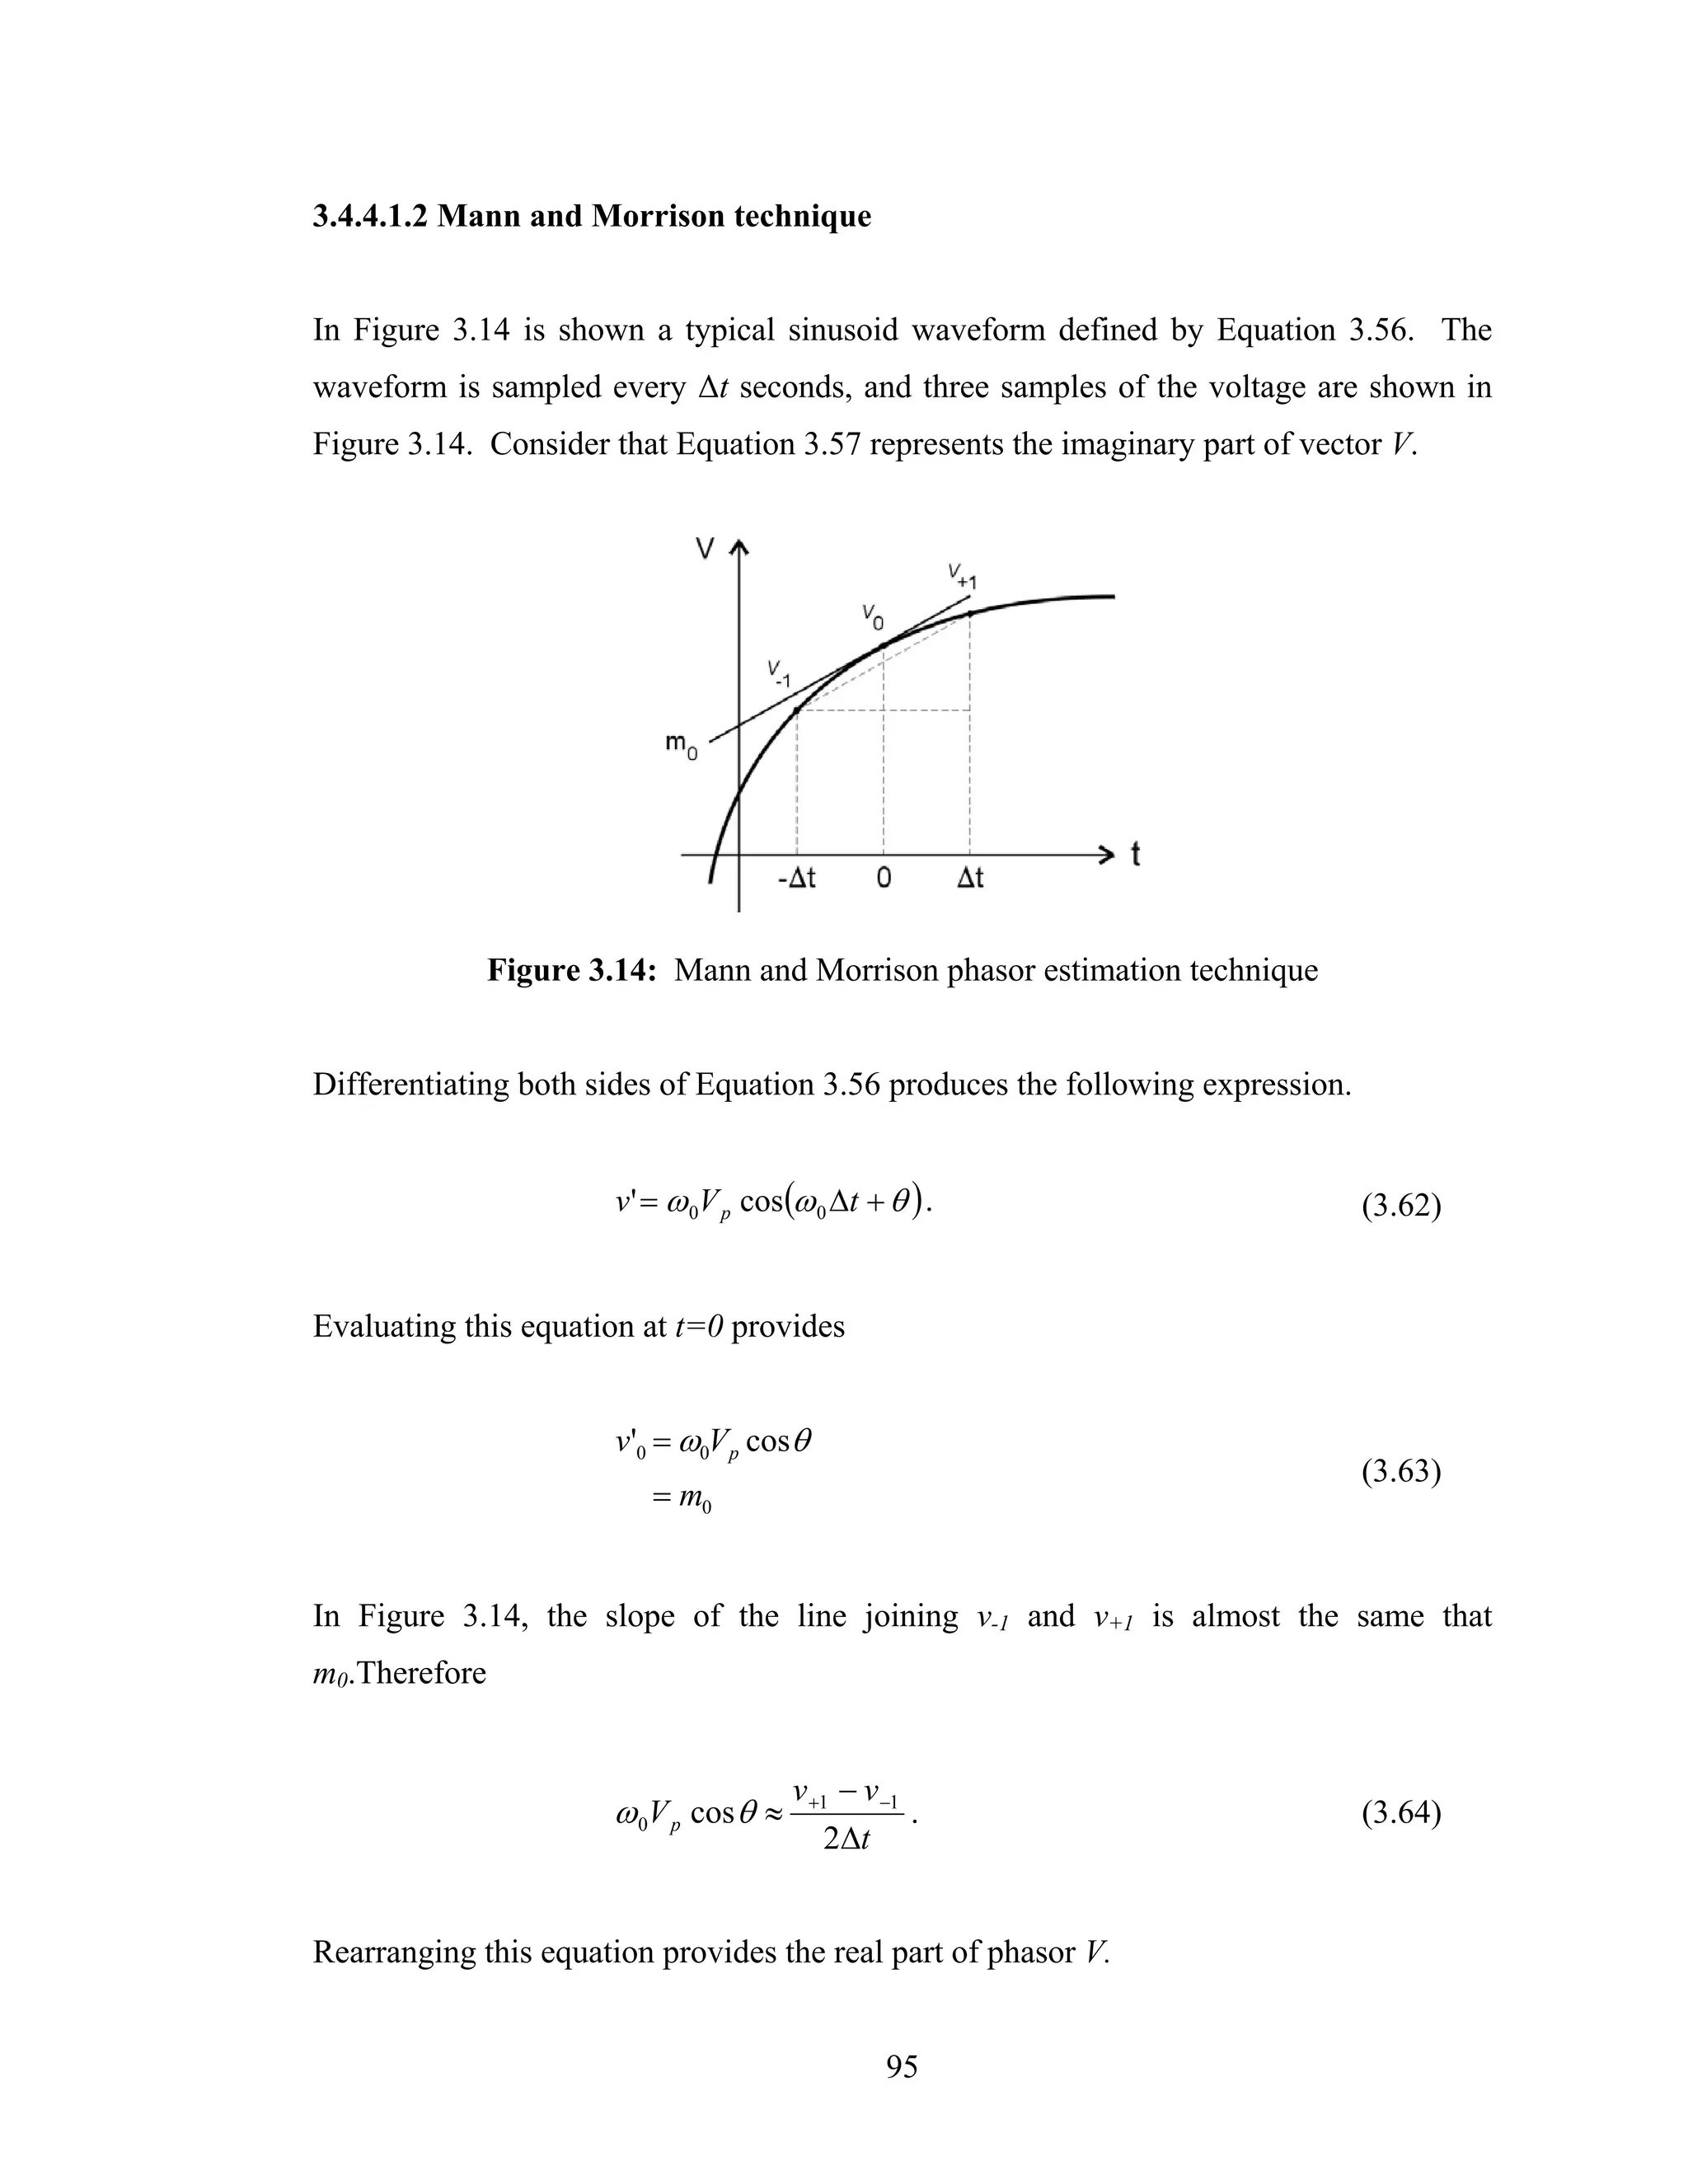
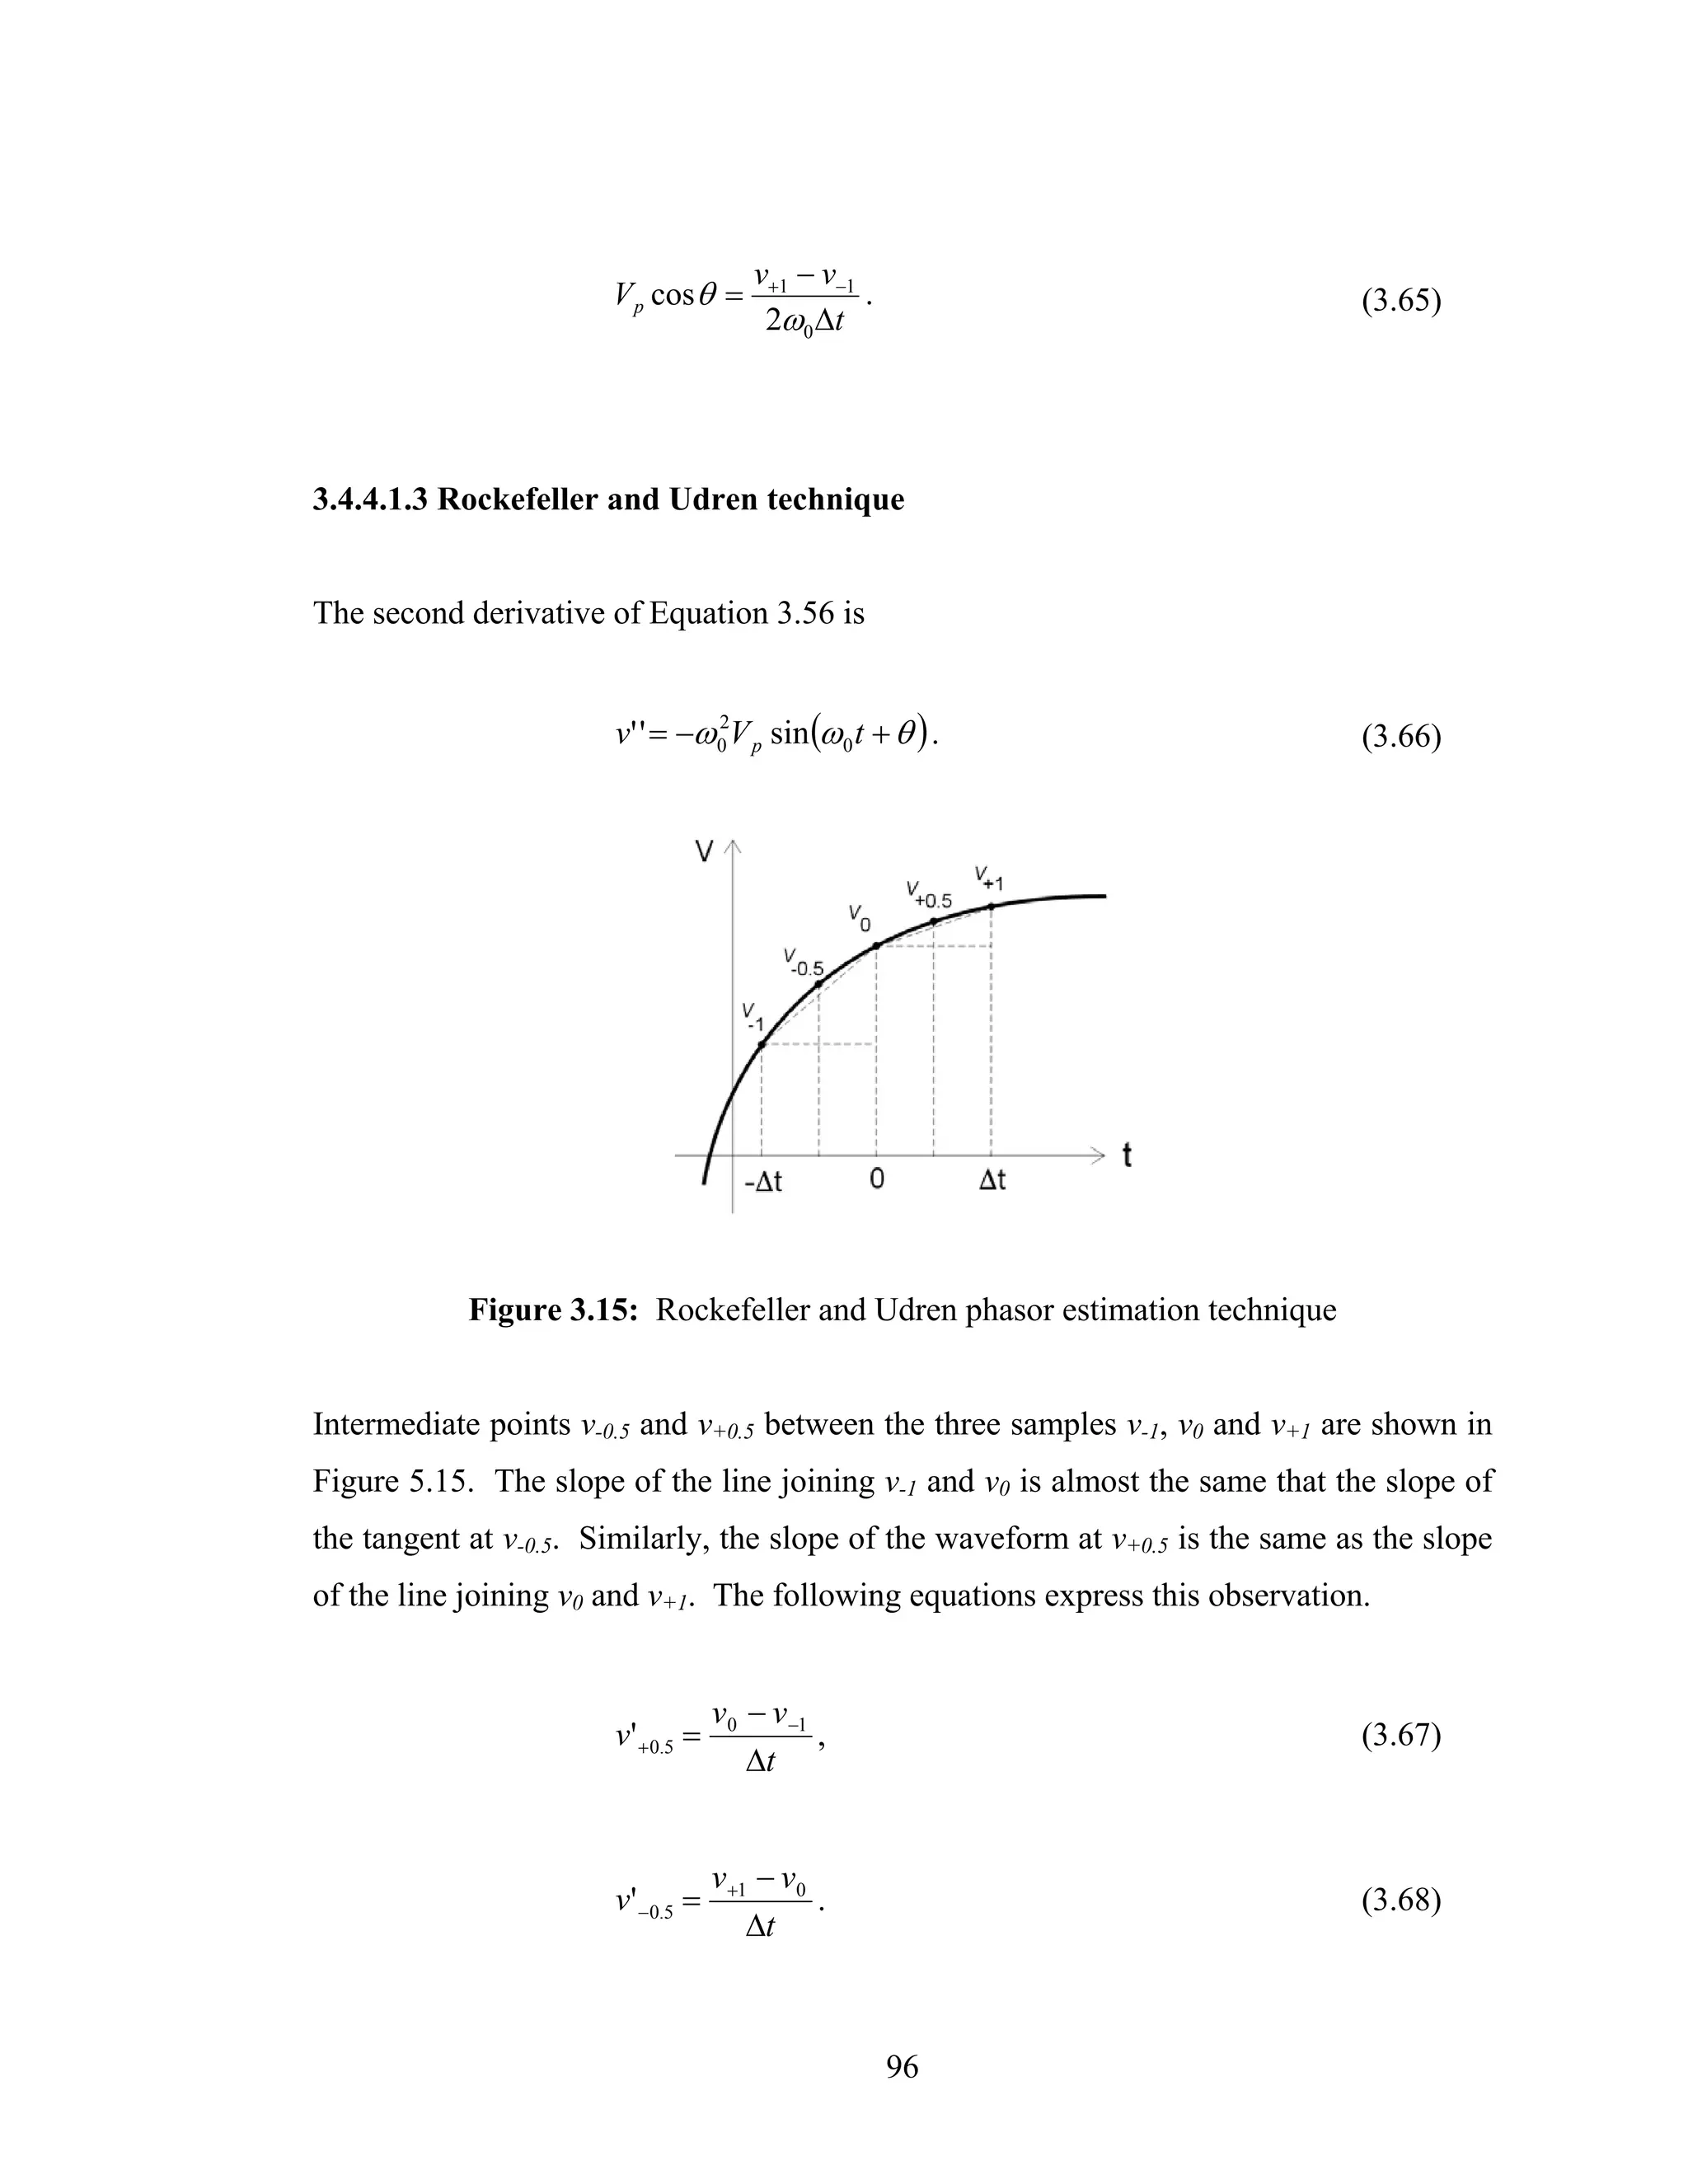
![Using a well-known trigonometric equivalence, the right hand side of this equation can
be expands and the following equation follows.
v −1 ⋅ v +1 = V p2 [sin(−ω 0 Δt ) cos θ + cos(−ω 0 Δt ) sin θ )]
. (3.74)
[sin(−ω 0 Δt ) cos θ + cos(−ω 0 Δt ) sin θ )]
Further simplification of this equation produces the following equation.
v−1 ⋅ v+1 = V p2 [− sin 2 (ω 0 Δt ) cos 2 θ + cos 2 (ω 0 Δt ) sin 2 θ )] . (3.75)
The operation suggested in the following expression is developed employing Equation
3.57.
v0 − v −1 ⋅ v +1 = V p2 sin 2 θ − v −1 ⋅ v +1 .
2
(3.76)
Replacing Equation 3.75 in Equation 3.76, and simplifying produces
v0 − v −1 ⋅ v +1 = V p2 sin 2 (ω 0 Δt ) .
2
(3.77)
Thus, the magnitude of the phasor is given by
v0 − v −1v +1
2
V p2 = . (3.78)
sin 2 (ω 0 Δt )
3.4.4.2 Advantages and disadvantages of short window techniques
Short window algorithms are simple techniques that use a few samples and can be
implemented with few computations. The estimation of phasor with short window
techniques is, therefore, relatively quick. However, short window techniques are
98](https://image.slidesharecdn.com/phdthesissandroaquiles060724-121017023005-phpapp01/75/Thesis-for-Power-System-protection-in-Brief-133-2048.jpg)
![adversely affected by the presence of decaying DC and harmonic components in the
waveform. Additionally, these techniques amplify the noise, which adversely affects the
phasor estimates.
3.4.4.3 Non-recursive long window techniques
Long window techniques use data from one-half cycle of the fundamental frequency.
Modern numerical relays typically use 64 samples per cycle. Discrete Fourier
Transform (DFT), Least Error Square and Walsh Function algorithms are among the
most popular phasor estimation techniques employed in numerical relays.
3.4.4.3.1 Discrete Fourier Transform algorithm
A periodic waveform can be expressed as a linear combination of two orthogonal
functions. The Discrete Fourier Transform algorithm (DFT) employs the sine and
cosine functions, which are well known orthogonal functions, to estimate the phasors of
sinusoidal waveforms. Two functions f(x) and g(x) are orthogonal over the interval [a,
b] if the following expression is satisfied.
b
f ( x) ⊥ g ( x) ≡ ∫ f ( x) g ( x)dx
a (3.79)
=0
The orthogonality of f(x) = sin (x) and g(x) = cos(x) in the interval [-π, +π] is determined
by the following expression.
+π
sin( x) ⊥ cos( x) ≡ ∫ sin( x) cos( x)dx
−π (3.80)
=0
99](https://image.slidesharecdn.com/phdthesissandroaquiles060724-121017023005-phpapp01/75/Thesis-for-Power-System-protection-in-Brief-134-2048.jpg)
![W = sin( x) ⊥ cos( x) is an orthonormal basis in the interval [-π, +π]. The projection of a
function f(ωt) over the orthonormal basis W is
projW [ f (ωt )] = f (ωt ), sin(ωt ) sin(ωt ) + f (ωt ), cos(ωt ) cos(ωt ) . (3.81)
Consider that the phasor of the following sinusoidal waveform is to be estimated.
v (ωt ) = V p sin (ωt + θ ) . (3.82)
The orthogonality of the sinusoidal waveform and the sine function is evaluated using
Equation 3.79 as follows.
+π
v(ωt ), sin(ωt ) = ∫ (V p sin (ωt + θ )sin ωt )dωt
−π . (3.83)
= πV p cos θ
Solving to the well-know expression Vp cosθ produces
1 +π
V p cos θ =
π ∫−π (V p sin (ωt + θ )sin ωt )dωt . (3.84)
Similarly, the evaluation of the orthogonality of the sinusoidal waveform and the cosine
function is given by the following equation.
+π
v (ωt ), cos(ωt ) = ∫ (V p sin (ωt + θ ) cos ωt )dωt
−π . (3.85)
= πV p sin θ
And,
100](https://image.slidesharecdn.com/phdthesissandroaquiles060724-121017023005-phpapp01/75/Thesis-for-Power-System-protection-in-Brief-135-2048.jpg)
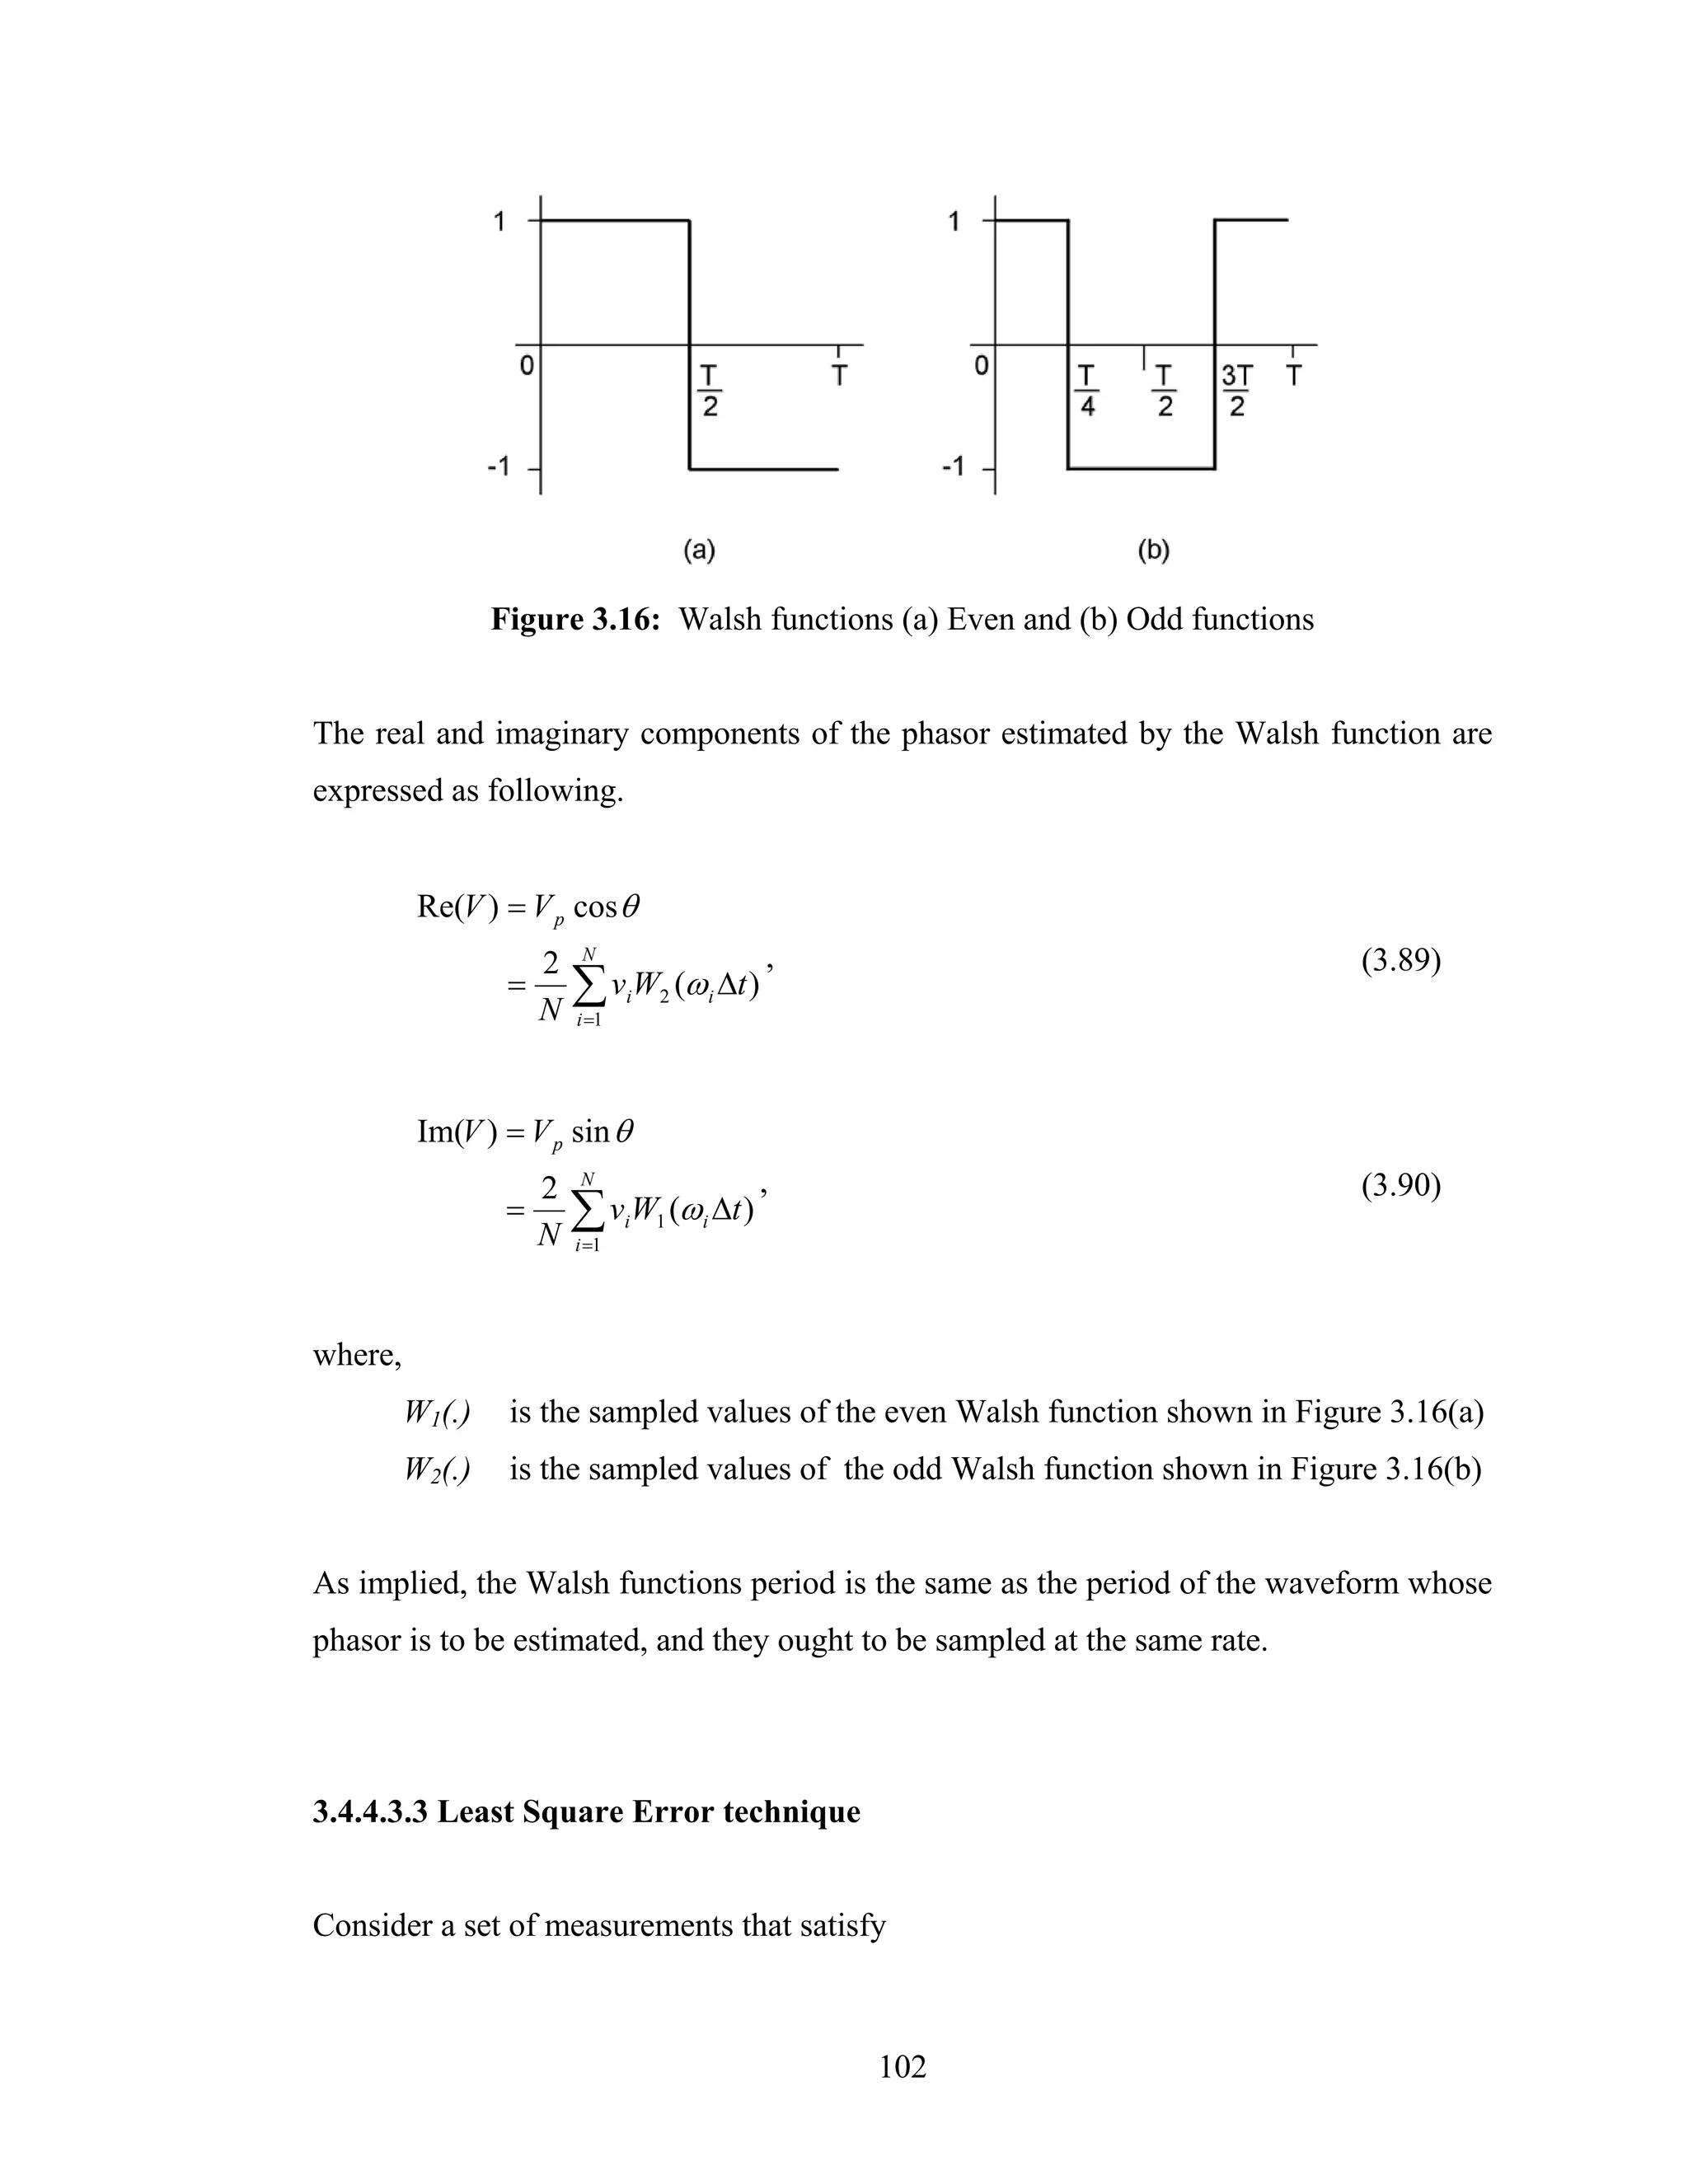
![a + bt = m , (3.91)
where,
m is a measurement
a, b are unknown parameters to be estimated
ˆ
If a and b are the estimated values, then
ˆ
ˆ ˆ
a + bt − m = ε , (3.92)
where,
ε is the error between estimation and measurement.
If n measurements are taken at regular intervals, they can be arranged in the matrix form
as follows.
⎡1 t1 ⎤ ⎡ m1 ⎤ ⎡ ε1 ⎤
⎢1 ⎥ a ⎢ m ⎥ ⎢ε ⎥
t2 ⎥ ⎡ ˆ ⎤ ⎢ 2 ⎥ ⎢ 2 ⎥
⎢ =
⎢... ˆ −
...⎥ ⎢b ⎥ ⎢ ... ⎥ ⎢ ... ⎥
. (3.93)
⎣ ⎦
⎢ ⎥ ⎢ ⎥ ⎢ ⎥
⎣1 tn ⎦ ⎣mn ⎦ ⎣ε n ⎦
The previous expression also can be written in the following fashion.
[A][x] − [m] = [ε ] .
ˆ (3.94)
Errors deviated from the actual measurements may be positive or negatives. A better
way to assess the error is by finding the error squared.
[ε ]T [ε ] = [[x]T [A]T [A][x]] − 2[x]T [A]T [m] + [m]T [m]
ˆ ˆ ˆ (3.95)
103](https://image.slidesharecdn.com/phdthesissandroaquiles060724-121017023005-phpapp01/75/Thesis-for-Power-System-protection-in-Brief-138-2048.jpg)
![The sum of the squares of the errors is minimum if the first derivative of the sum of the
squares of the errors is zero. To determine the condition for the minimum sum of the
squares of the errors the following equation should be satisfied. Simplifying,
d
dt
[ ]
[ε ]T [ε ] = 2[A]T [A][x] − 2[A]T [m]
ˆ
(3.96)
= [0]
[x] = ⎡[[A]T [A]] [A]T ⎤[m]
−1
ˆ
⎢⎣ ⎥ ⎦ (3.97)
= [A] [m]
−L
The matrix [A]-L is known as the Left pseudo-inverse matrix of [A]. If [A] is a [n x p]
matrix, with n samples and p unknowns, the Left pseudo-inverse matrix of [A] is a [p x
n] matrix. If the sampling times are known in advance, the Left pseudo-inverse matrix
of [A] can be calculated in advance in an off-line mode. Once the sampling data is
available, the phasor representing the waveform can be calculated using Equation (3.97).
This procedure is known as the Least Square Error (LSE) algorithm.
In LSE, it is assumed that the sampled waveforms of voltages and currents are sinusoidal
waveforms of known frequencies (fundamental frequency and harmonics). Thus, a
couple of orthogonal sinusoidal functions, related to each frequency of interest, are
included in the LSE estimation process. Consider the following voltage waveform
expression.
v = Vnp sin( nωt + θ n ) , (3.98)
where,
n is an integer showing the multiple of fundamental frequency
Vnp is the peak magnitude of the waveform
ω is the fundamental frequency
104](https://image.slidesharecdn.com/phdthesissandroaquiles060724-121017023005-phpapp01/75/Thesis-for-Power-System-protection-in-Brief-139-2048.jpg)
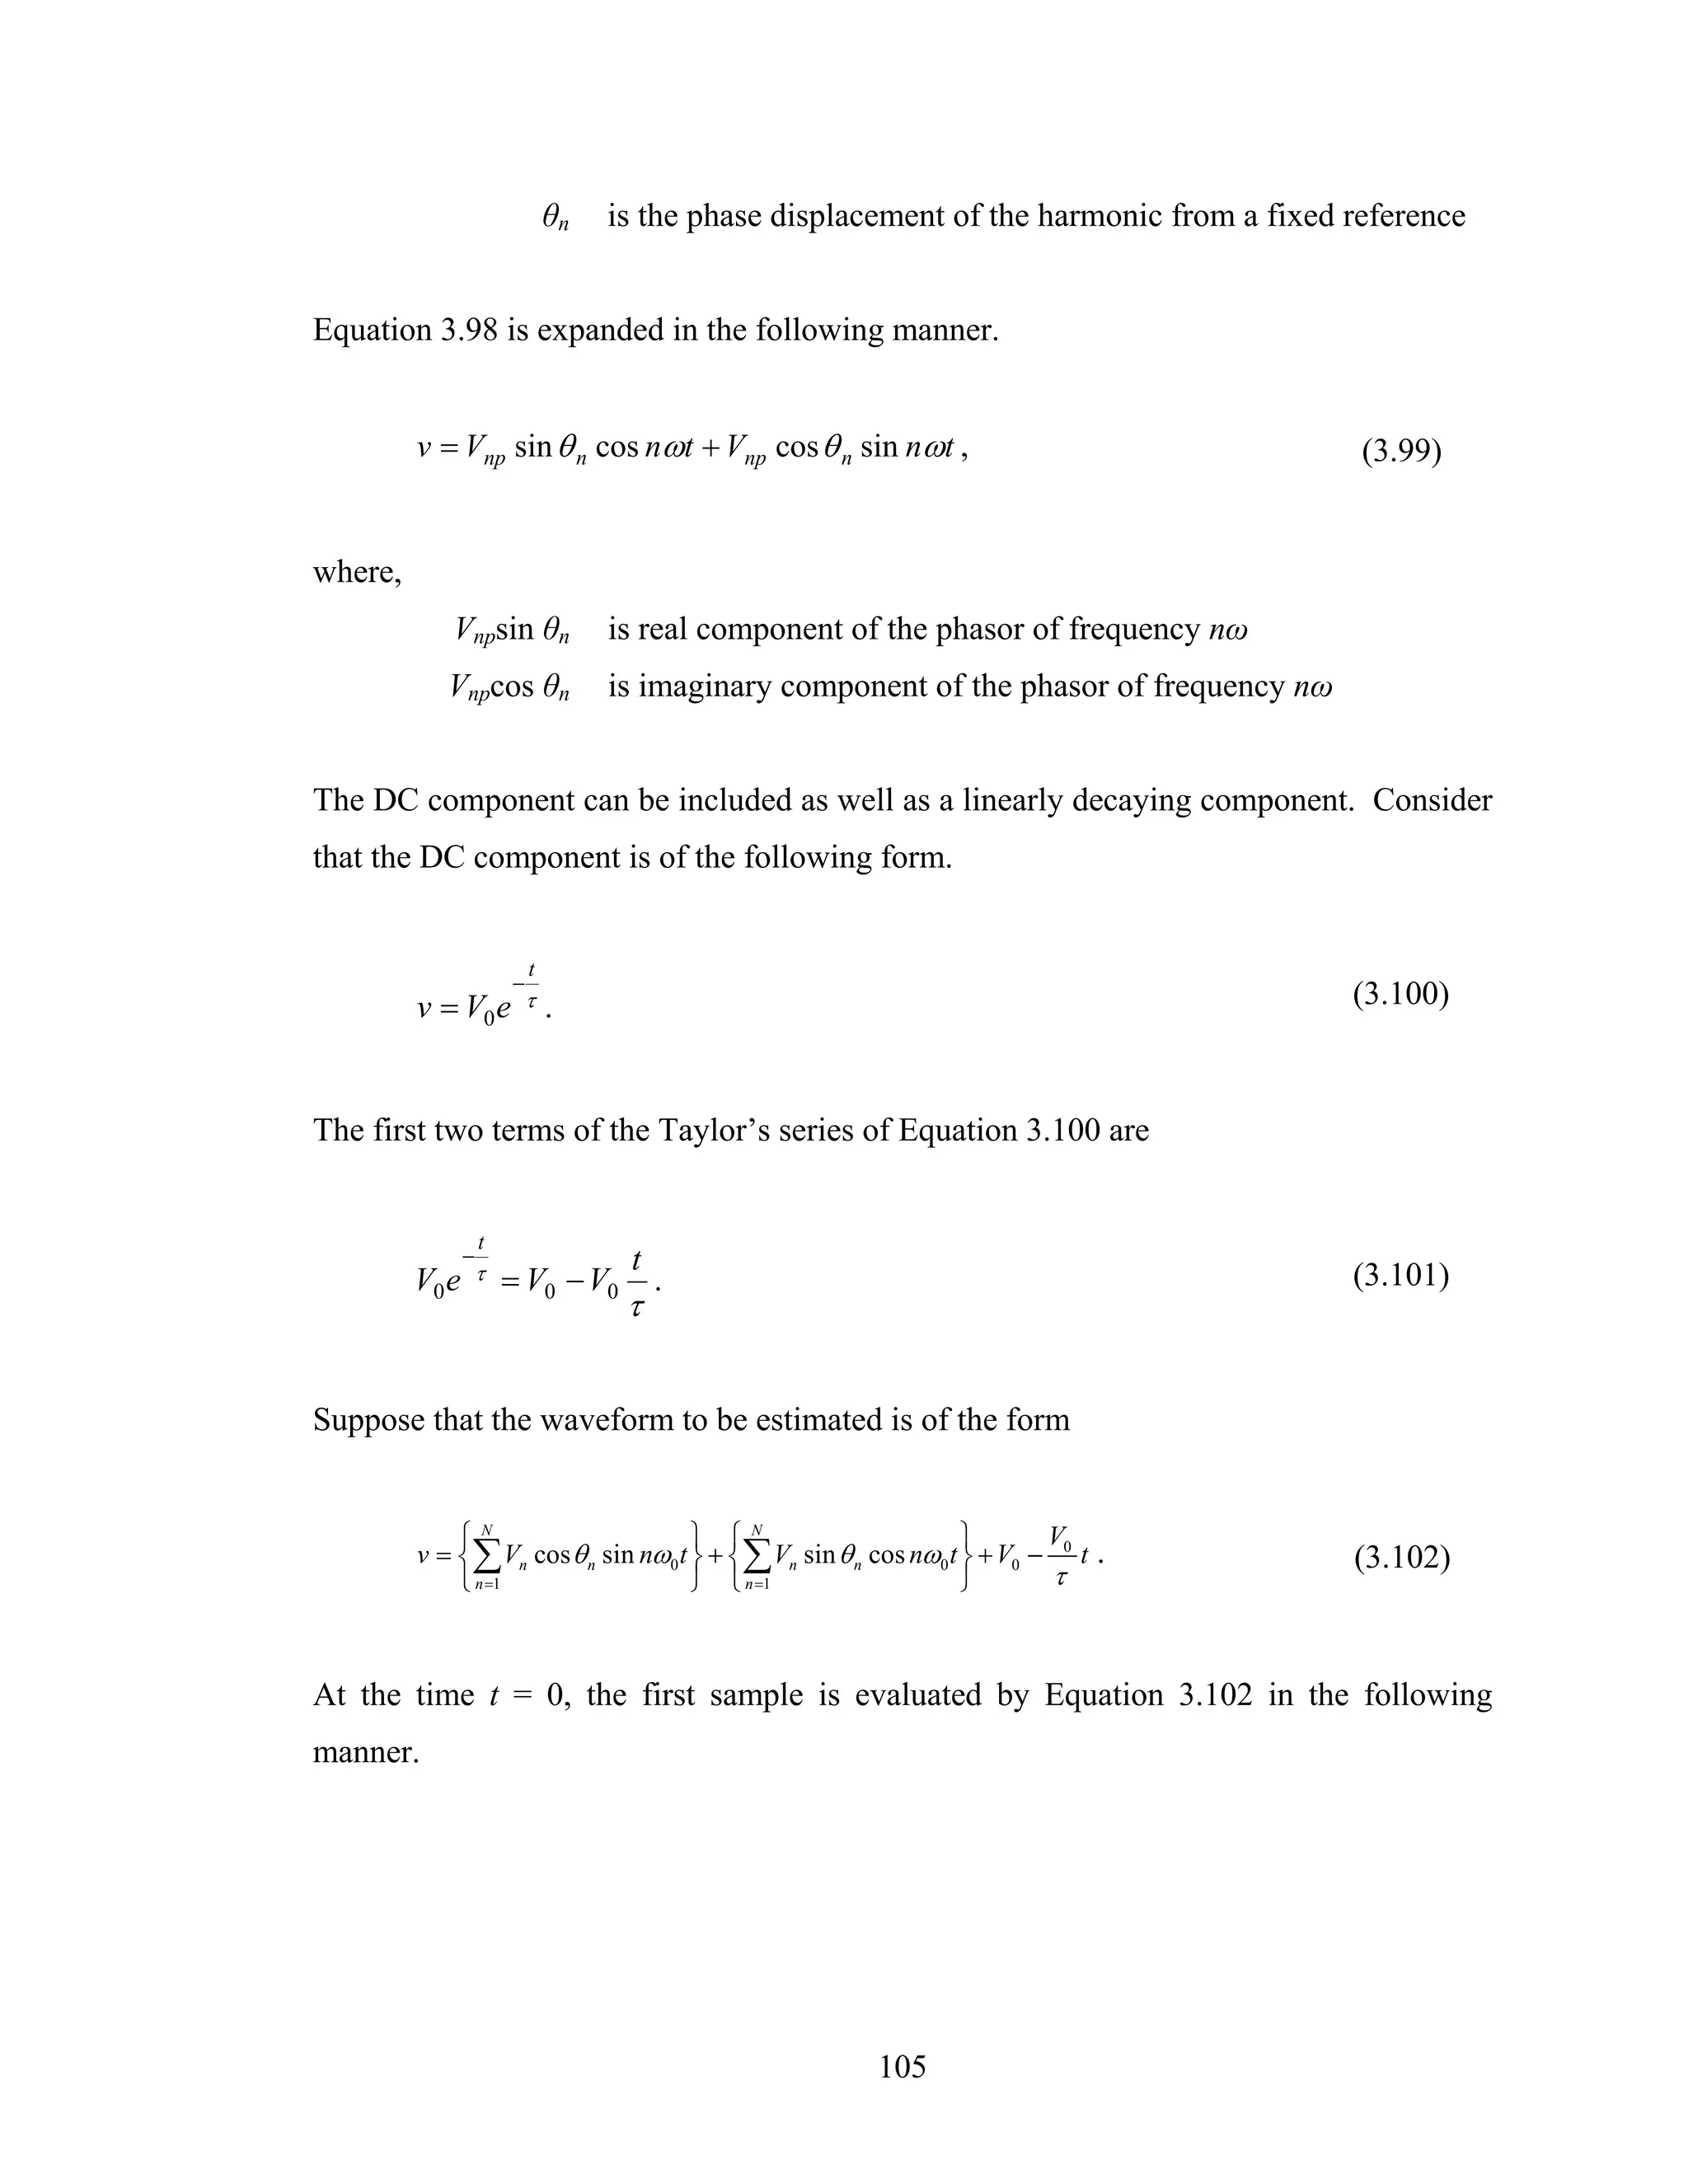
![v0 = V1 sin[ω0 (0)Δt ]cos θ1 + V1 cos[ω0 (0)Δt ]sin θ1
+V2 sin[2ω0 (0)Δt ]cos θ 2 + V2 cos[2ω0 (0)Δt ]sin θ 2
+...
(3.103)
+VN sin[ N ω0 (0)Δt ]cos θ N + VN cos[ N ω0 (0)Δt ]sin θ N
V0
+V0 − (0)
τ
Similarly, at t = Δt, the second sample can be expressed as
v+1 = V1 sin[ω0 (1)Δt ]cos θ1 + V1 cos[ω0 (1)Δt ]sin θ1
+V2 sin[2ω0 (1)Δt ]cos θ 2 + V2 cos[2ω0 (1)Δt ]sin θ 2
+...
(3.104)
+VN sin[ N ω0 (1)Δt ]cos θ N + VN cos[ N ω0 (1)Δt ]sin θ N
V0
+V0 − (1Δt )
τ
If N samples are processed, the matrix [A] is as follows.
⎡ sin [ω0 ( 0 )Δt] sin [ω0 ( 0 )Δt] ... sin [Nω0 ( 0 )Δt] cos [Nω0 ( 0 )Δt] 1 0 ⎤
⎢ ⎥
sin [ω0 ( 1 )Δt] cos [ω0 ( 1 )Δt] ... sin [Nω0( 1 )Δt] cos [Nω0( 1 )Δt] 1 1 ⎥
[A] = ⎢ (3.105)
⎢ ... ... ... ... ... ... ... ⎥
⎢ ⎥
⎢
⎣sin [ω0(N − 1 )Δt] cos [ω0(N − 1 )Δt] ... sin [Nω0 (N − 1 )Δt] sin [Nω0(N − 1 )Δt] 1 N − 1⎥⎦
The Left pseudo-inverse matrix of [A] is calculated using Equation 3.97. The real and
imaginary components of the estimated sinusoidals are estimated as following.
⎡ V1 sin θ1 ⎤ ⎡ v0 ⎤
⎢ V cos θ ⎥ ⎢v ⎥
⎢ 1 1 ⎥
⎢ +1 ⎥
⎢ V2 sin θ 2 ⎥ ⎢ v+2 ⎥
⎢ ⎥ ⎢ ⎥
⎢ V2 cos θ 2 ⎥ ⎢ v +3 ⎥
⎢ ... ⎥ −L ⎢ ⎥
⎢ ⎥ = [ A] ⎢ ... ⎥ (3.106)
⎢V N sin θ N ⎥ ⎢ v N −3 ⎥
⎢V cos θ ⎥ ⎢v ⎥
⎢ N N
⎥ ⎢ N −2 ⎥
⎢ V0 ⎥ ⎢ v N −1 ⎥
⎢ V ⎥ ⎢ ⎥
⎢ − 0 ⎥ ⎣ vN ⎦
⎣ τ ⎦
106](https://image.slidesharecdn.com/phdthesissandroaquiles060724-121017023005-phpapp01/75/Thesis-for-Power-System-protection-in-Brief-141-2048.jpg)
![and it does not require modifying the internal subroutines of the emtp or compiling an
external signal-processing program with the emtp.
4.2.1 Tools required in the methodology
The following are the two major tools necessary to develop the proposed protection
system model designing methodology.
• An electromagnetic transient program (emtp) to model and simulate the normal,
faulted and transitory operation states of power systems.
• A computer program to design digital and numerical relay models accordingly to
the specifications and adjustments required to protect the elements of the power
system modeled in the emtp.
For the purposes of the present project, the emtp selected to model the power system is
PSCAD/EMTDC. PSCAD/EMTDC is a program developed in the Manitoba HVDC
Research Centre (Manitoba Hydro) [44]. The primary solution engine is known as
EMTDC, and the graphical user interface is named PSCAD. A more extensive
introduction of PSCAD/EMTDC has been given in section 1.4.
Additionally, a Visual C++-based computer program, named PLSA, has been created to
design numerical relay models. The user of PLSA enters, through a friendly user
interface, data related to the specific relay that is to be designed or modeled. Once
PLSA has obtained the data from the user, it processes the information and creates a
piece of code that represents the different internal modules and functions of the
numerical relay model. PLSA stores the piece of code generated on a FORTRAN file,
for storage purposes. For each numerical relay model, a FORTRAN file is created,
keeping a sequence of variables between files, which will give consistency to the
simulation once they are incorporated to the modeled power system on
PSCAD/EMTDC.
110](https://image.slidesharecdn.com/phdthesissandroaquiles060724-121017023005-phpapp01/75/Thesis-for-Power-System-protection-in-Brief-145-2048.jpg)
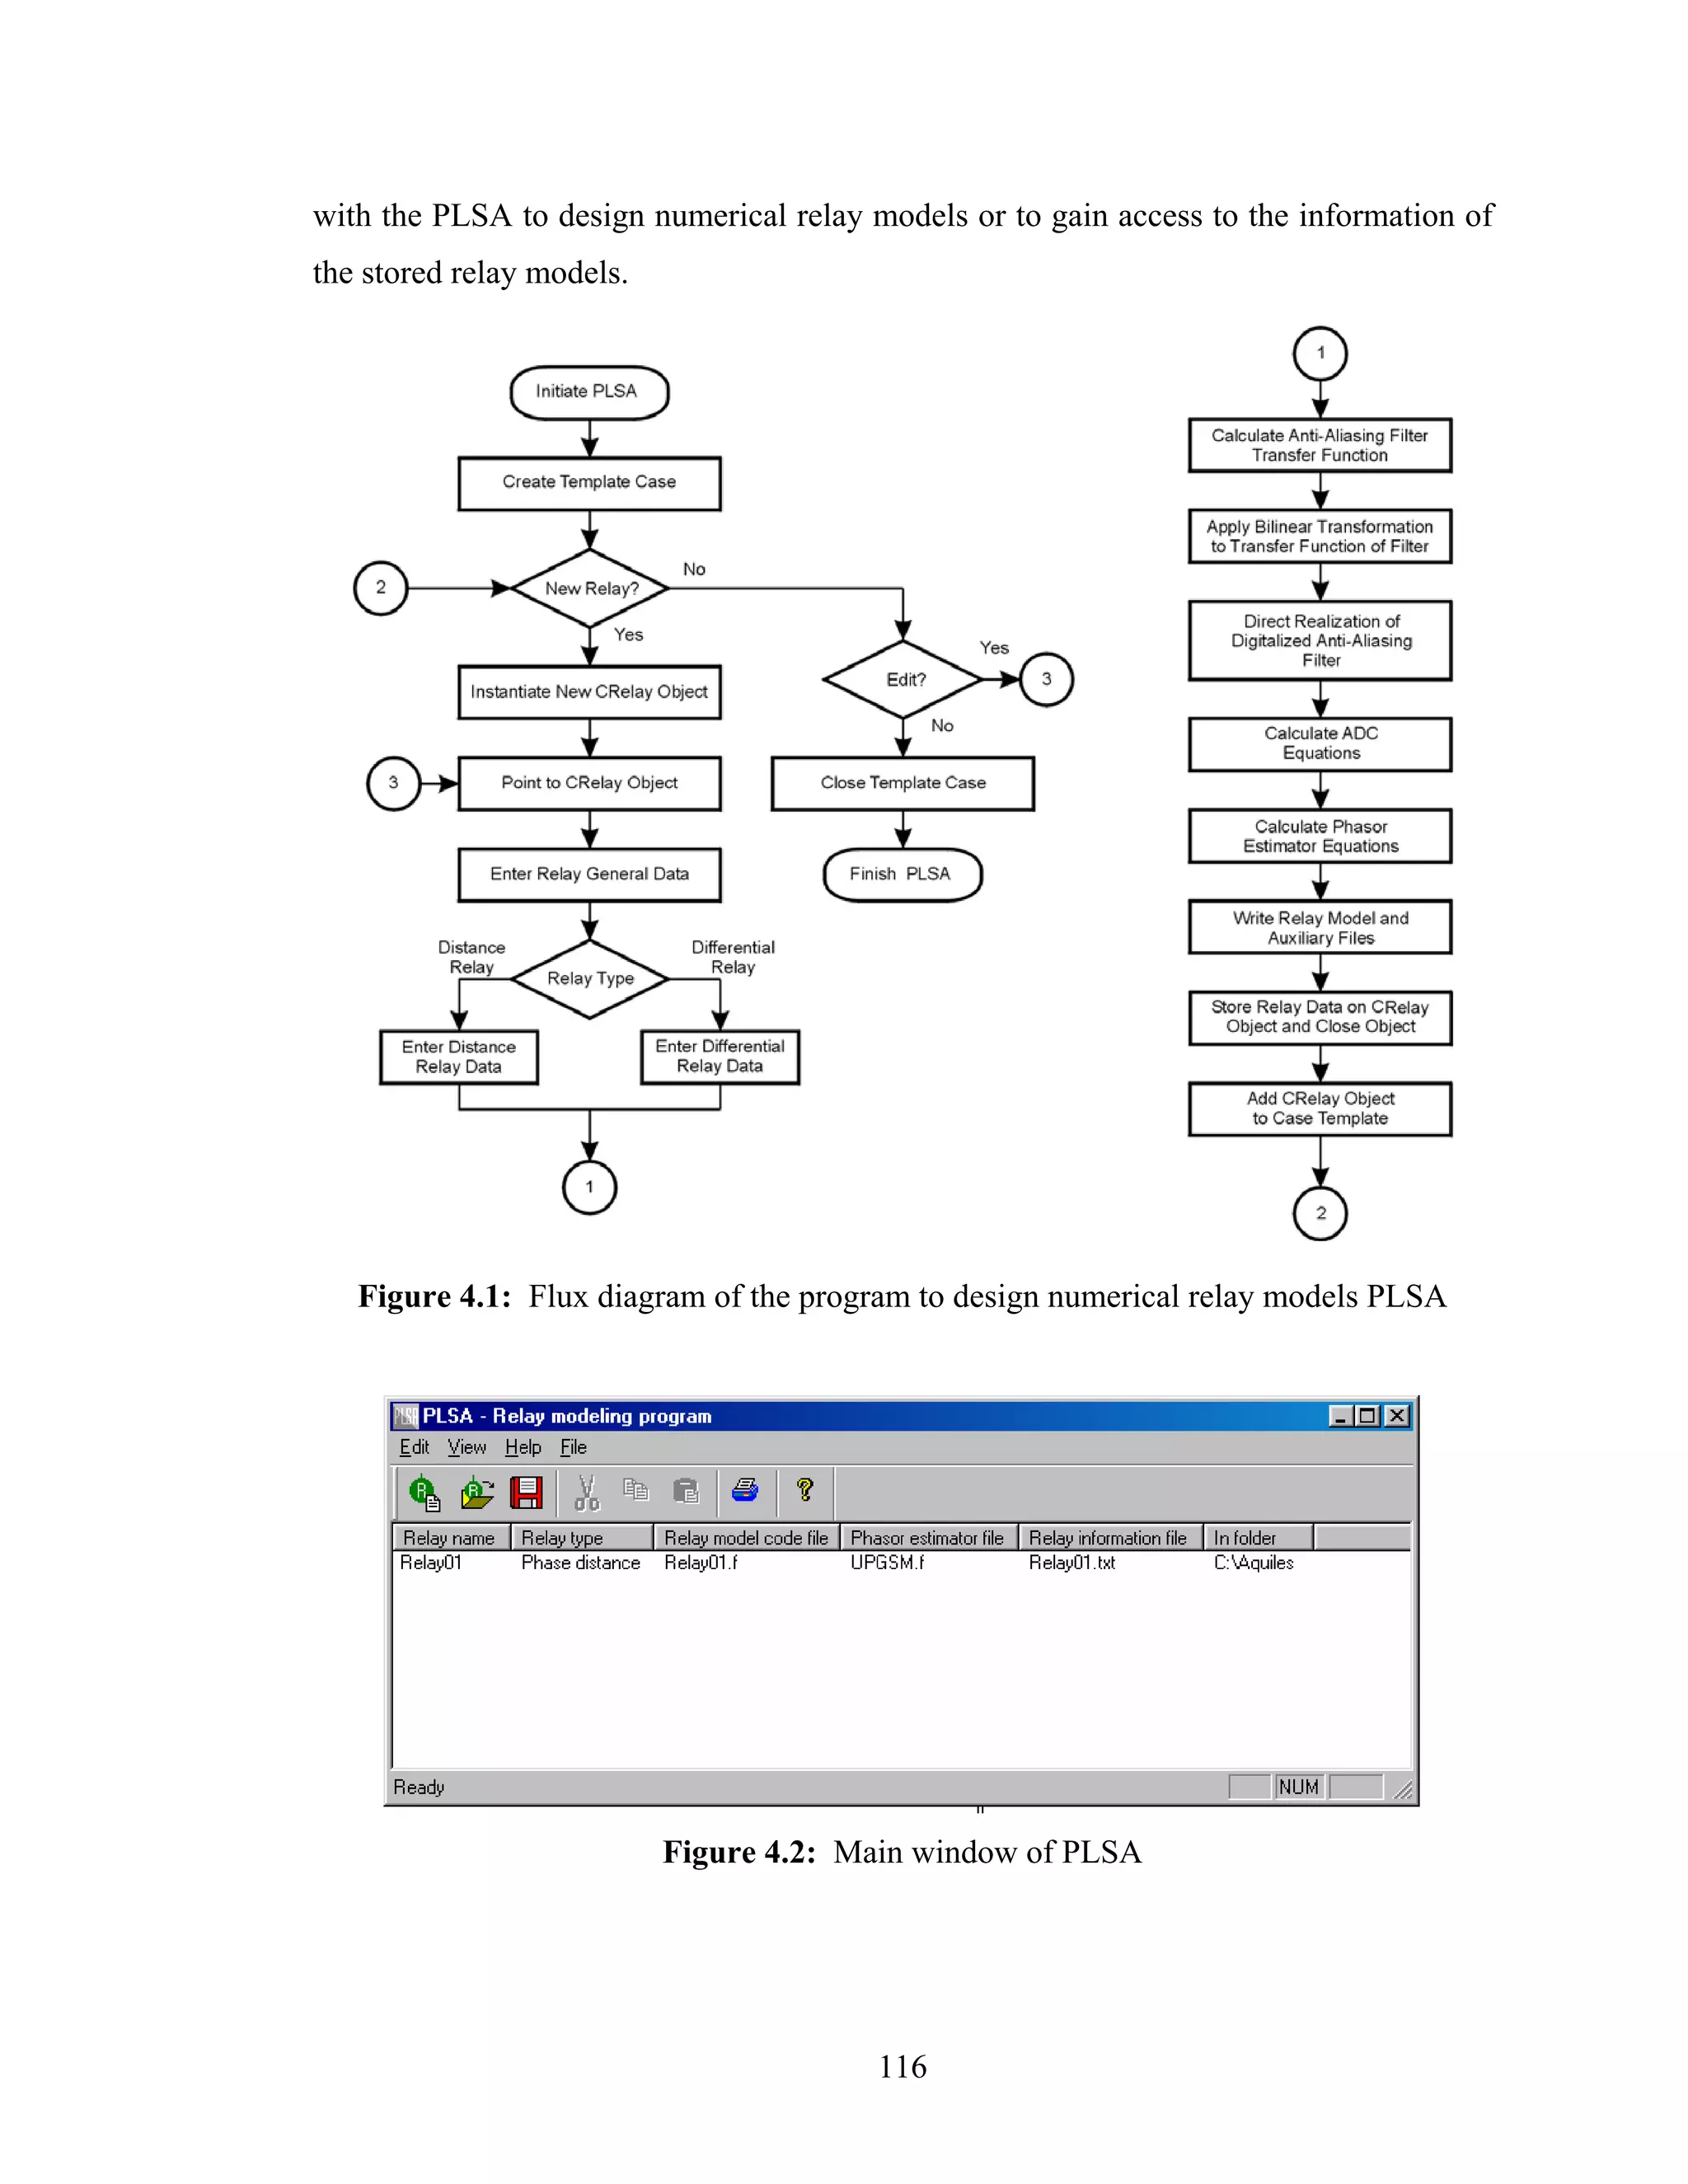
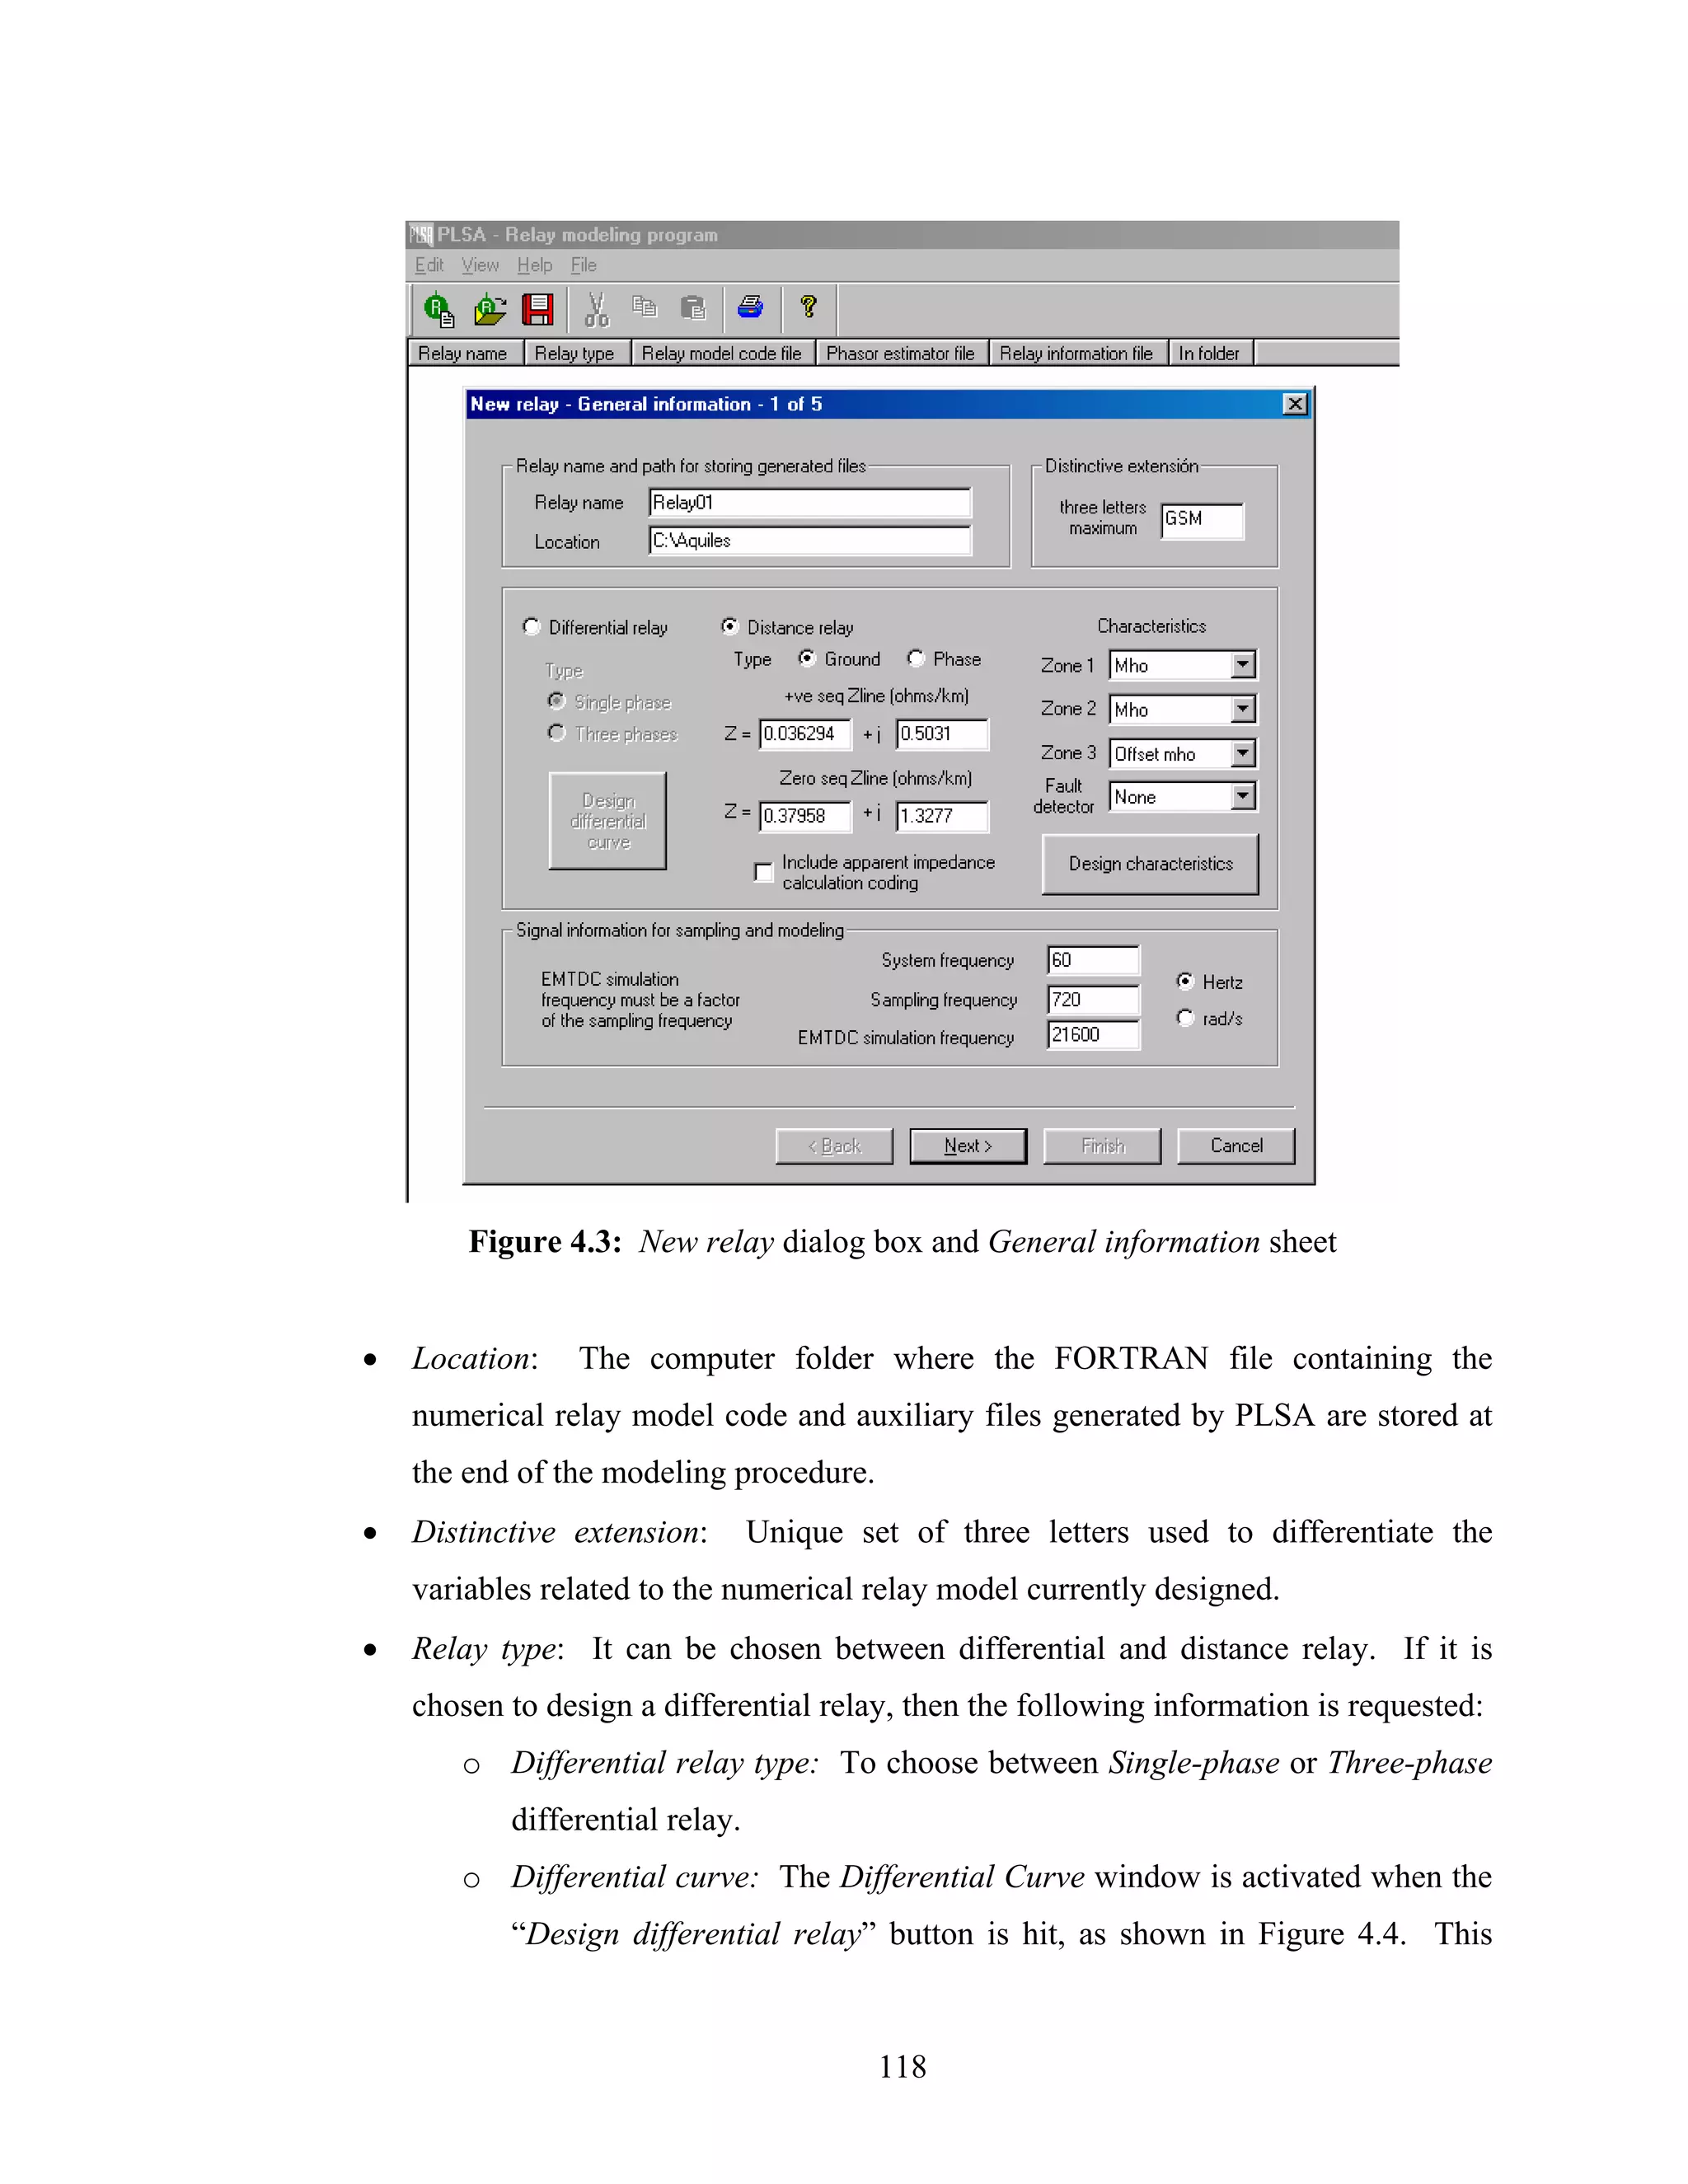
![window request information of the coordinates of the Pickup current [Ipx,
Ipy], the First slope angle (Alpha1), the coordinates of the Change of
slope point [Isx, Isy] and the Second slope angle (Αlpha2).
Figure 4.4: Differential curve window
If distance relay design is chosen, then the following information is requested.
o Distance relay type: To choose between Ground and Phase relay. If
Ground relay is chosen, then it is asked to enter the data of the positive
and zero sequence transmission line impedance, necessary for current
compensation calculations.
o Include apparent impedance calculation coding: When this checkbox is
selected, PLSA includes in the generated code the calculations of the
apparent impedance seen by the relay. The names of the variables of the
apparent impedance are described in appendix C of this thesis.
119](https://image.slidesharecdn.com/phdthesissandroaquiles060724-121017023005-phpapp01/75/Thesis-for-Power-System-protection-in-Brief-154-2048.jpg)
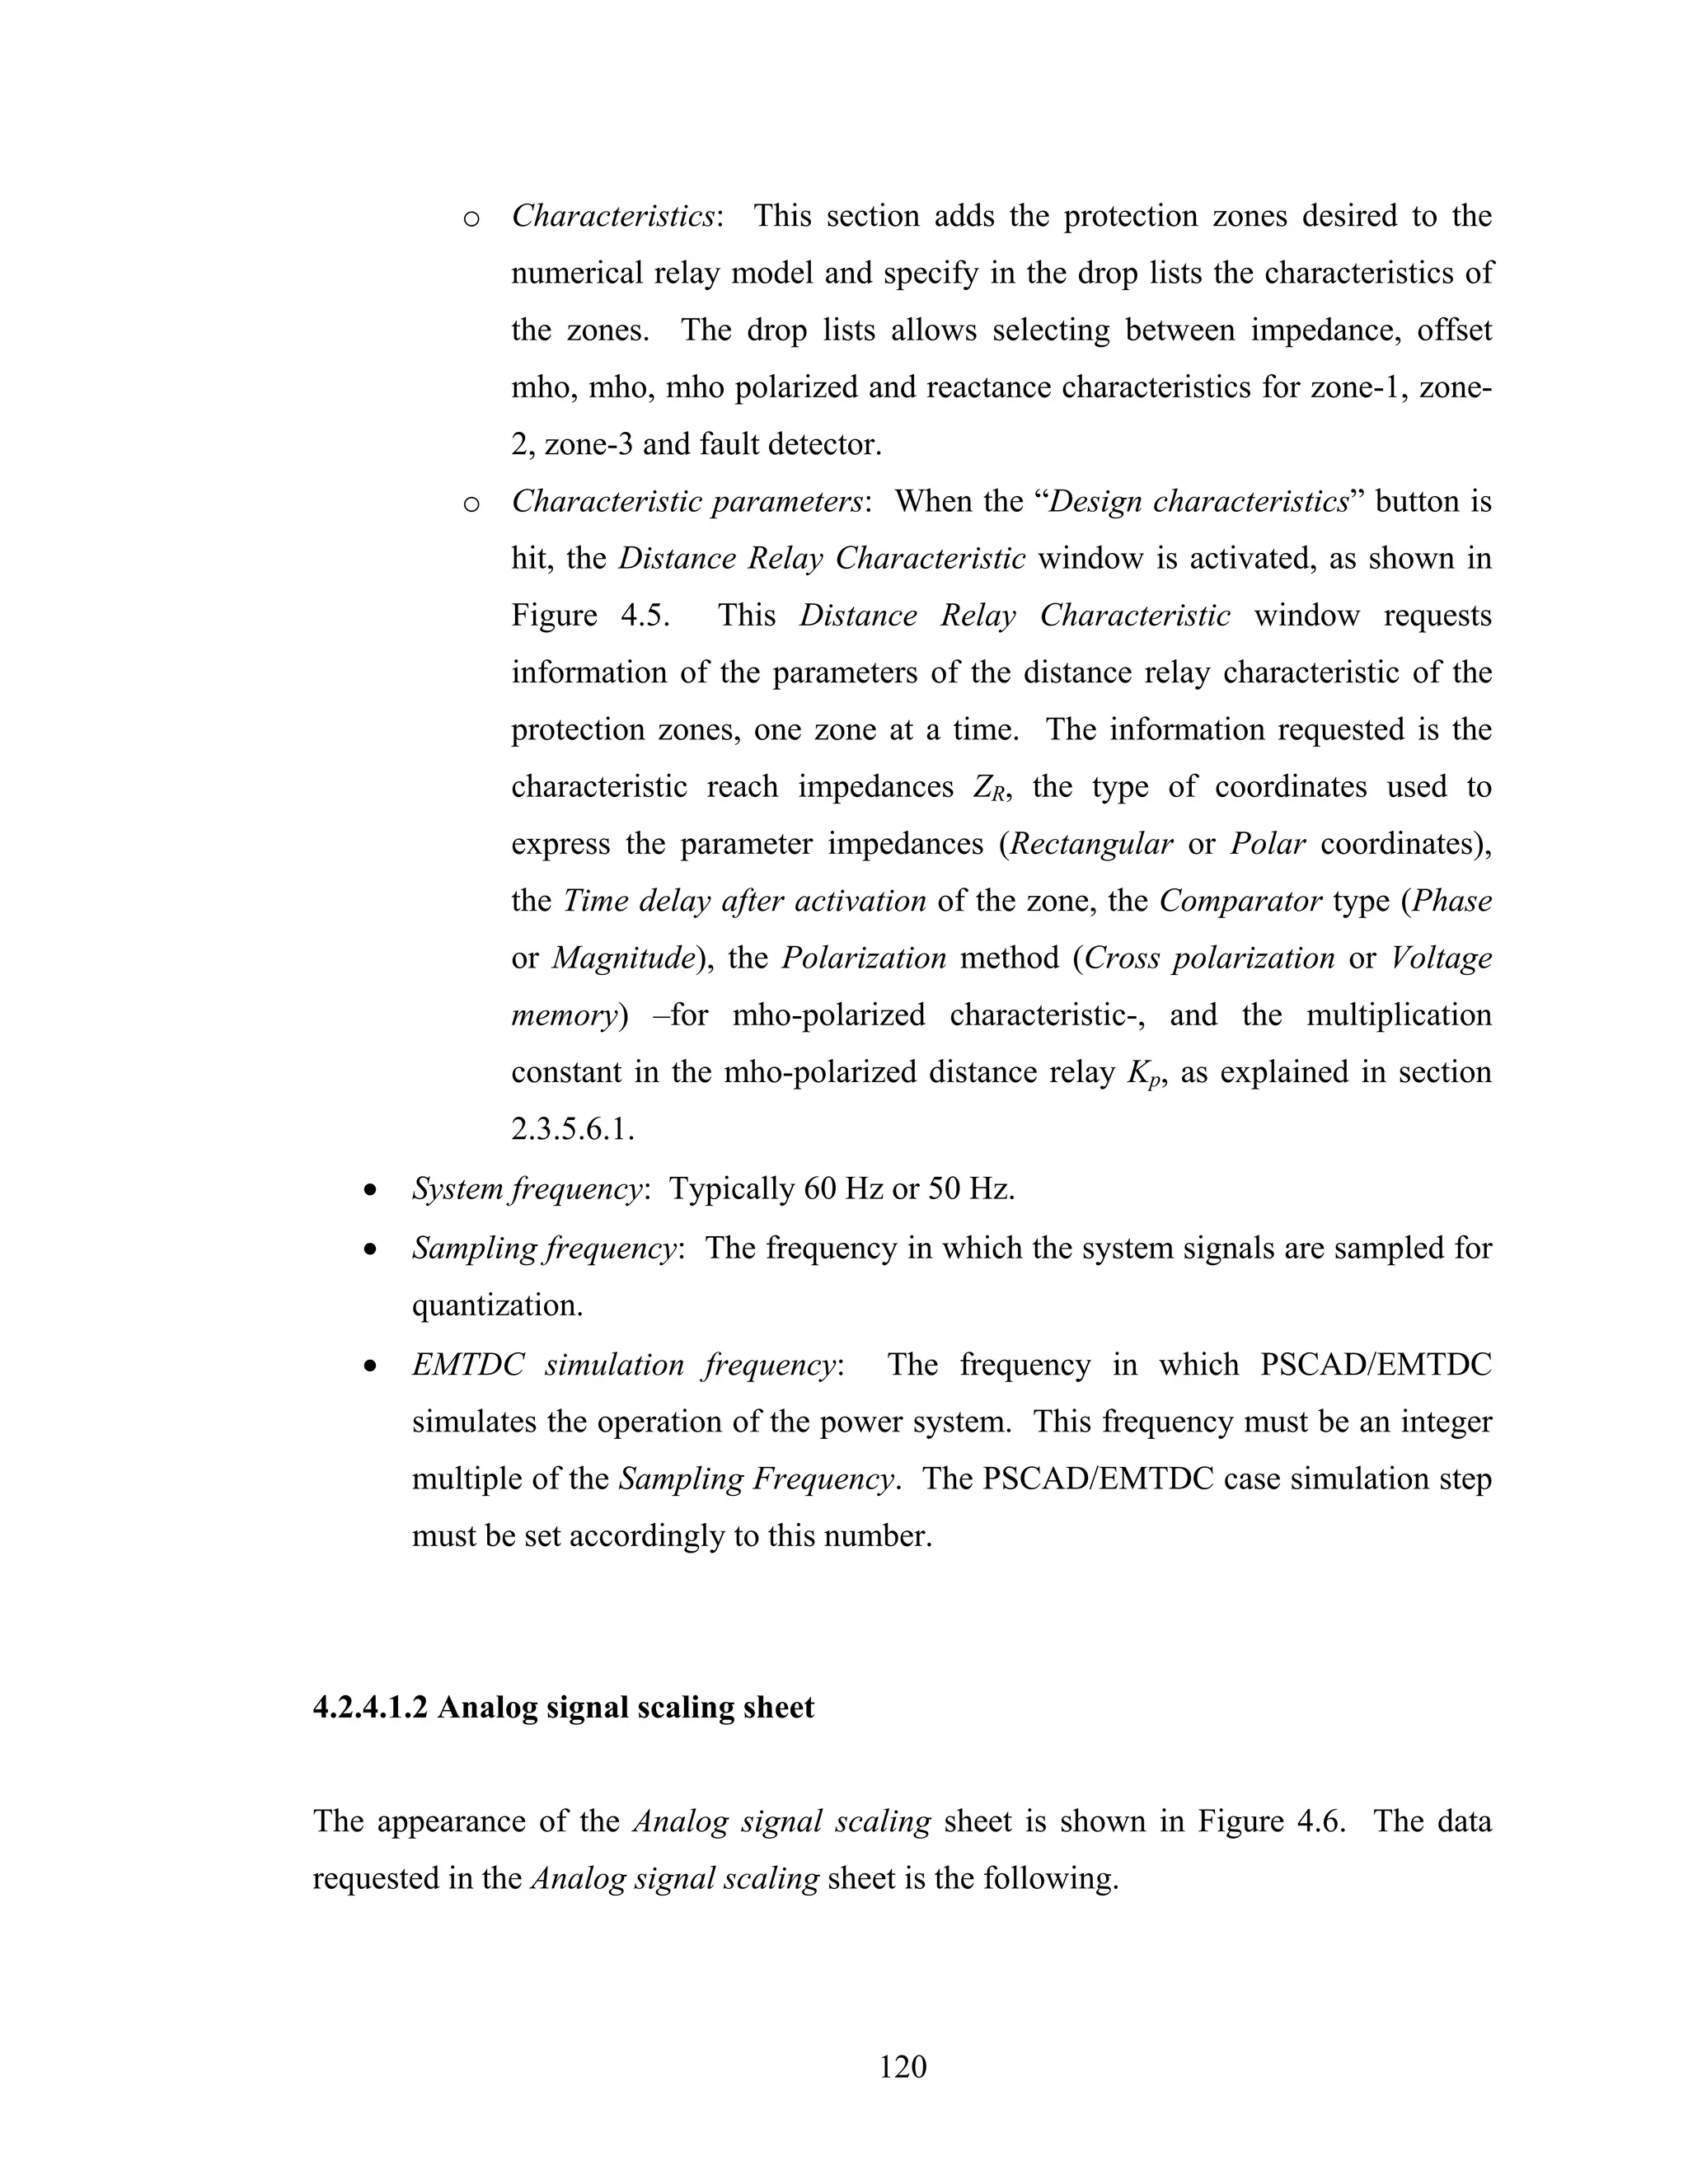
![Figure 4.5: Distance relay characteristic window
• Current and voltage scaling factors: PSCAD/EMTDC and PLSA could be using
different units for current and voltage signals. To match the units, it is requested
to enter the scale factors that convert the PSCAD/EMTDC currents into amperes
and the PSCAD/EMTDC voltages into volts.
• Auxiliary current and voltage transformer rate: It is transformer rate of the
auxiliary current and voltage transformers employed to scale down the current
and voltage system signals to the operational voltage levels of the numerical
relay.
• Internal voltage to scale: Voltage range to which the current and voltage input
signals are scaled down for further digitalization. The scale-down voltage range
can be chosen to be between zero and a positive value of voltage x ([0, x]), or
between –x and +x ([-x, x]). In both cases, it is required to enter the voltage
value x.
121](https://image.slidesharecdn.com/phdthesissandroaquiles060724-121017023005-phpapp01/75/Thesis-for-Power-System-protection-in-Brief-156-2048.jpg)
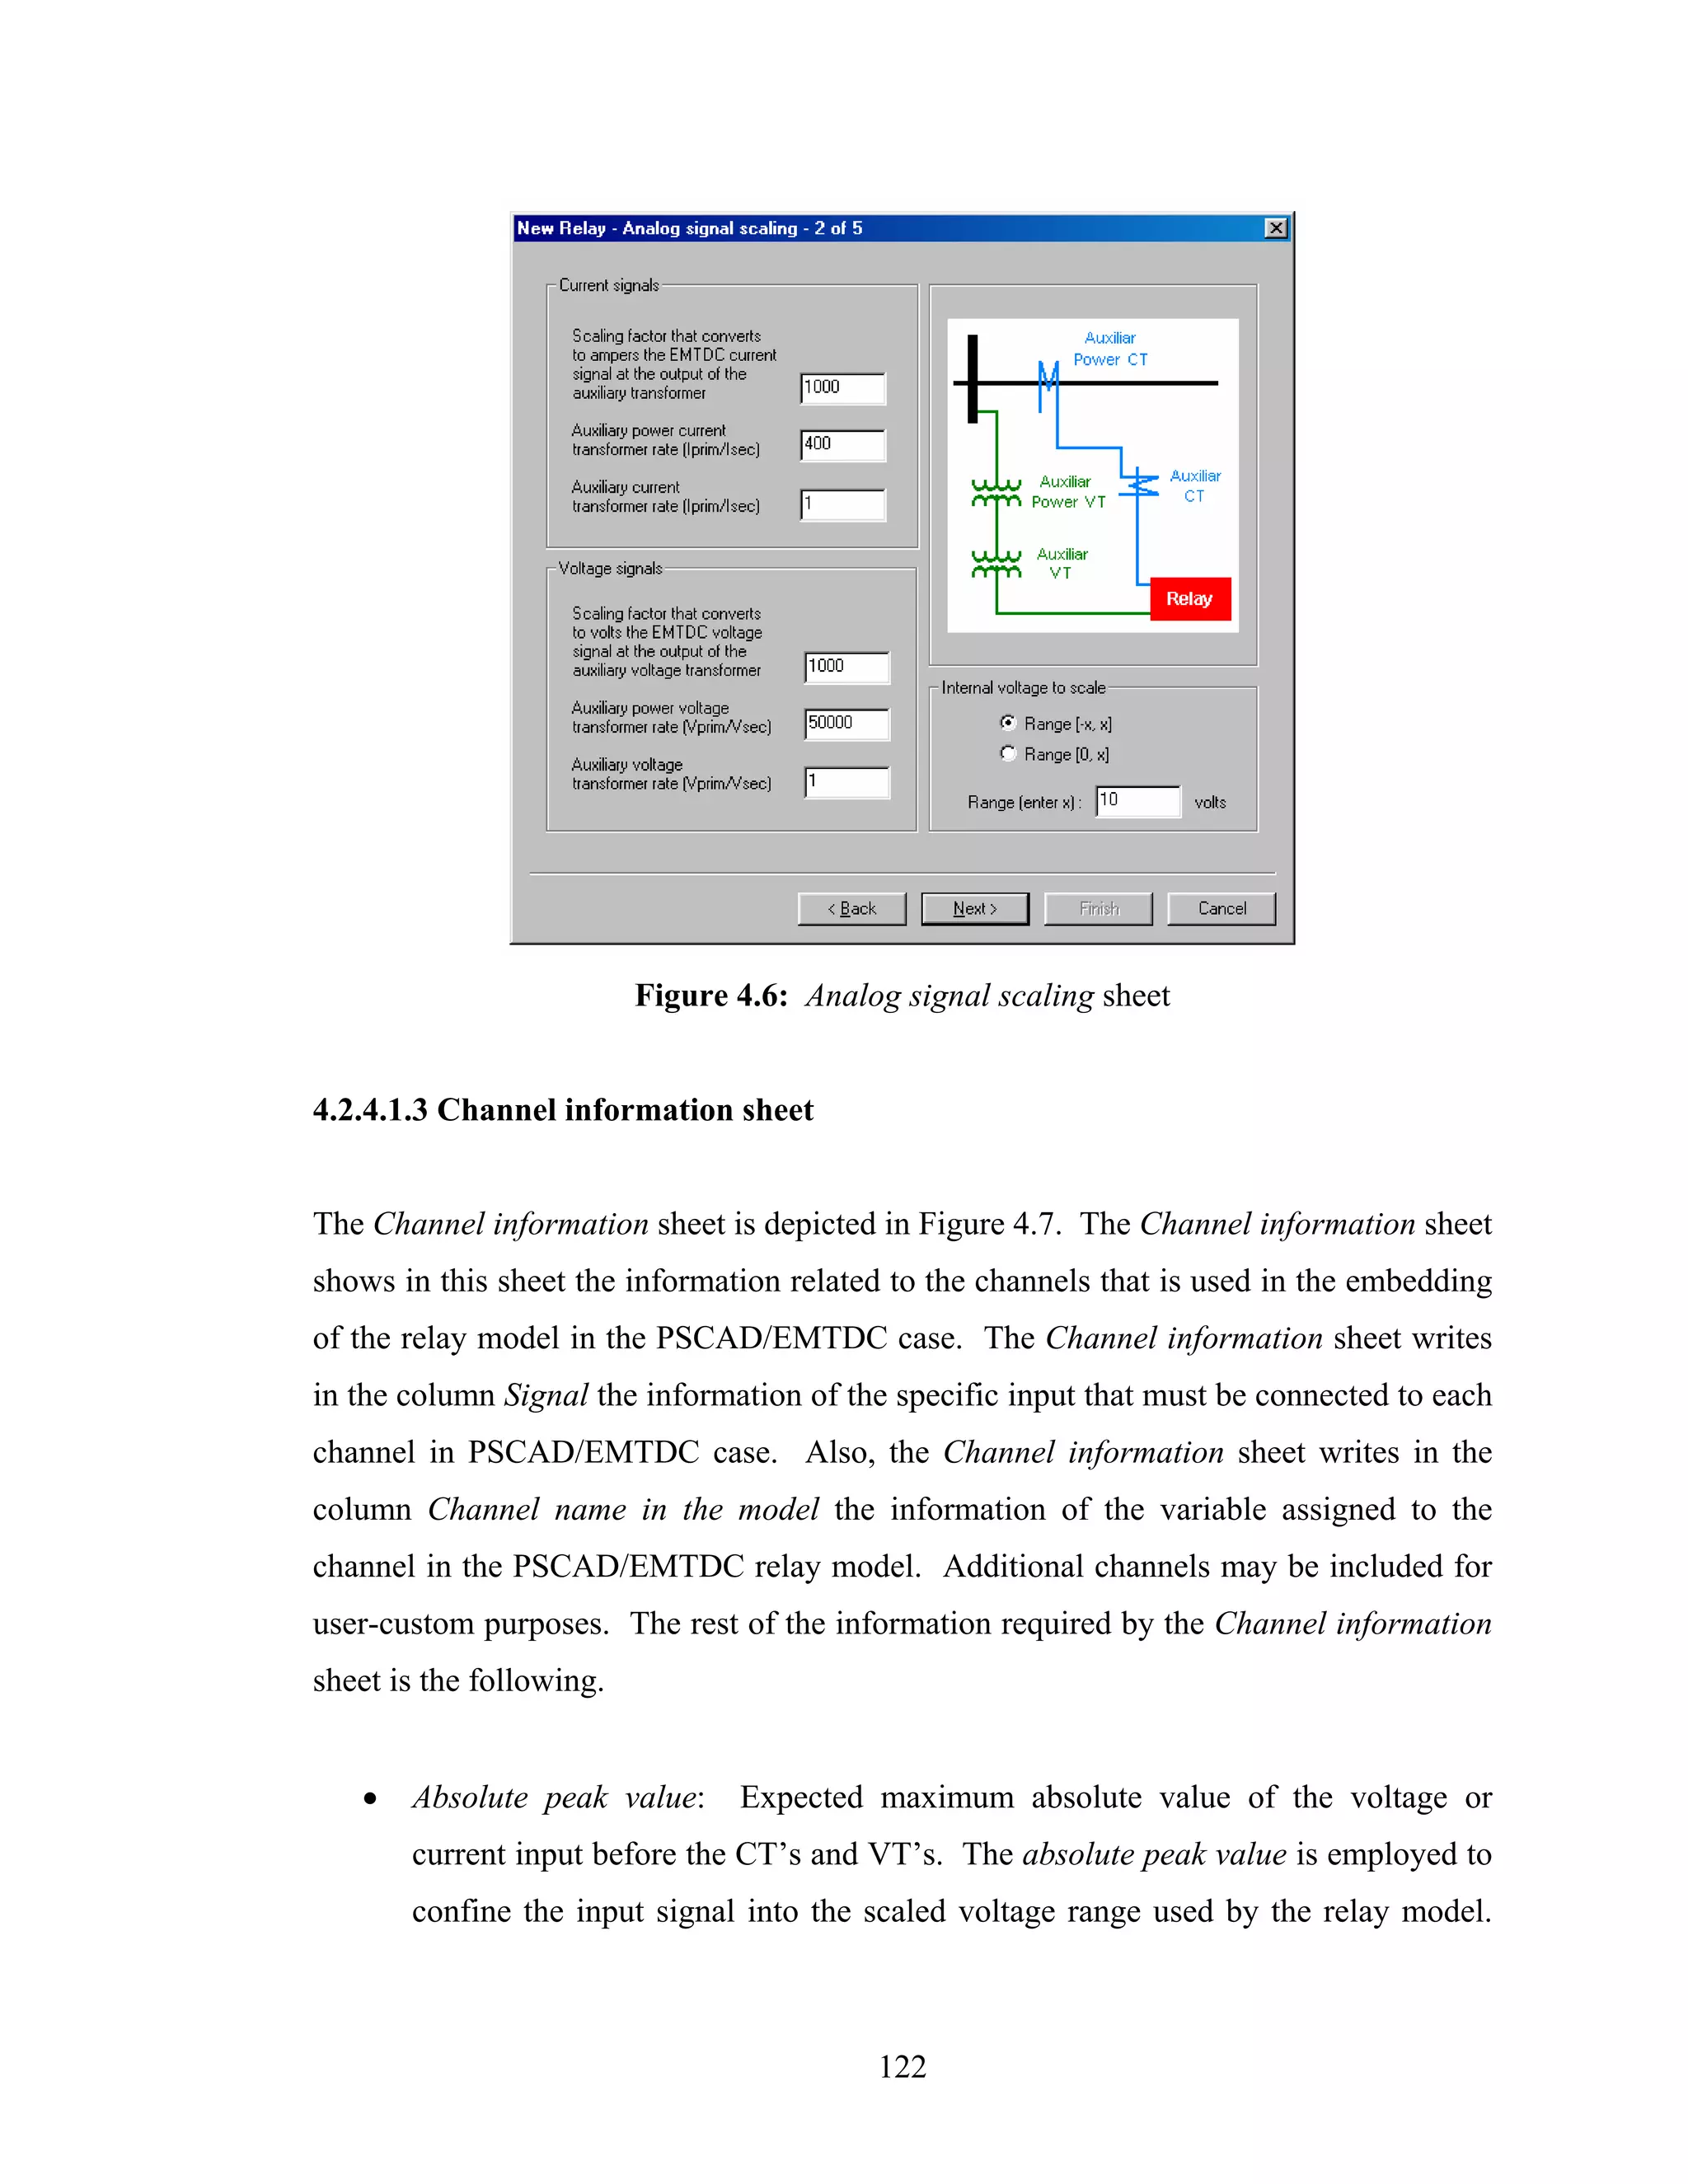
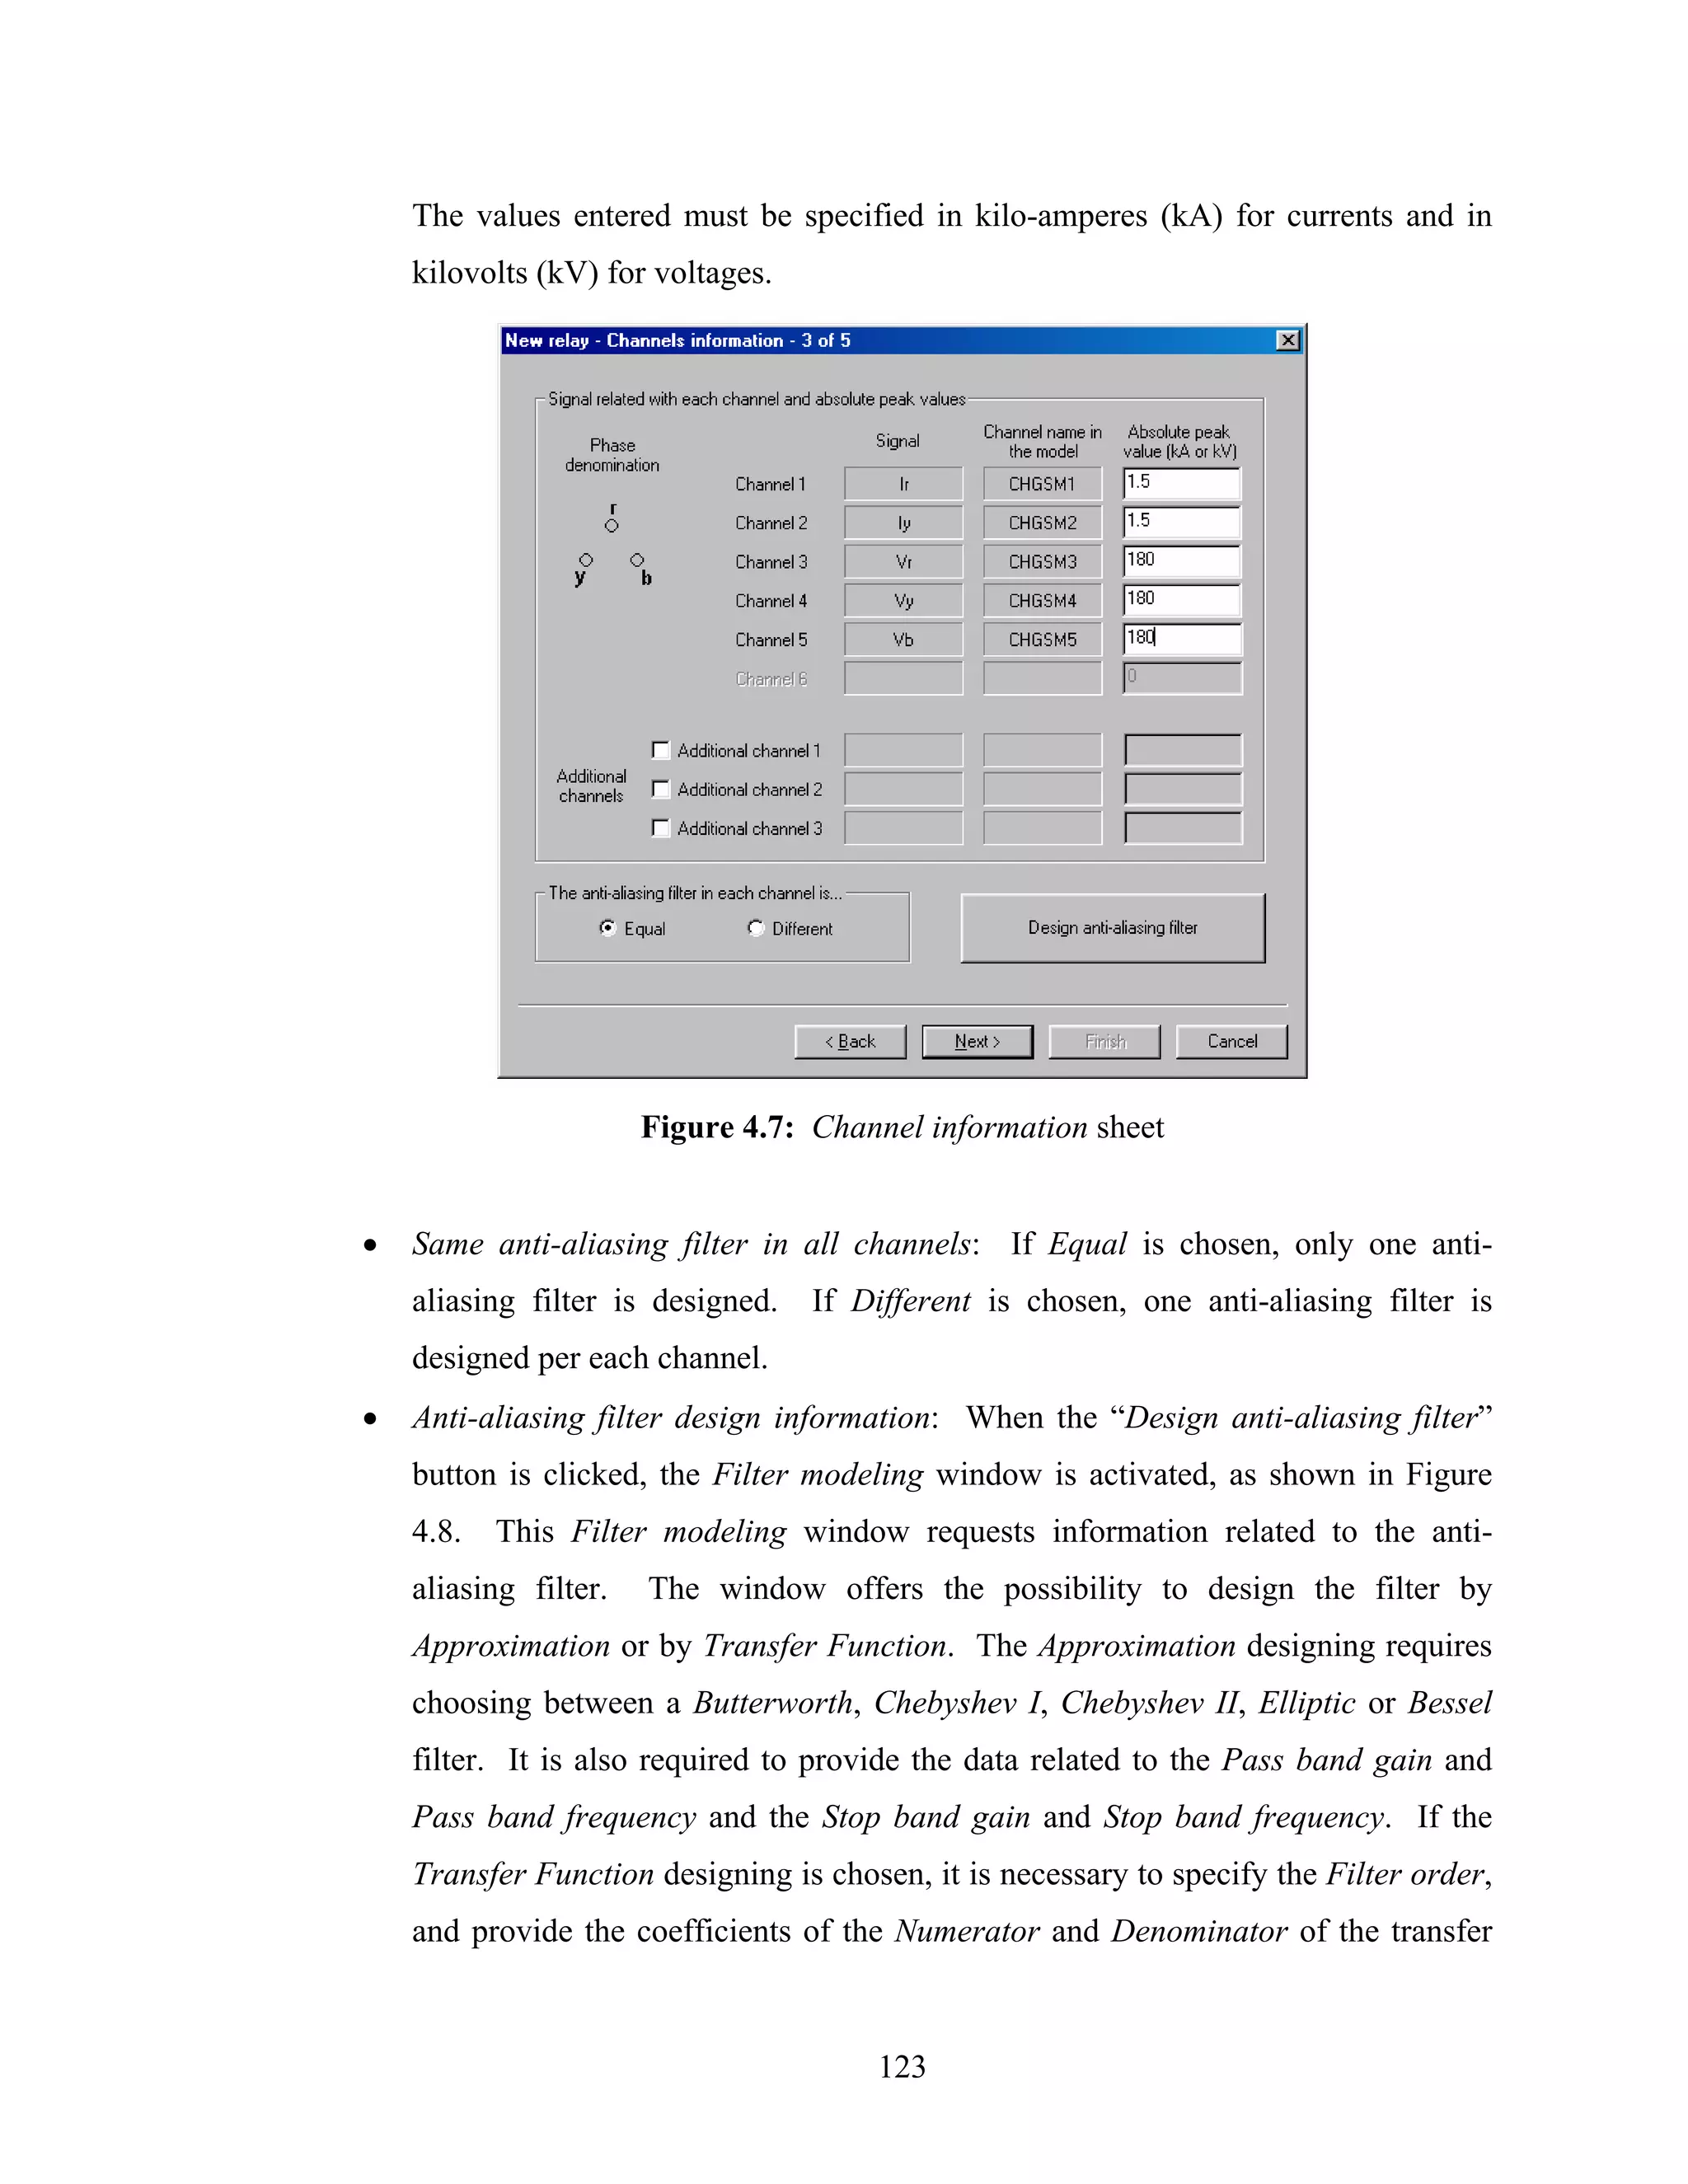
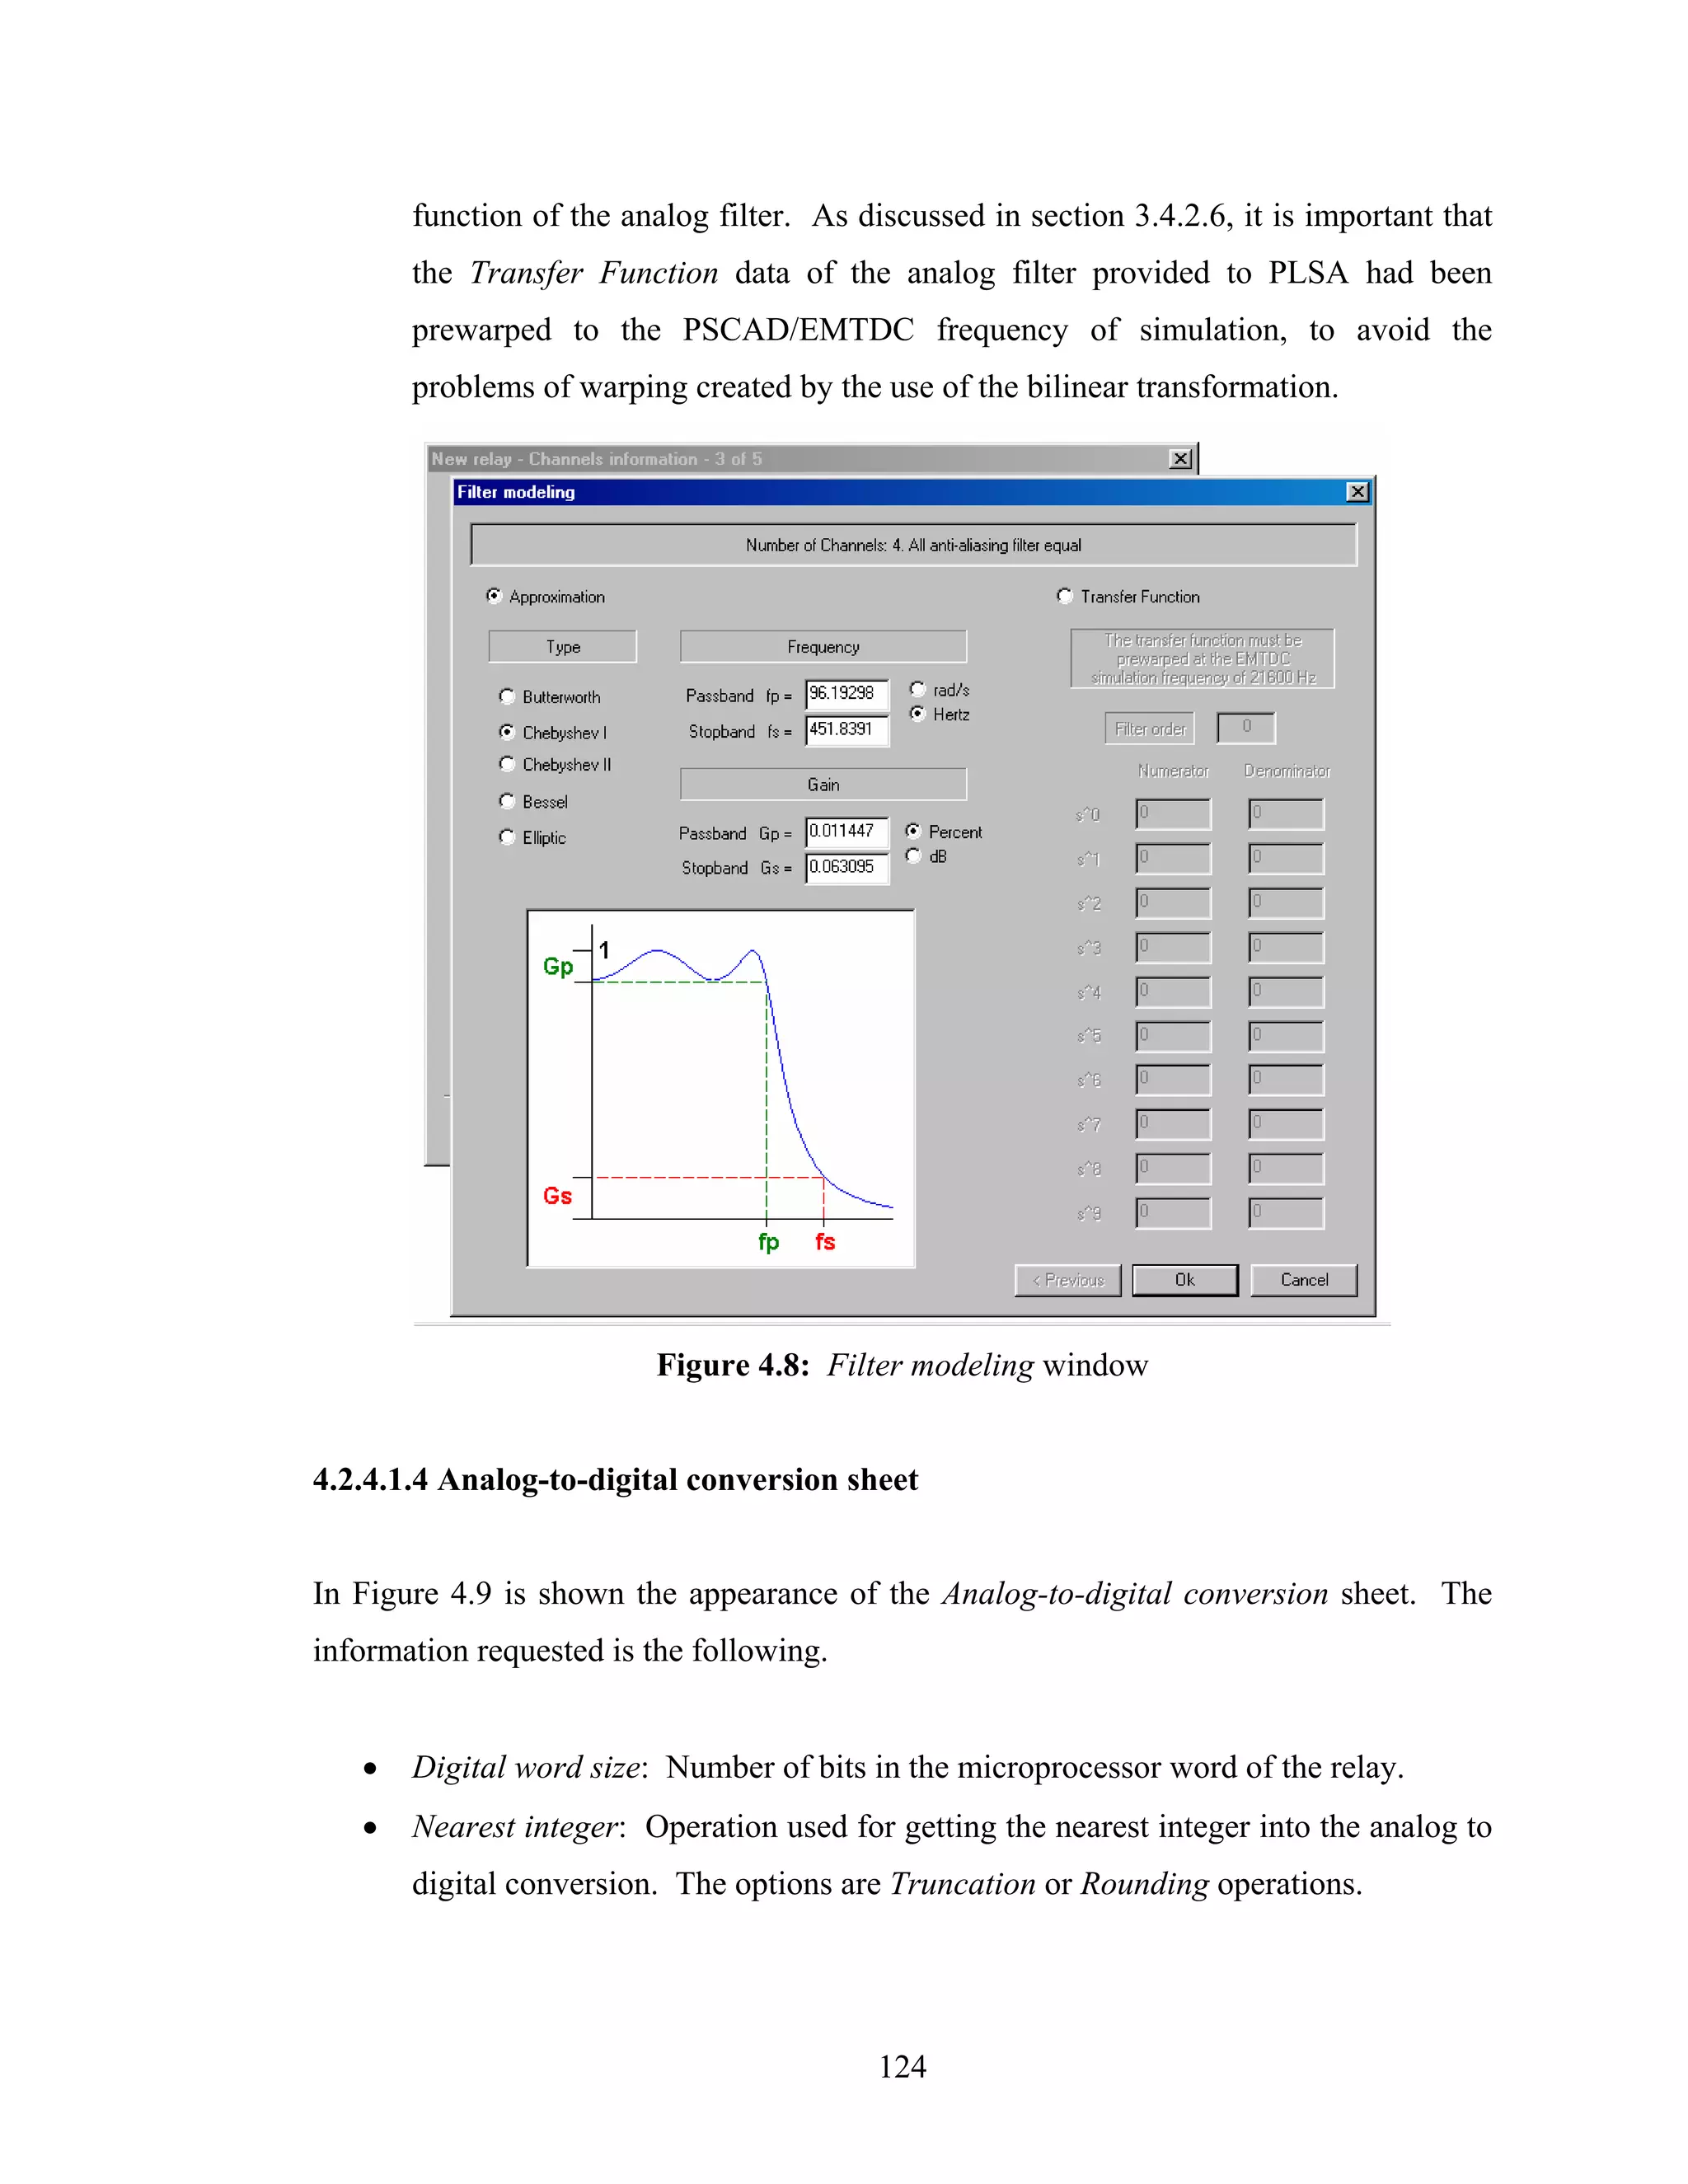
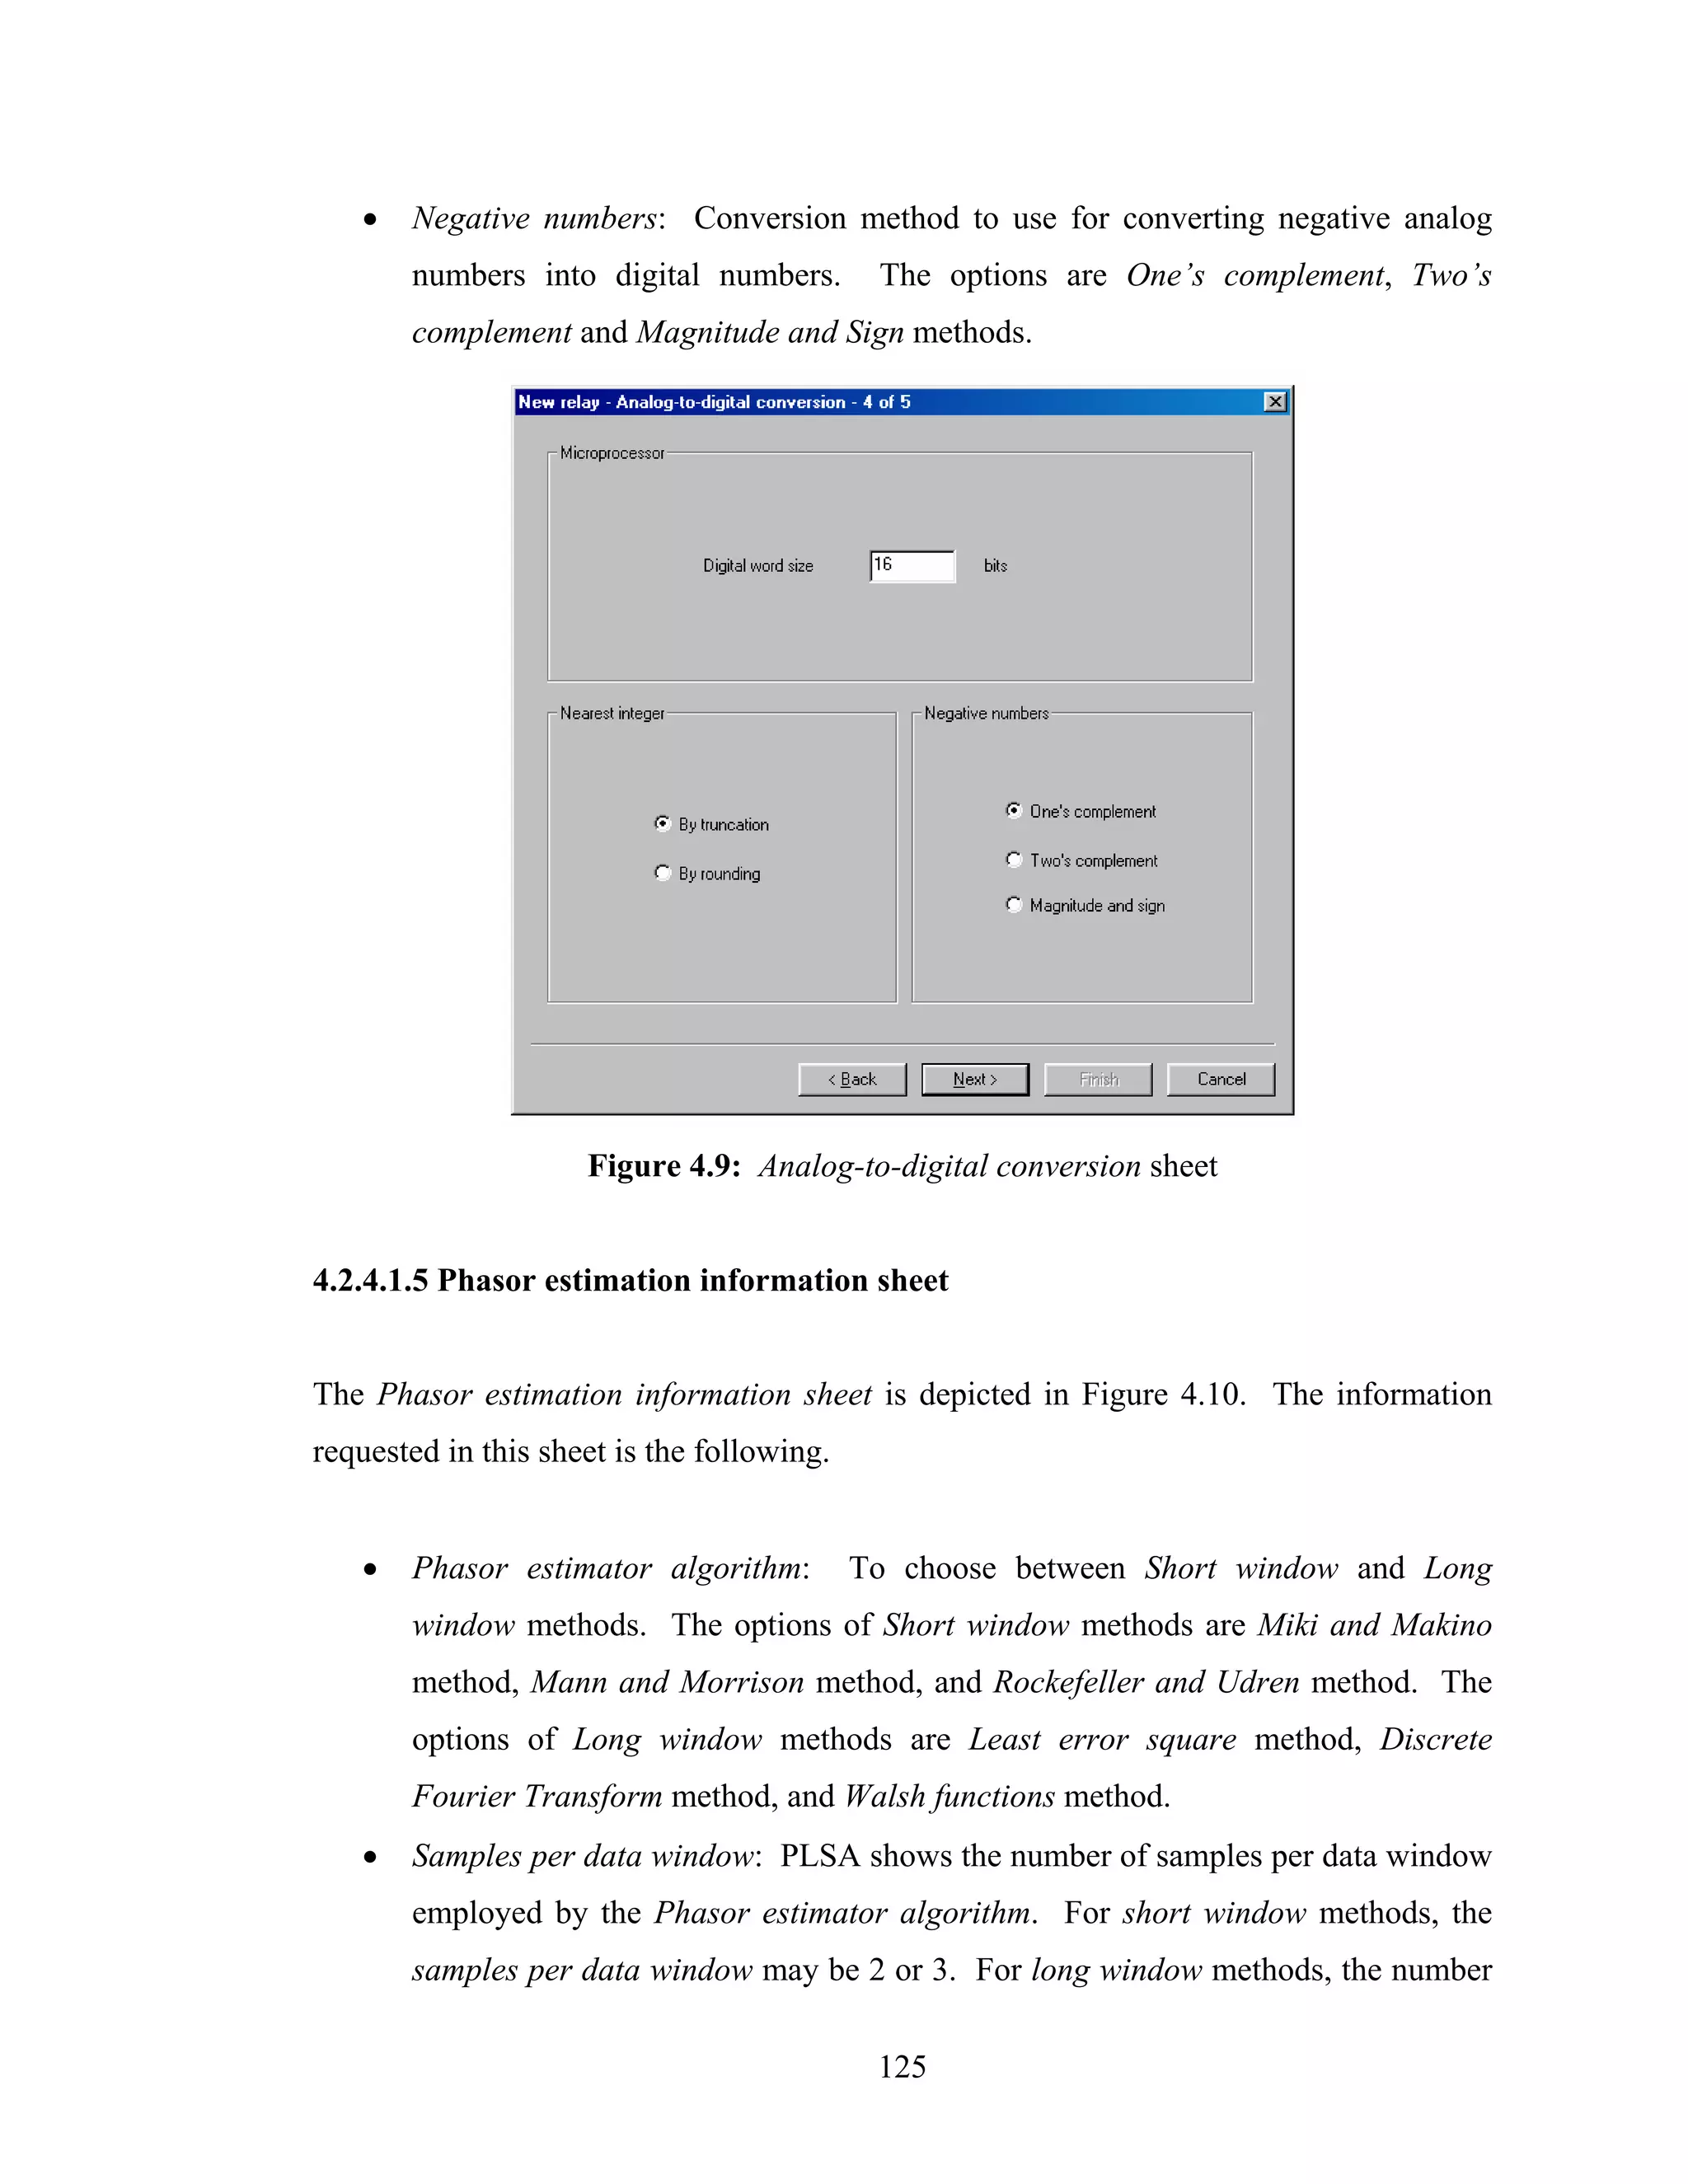
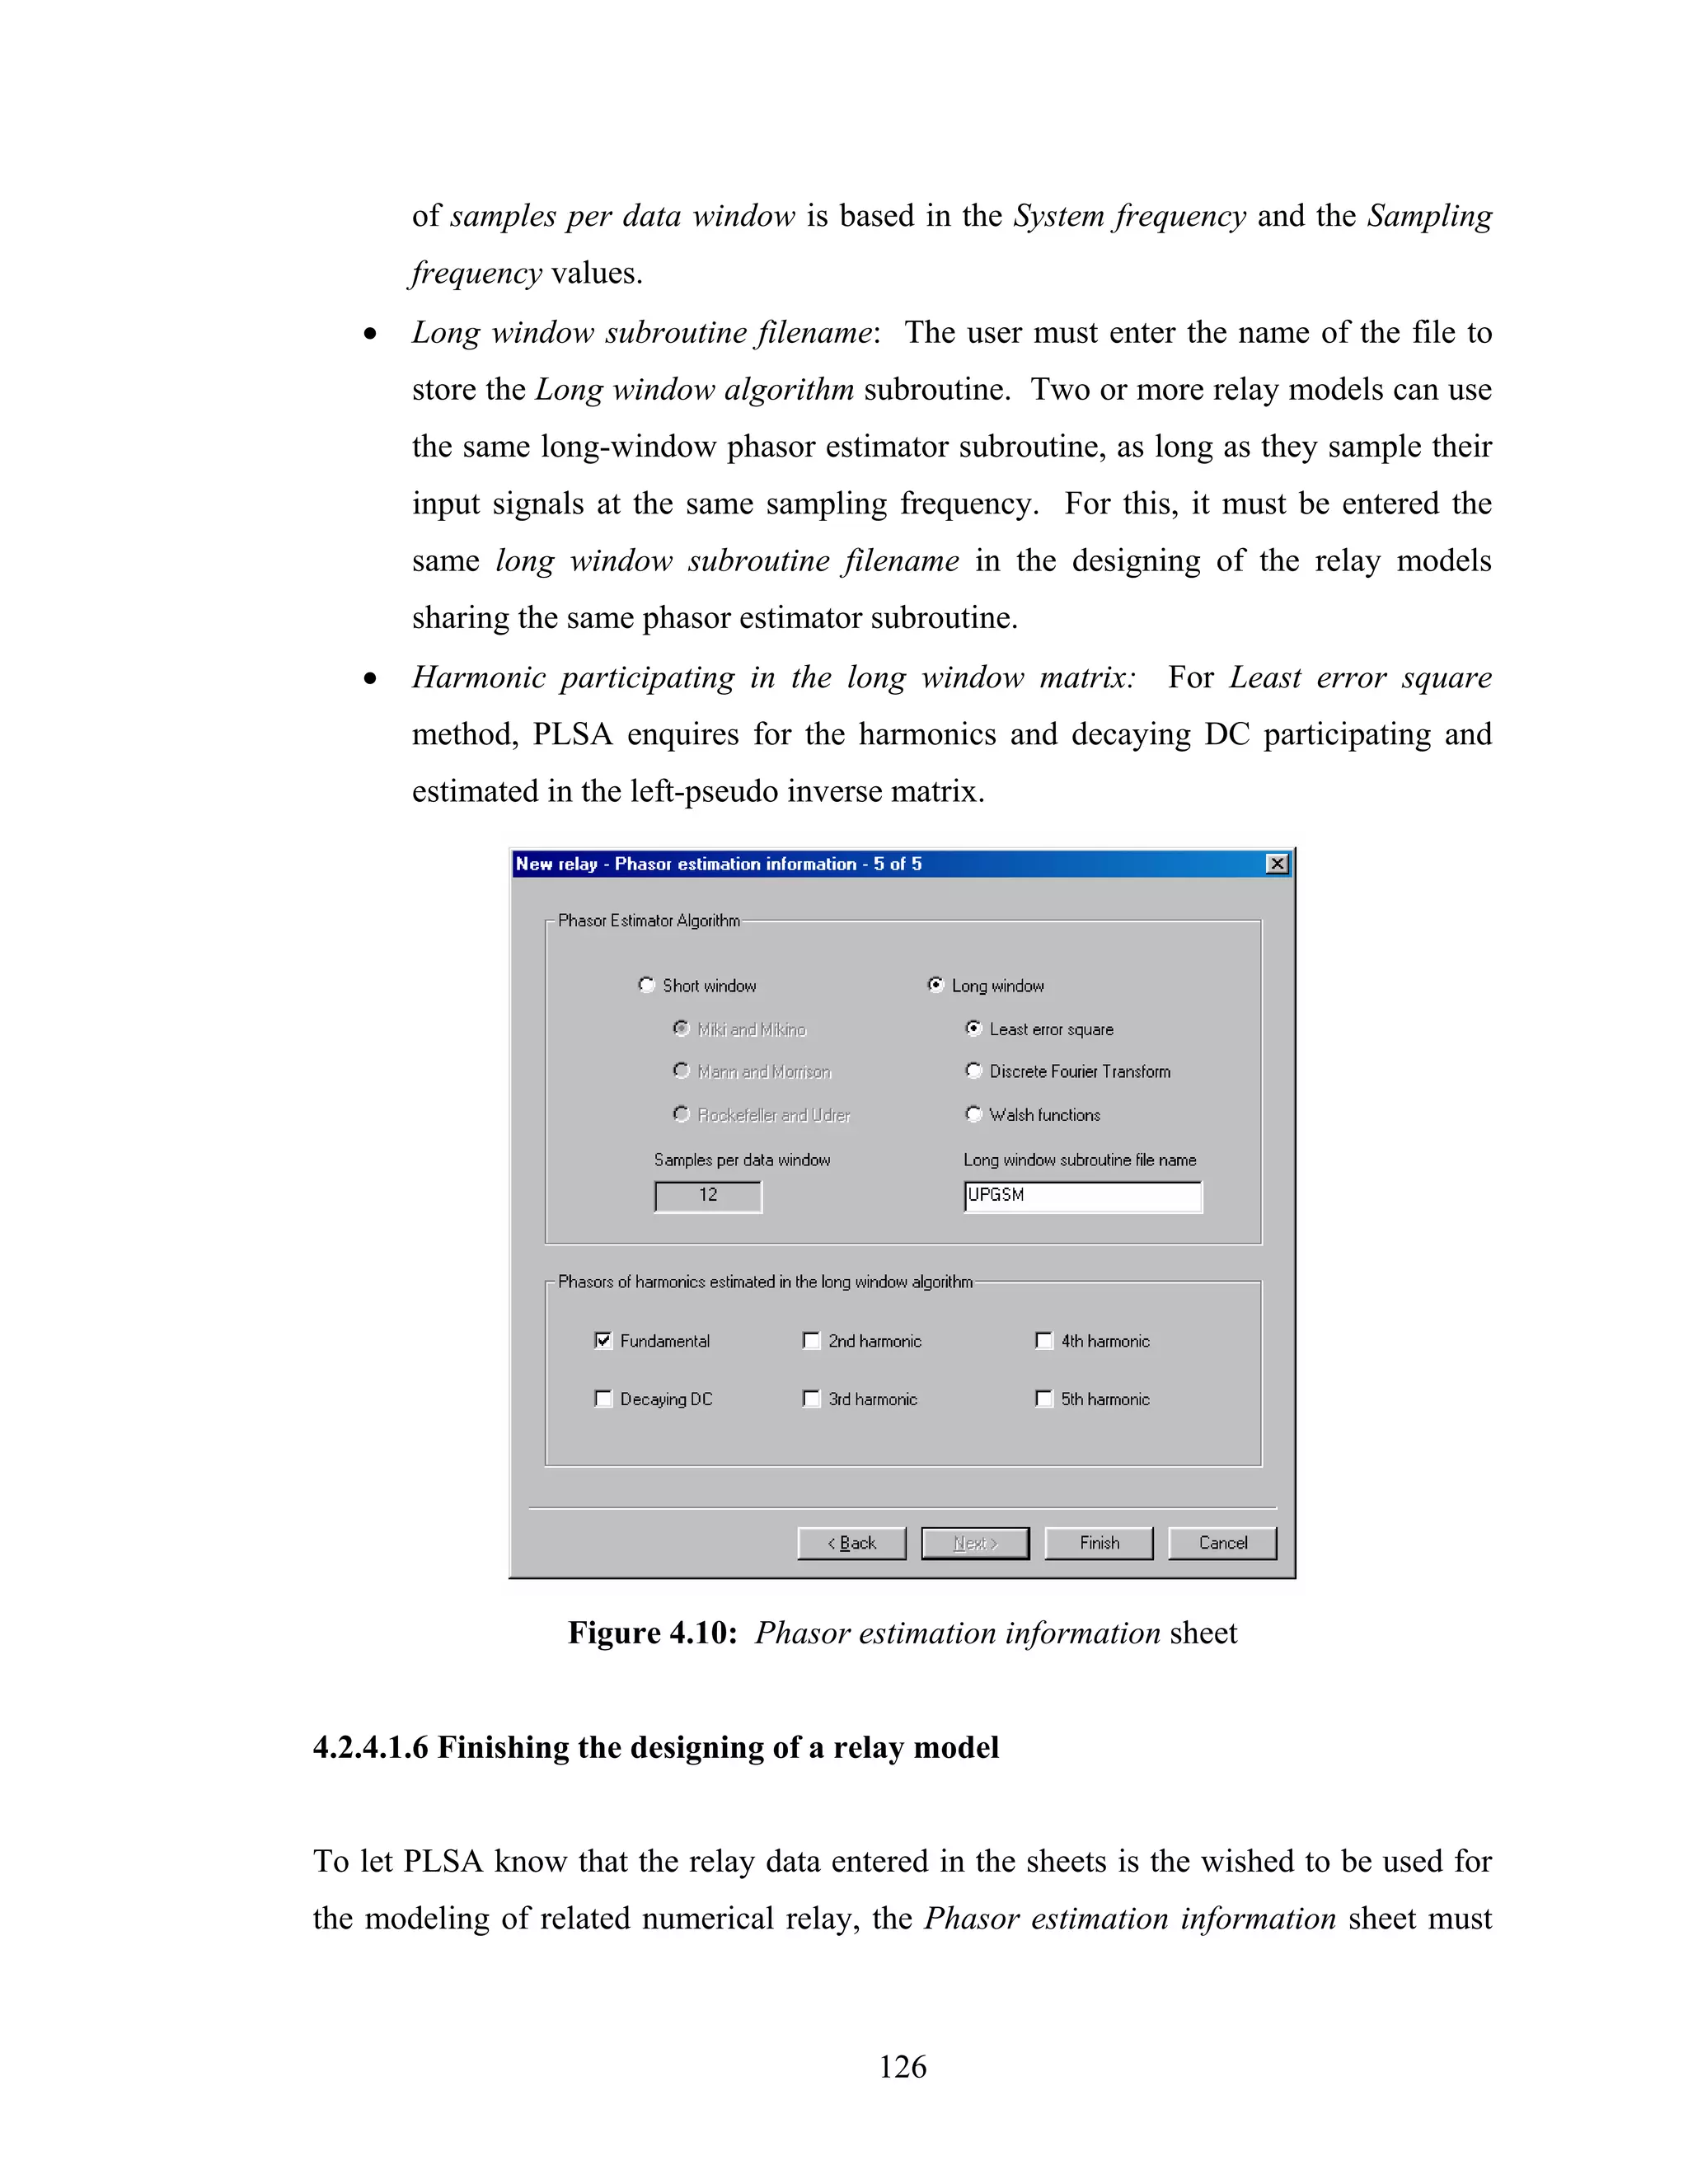
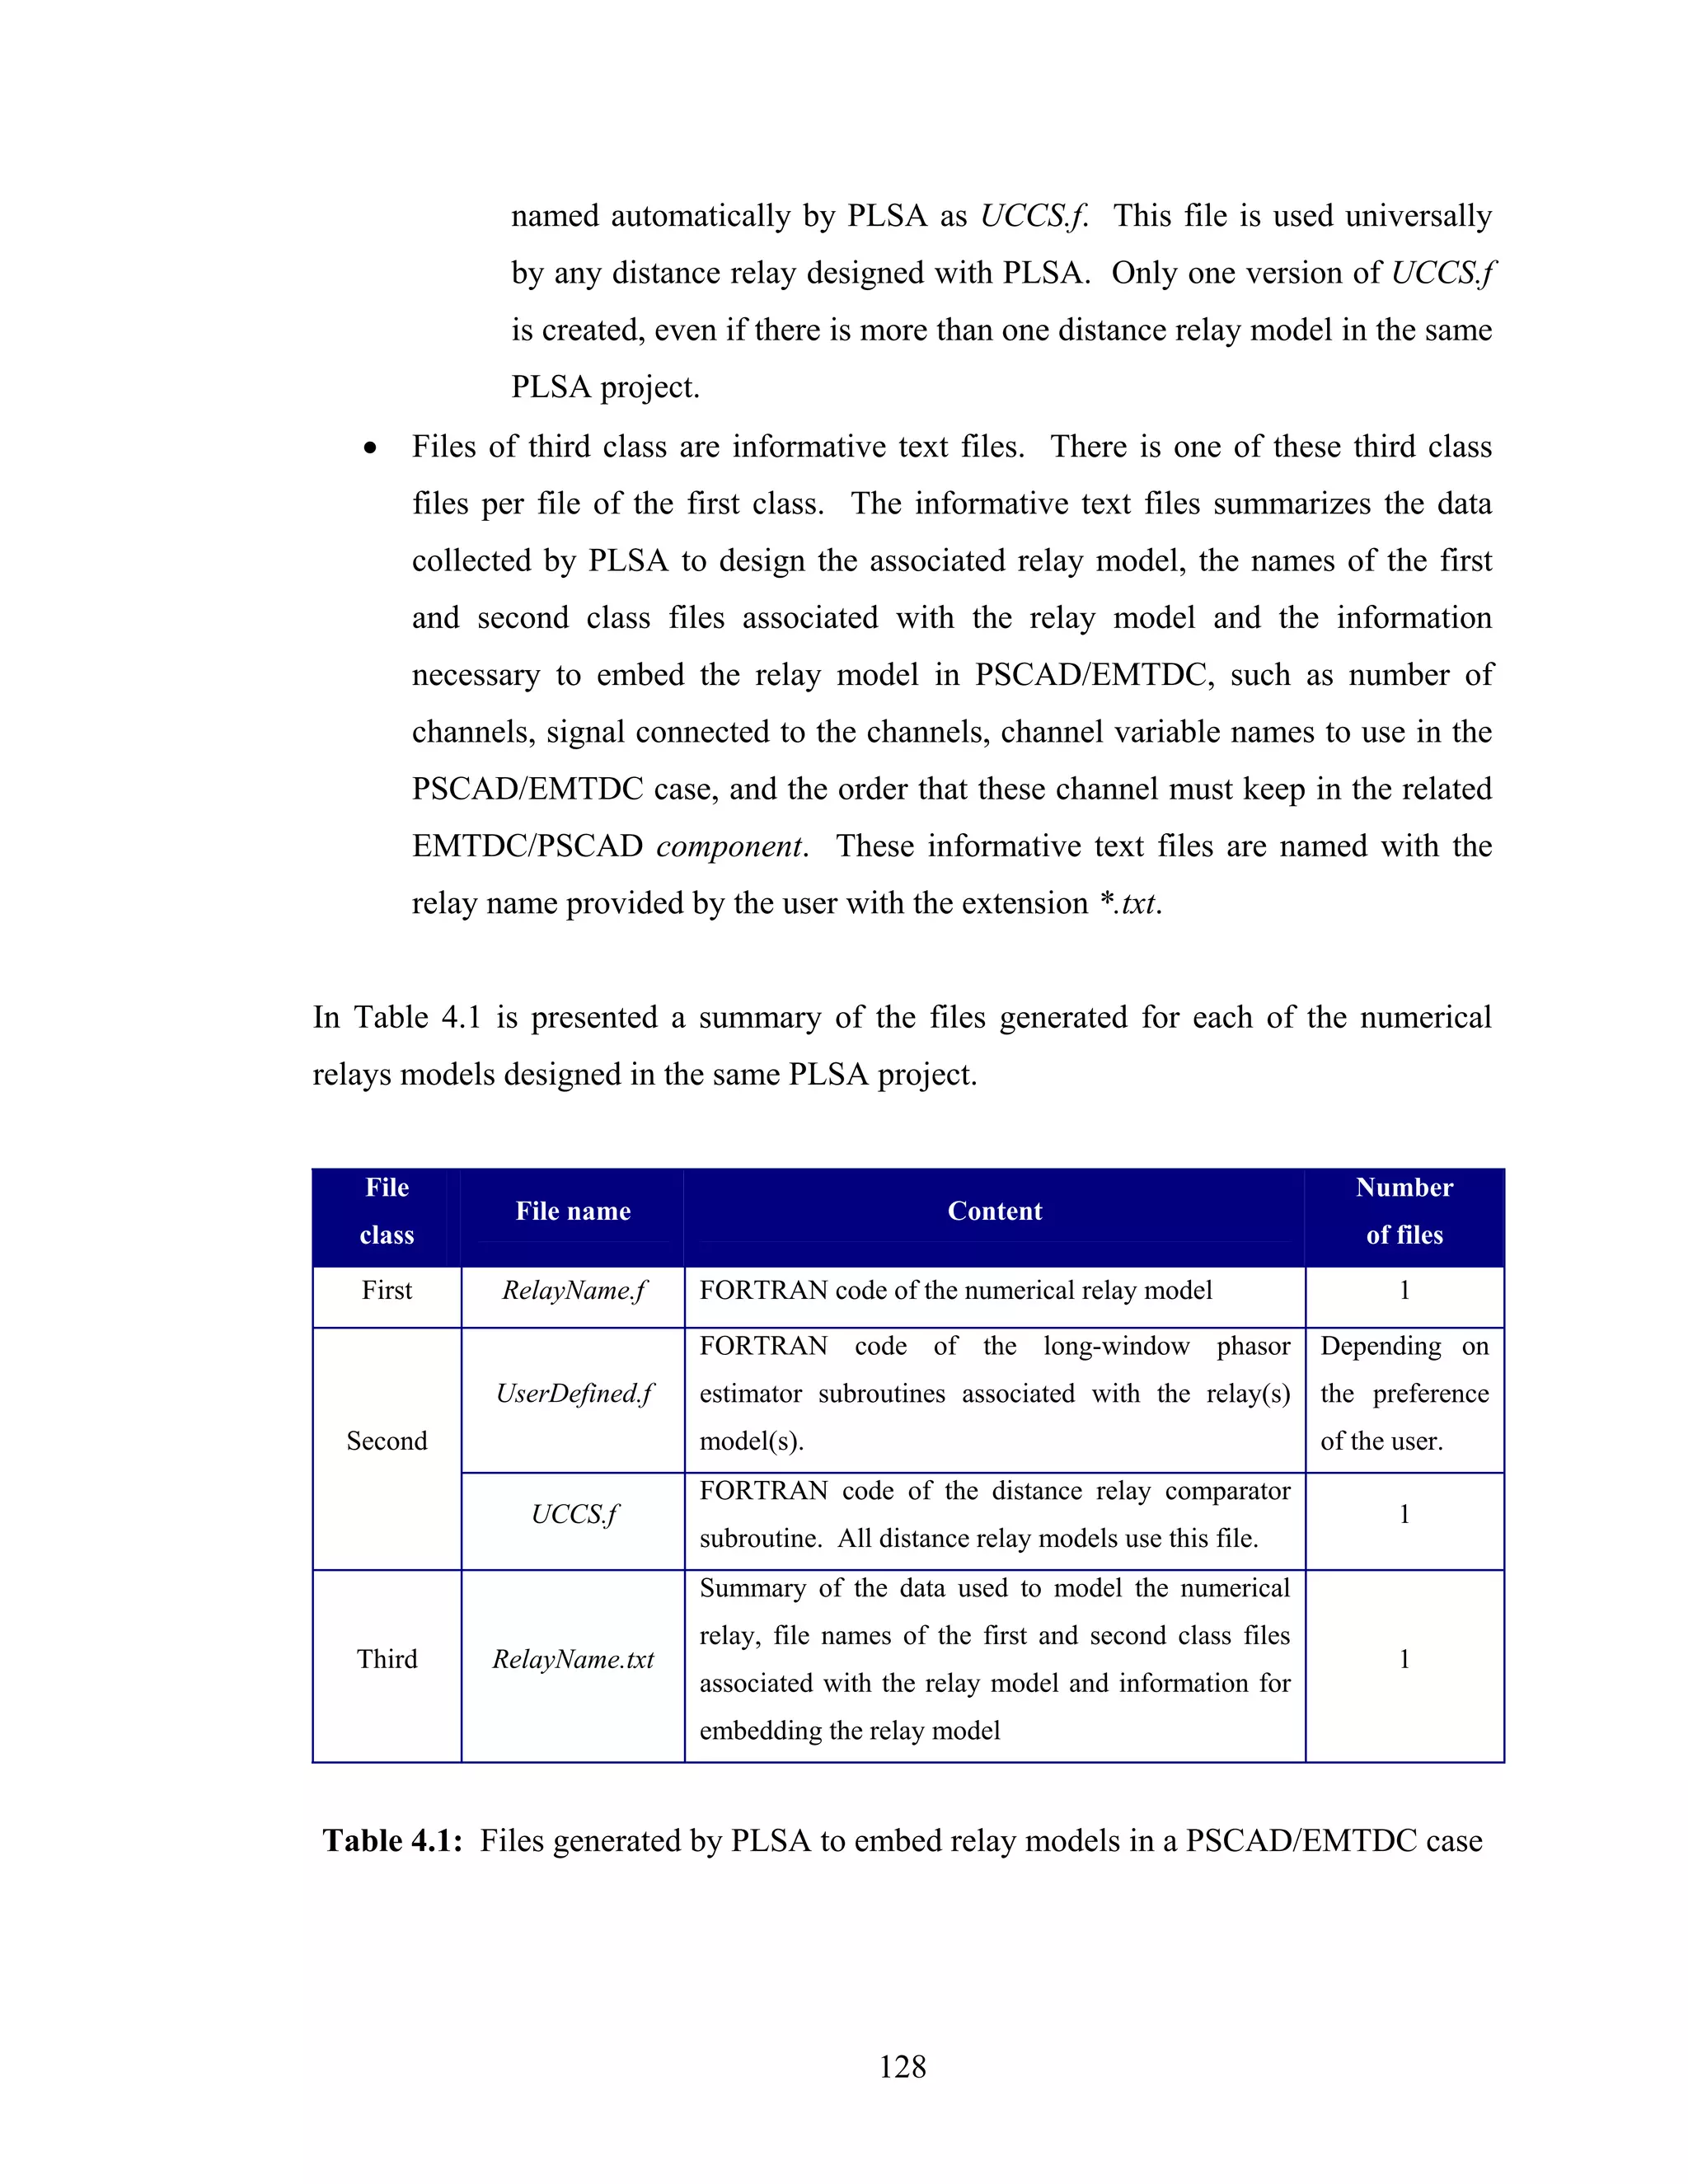
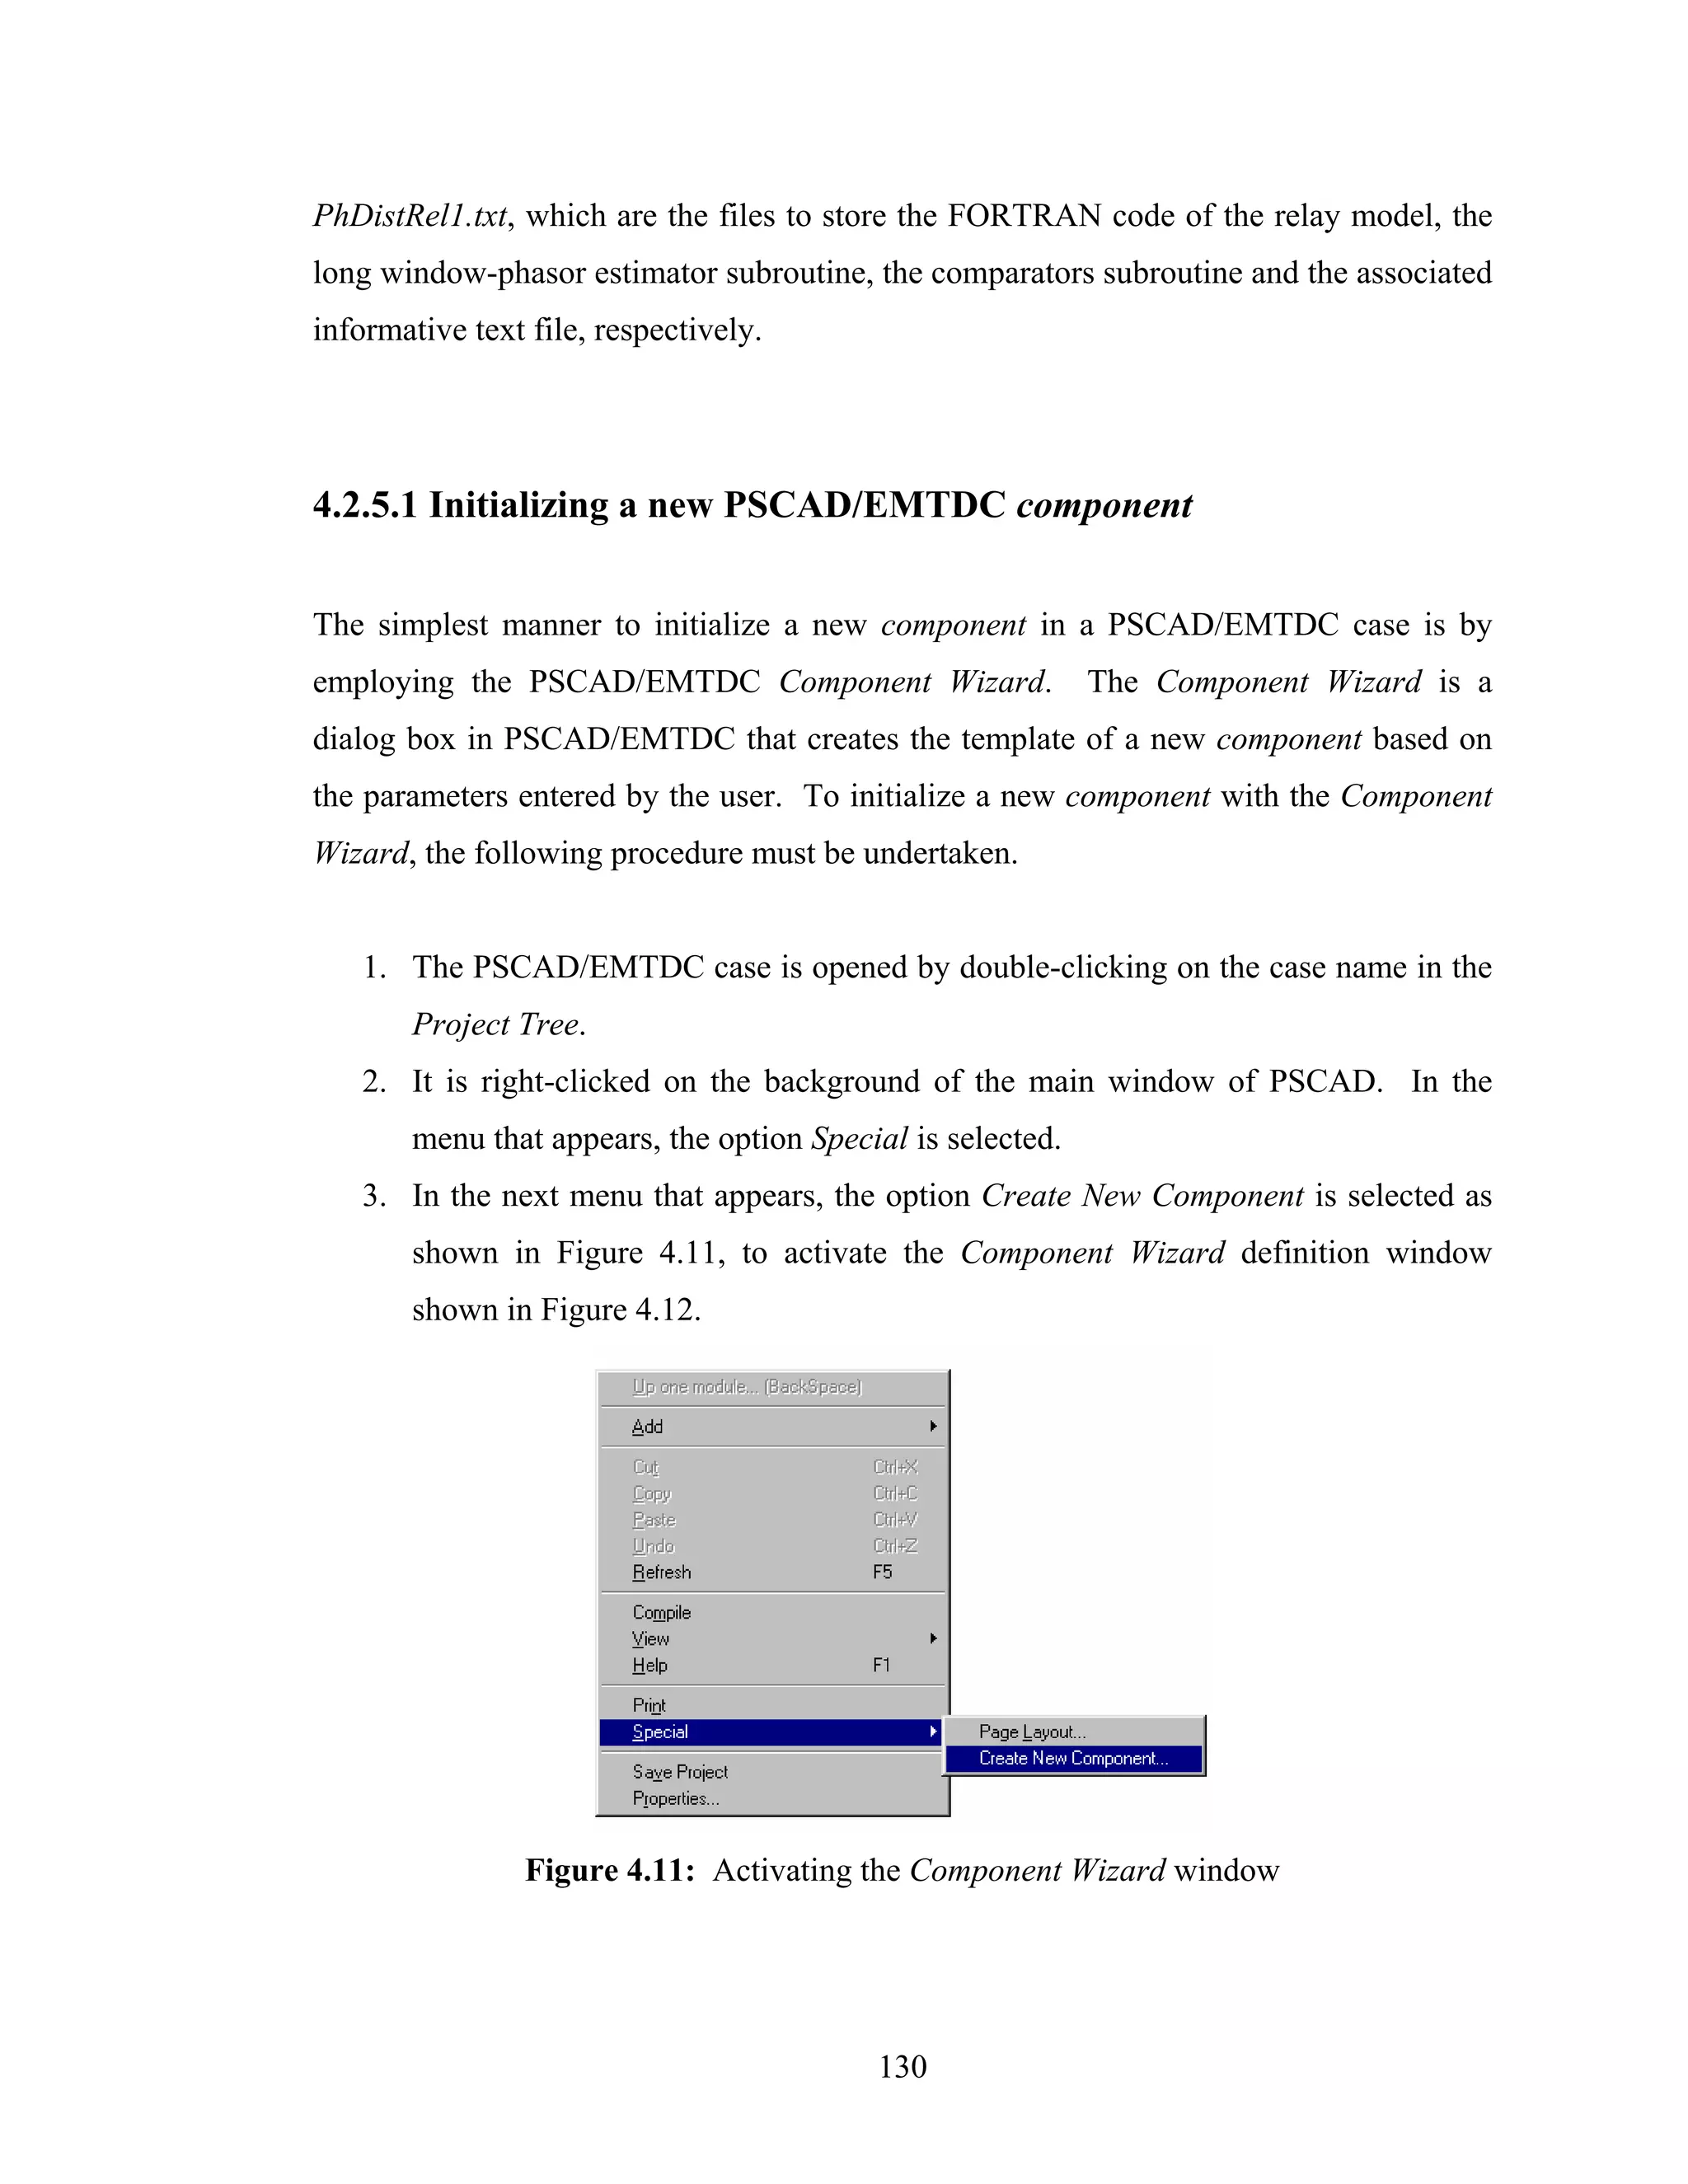
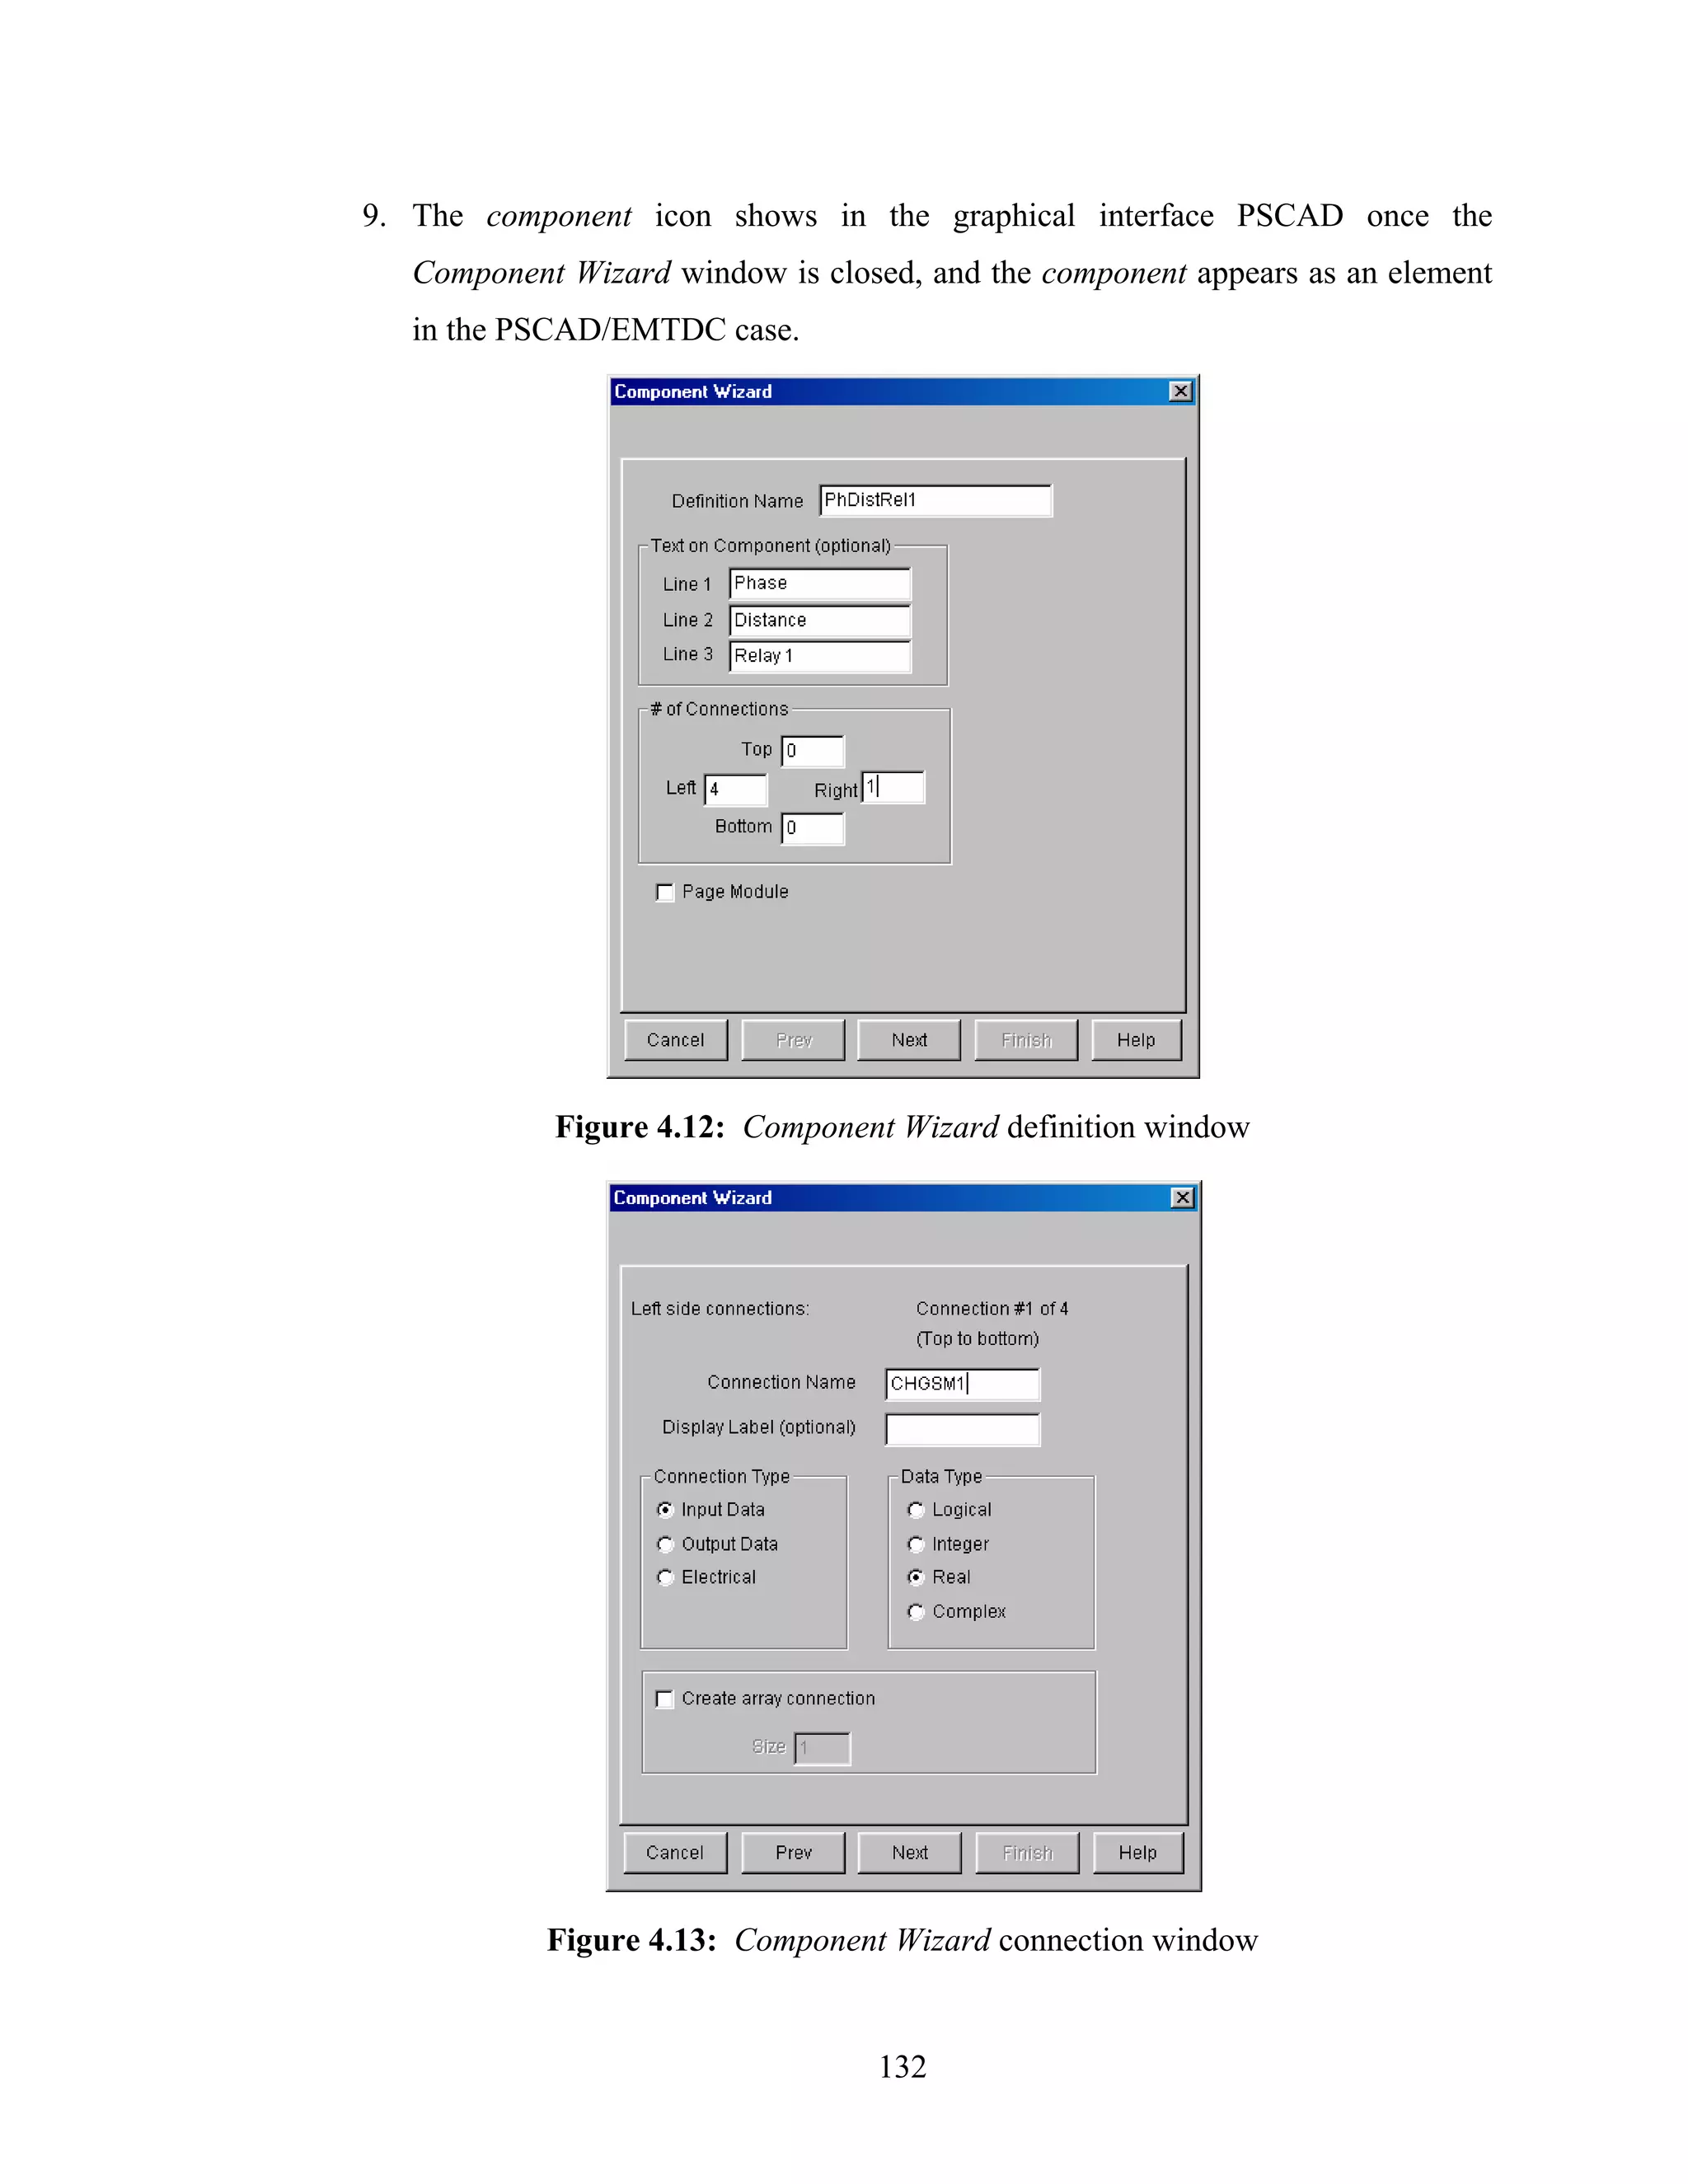
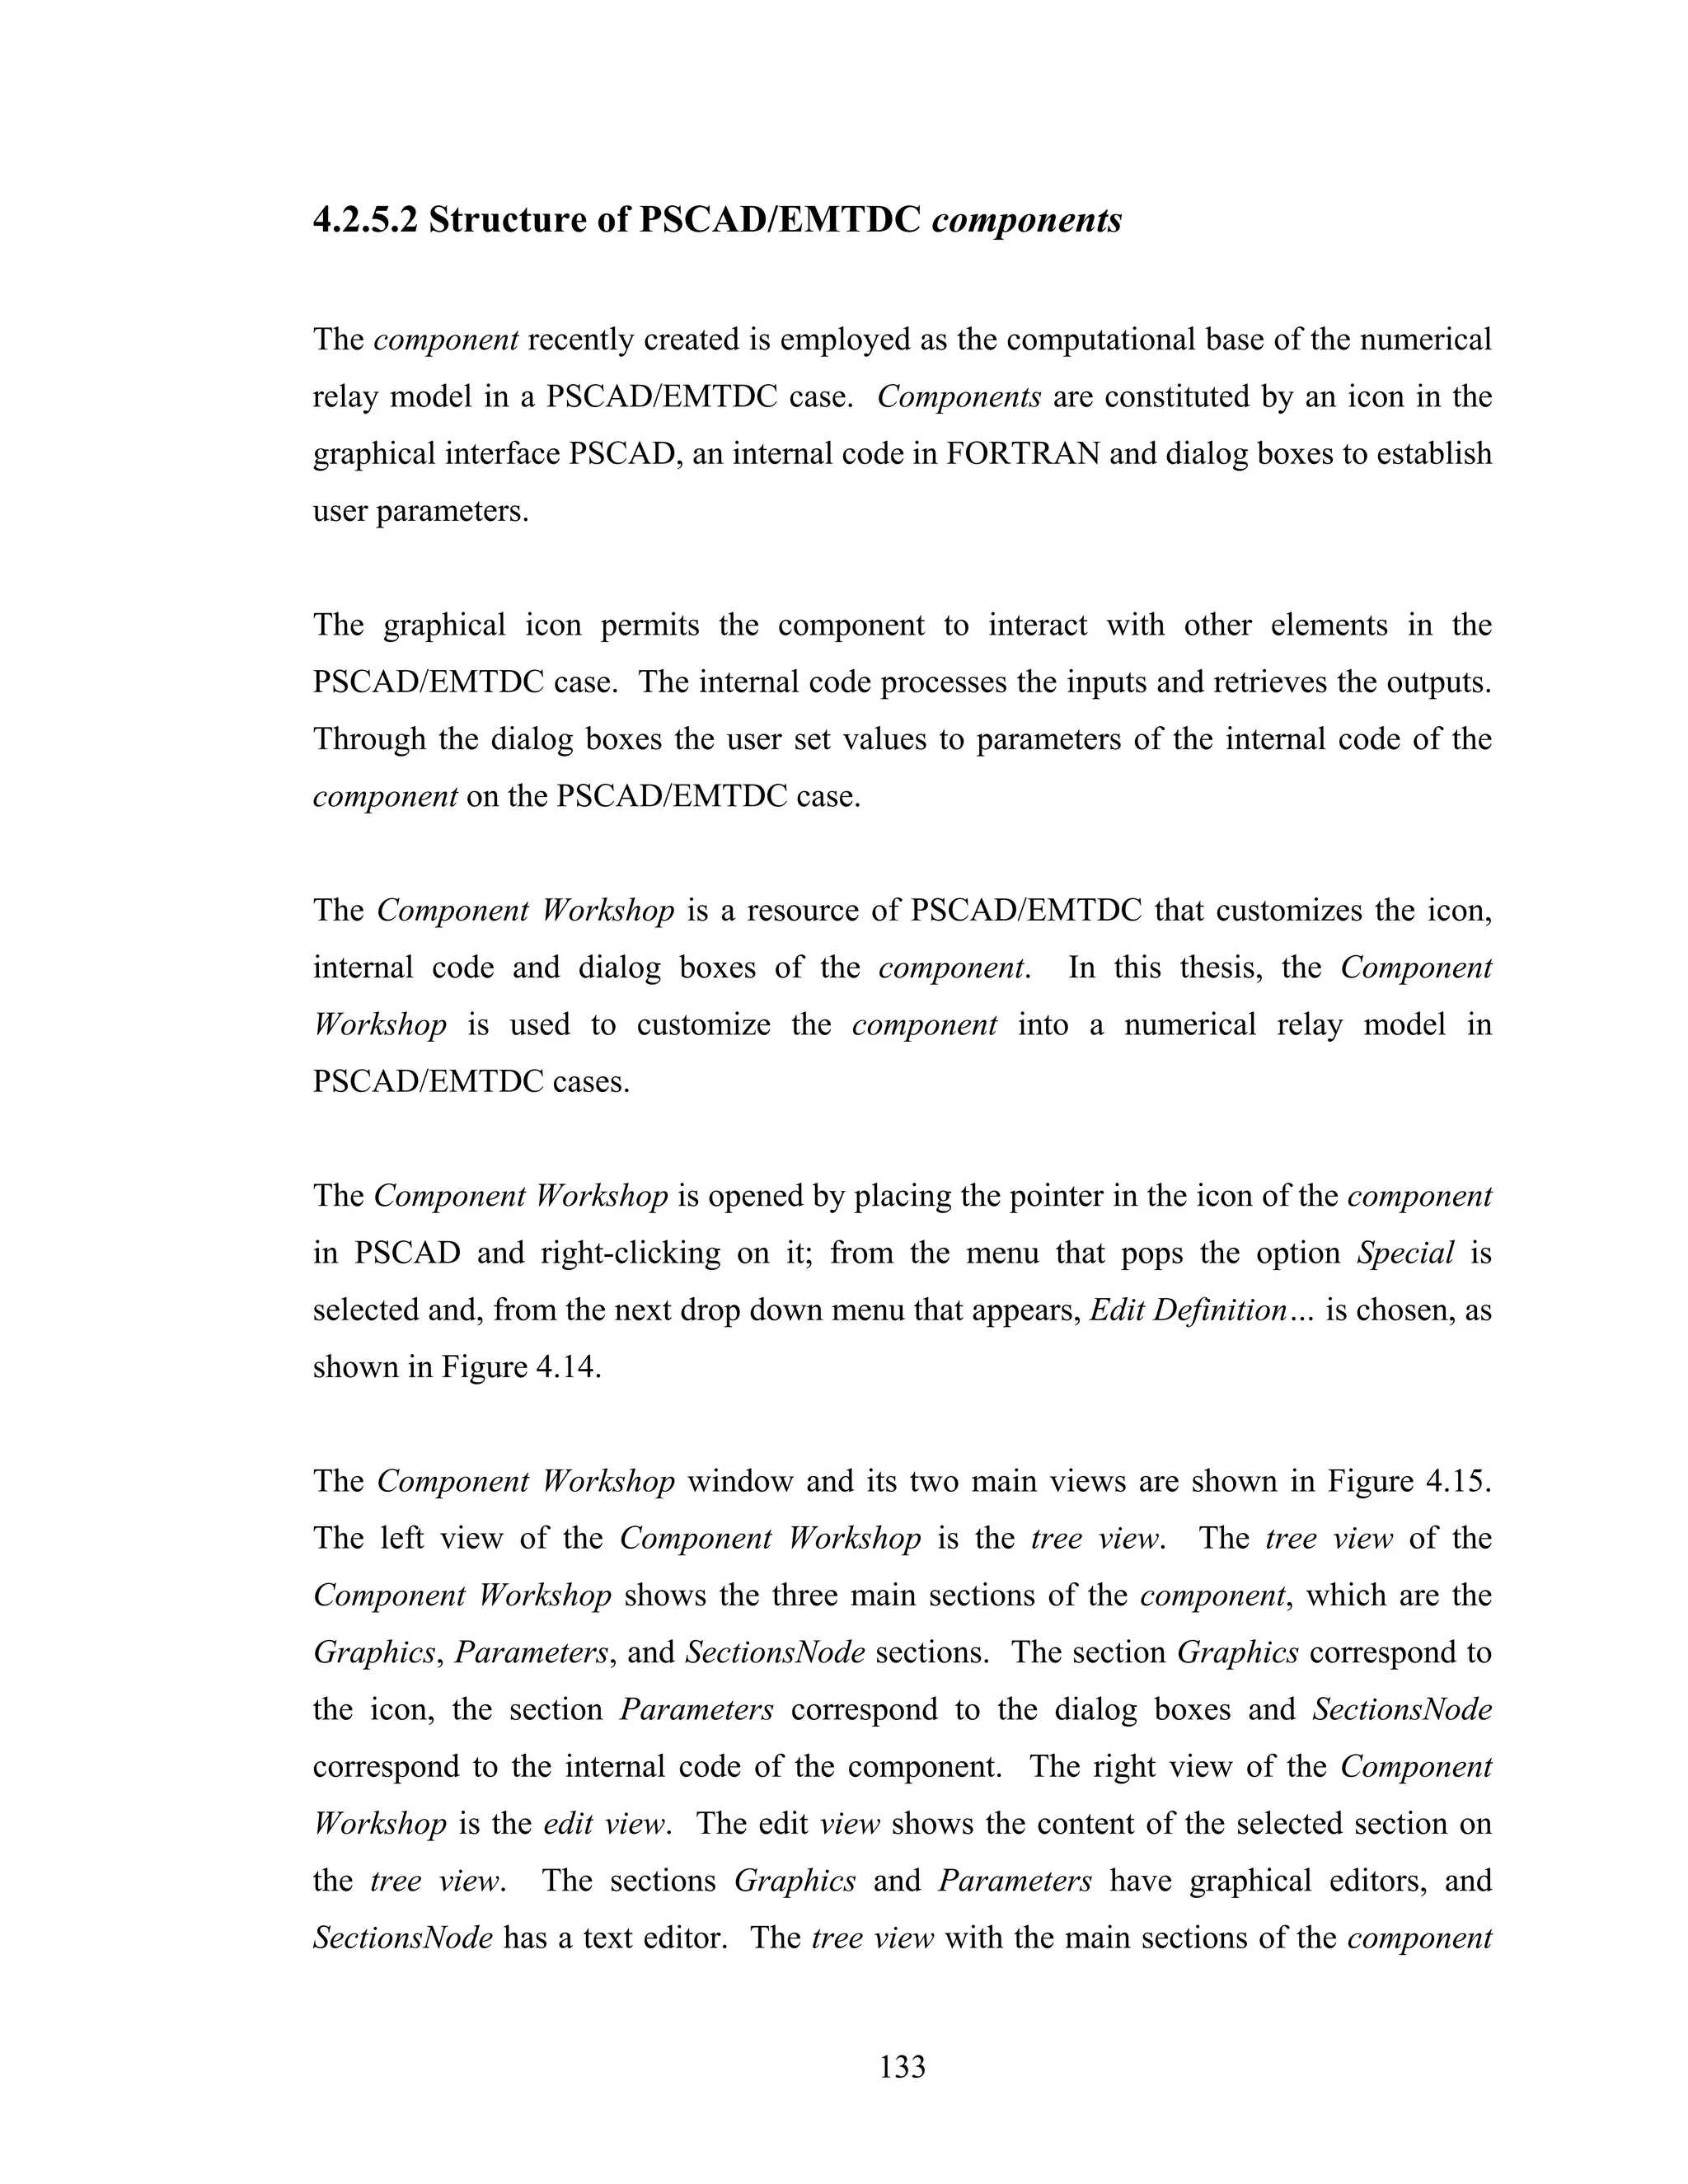
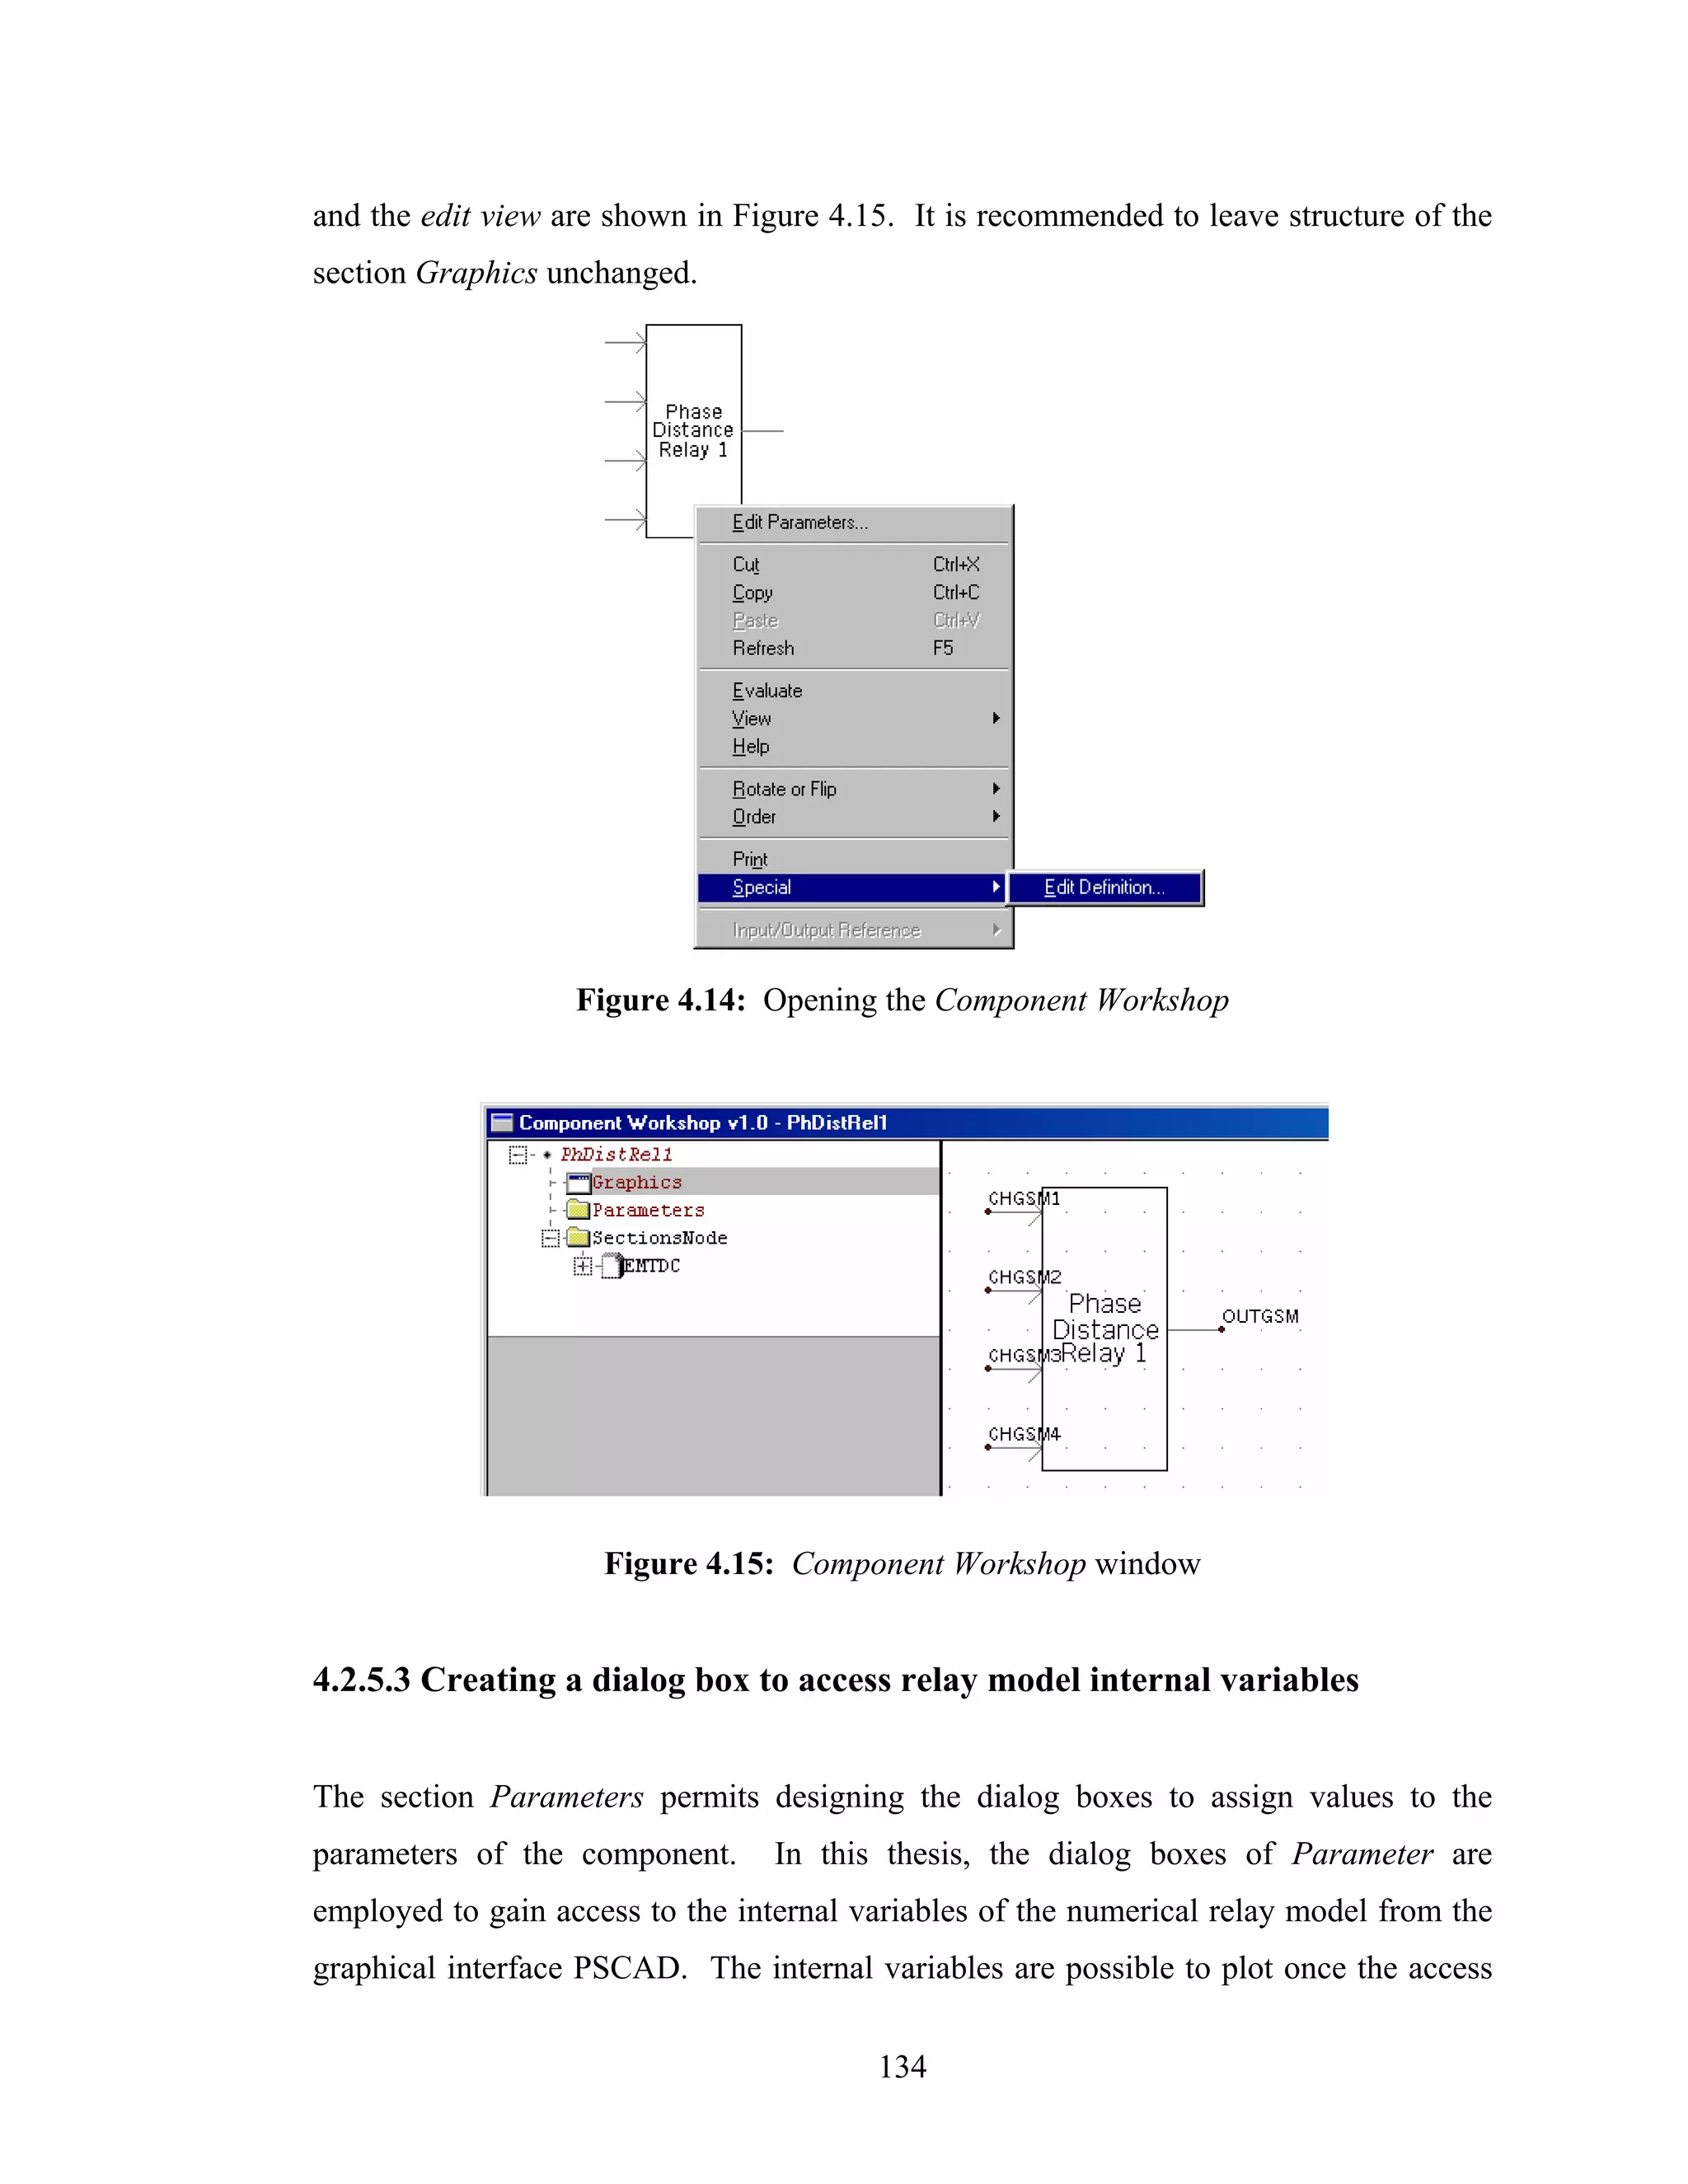
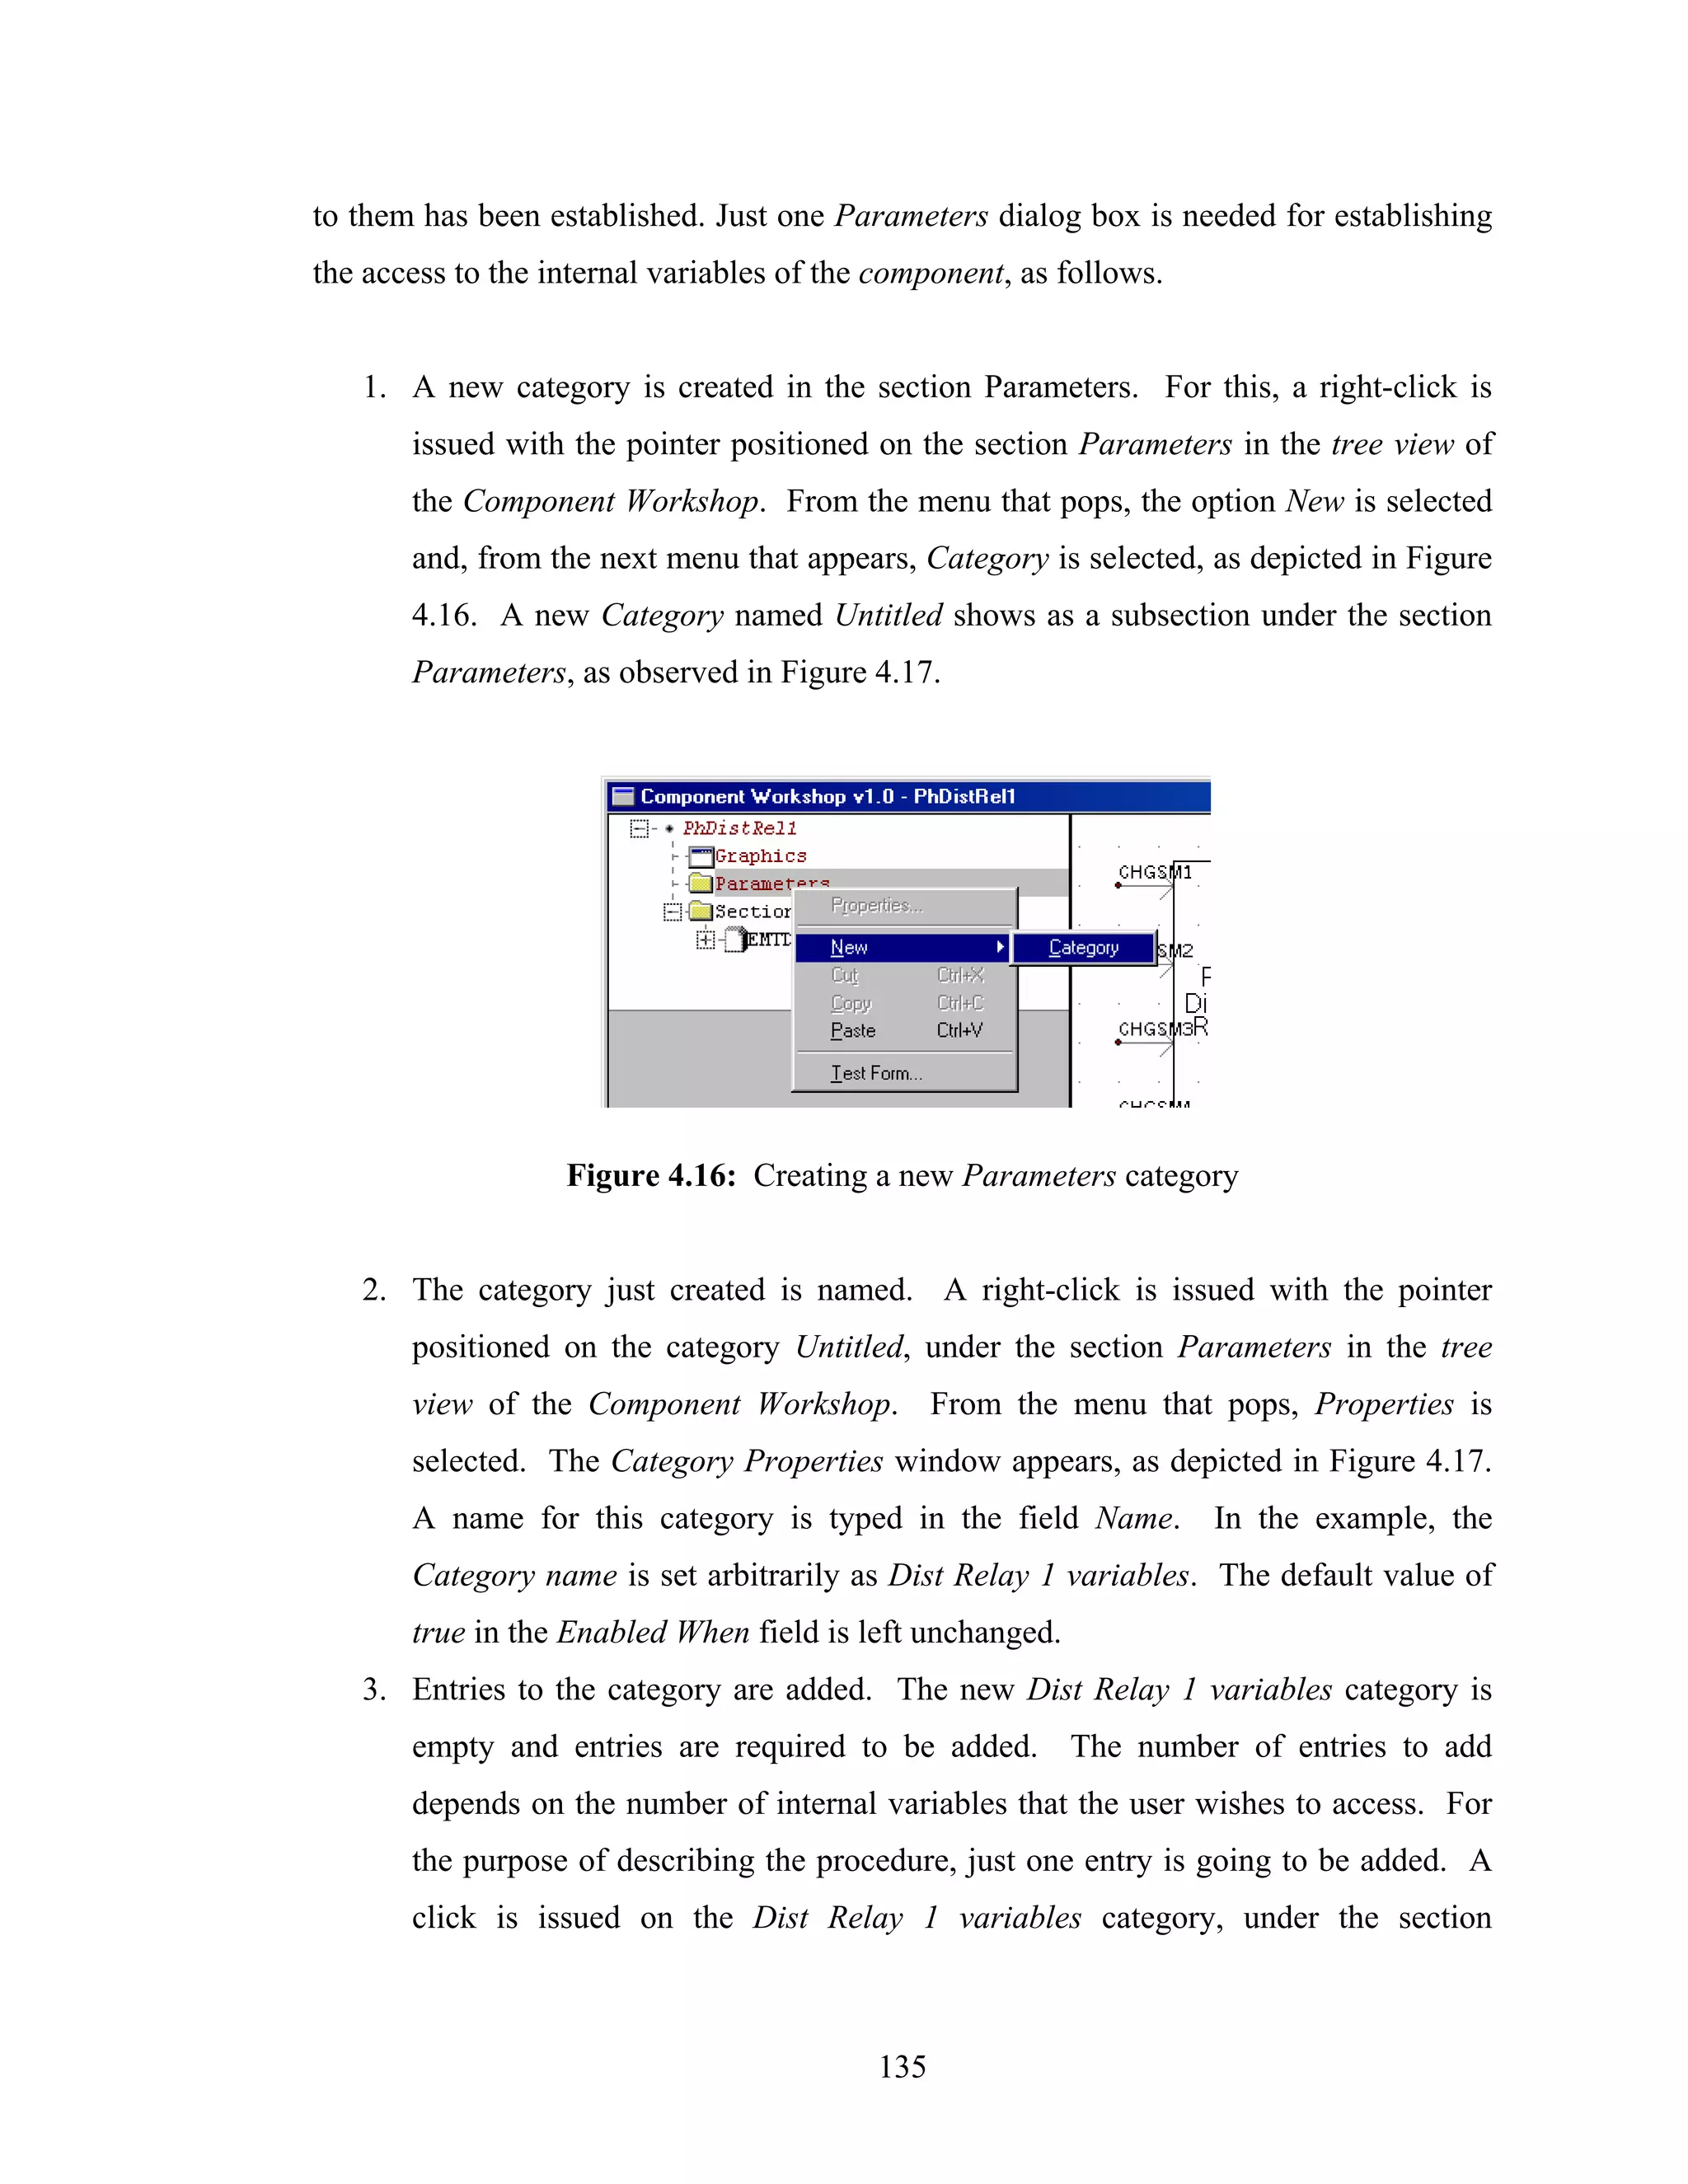
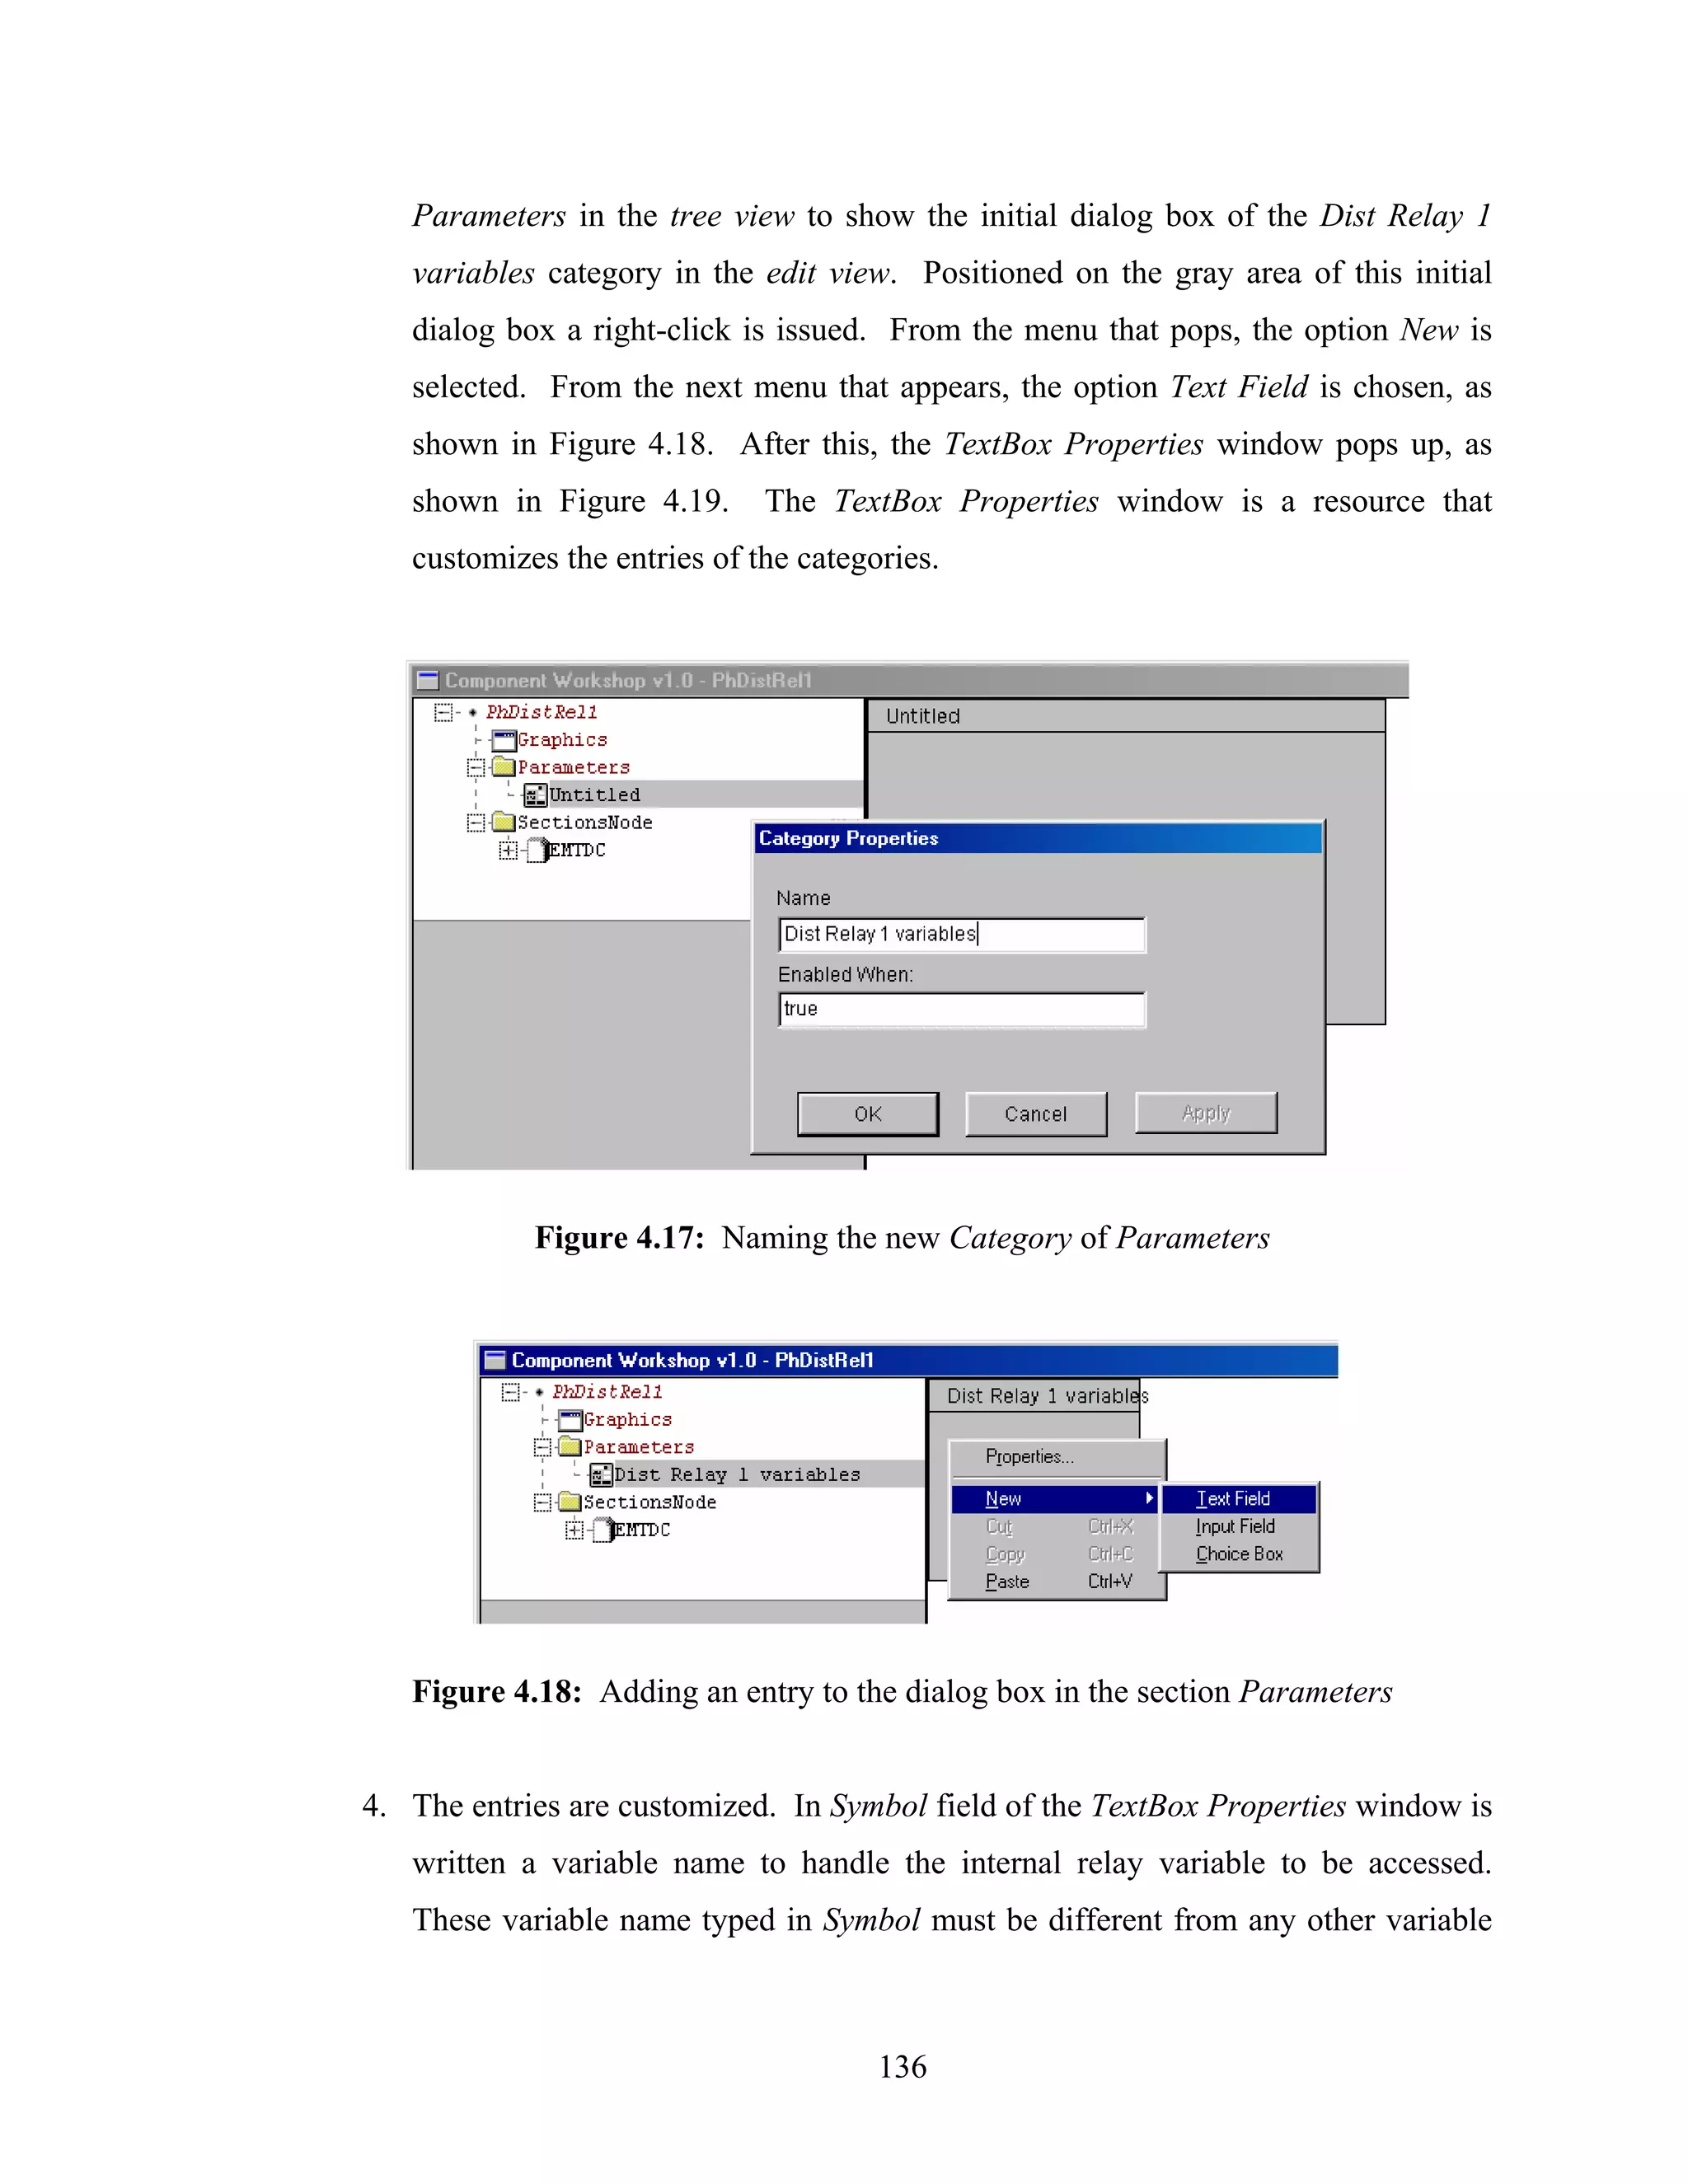
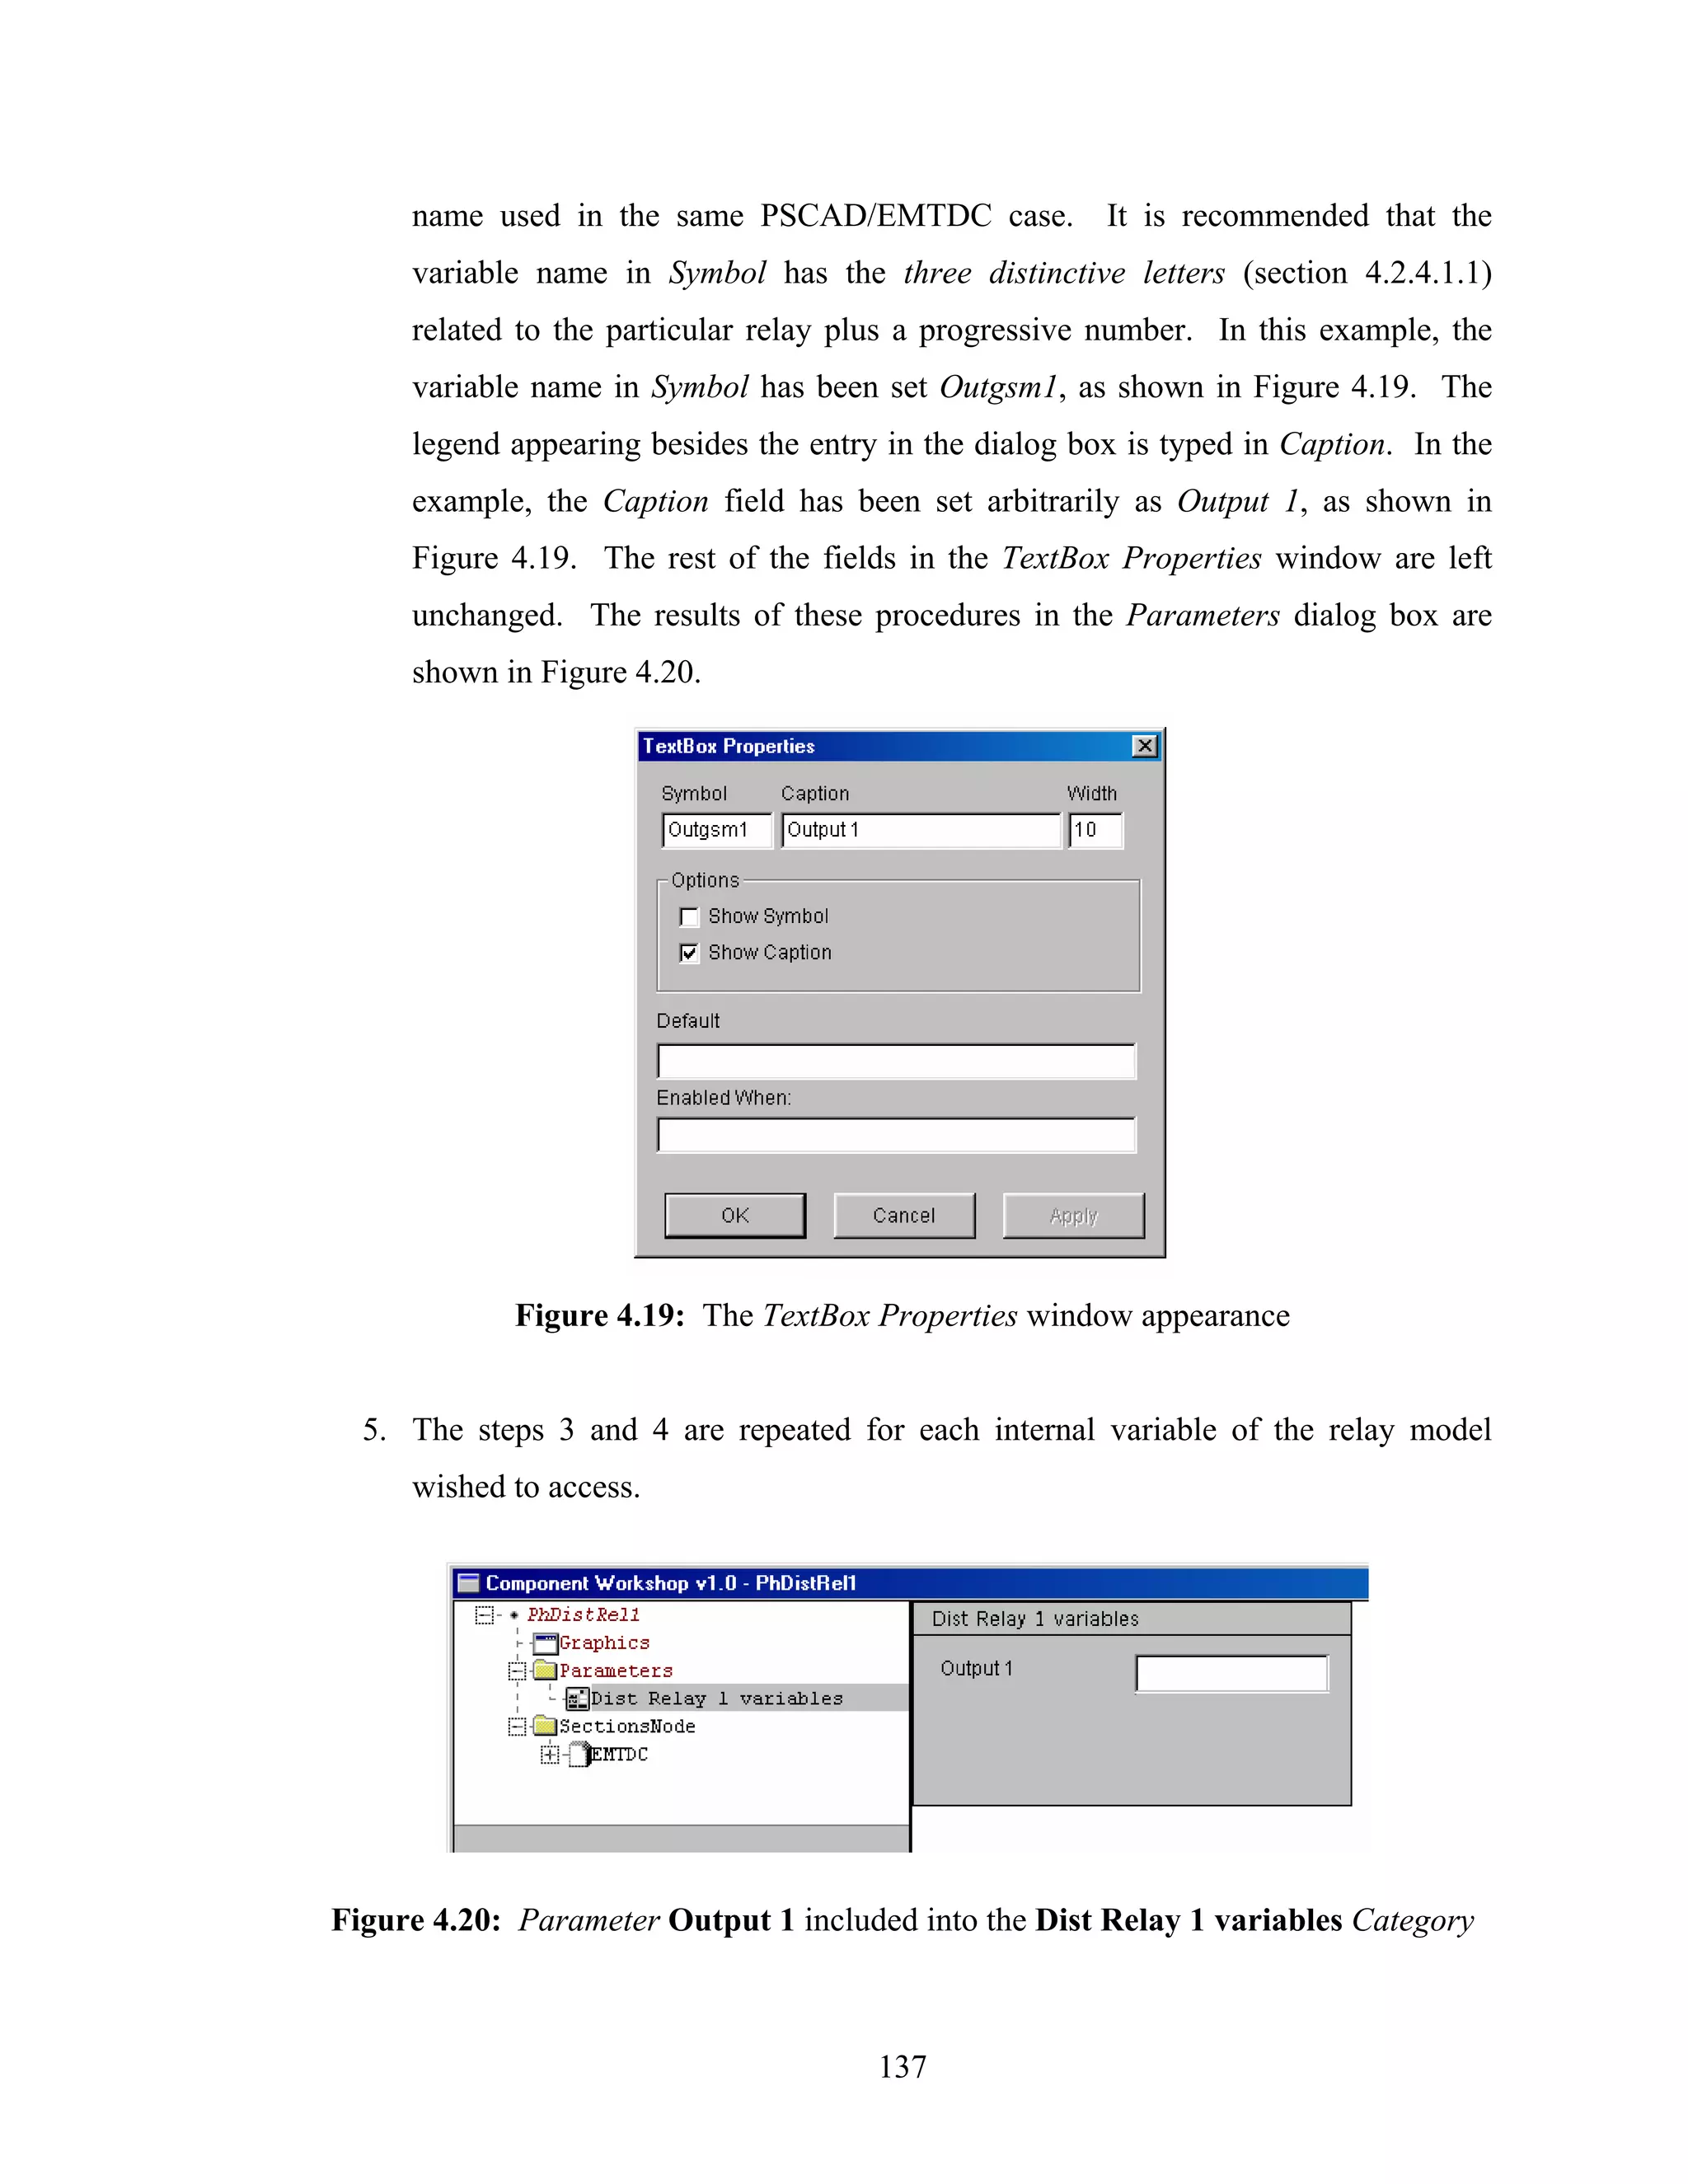
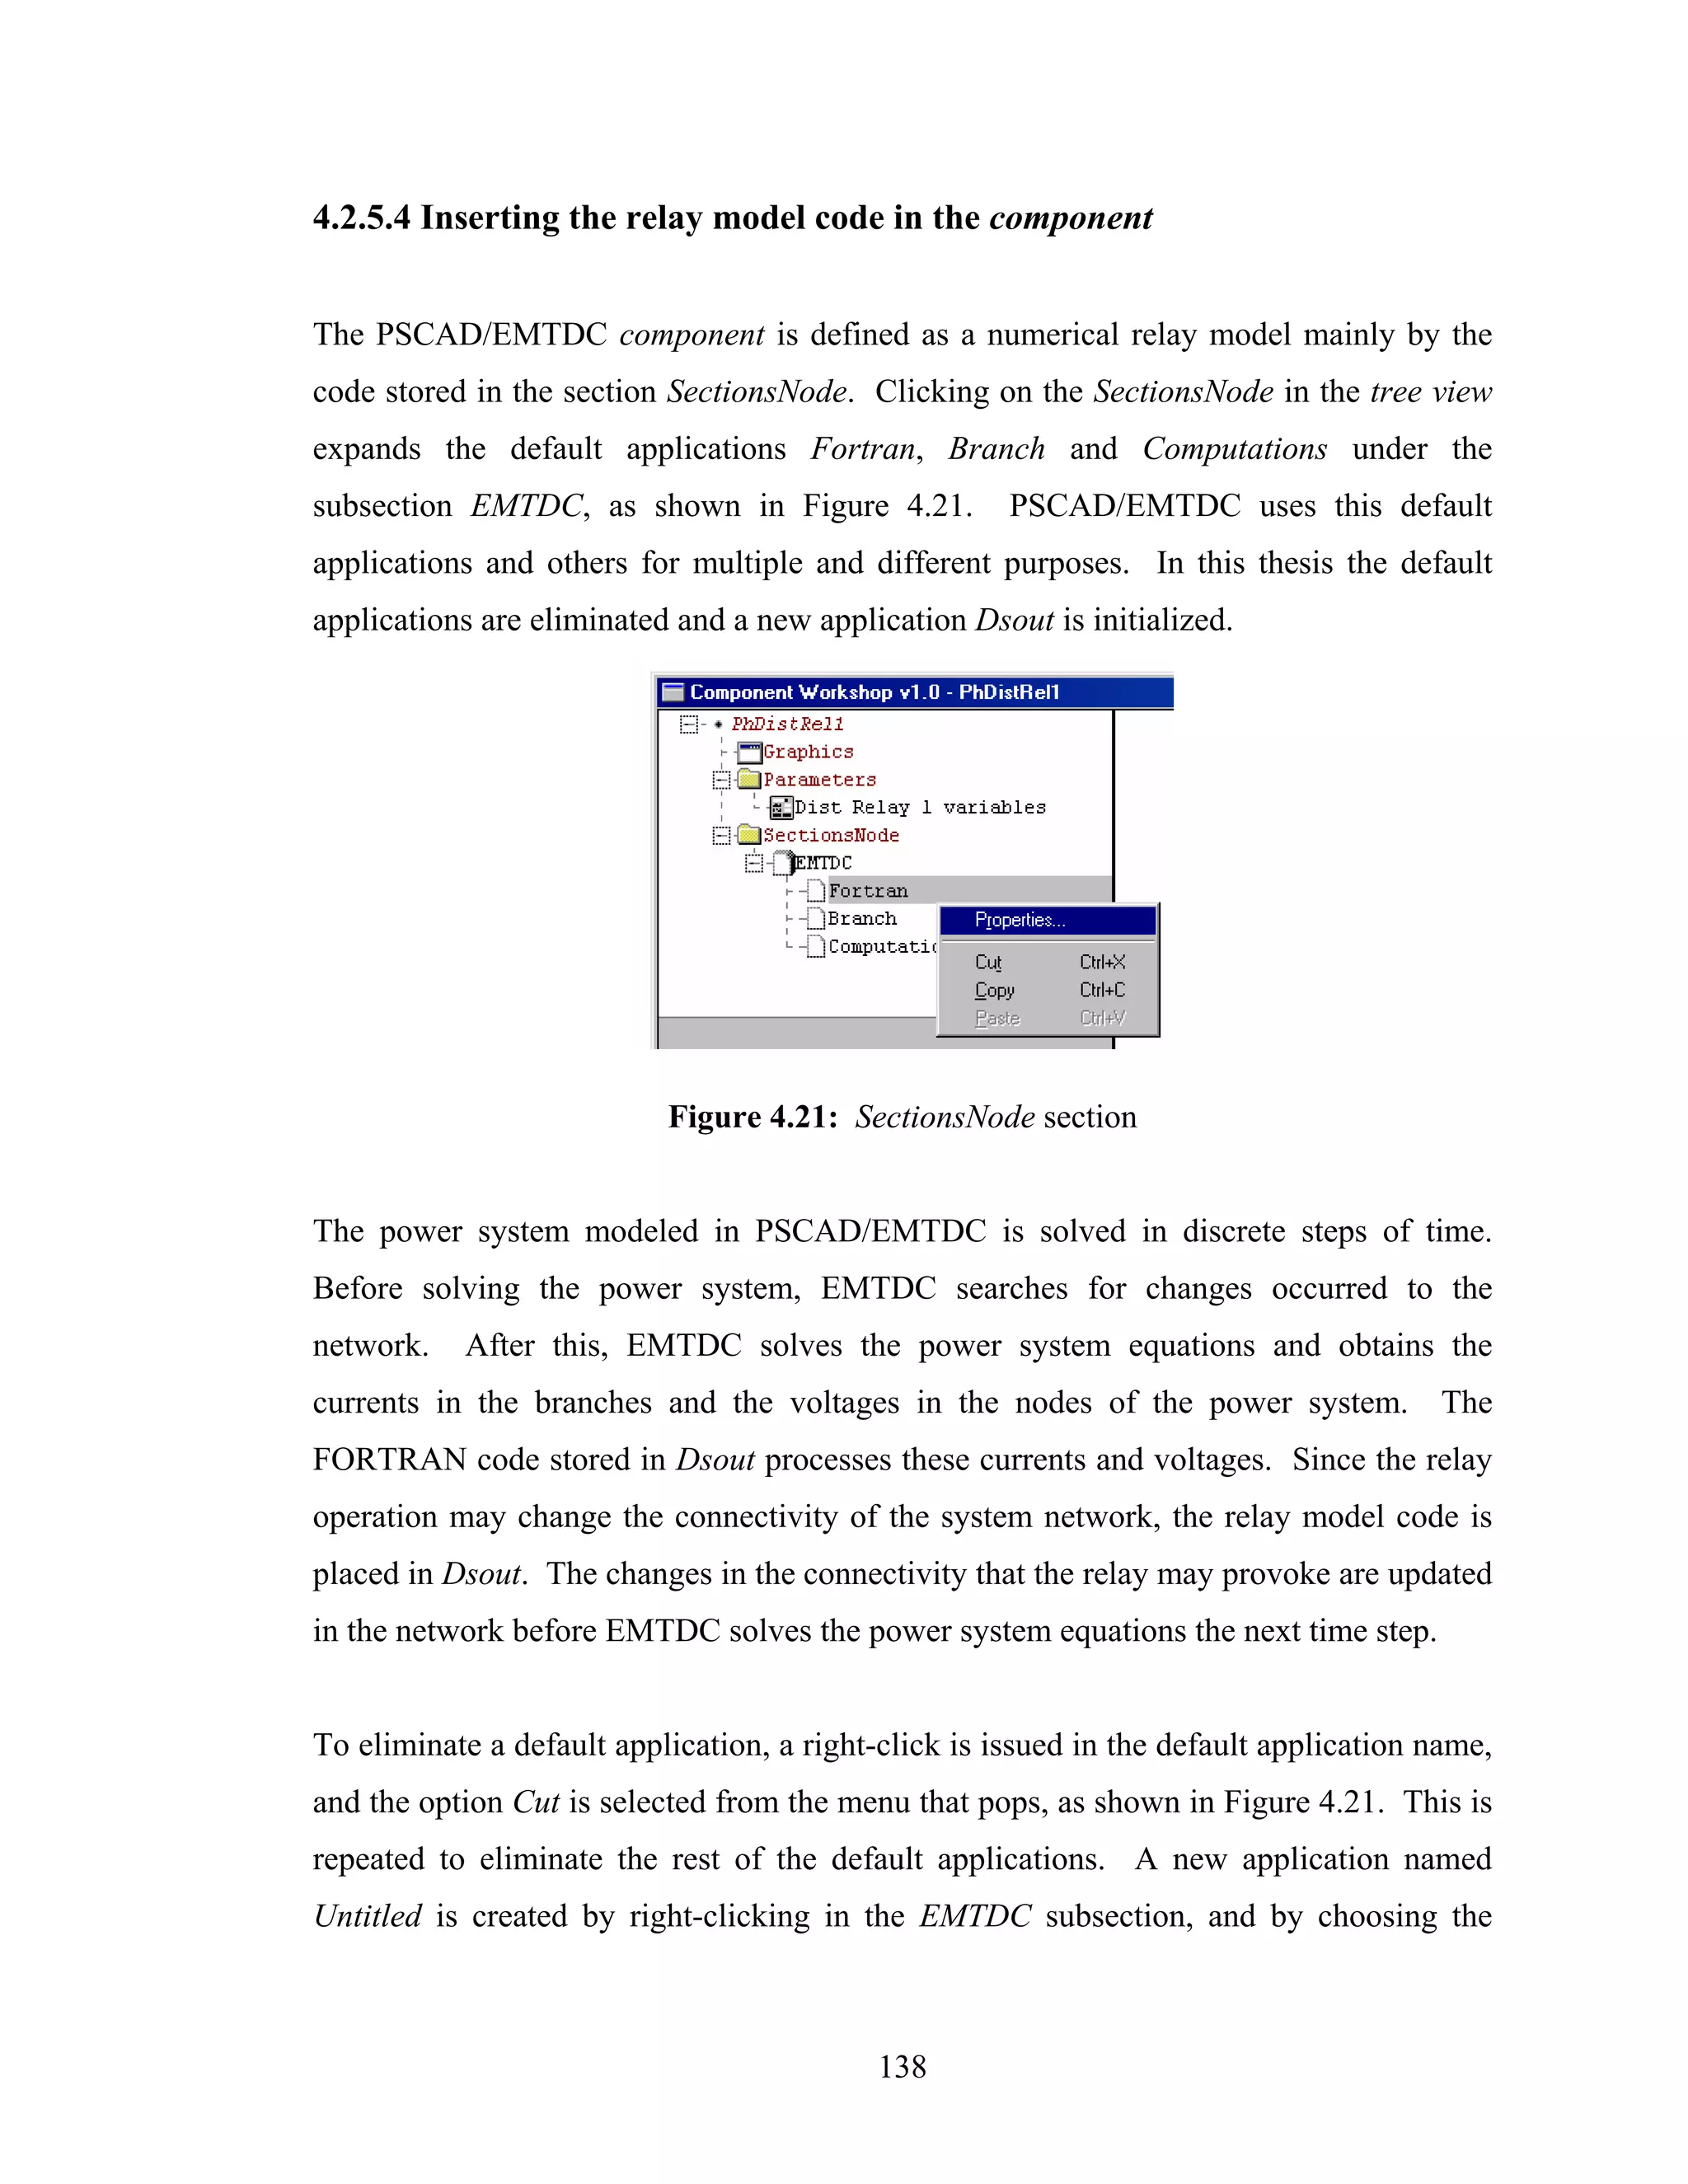
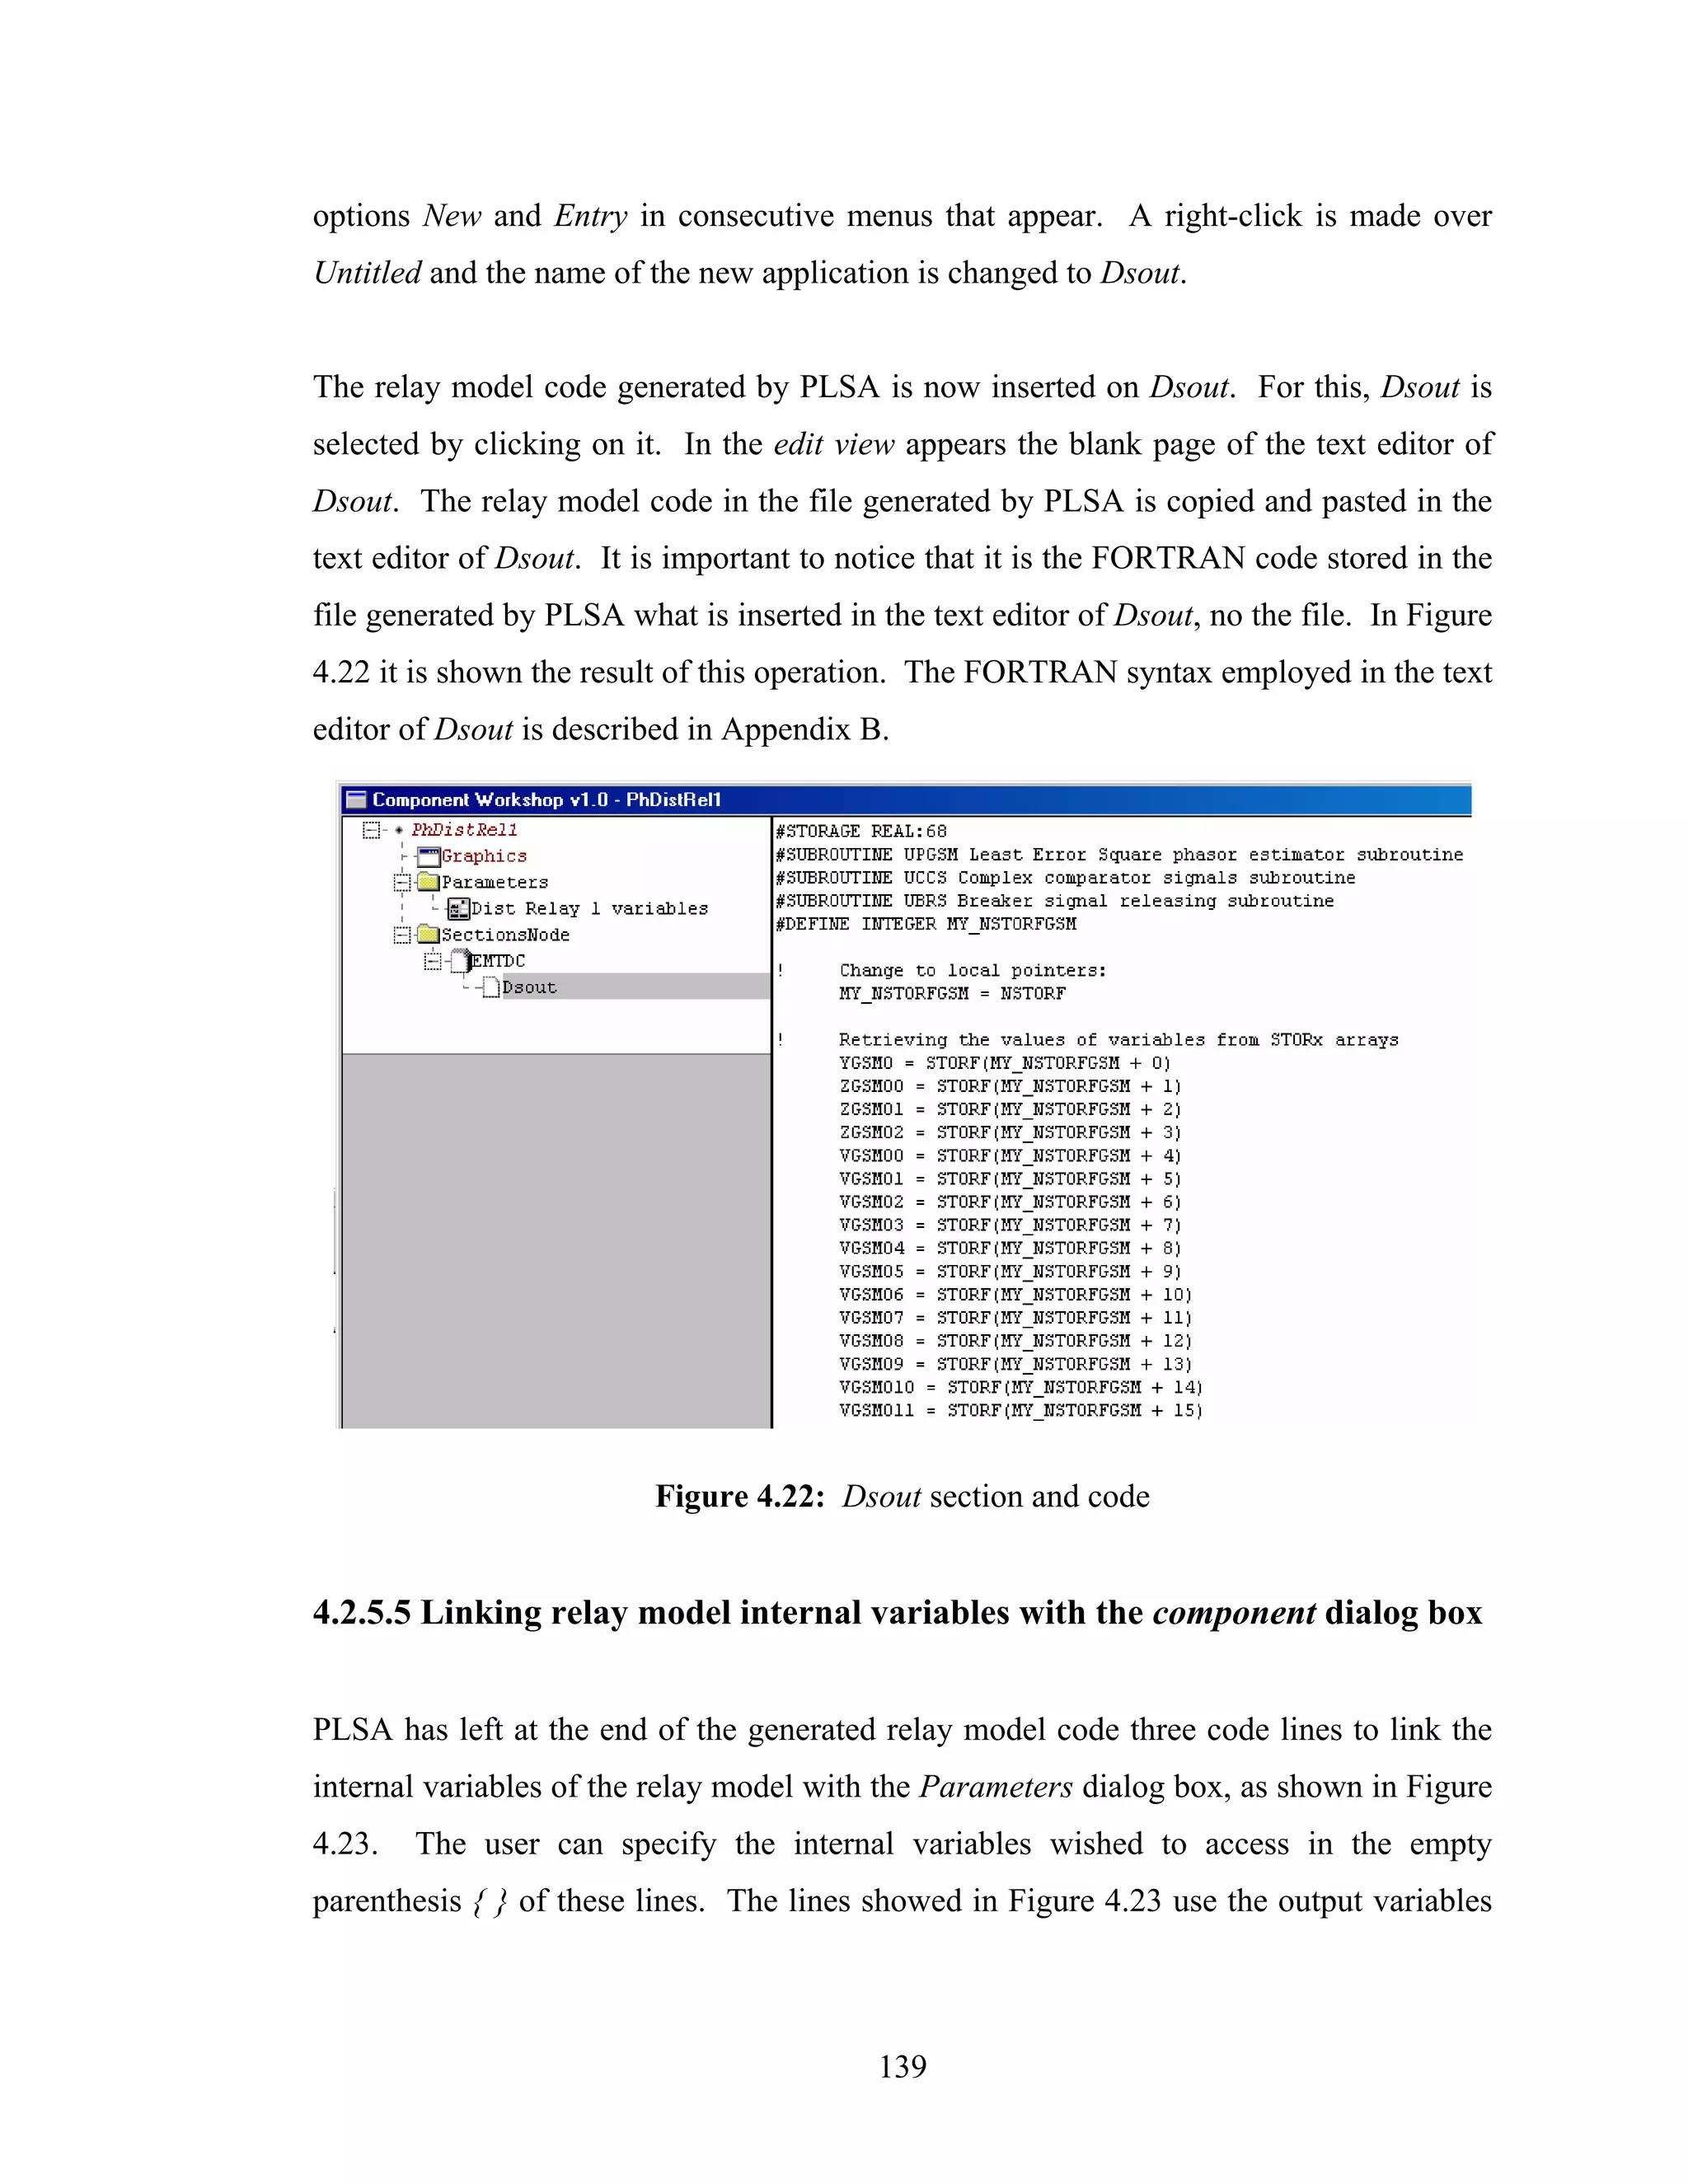
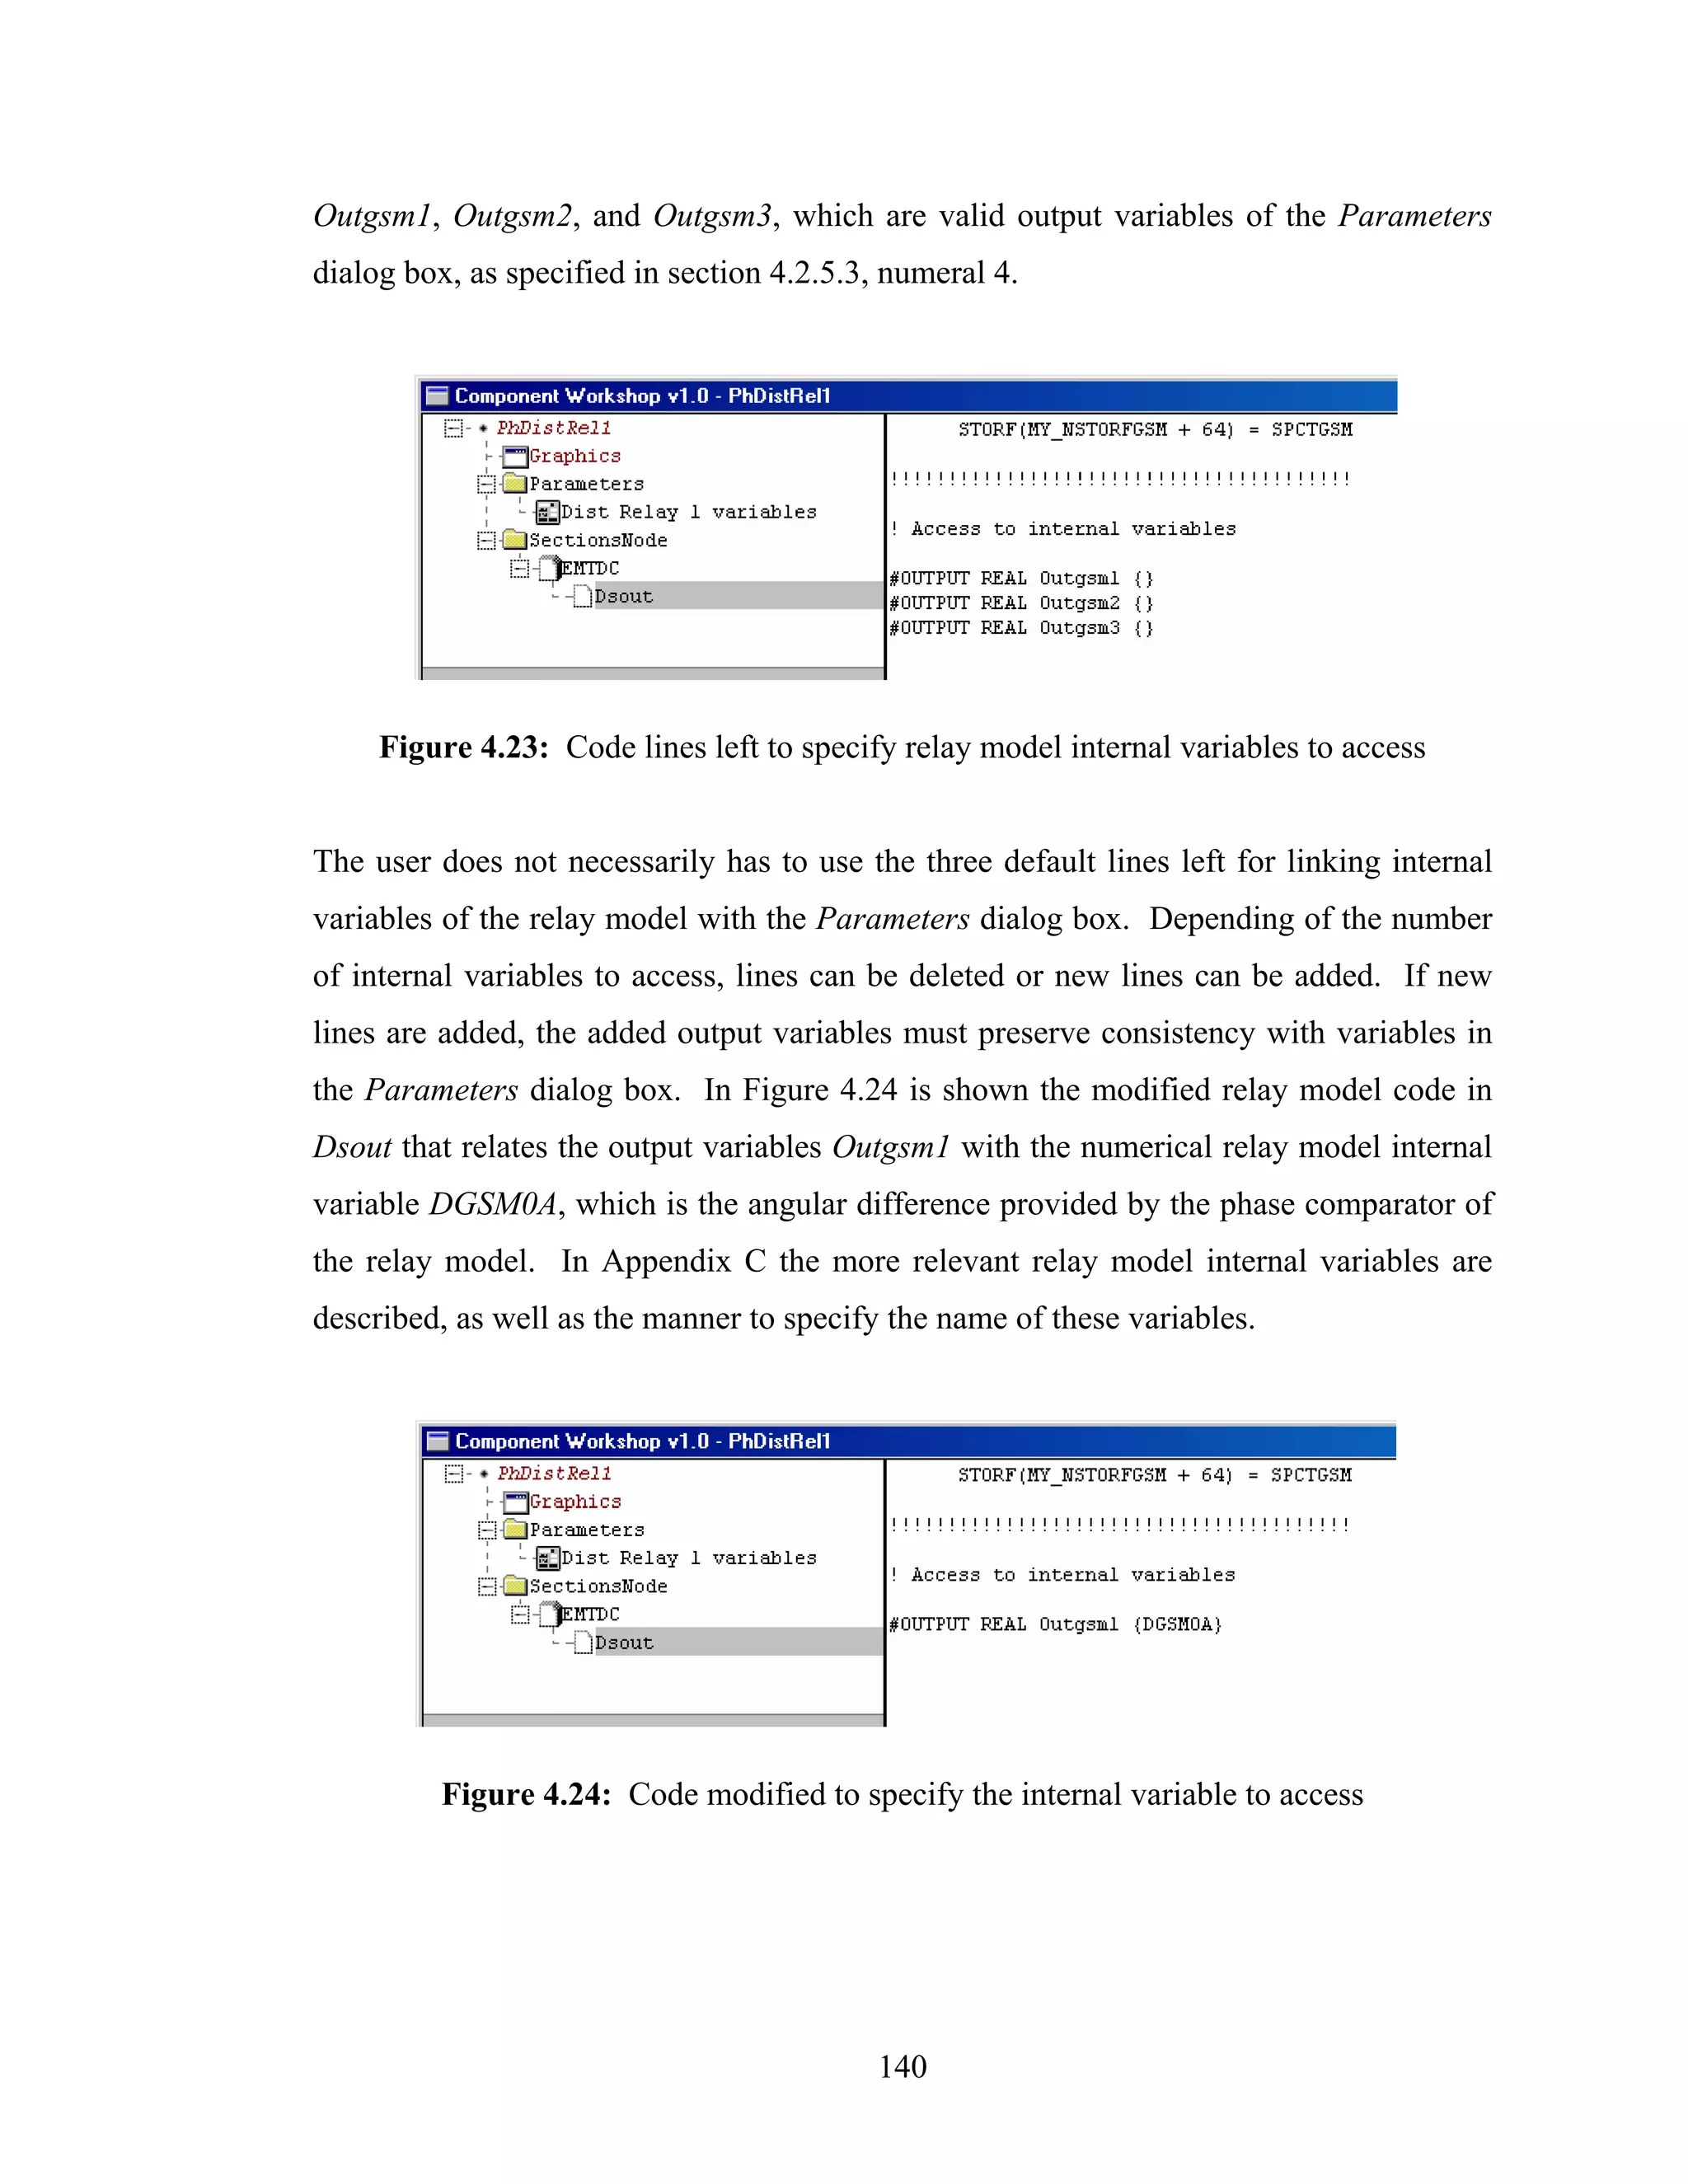
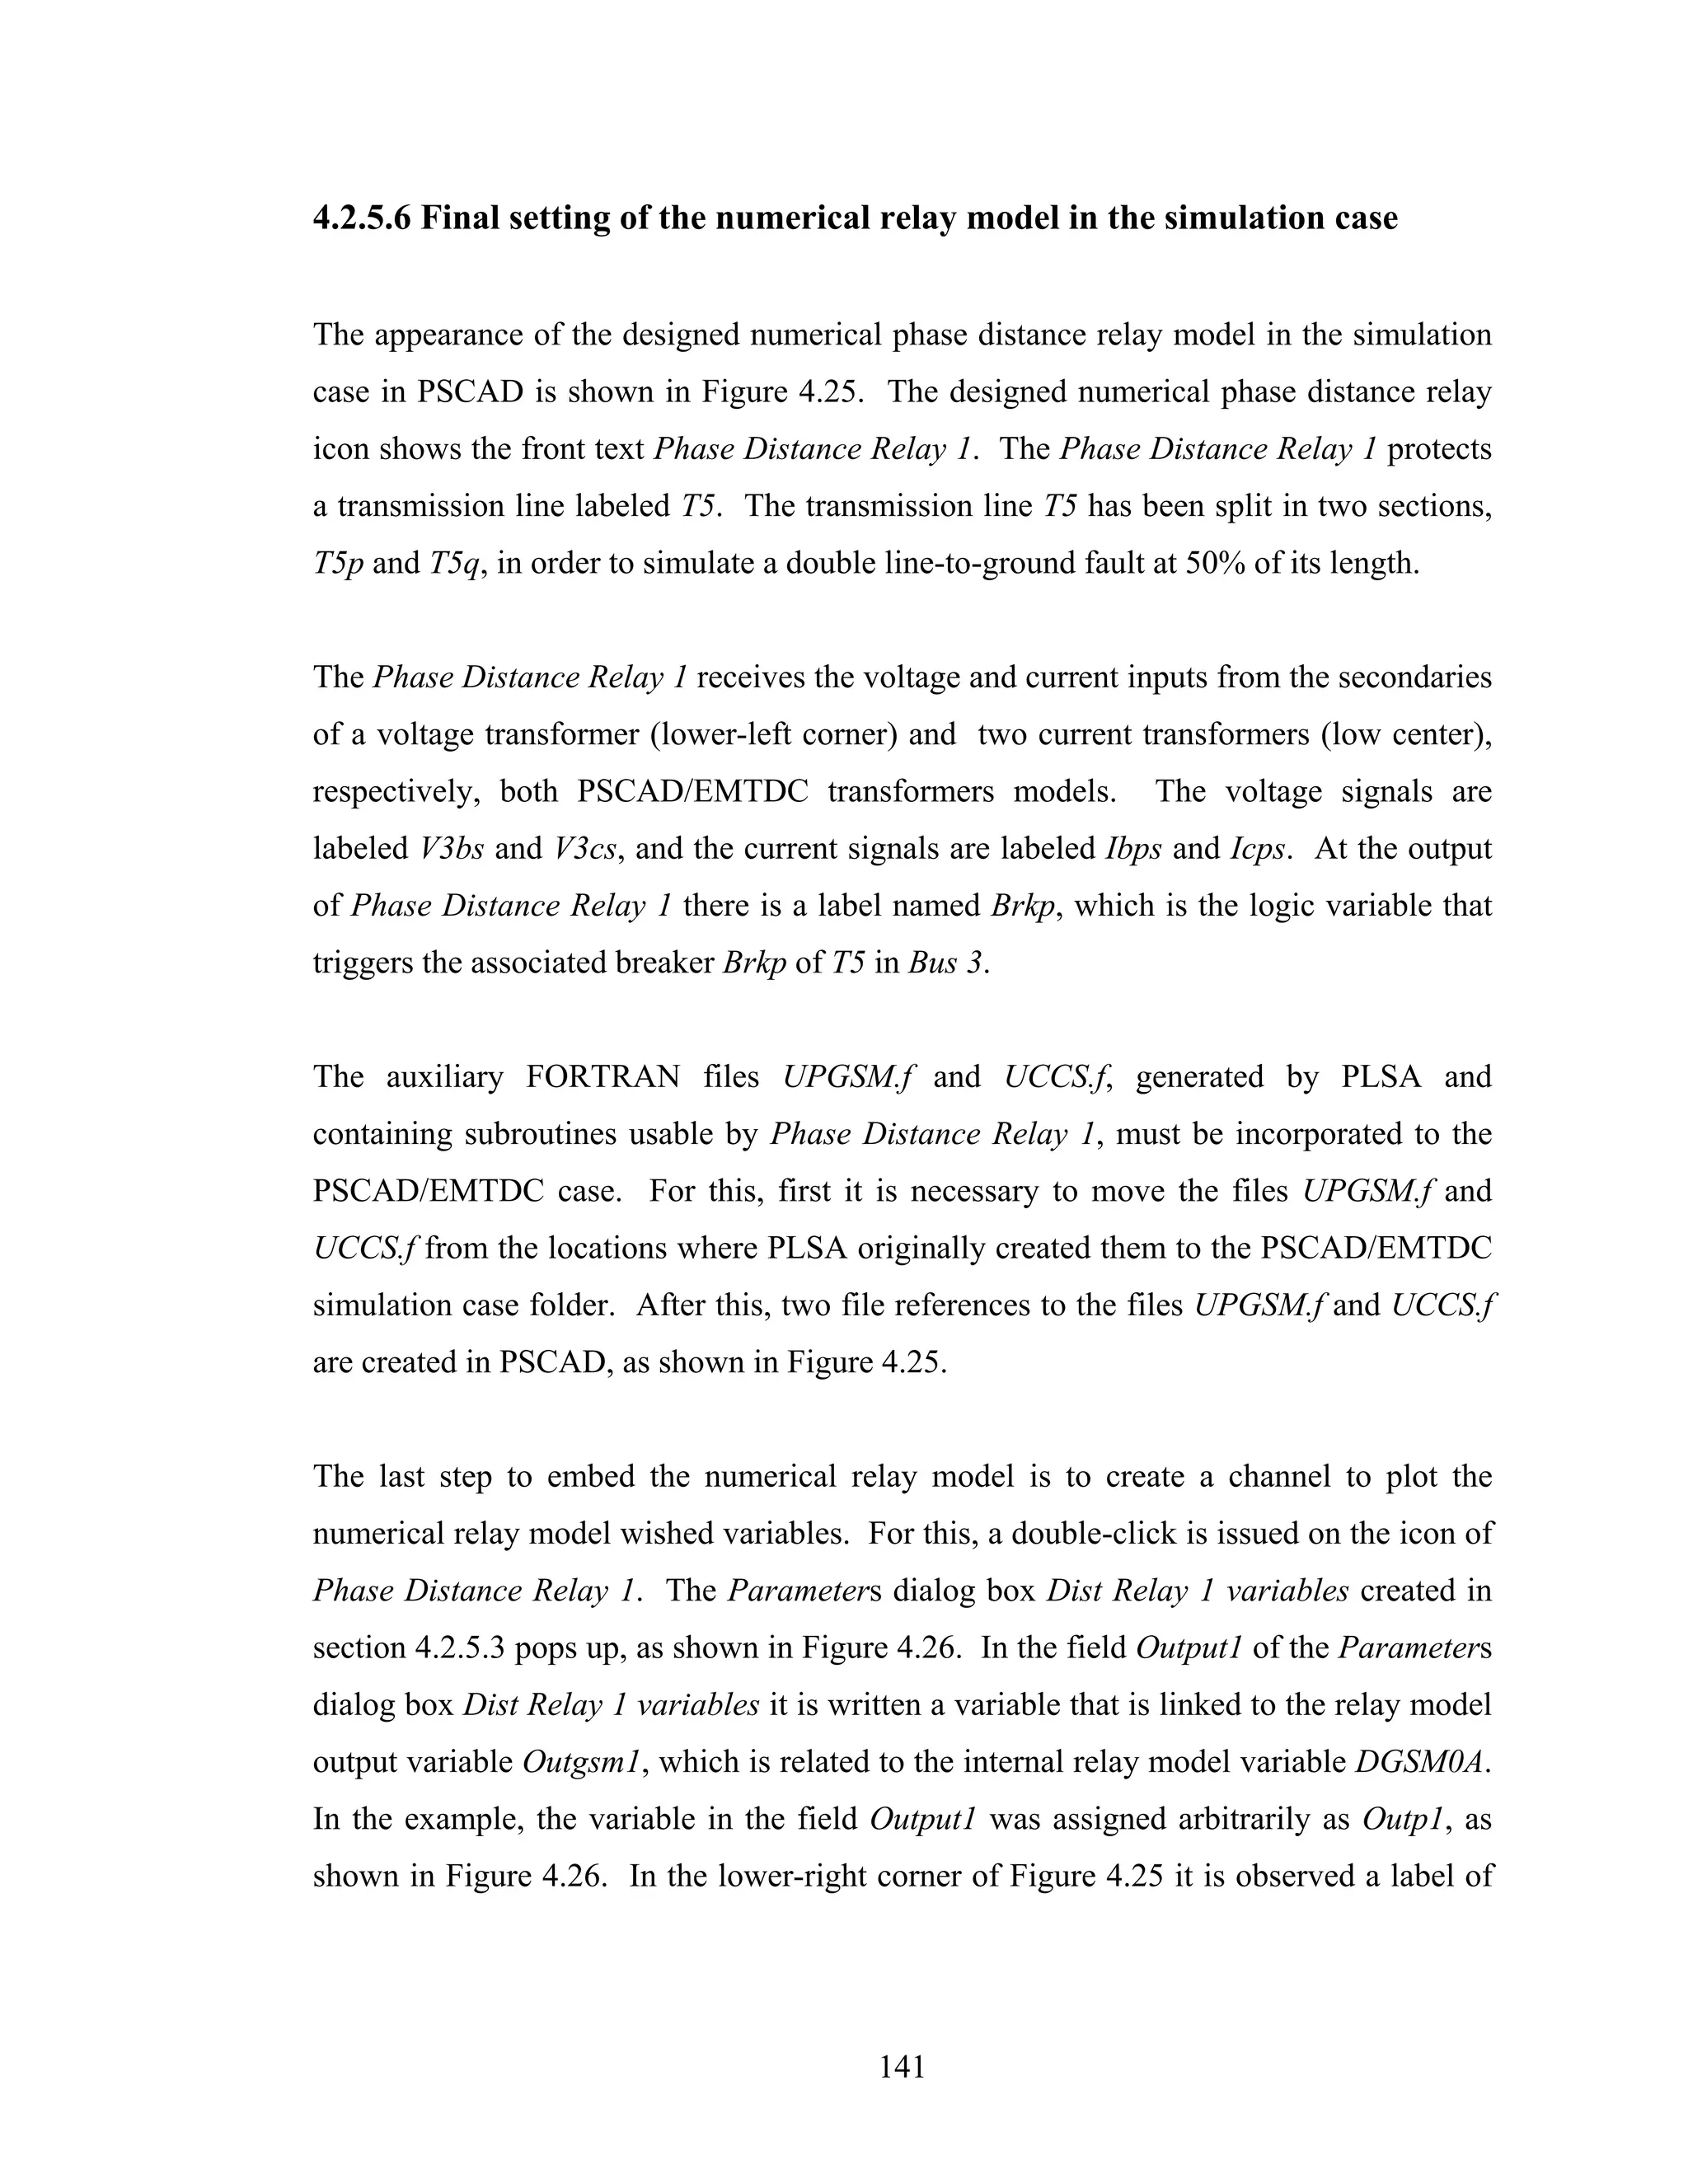
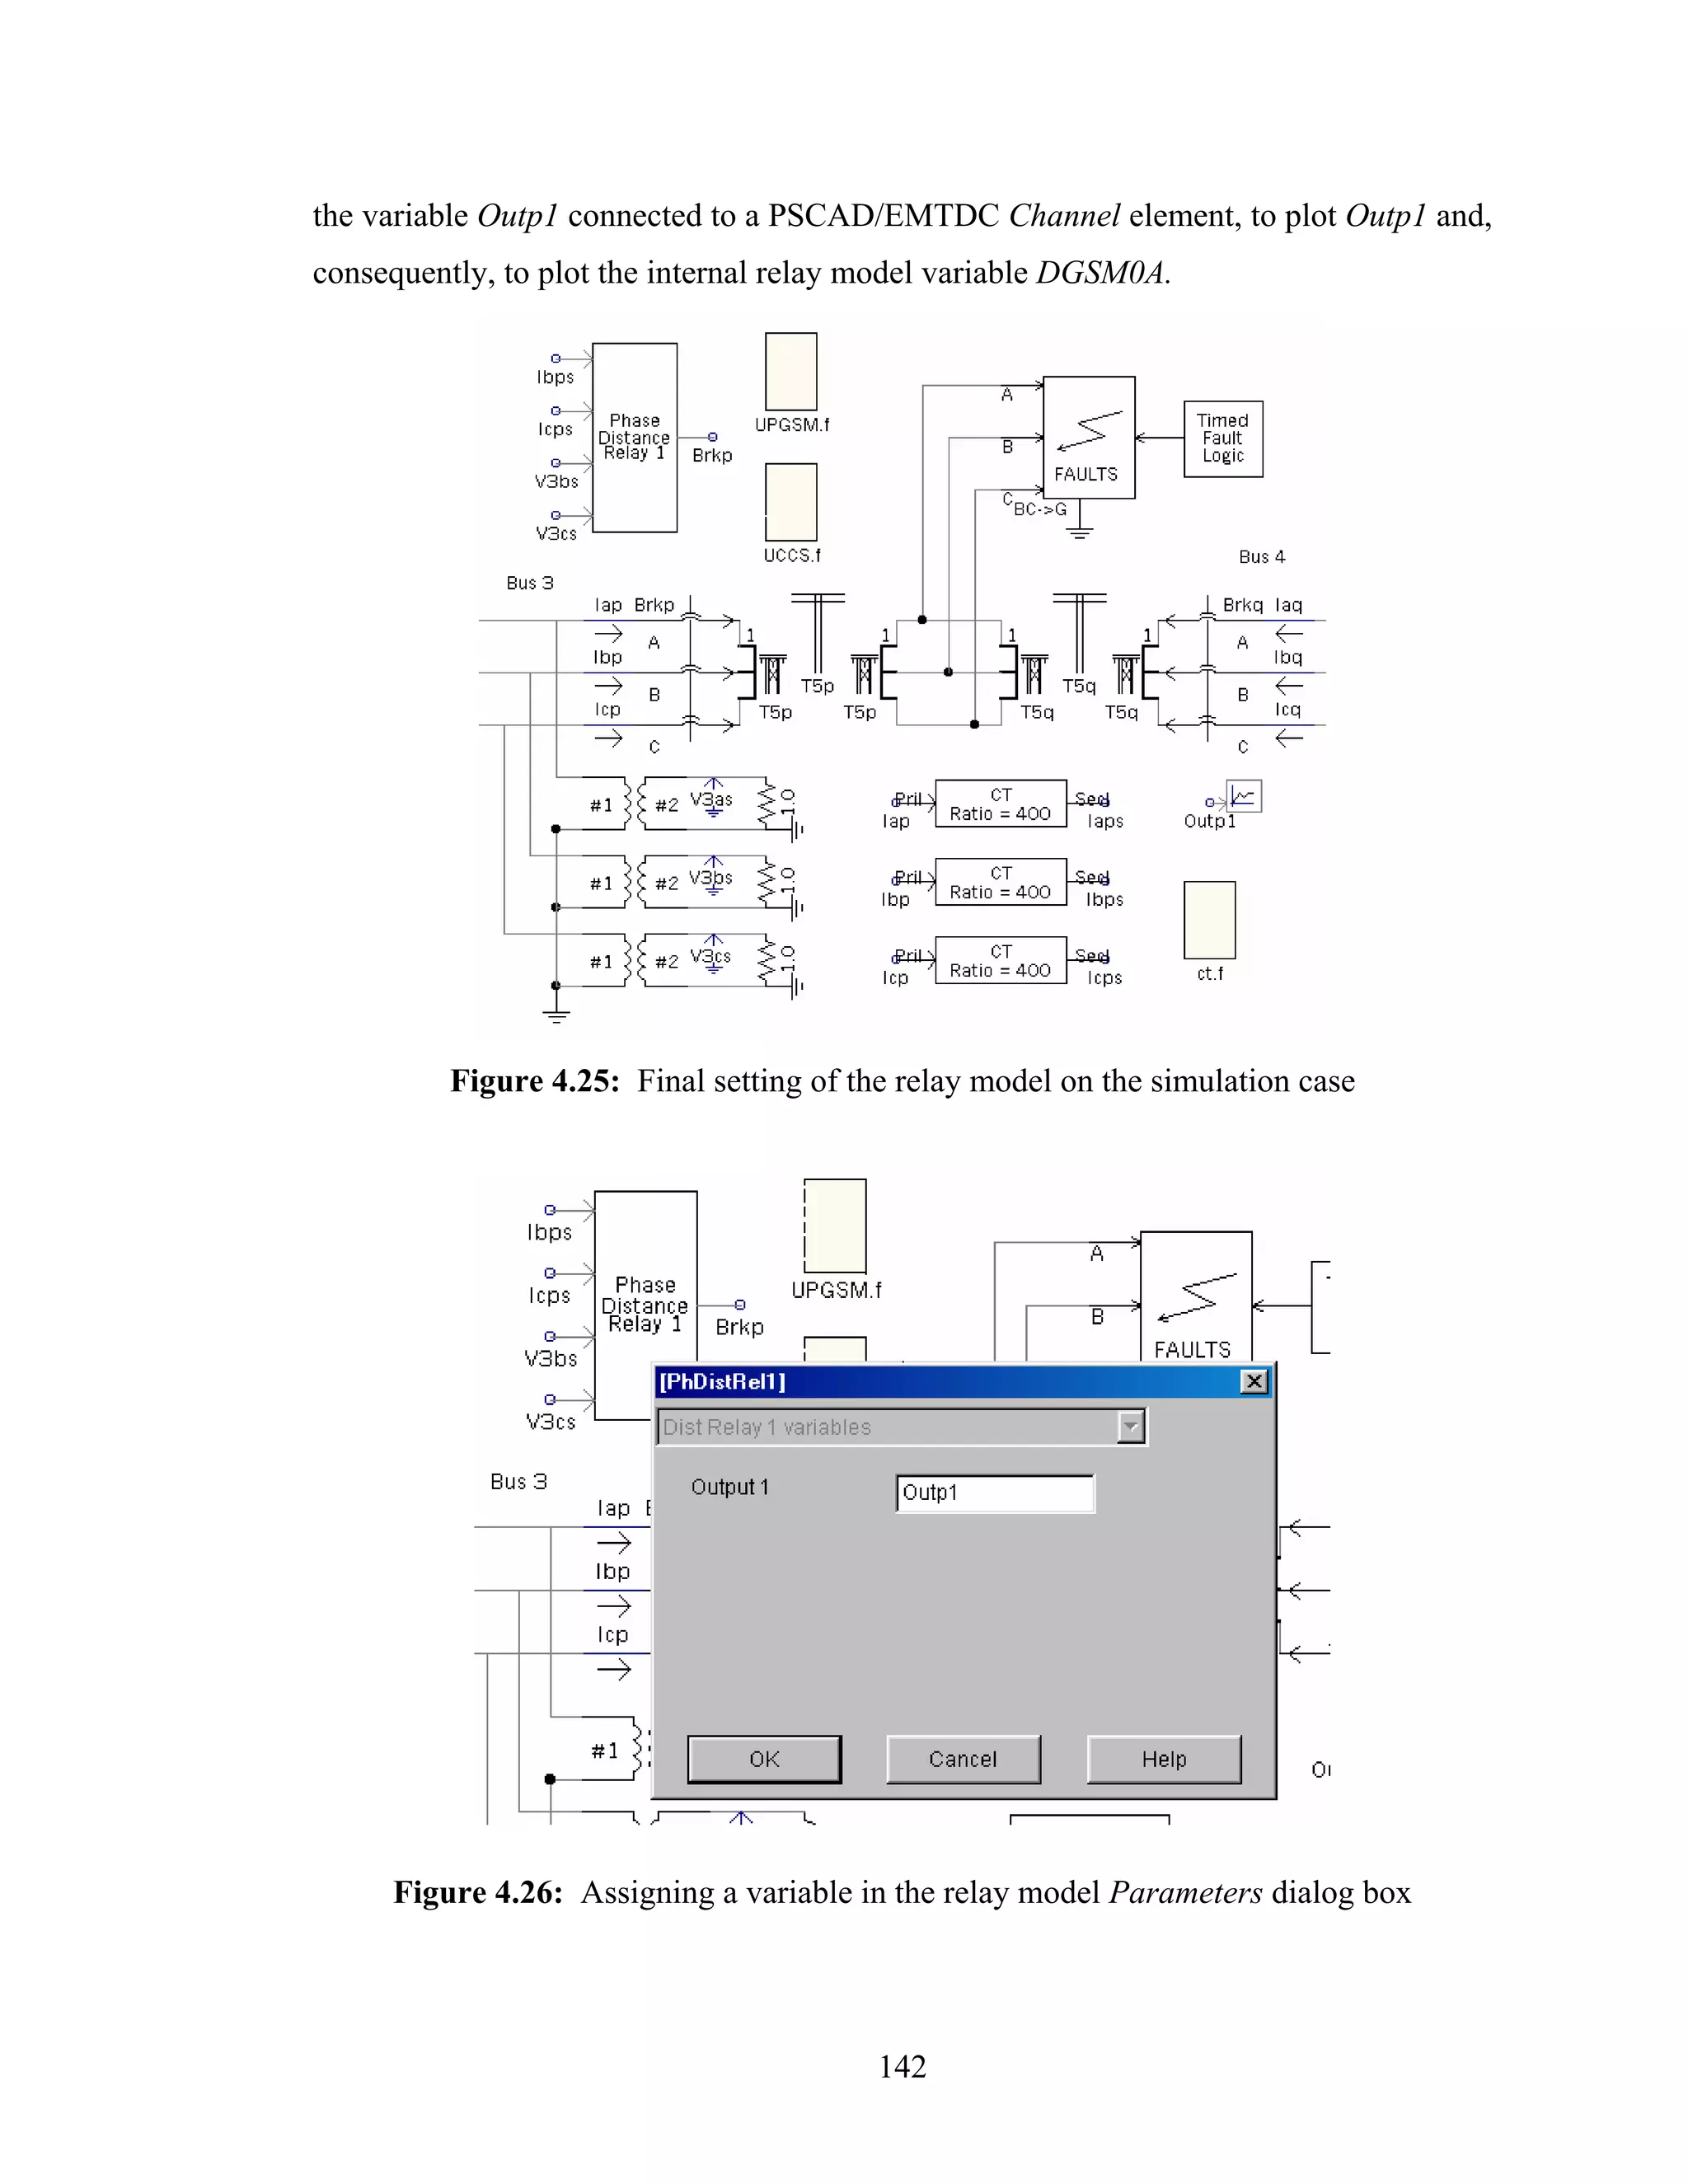
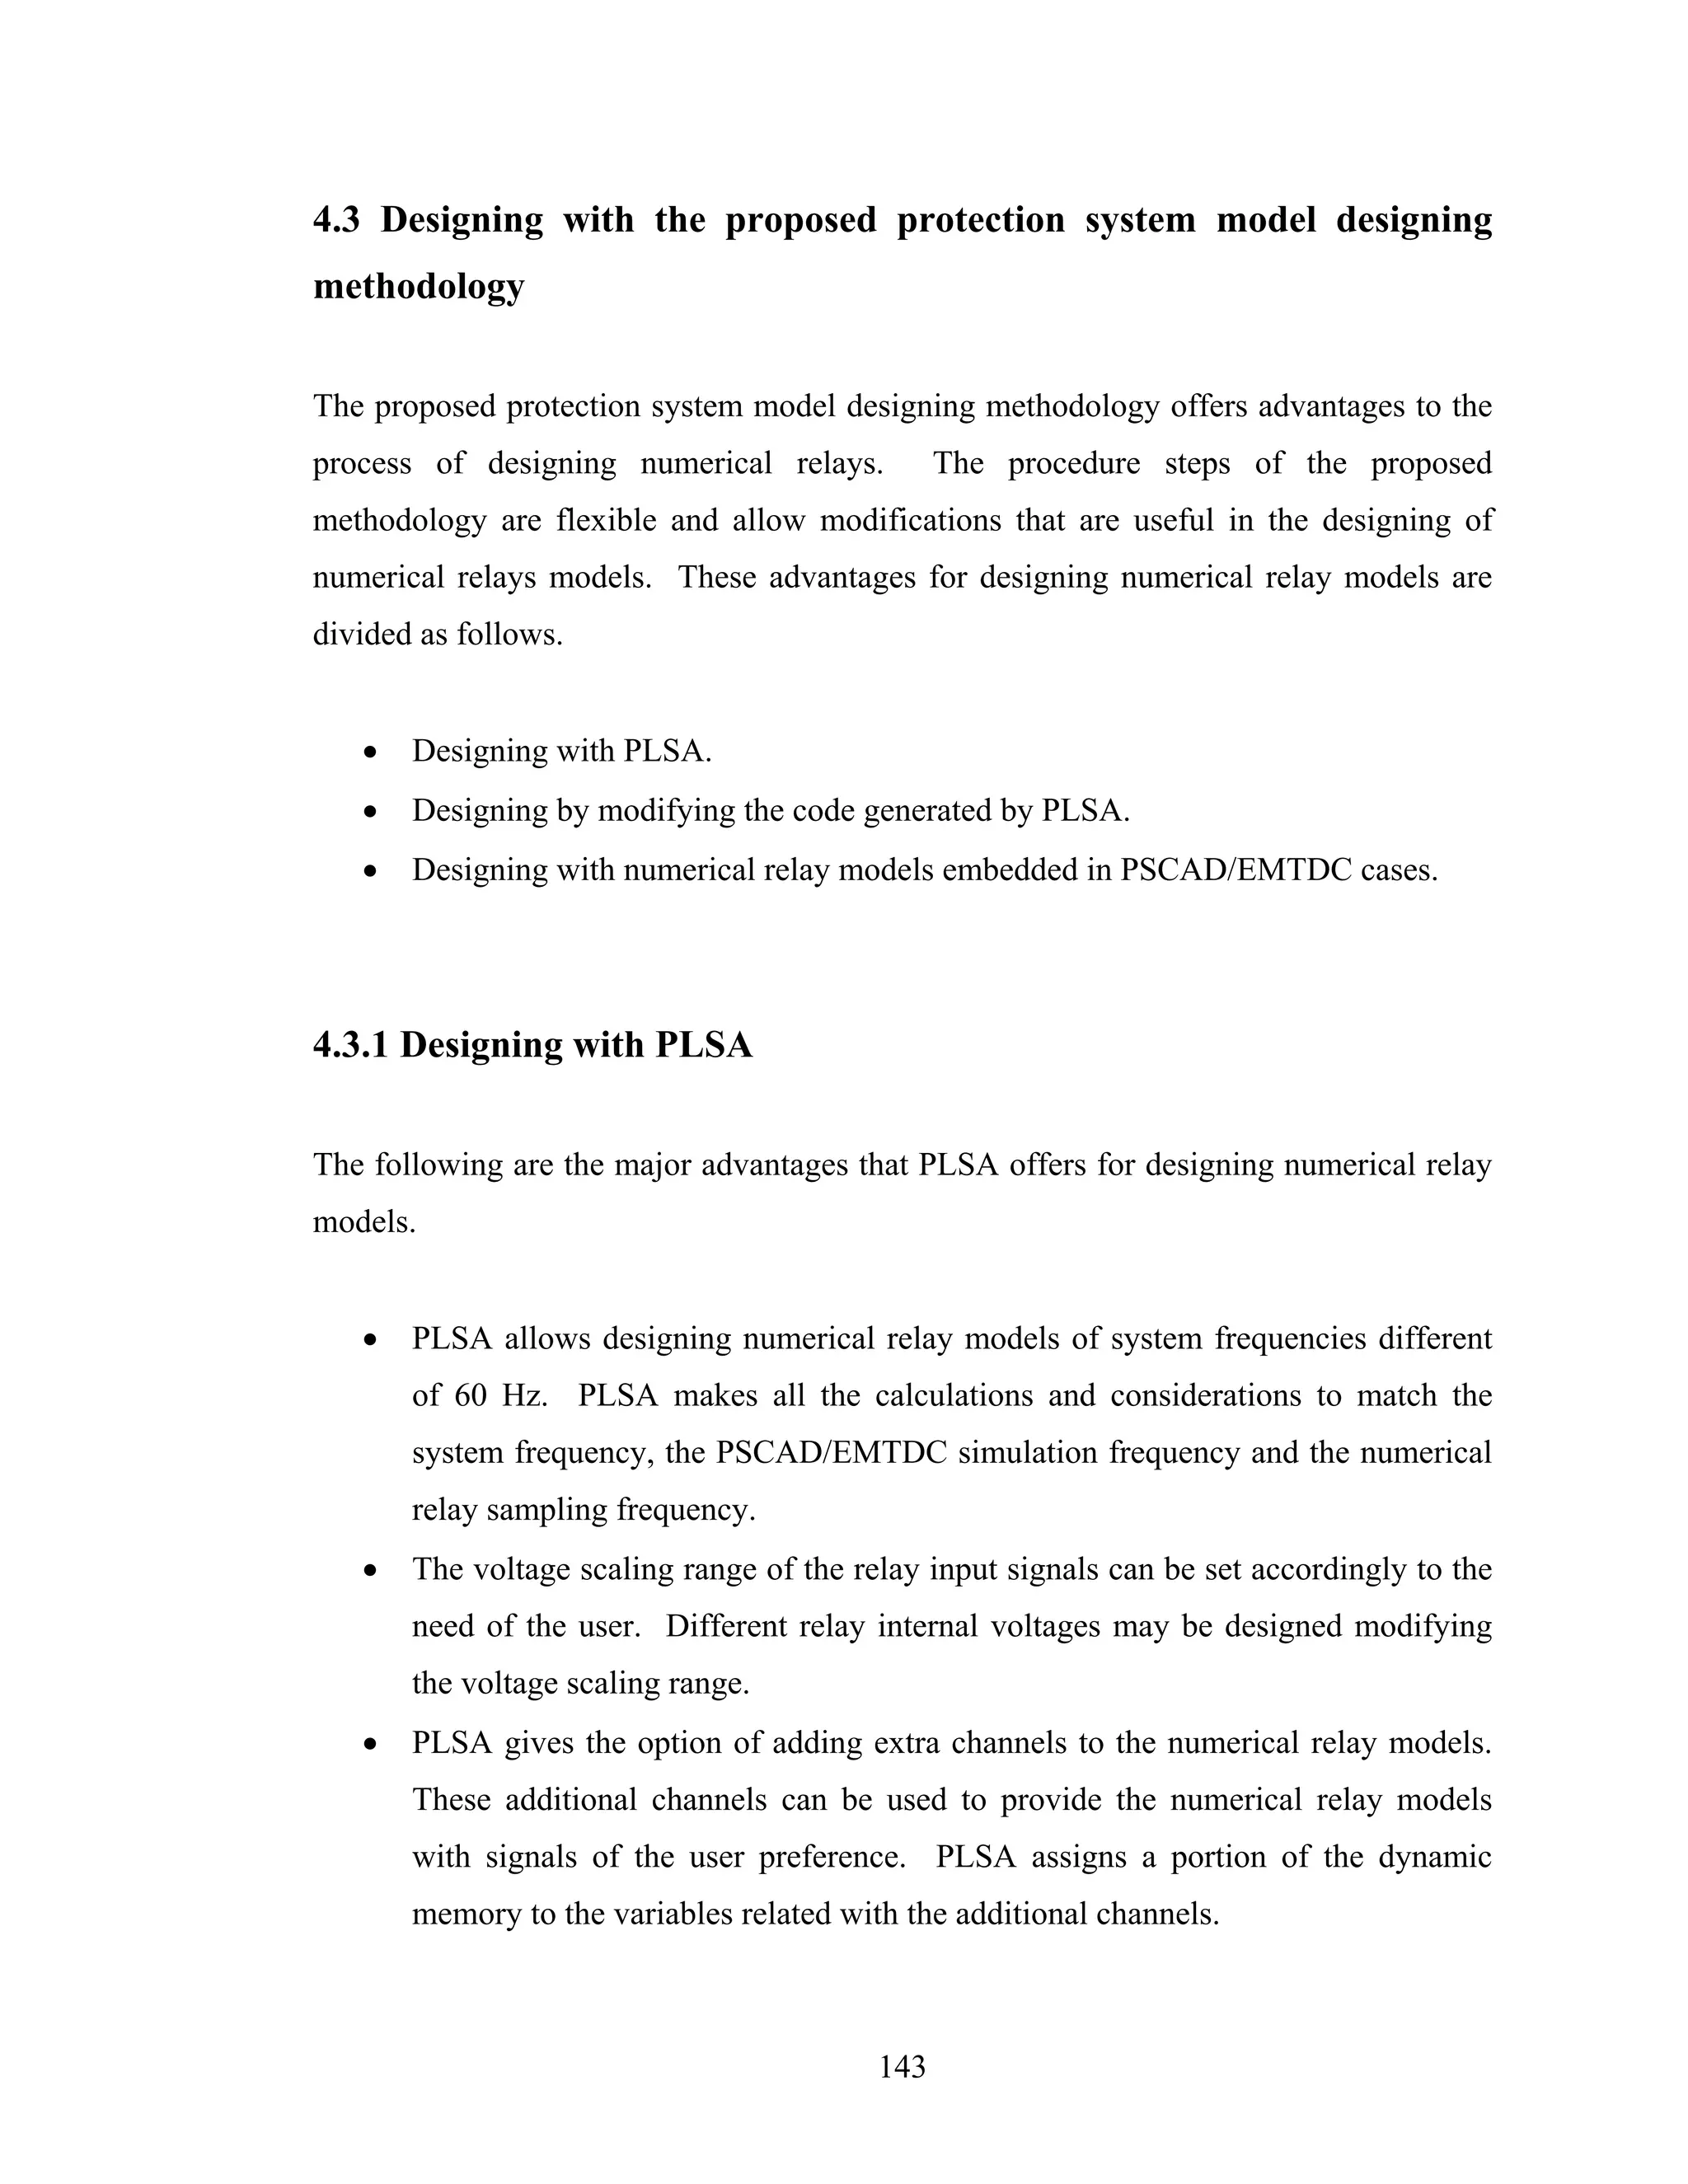
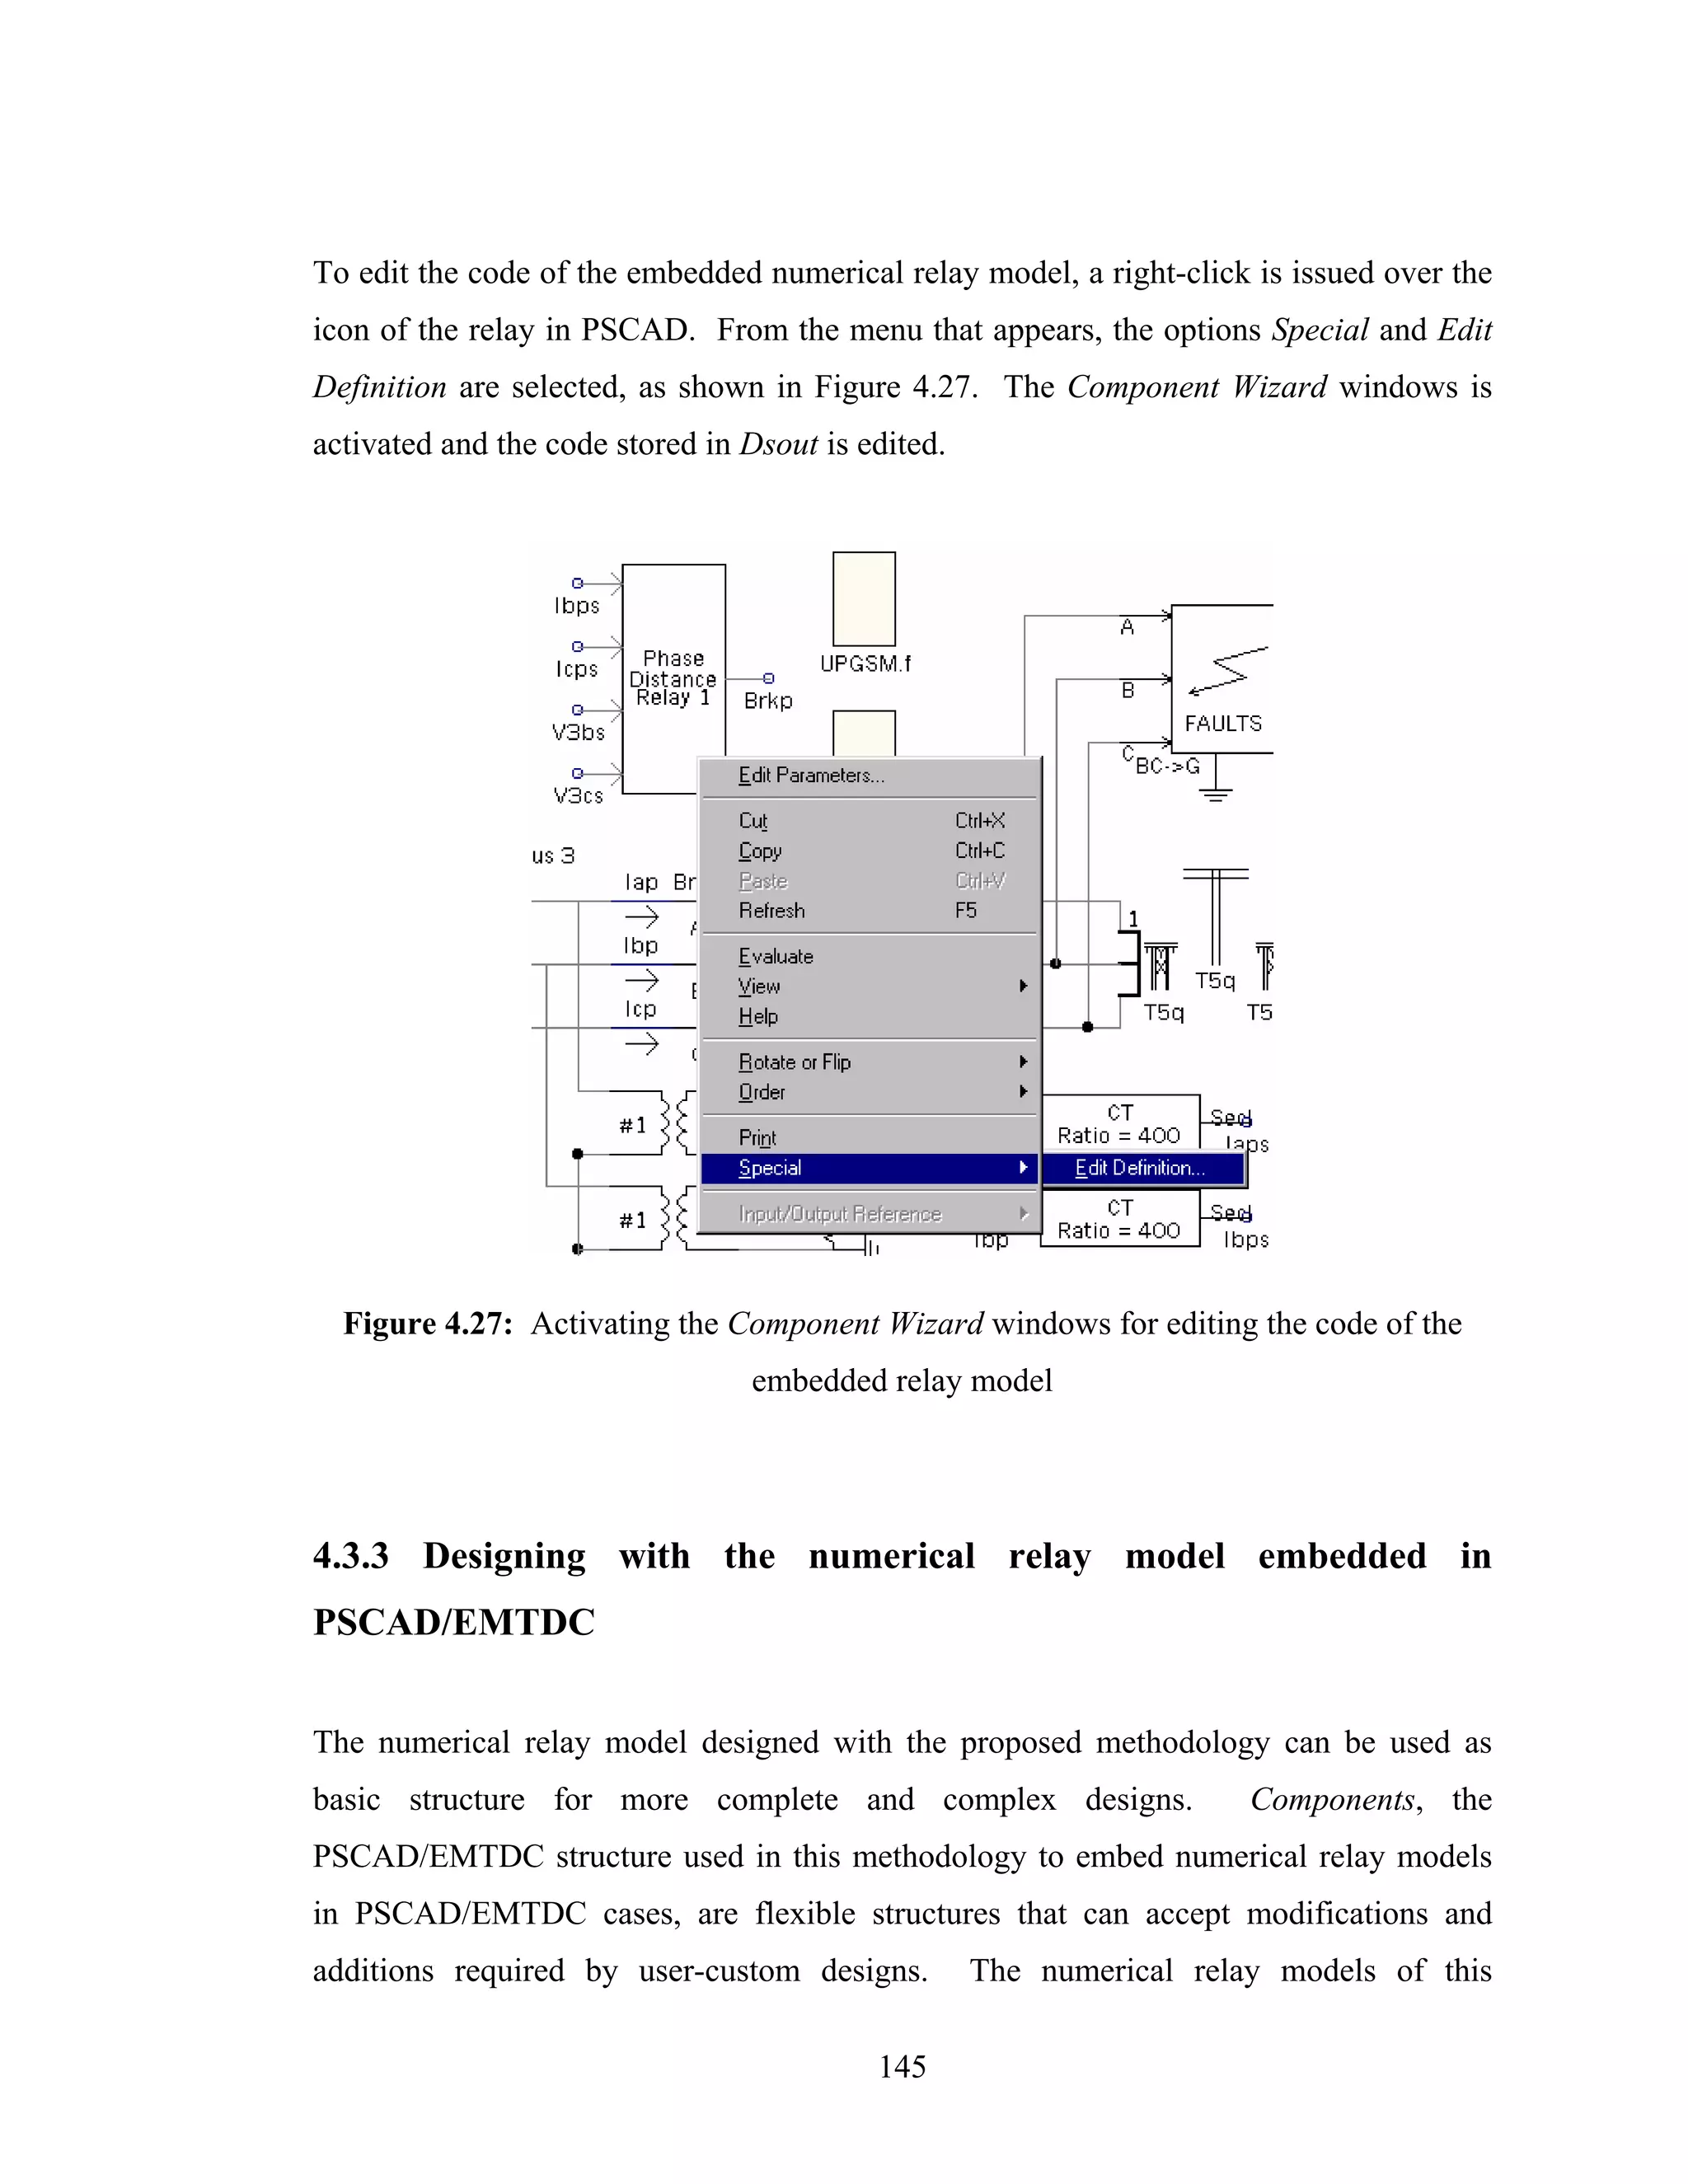
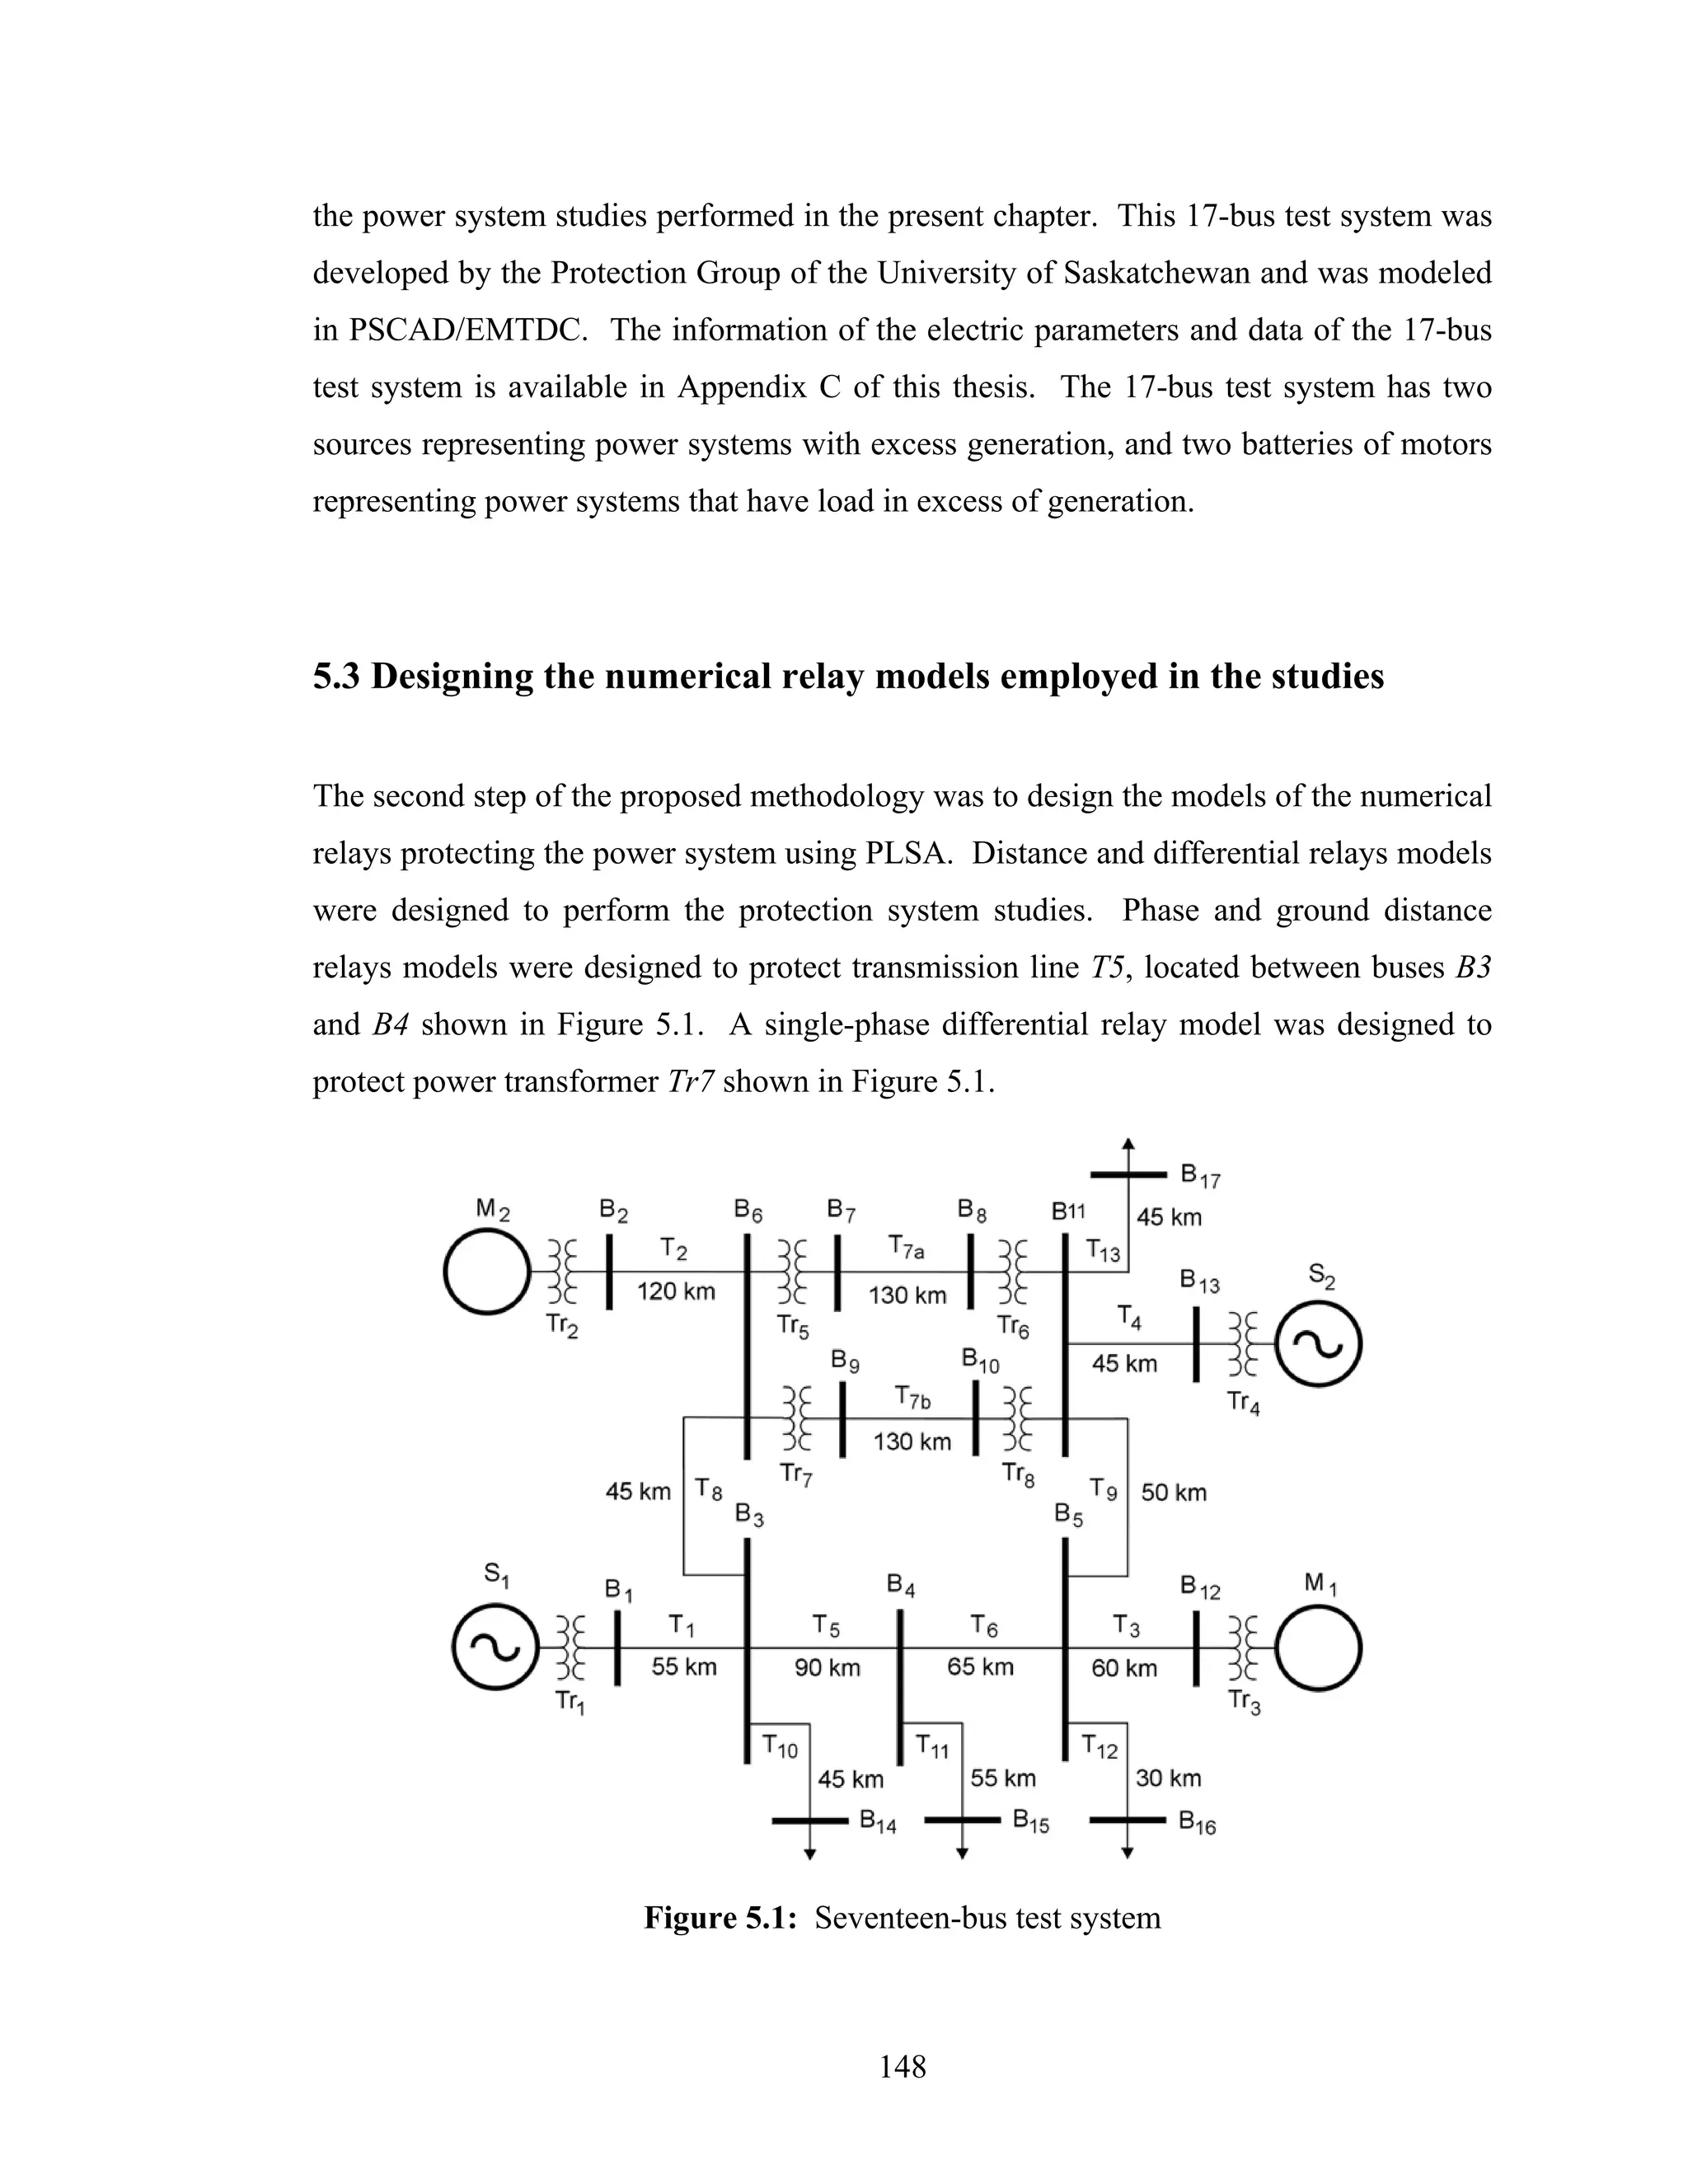
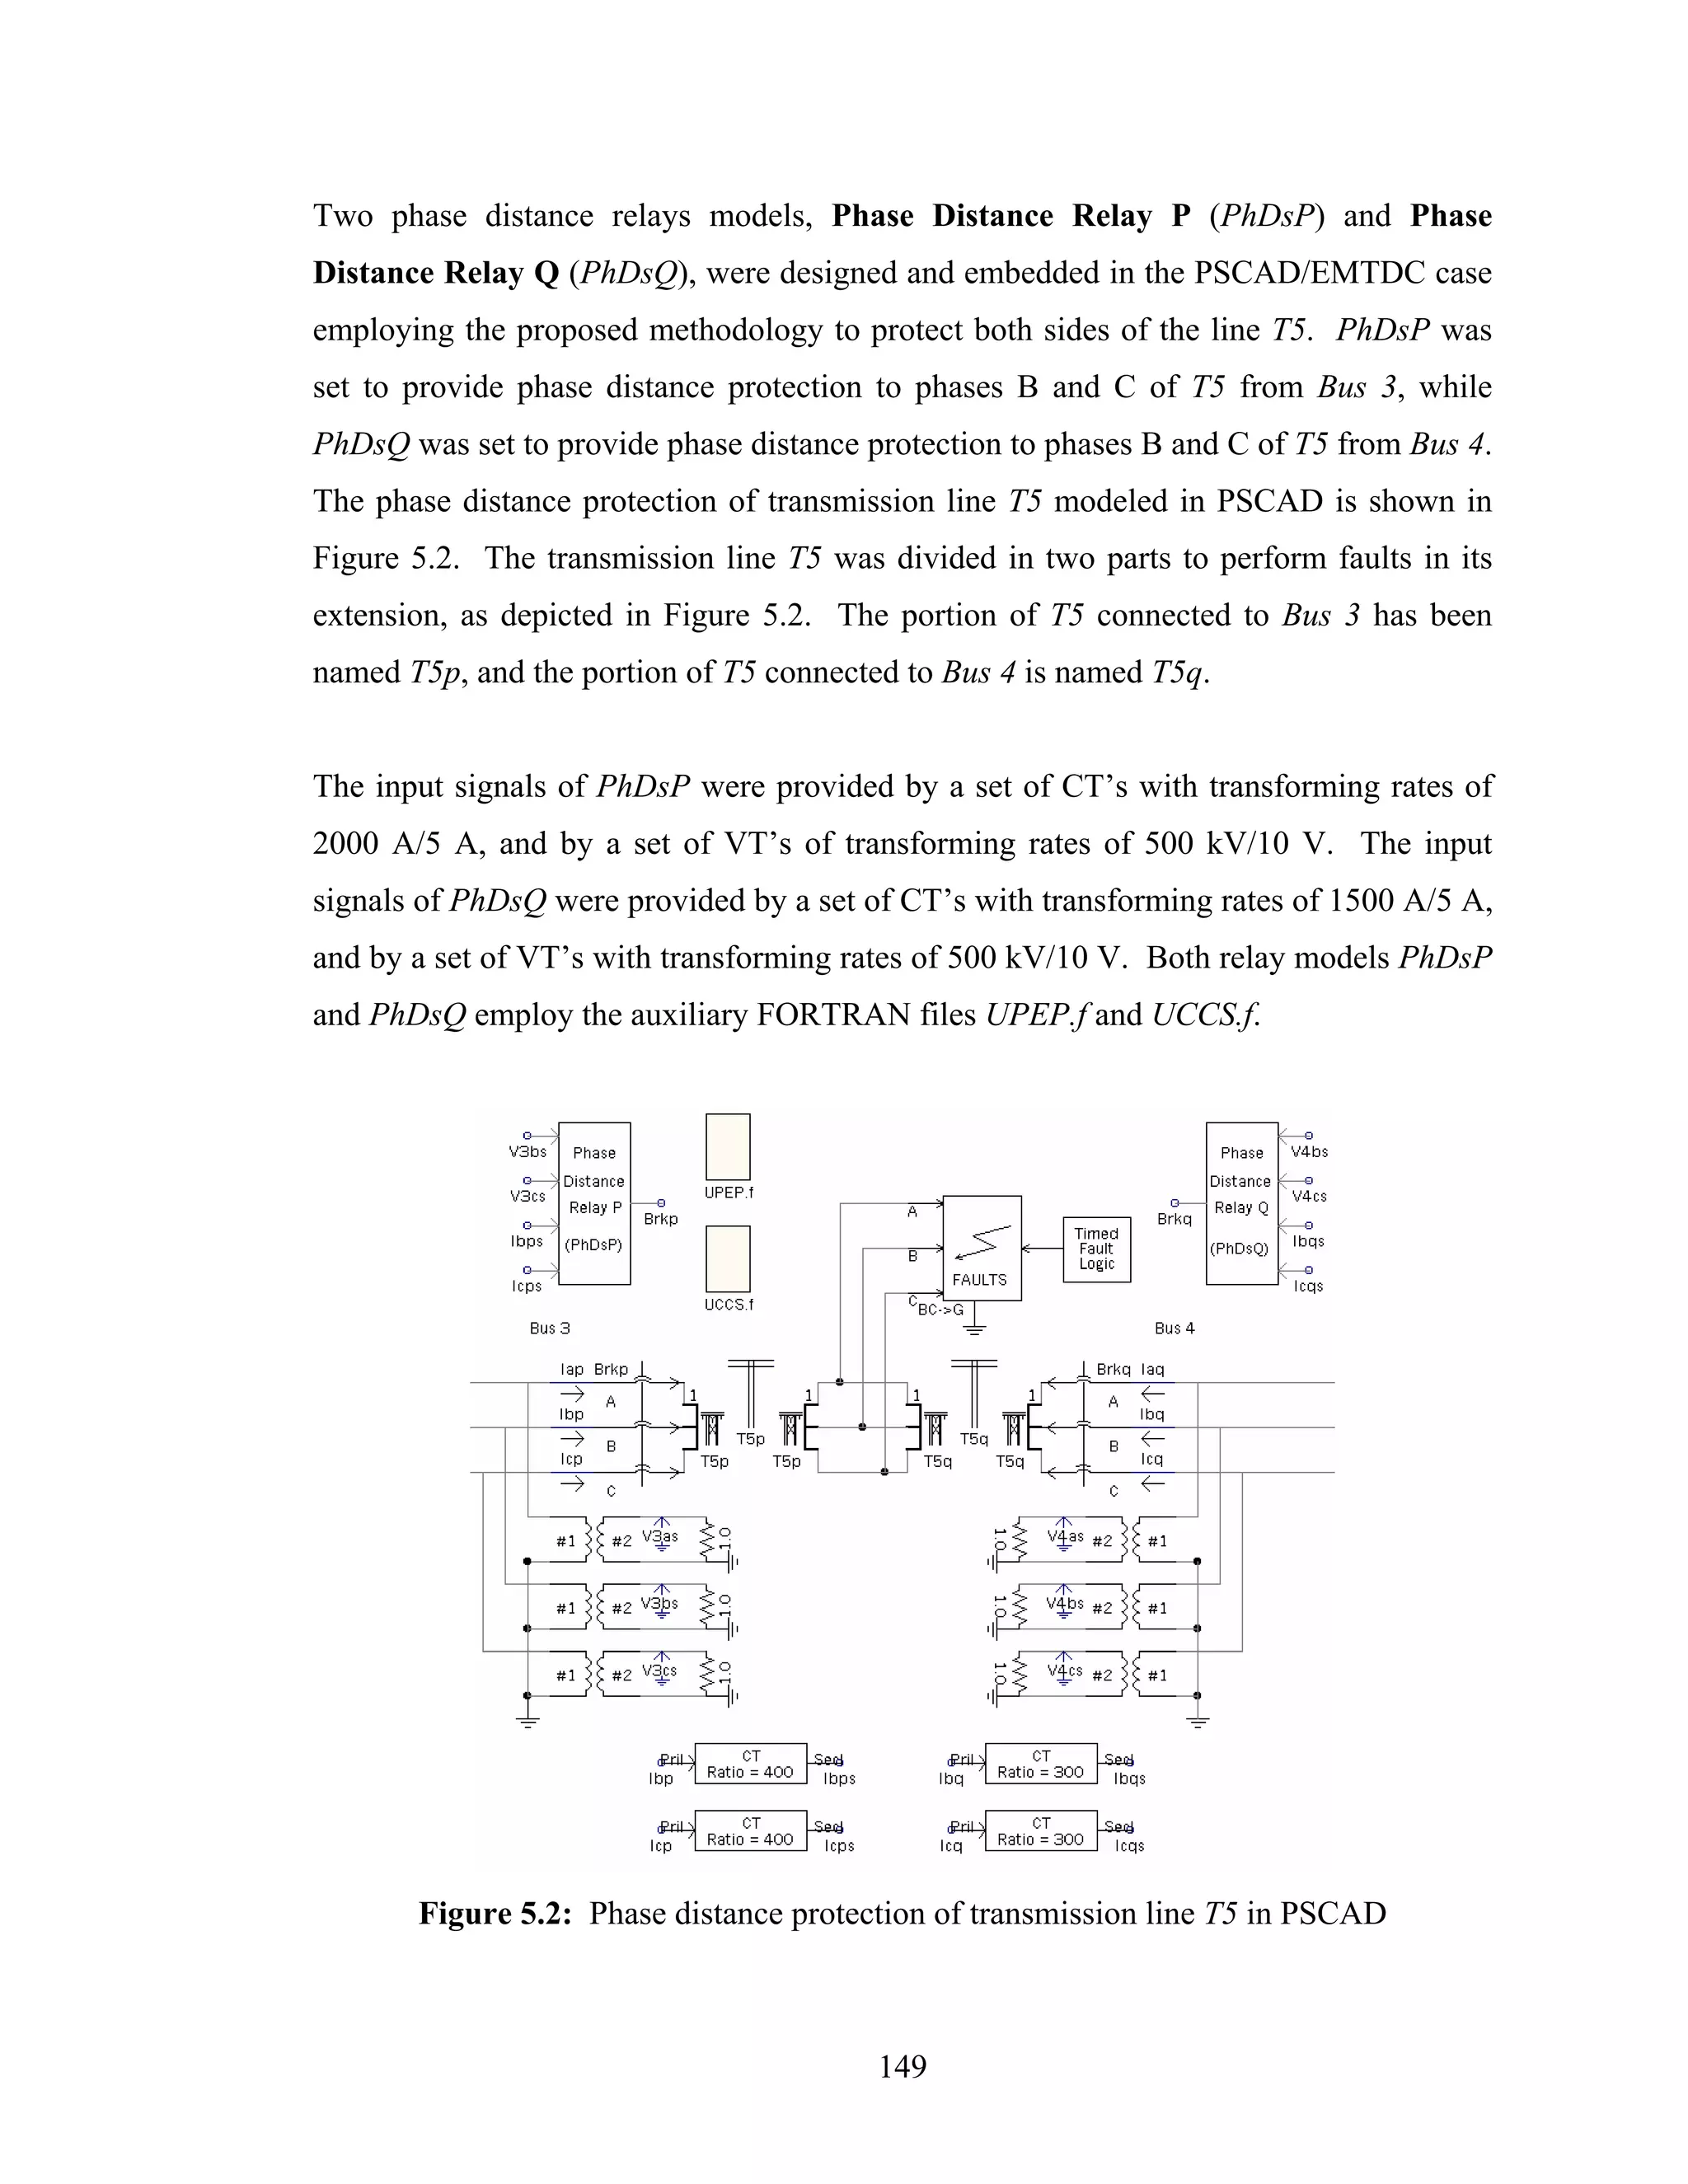
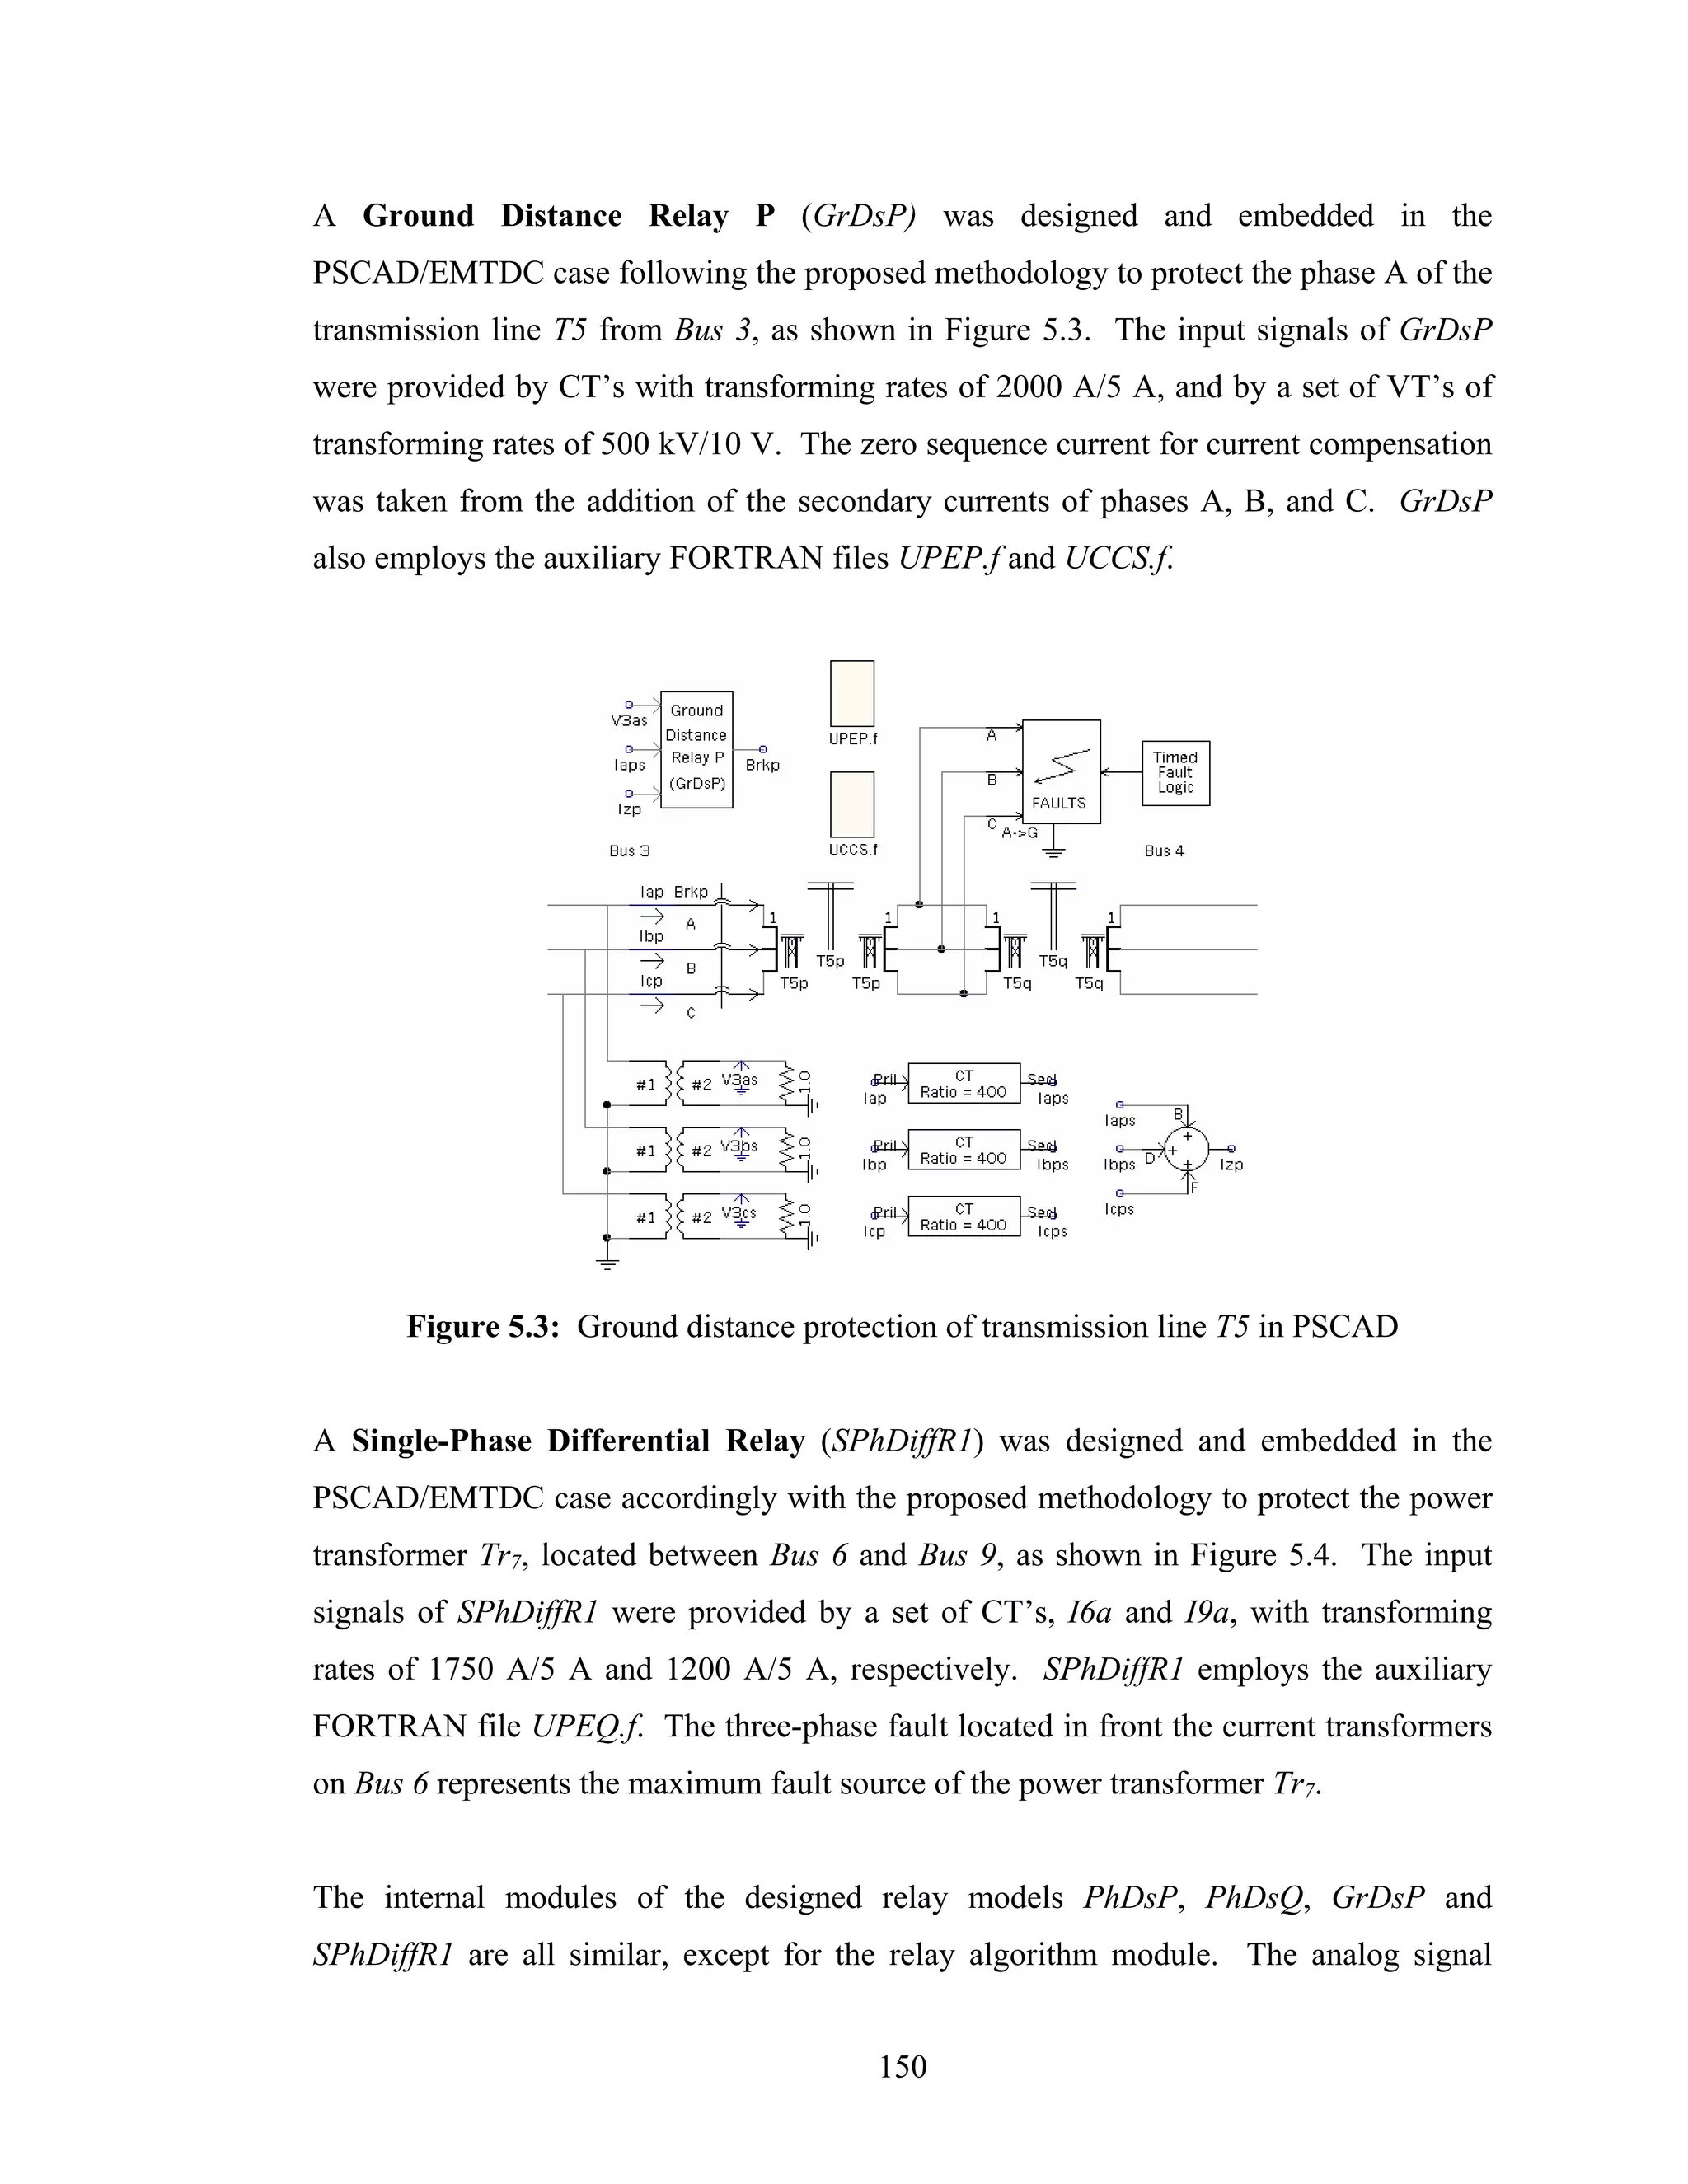
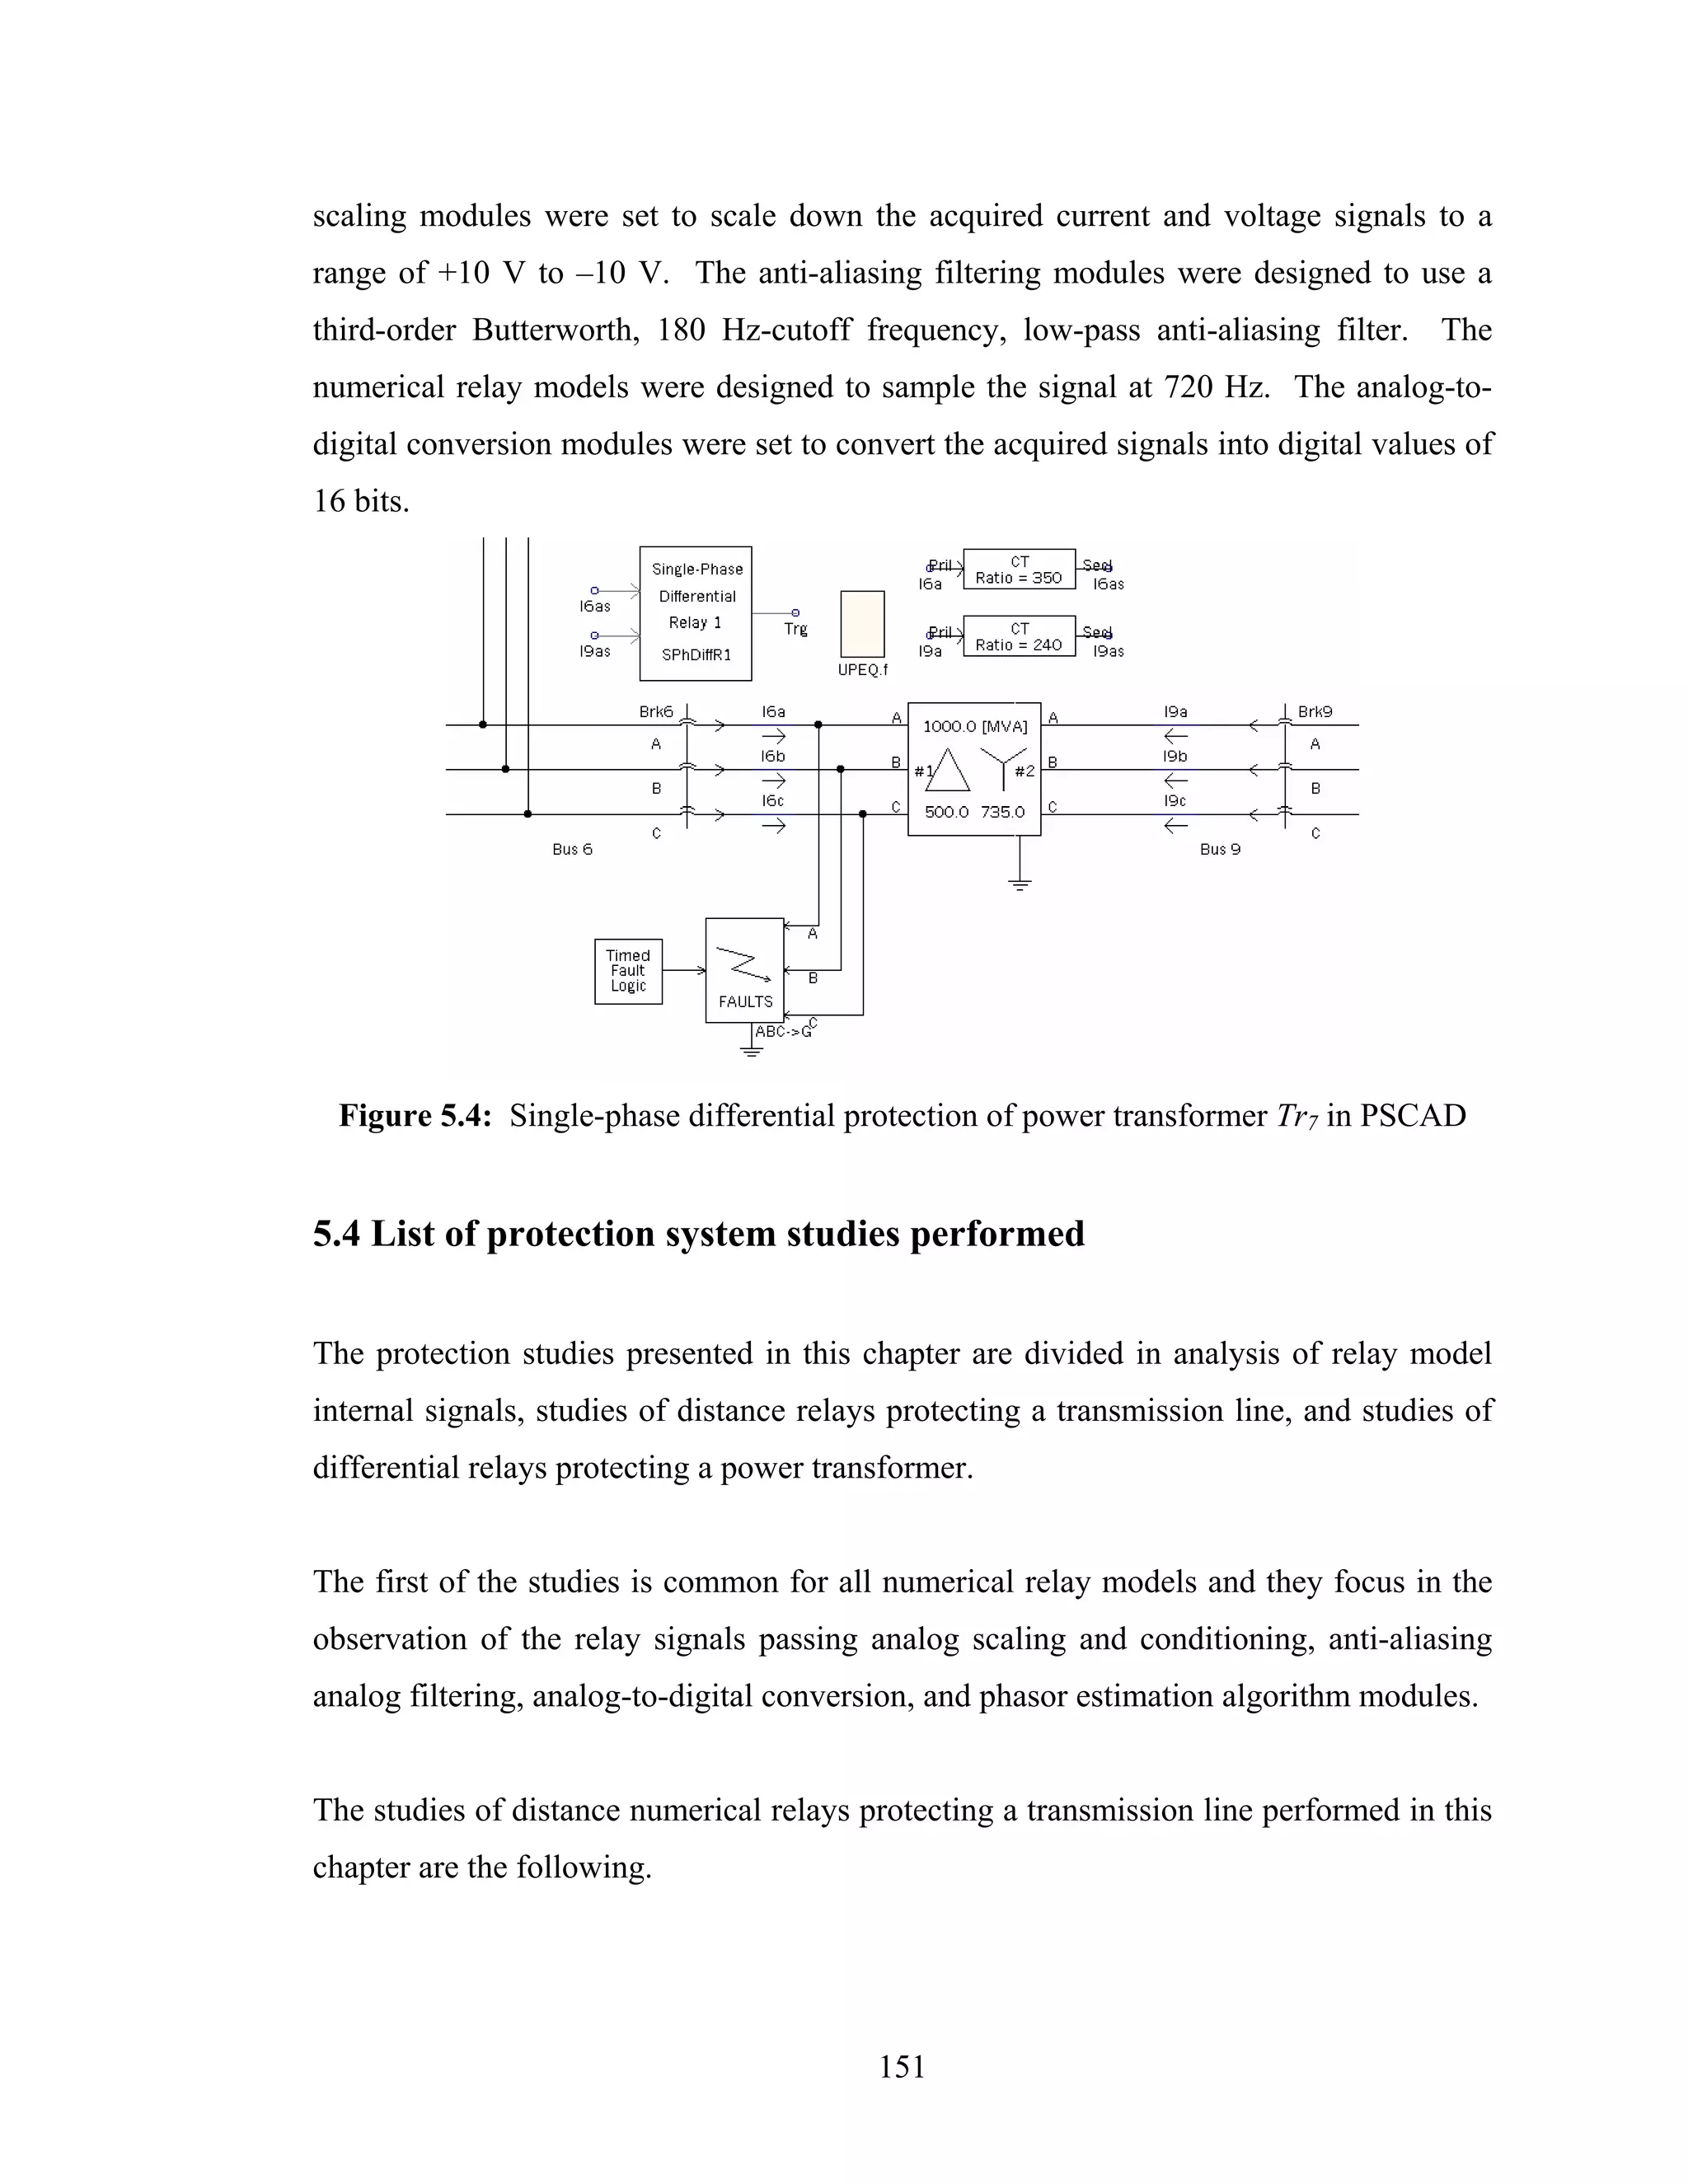
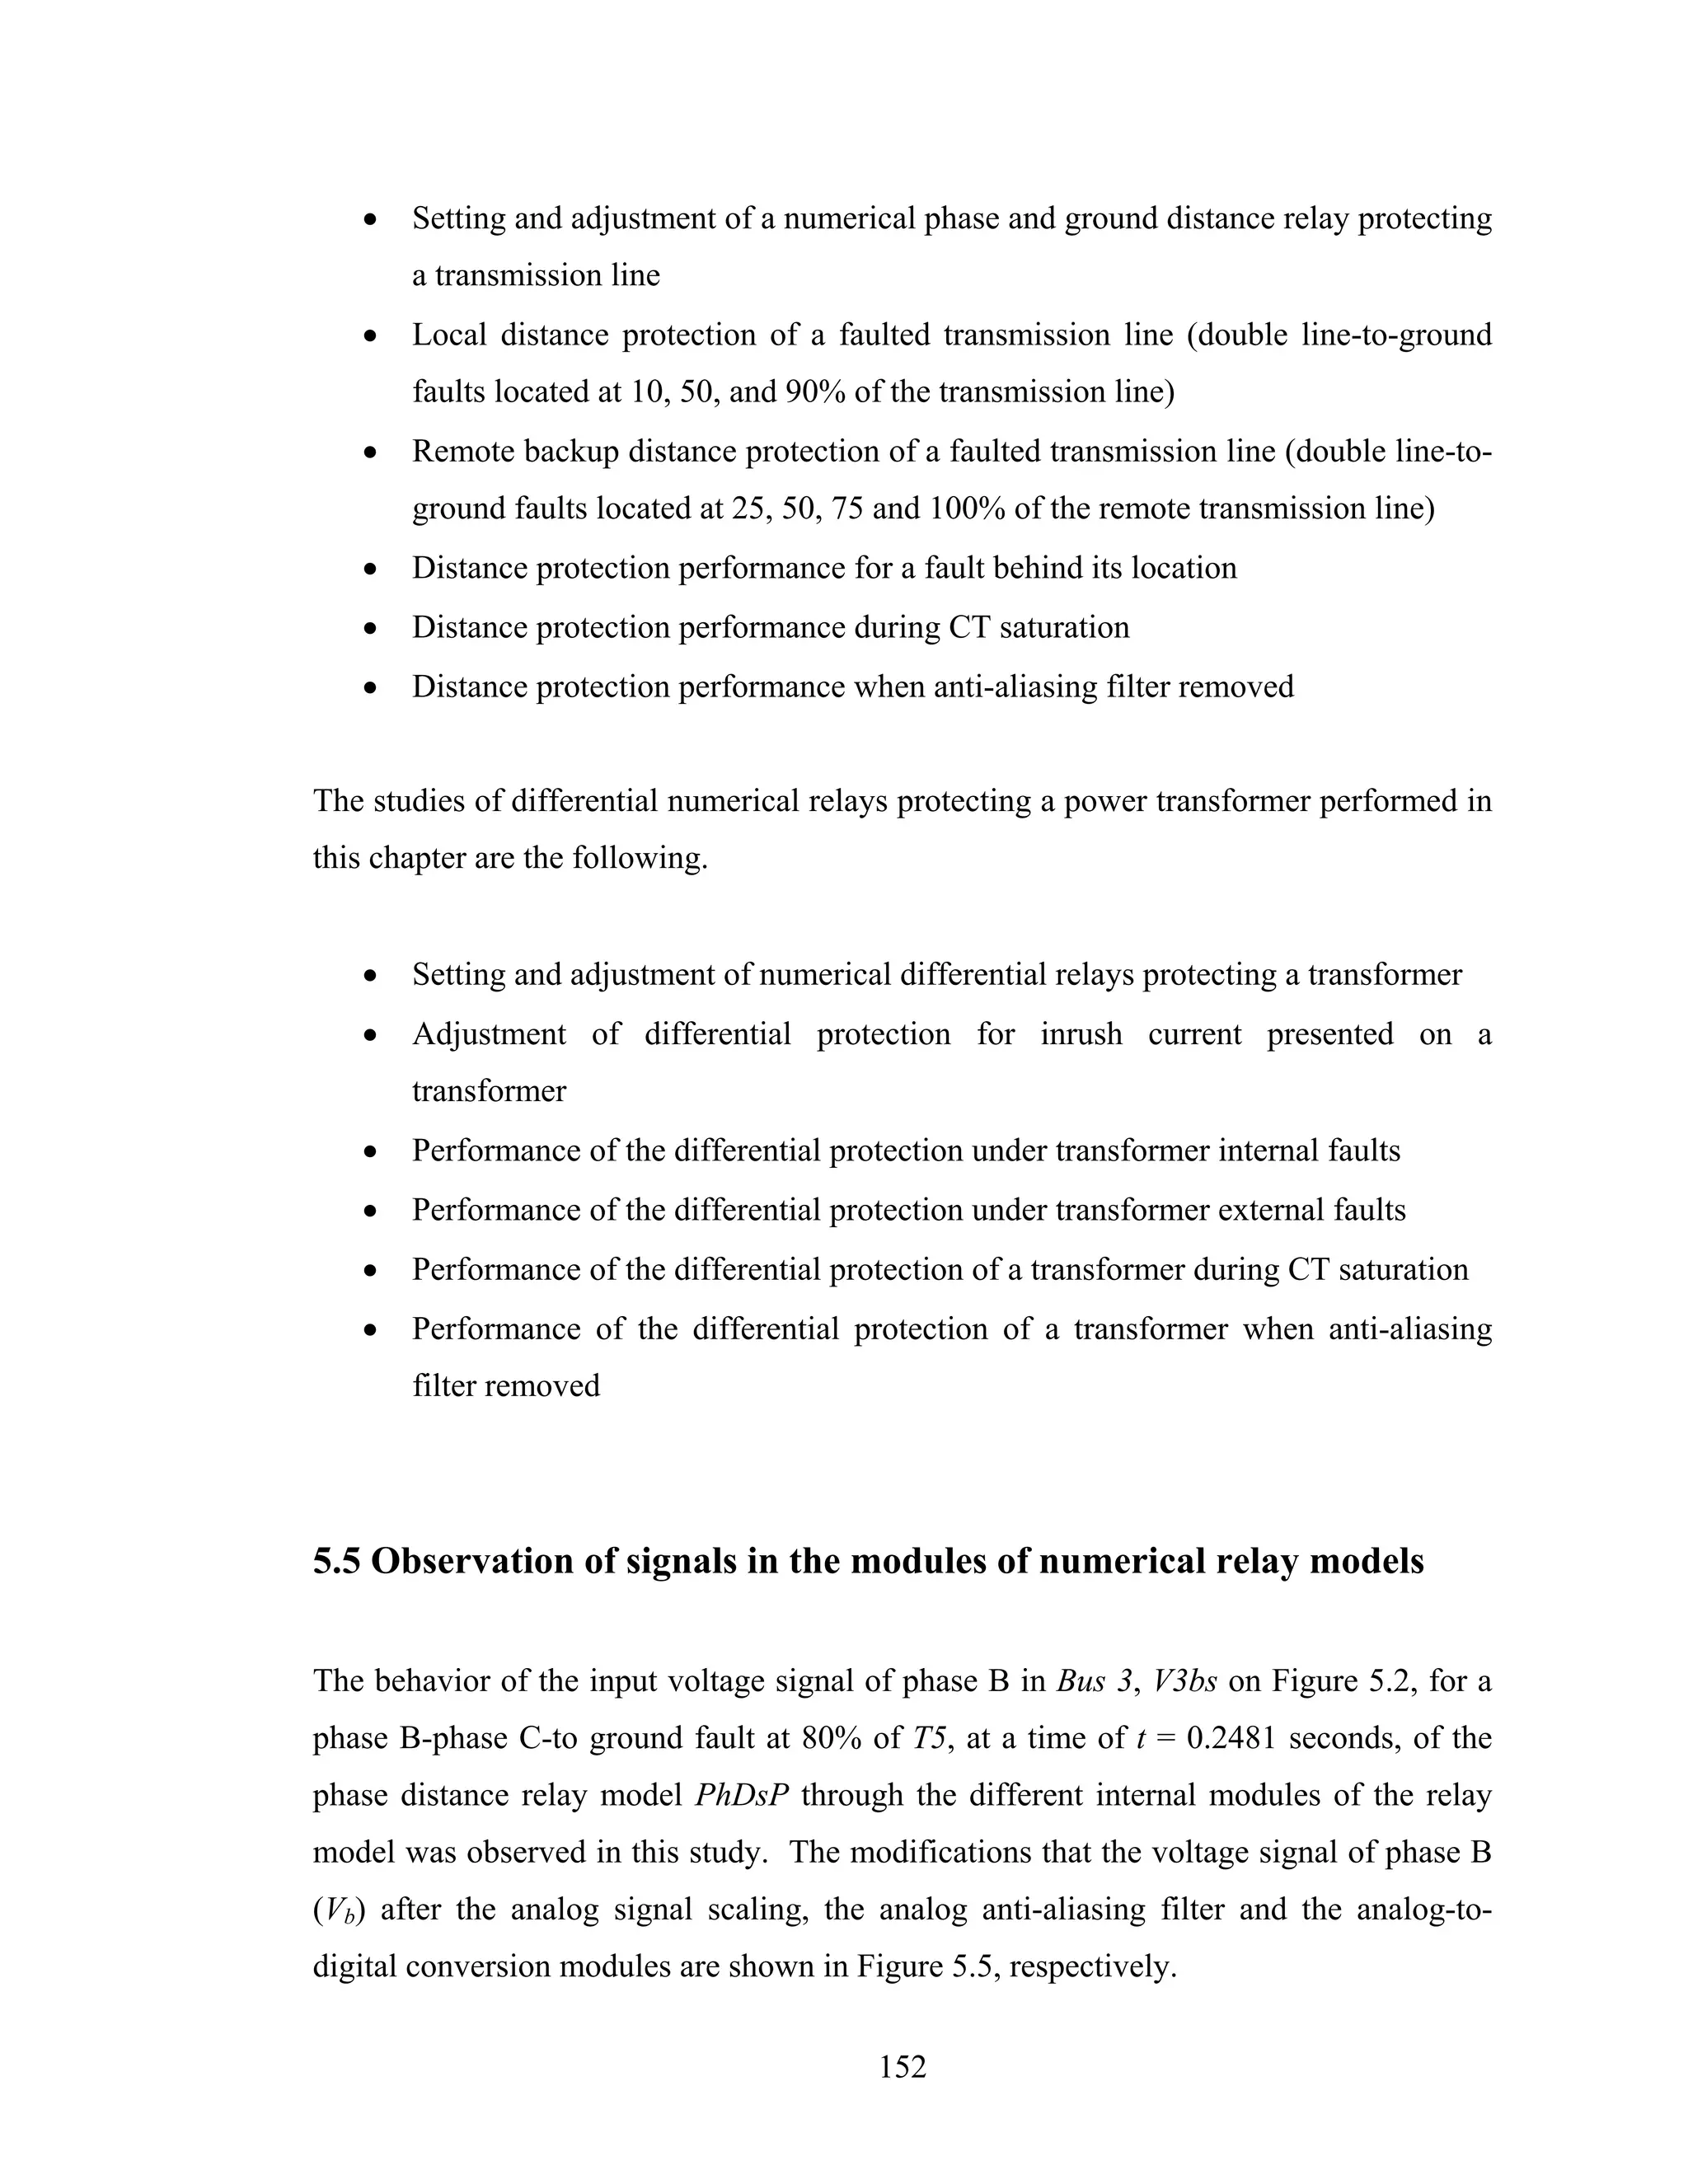
![In Figure 5.5, the waveform of Vb after the analog signal scaling module is the same
shape of the original voltage input but scaled to the range of [+10, -10] volts. The anti-
aliasing filtering module smoothed the waveform by removing the high frequency
components. A delay of 0.00189 seconds in the voltage waveform due to the anti-
aliasing filter was observed. In analog-to-digital conversion module the waveform was
sampled at 12 samples per cycle and quantized. In Figure 5.5, the scale chosen to
observe the quantized waveform was the voltage in Bus 3. The magnitude and phase of
the signal Vb estimated by the phasor estimator algorithm module is shown in Figure 5.6.
The observation of the internal signal renders useful information for protection purposes,
such as the adjusting parameters or selecting different alternative for the design of the
relay modules. The behavior and response of the relay modules signals under specific
events can be analyzed in detail, which can help taking proper corrective measures.
5.6 Distance relay studies
Under this section are presented the studies of the distance protection designed with the
proposed protection system model designing methodology and listed in section 5.4.
5.6.1 Setting and adjustment of distance relays protecting a
transmission line
The purpose of these studies was to adjust the three zone characteristics curves of phase
and ground distance relays. The studies were divided in the adjustment of phase
distance relays, and the adjustment of ground distance relays.
153](https://image.slidesharecdn.com/phdthesissandroaquiles060724-121017023005-phpapp01/75/Thesis-for-Power-System-protection-in-Brief-188-2048.jpg)
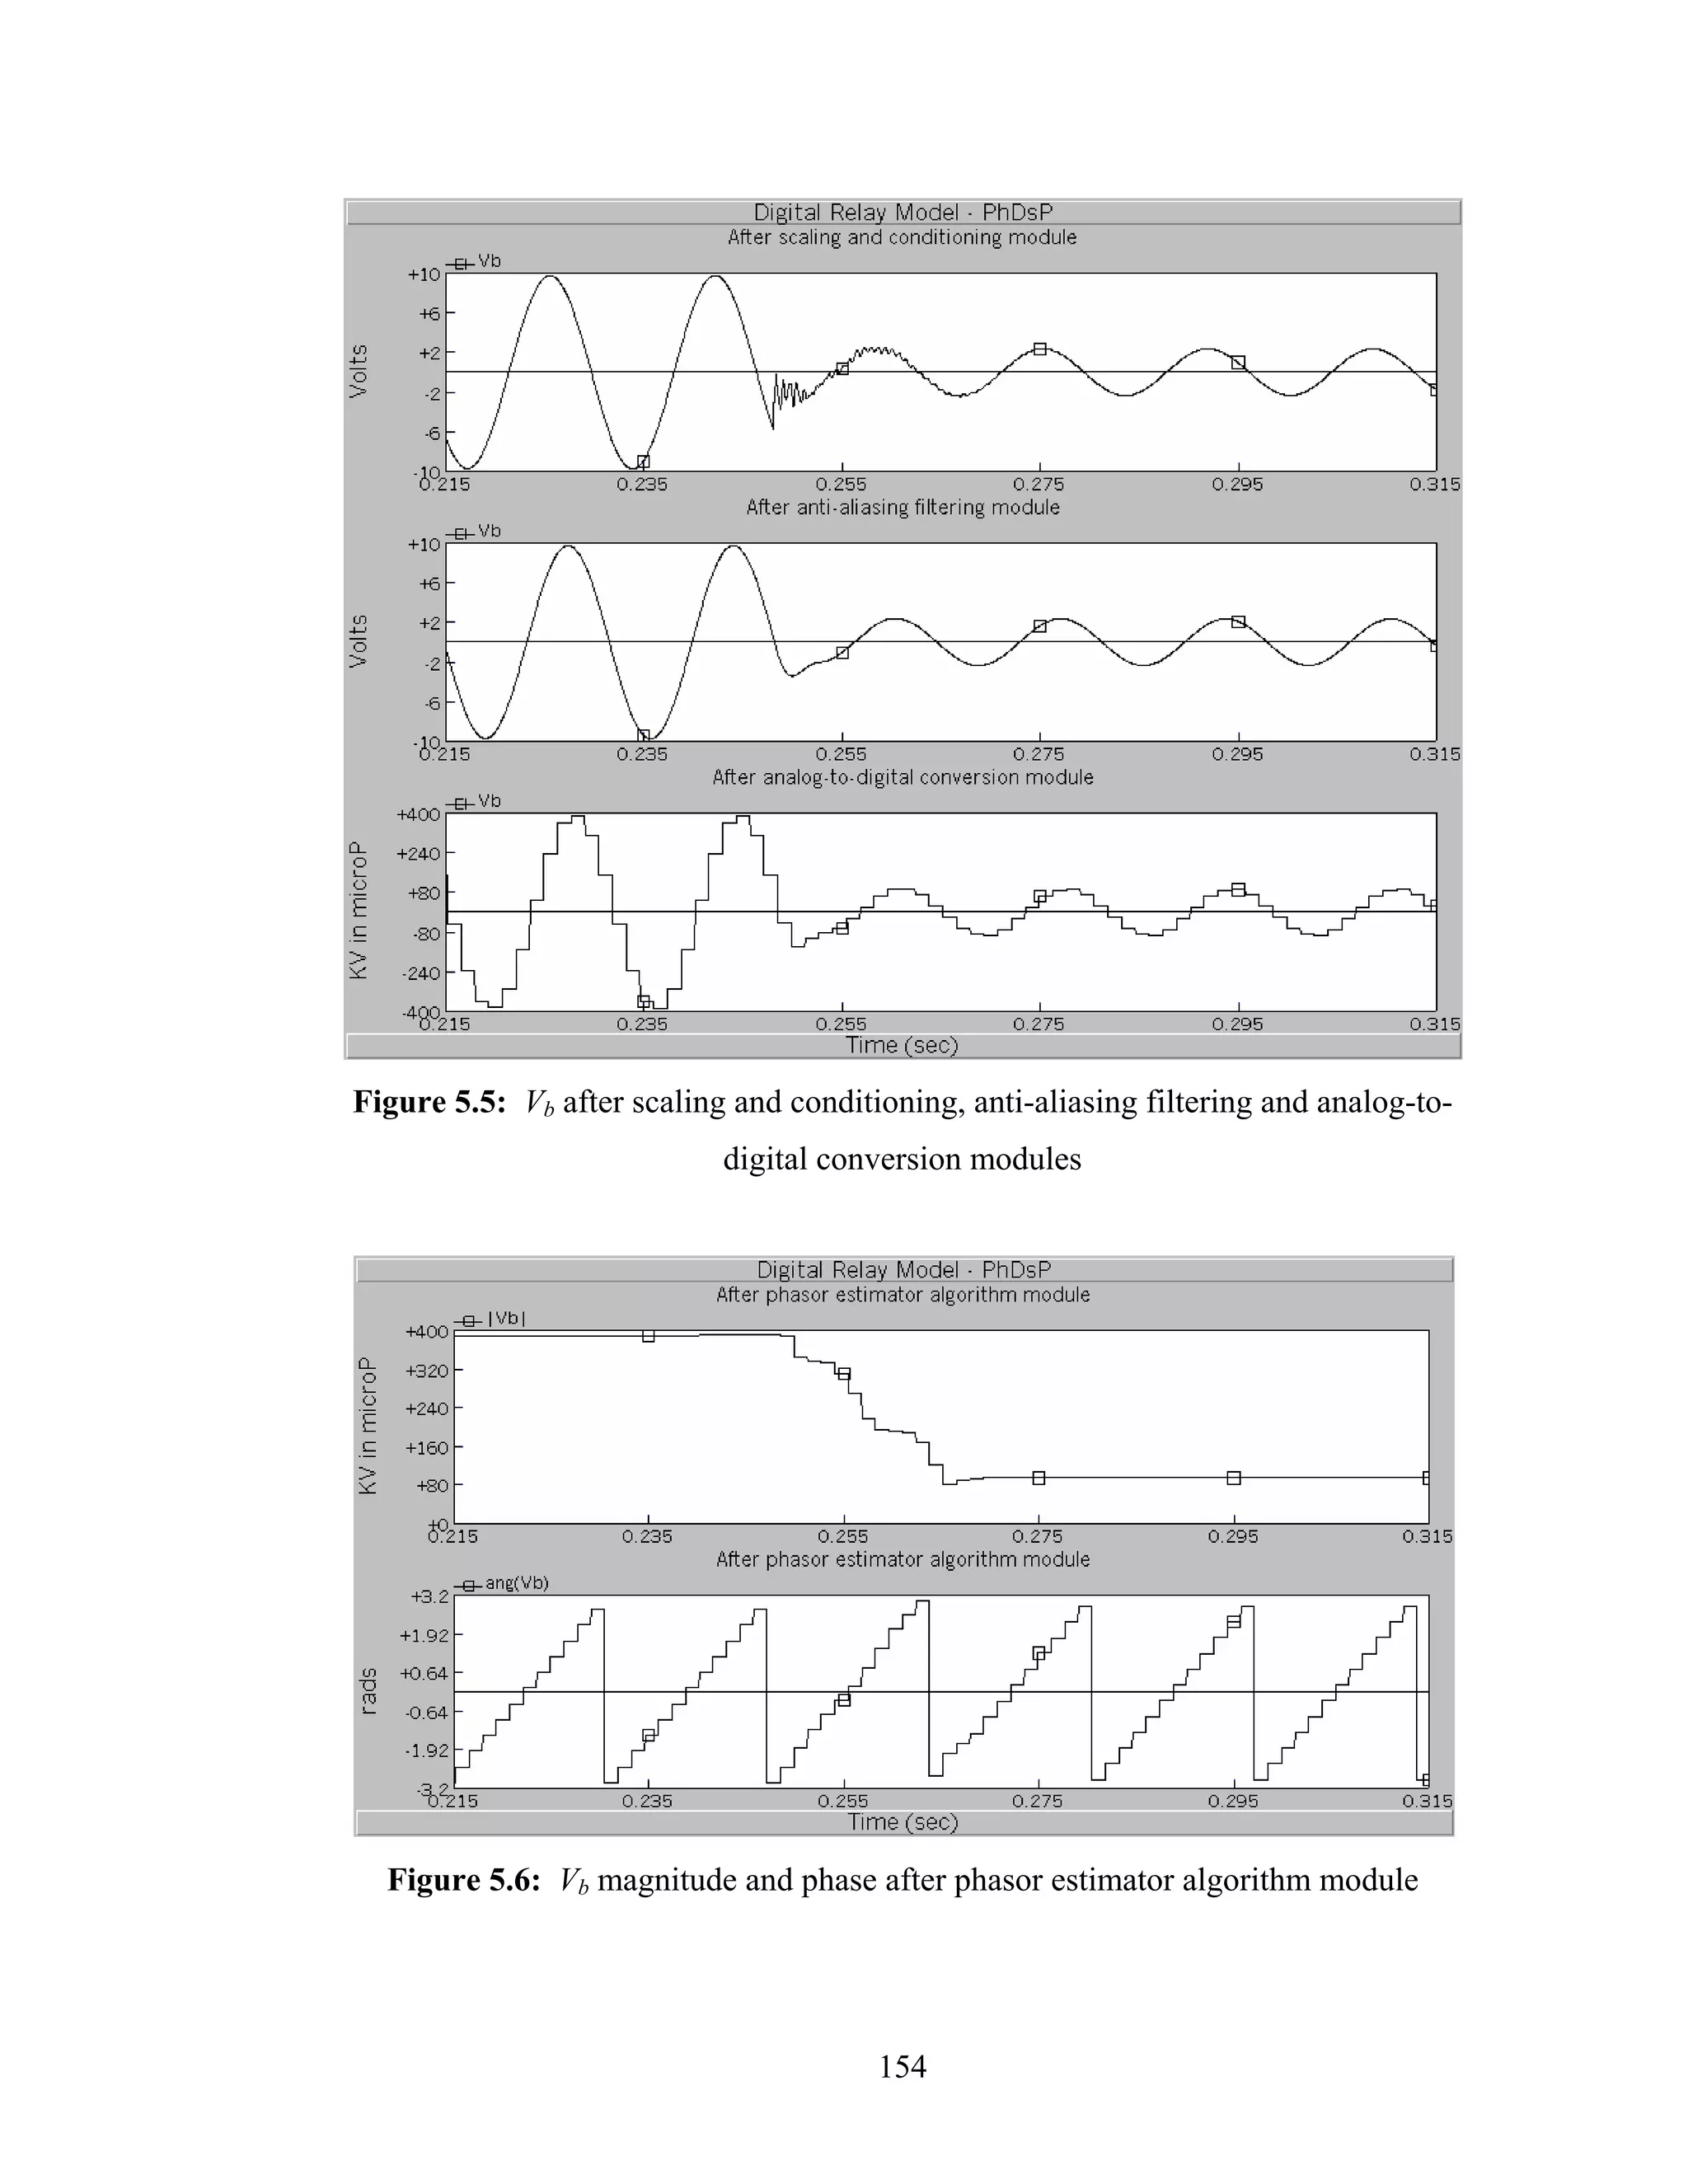
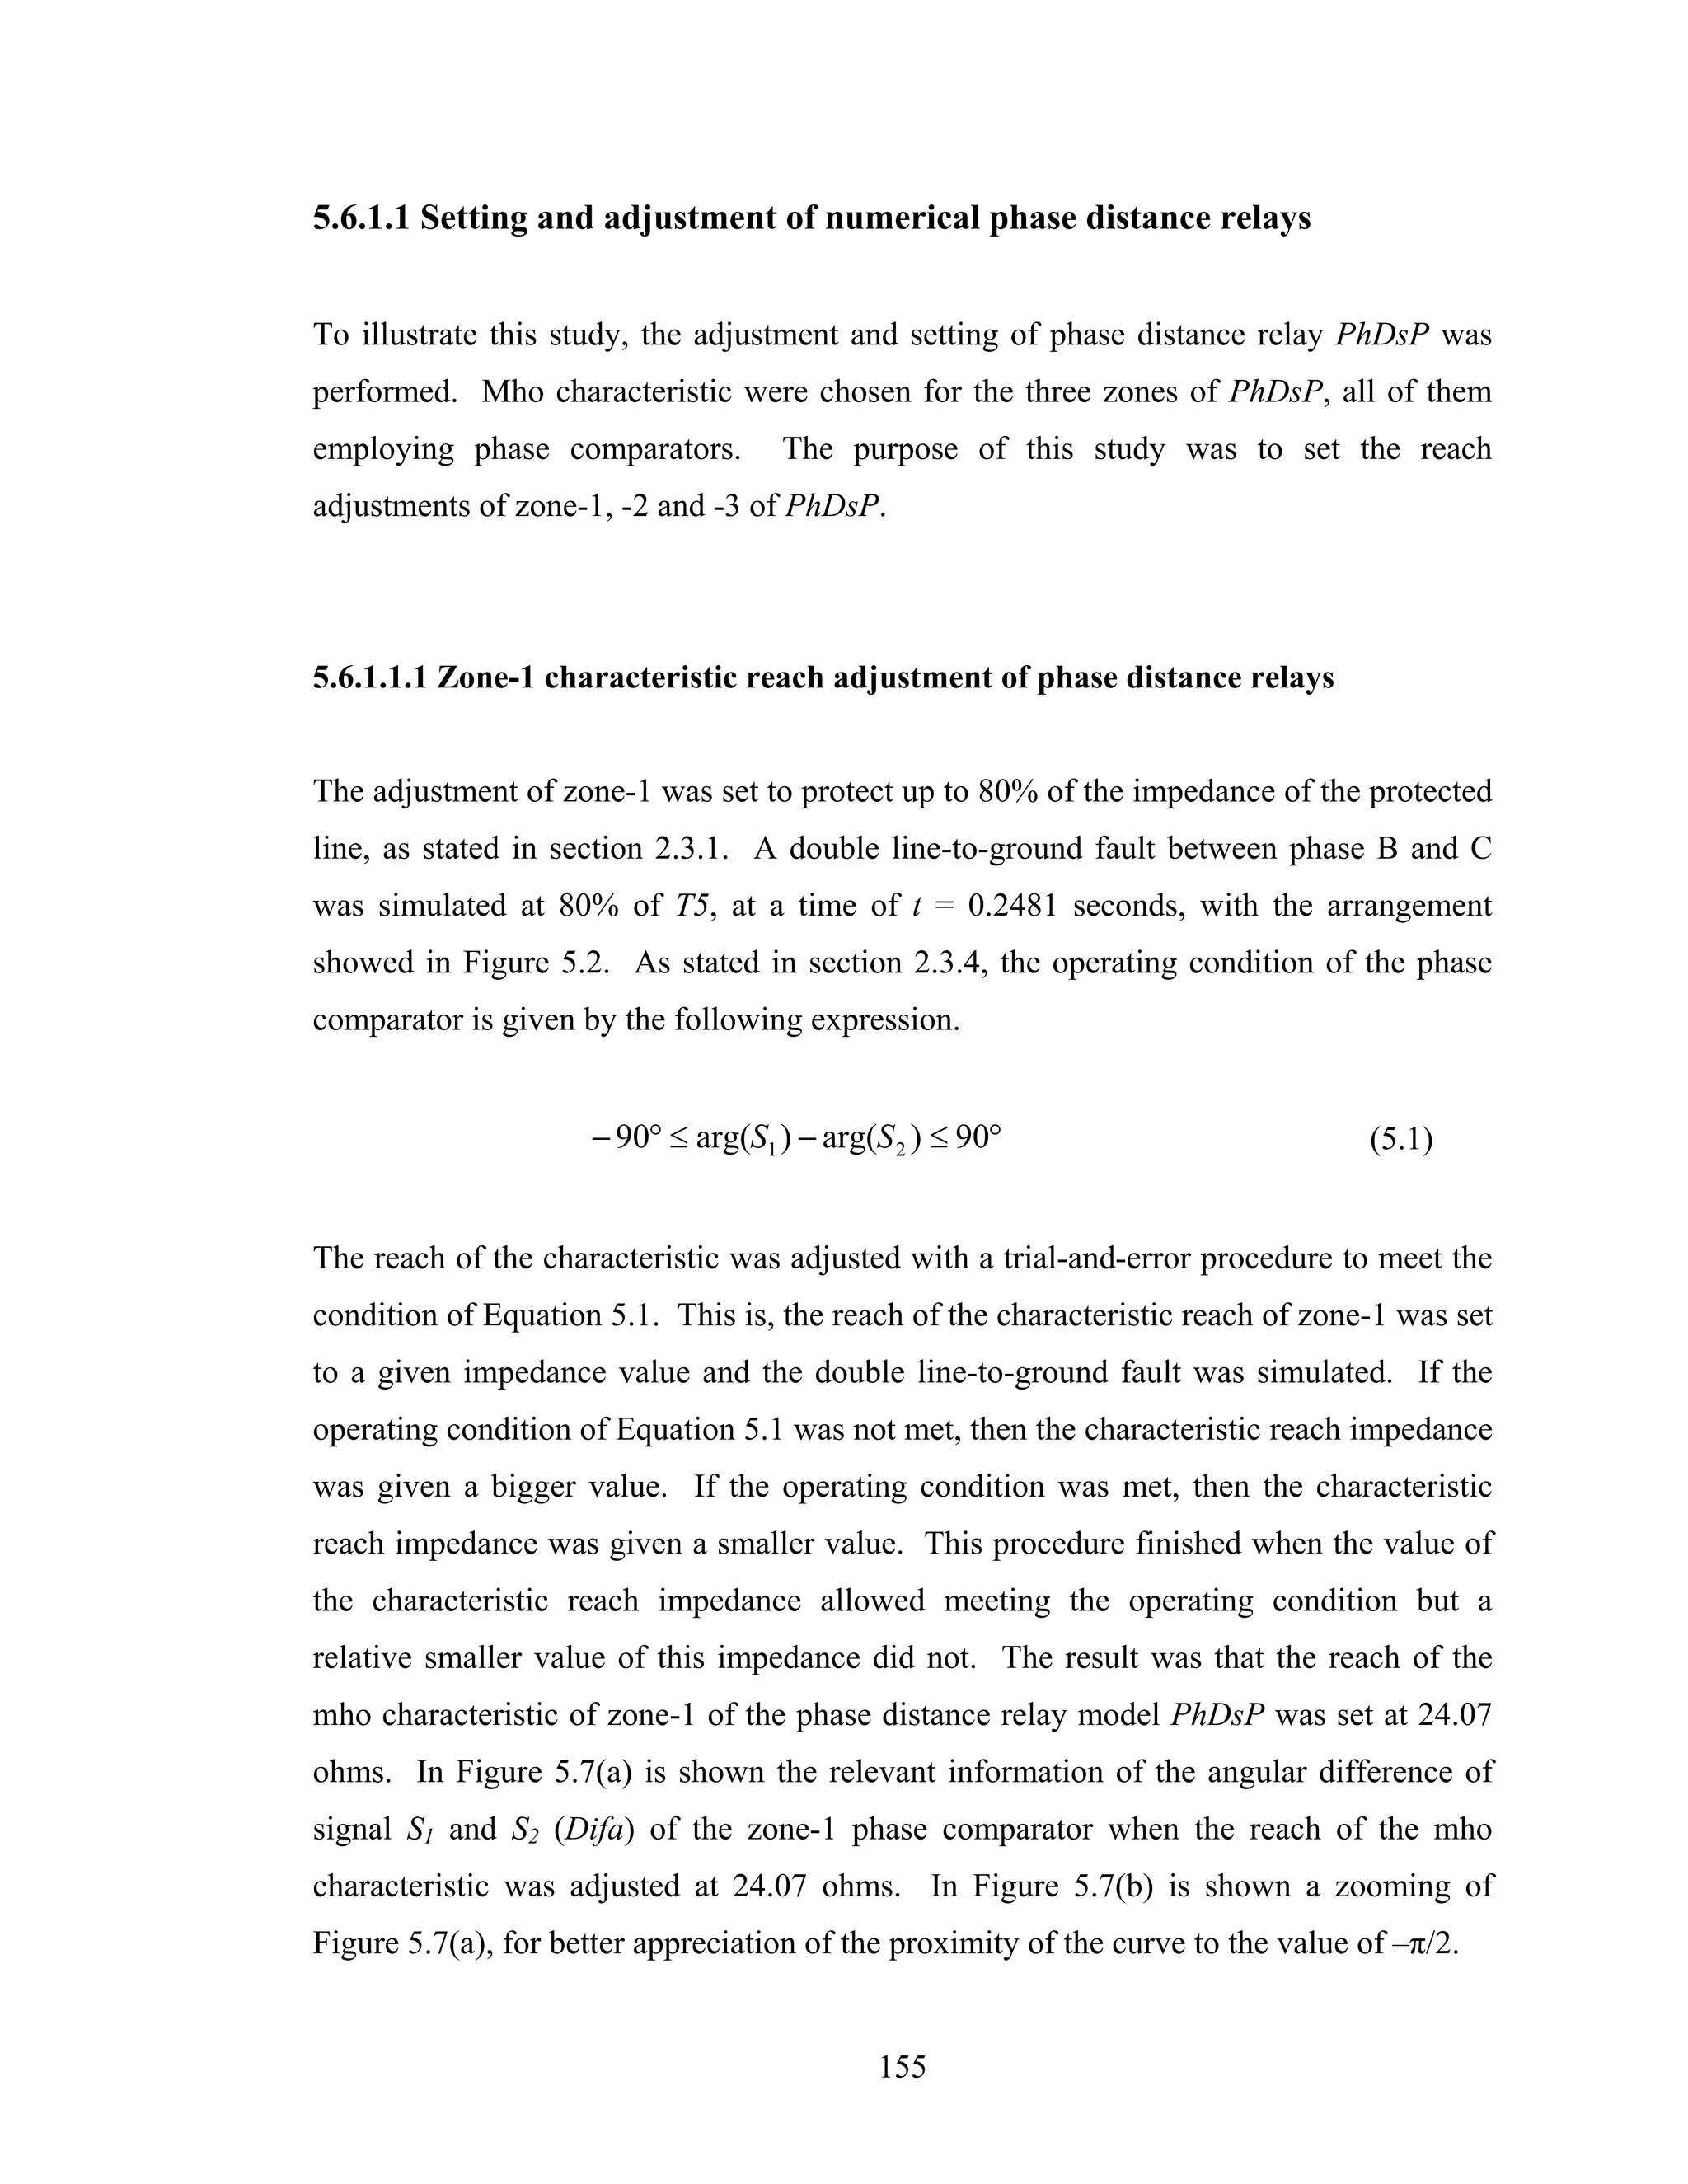
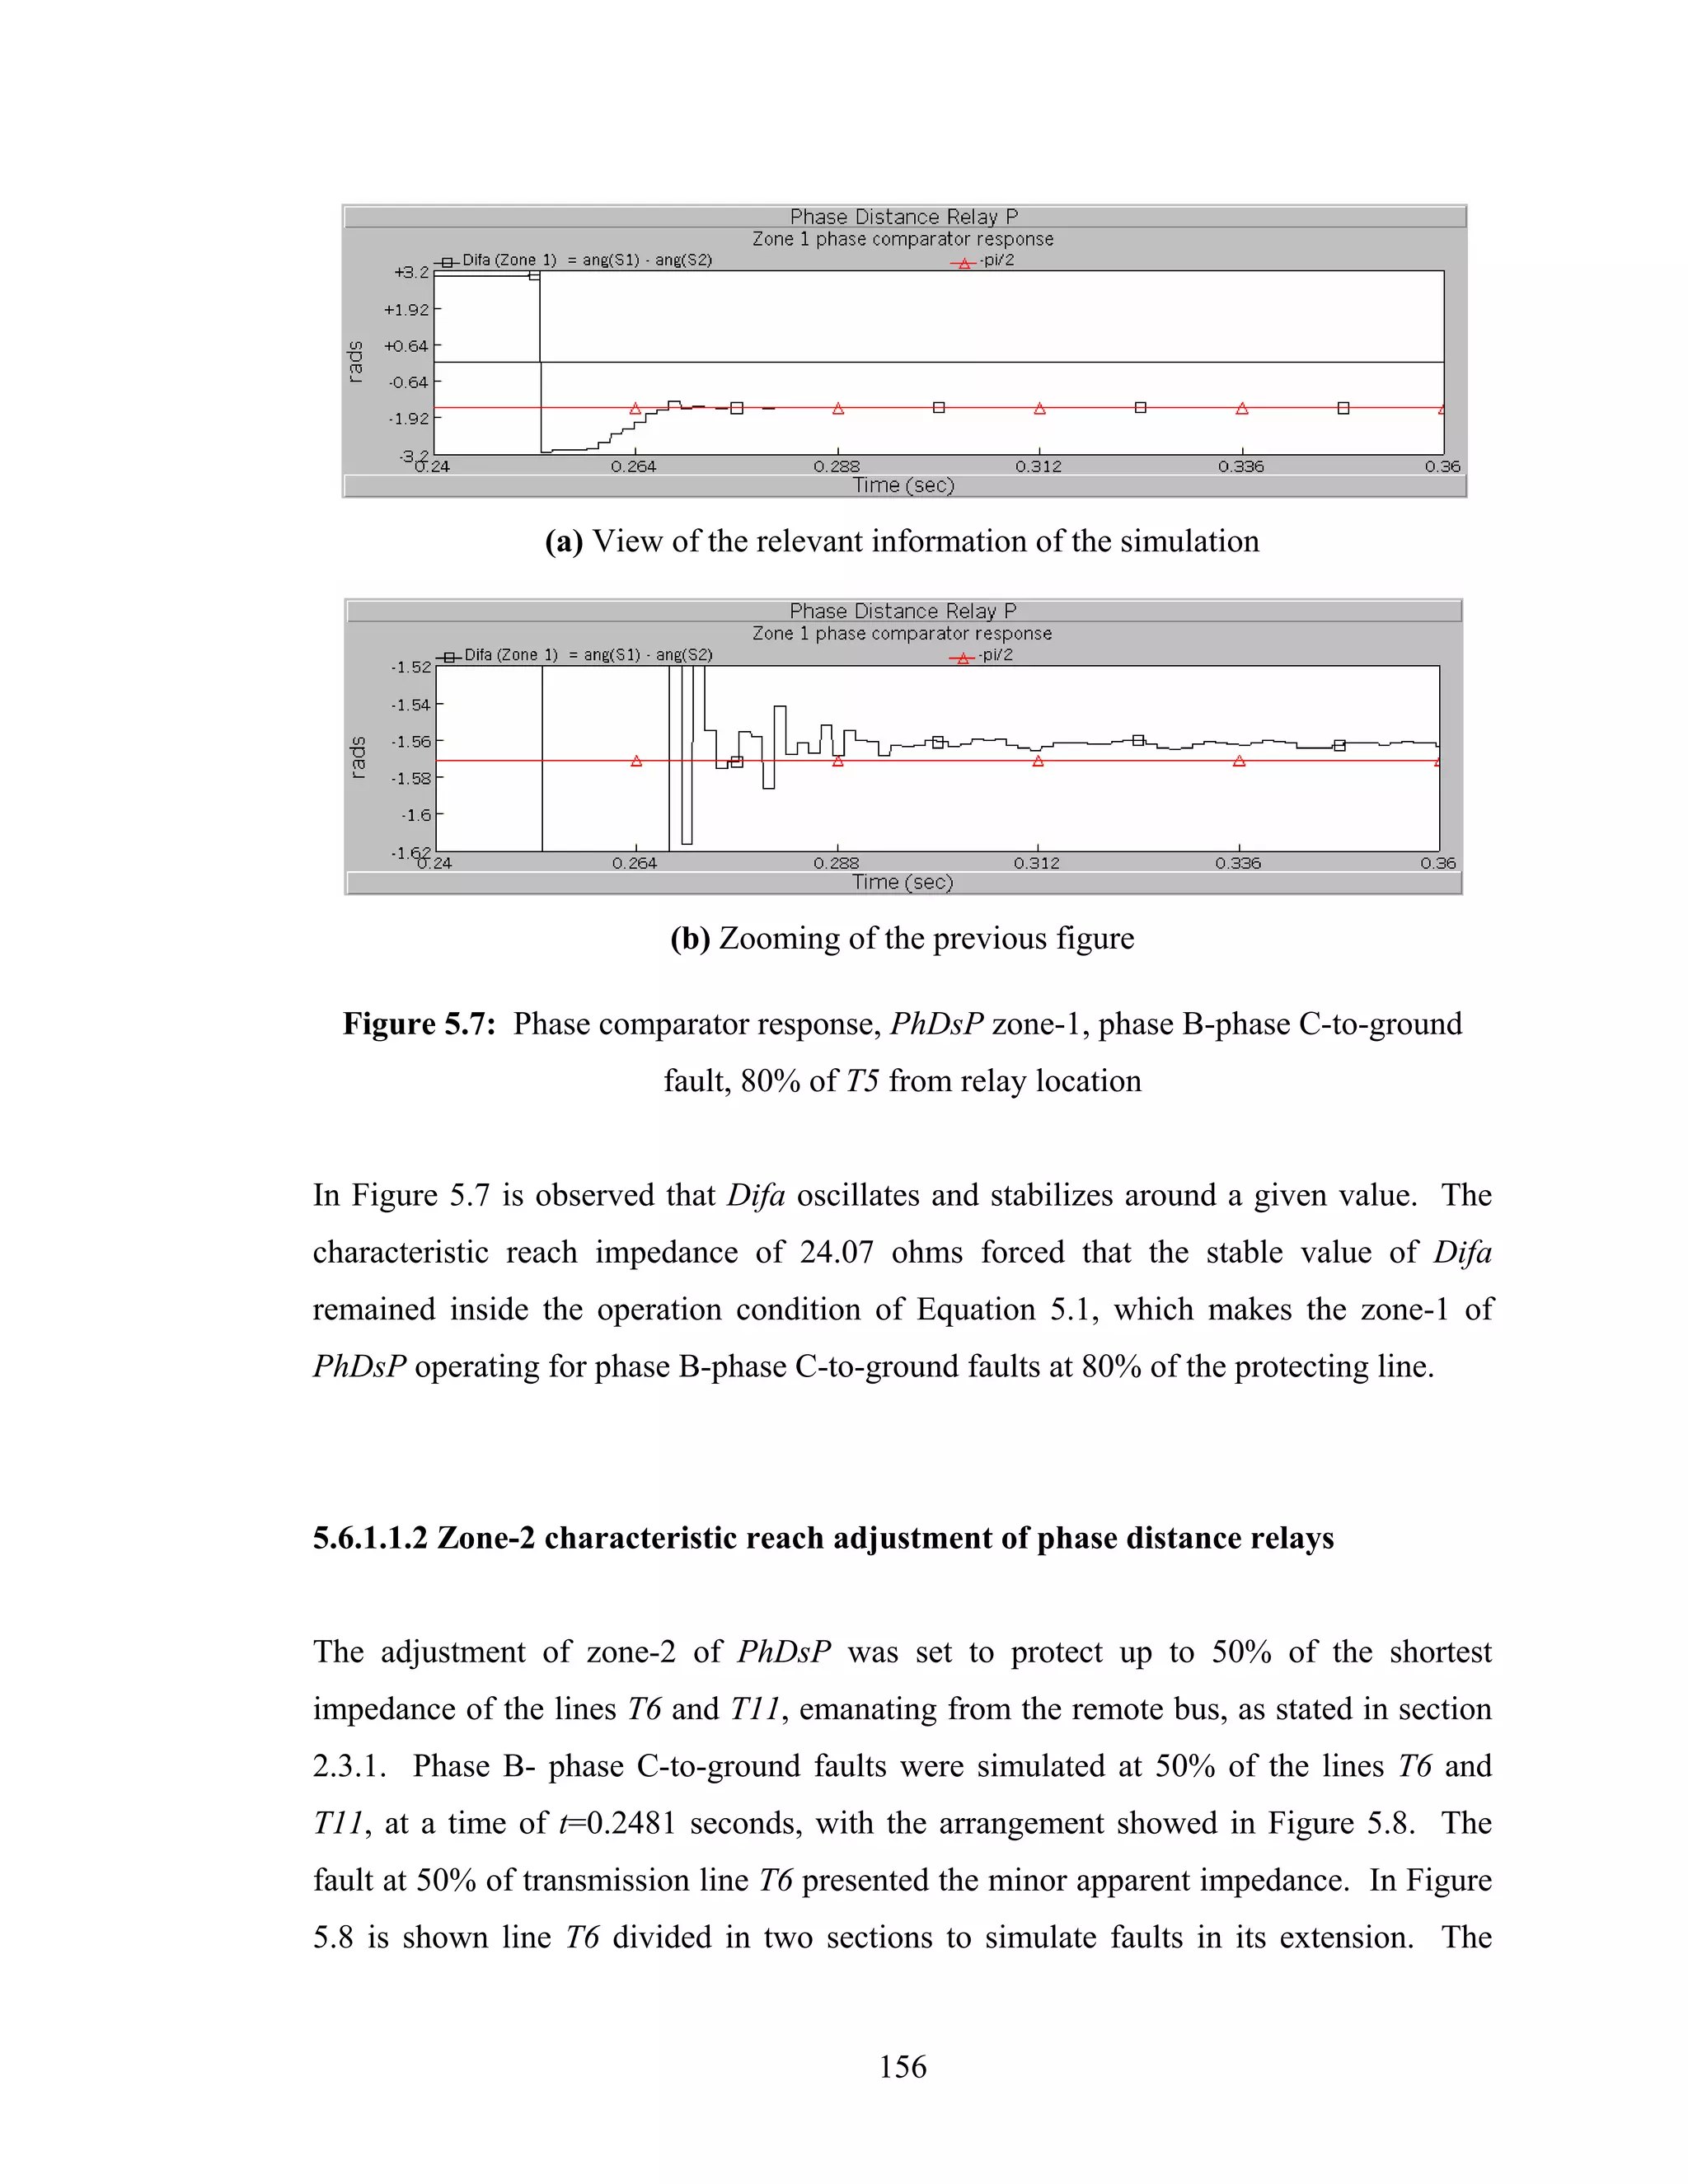
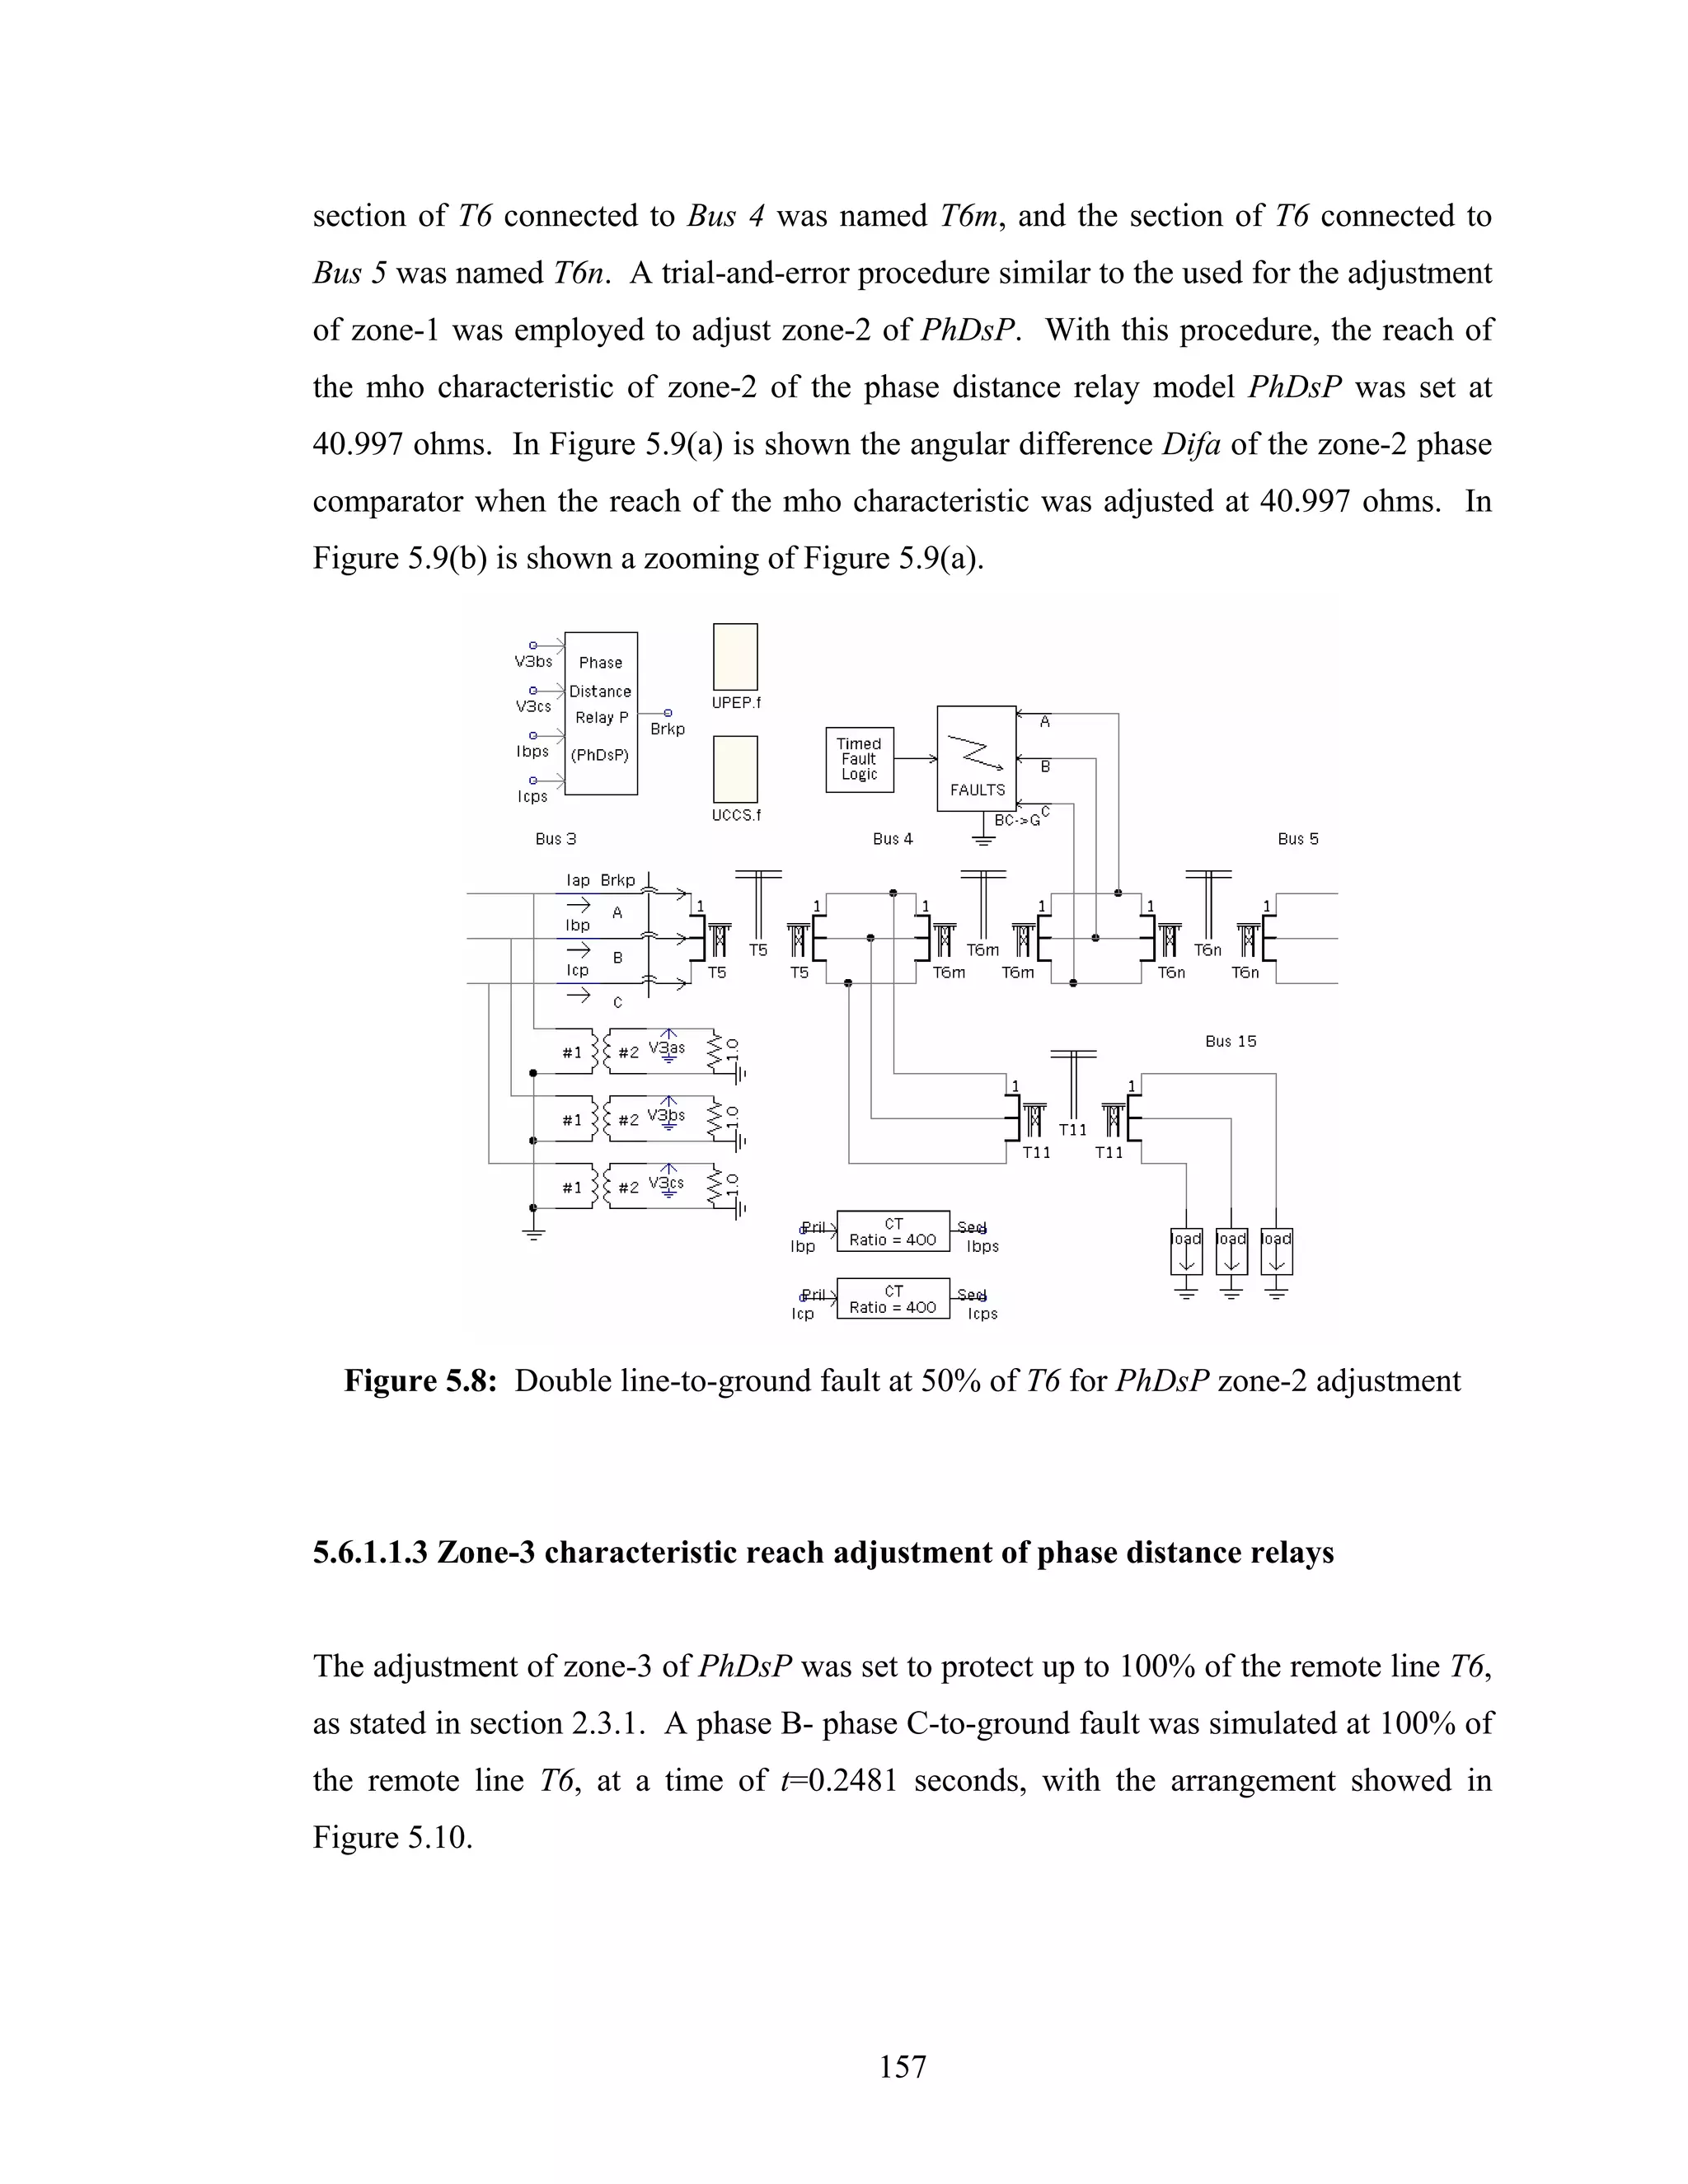
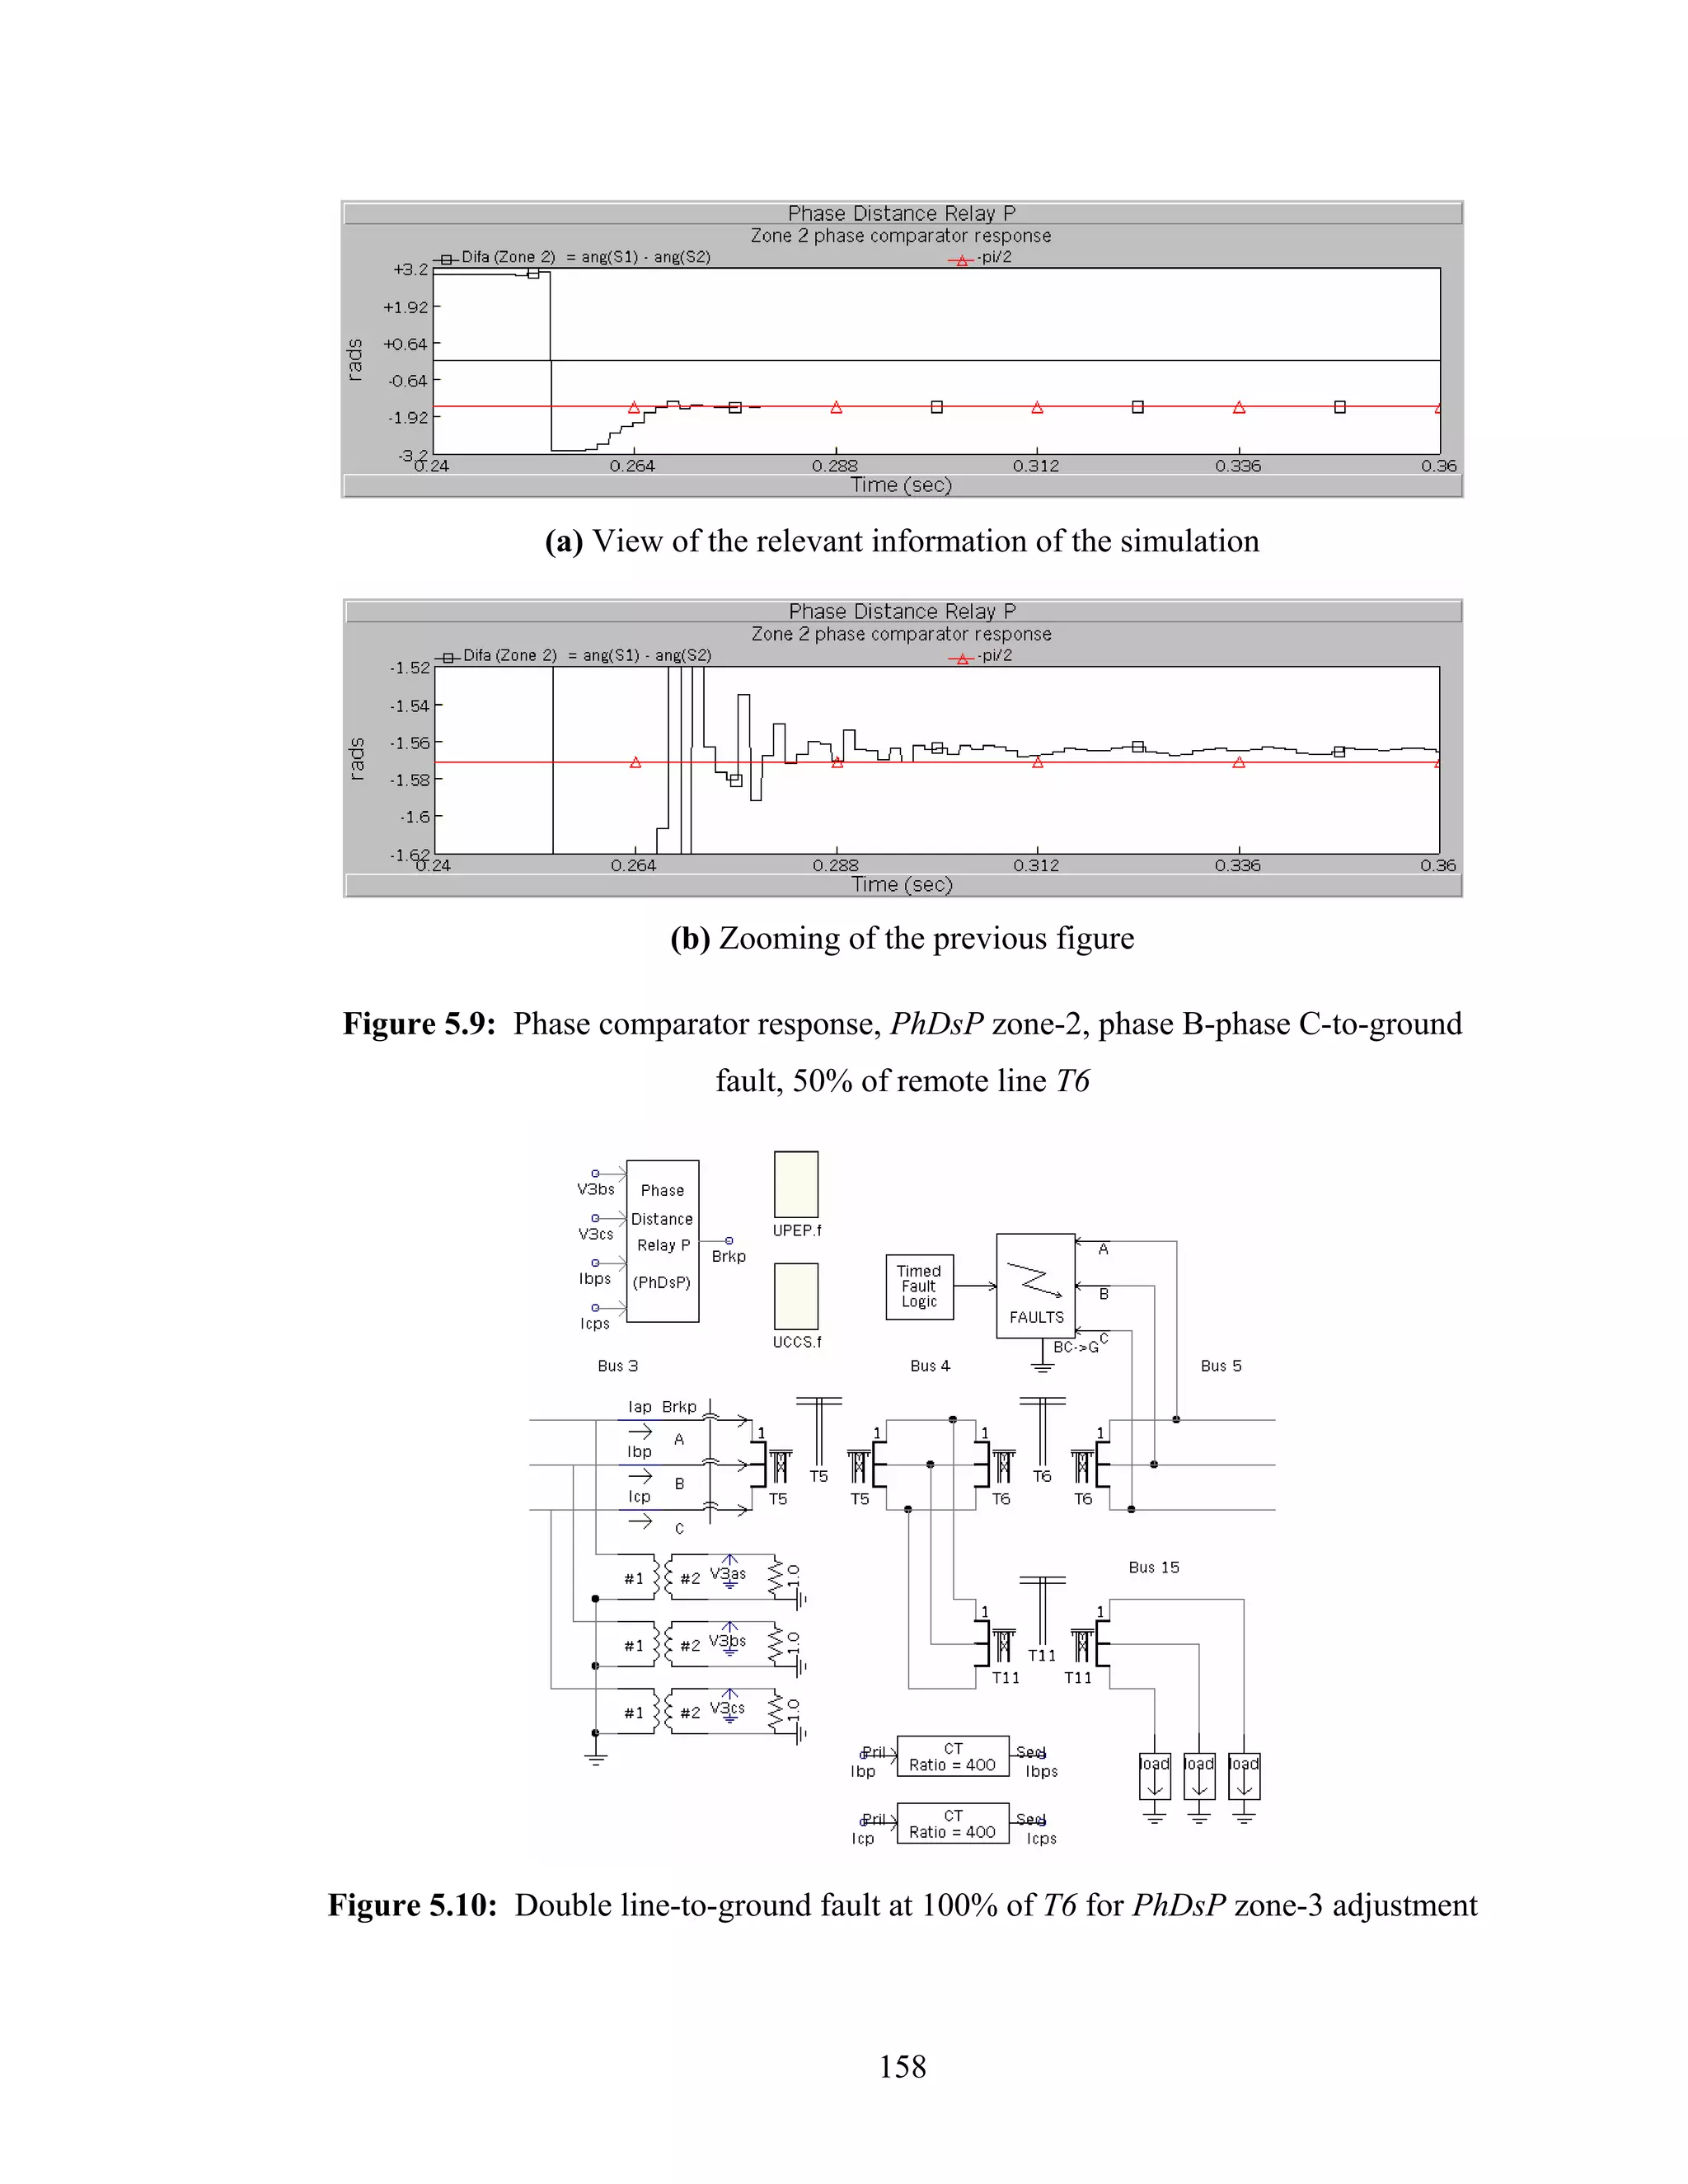
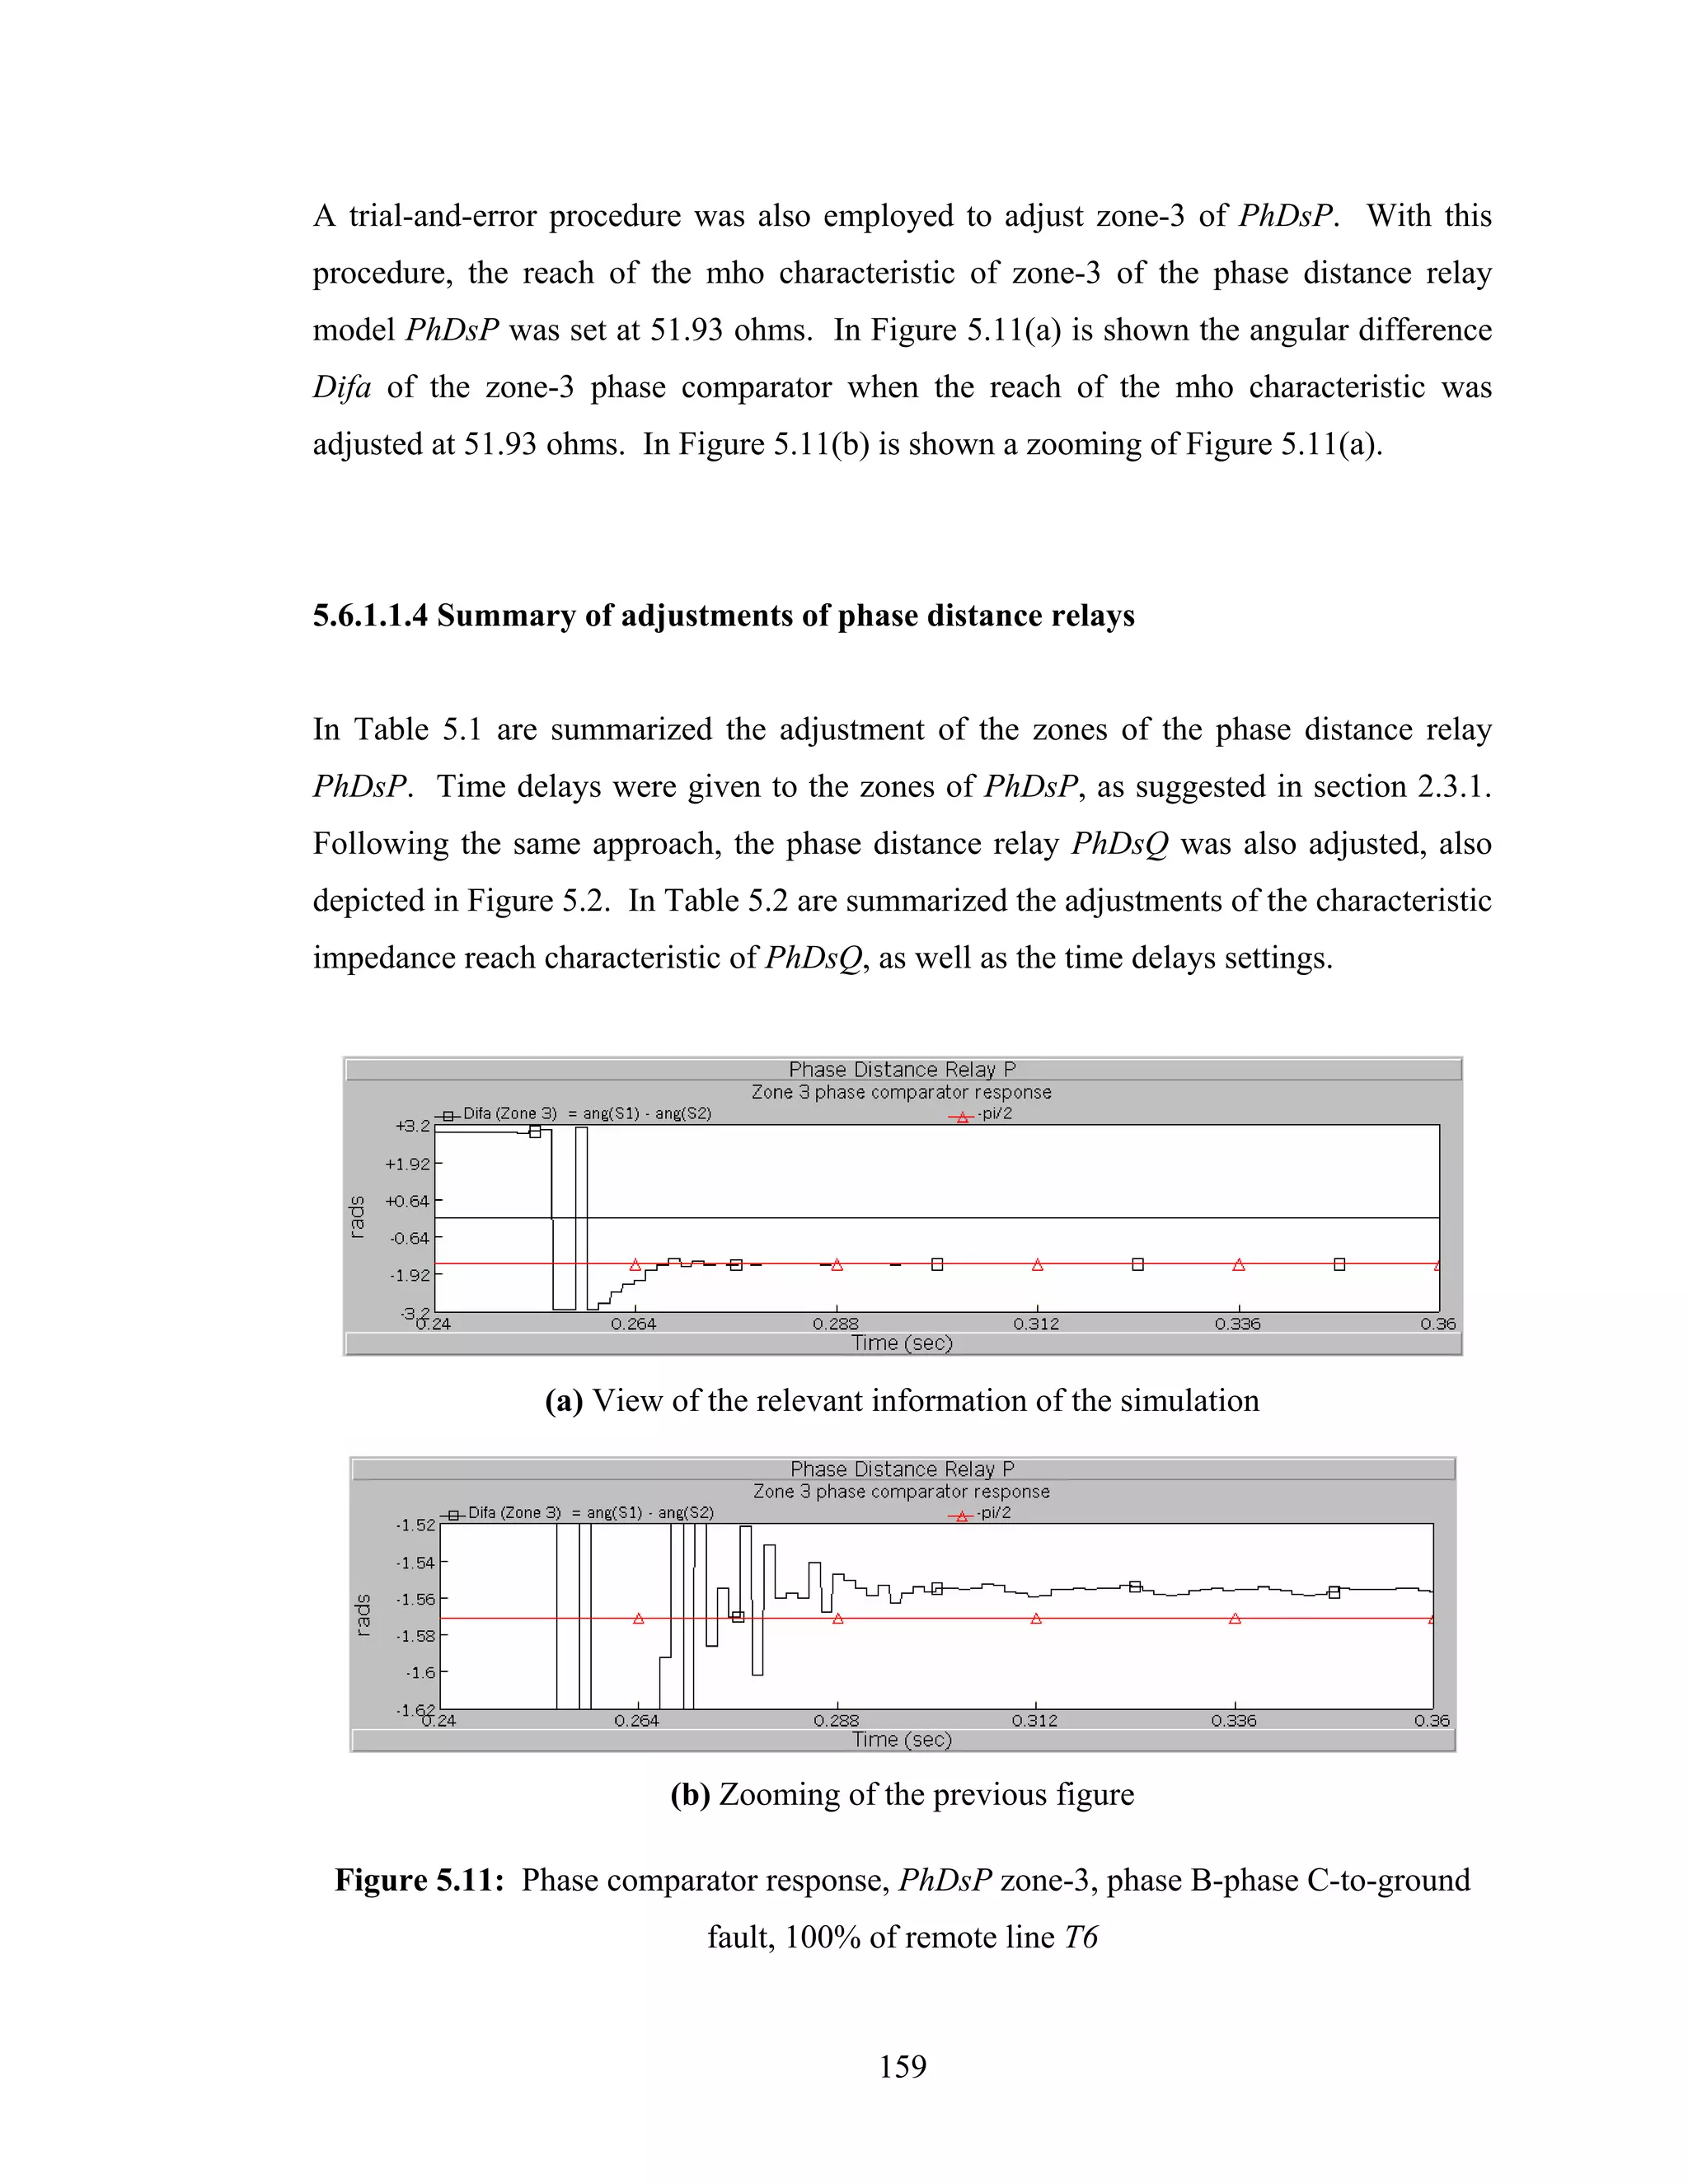
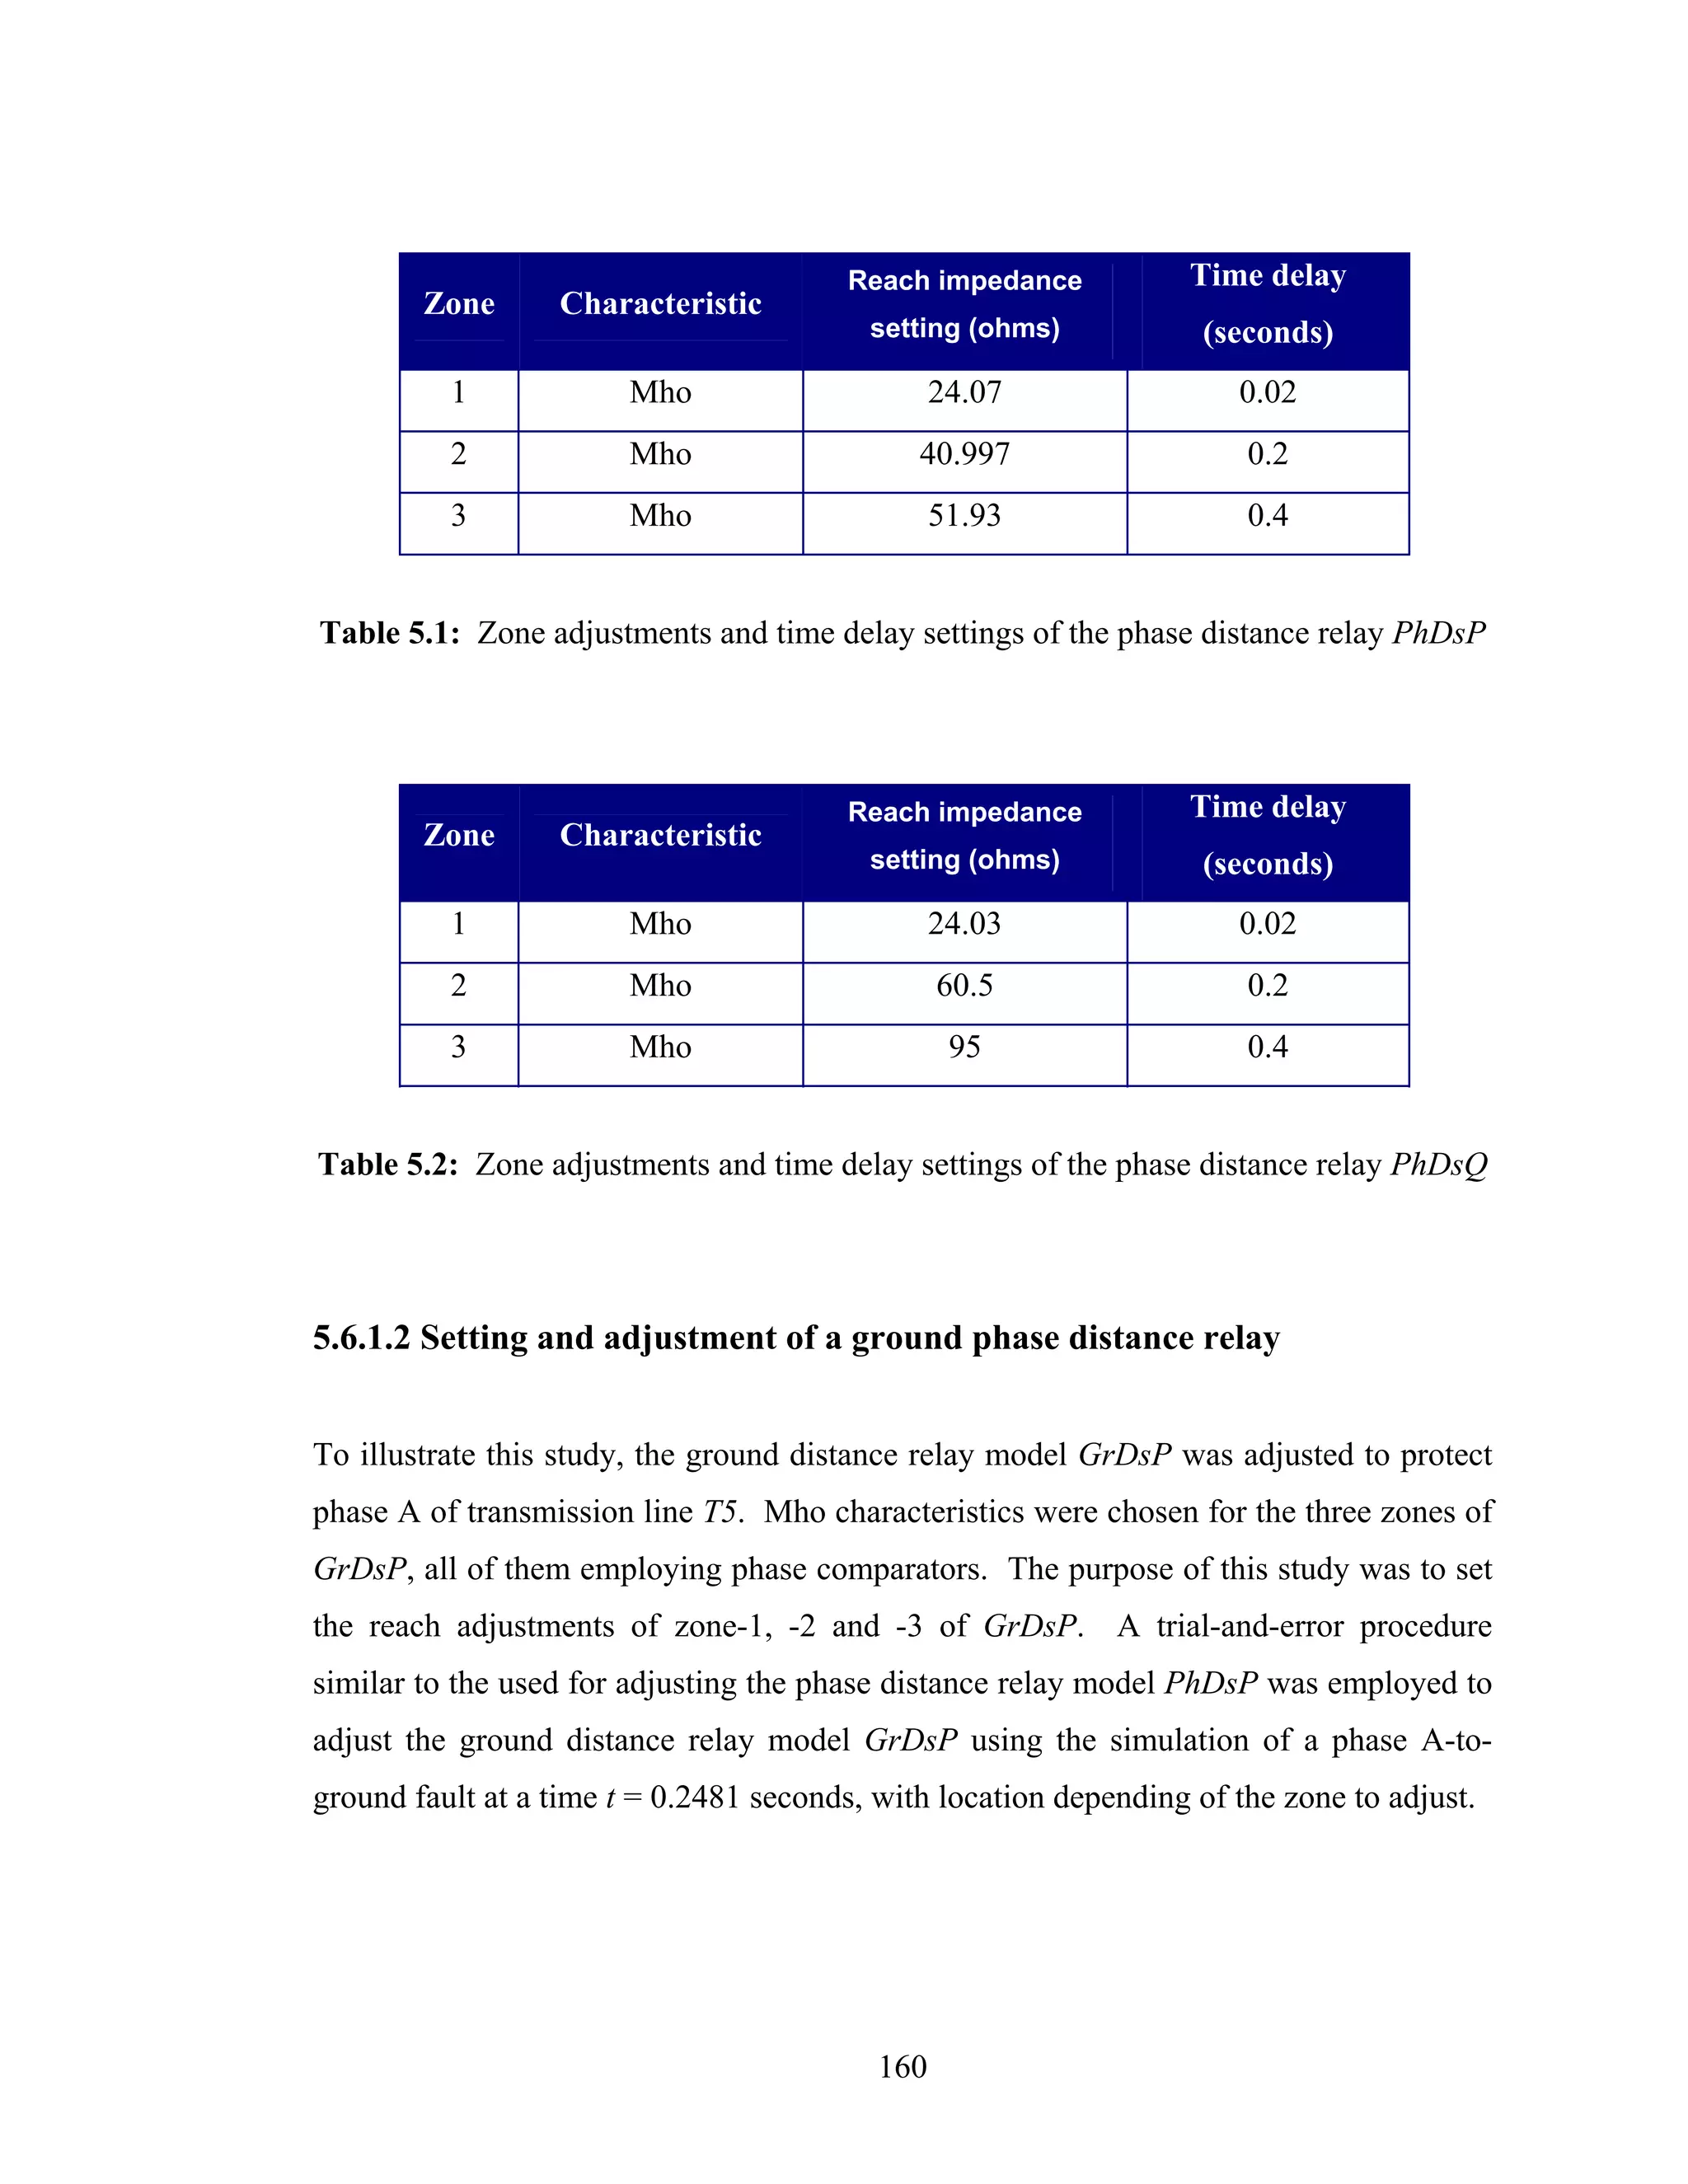
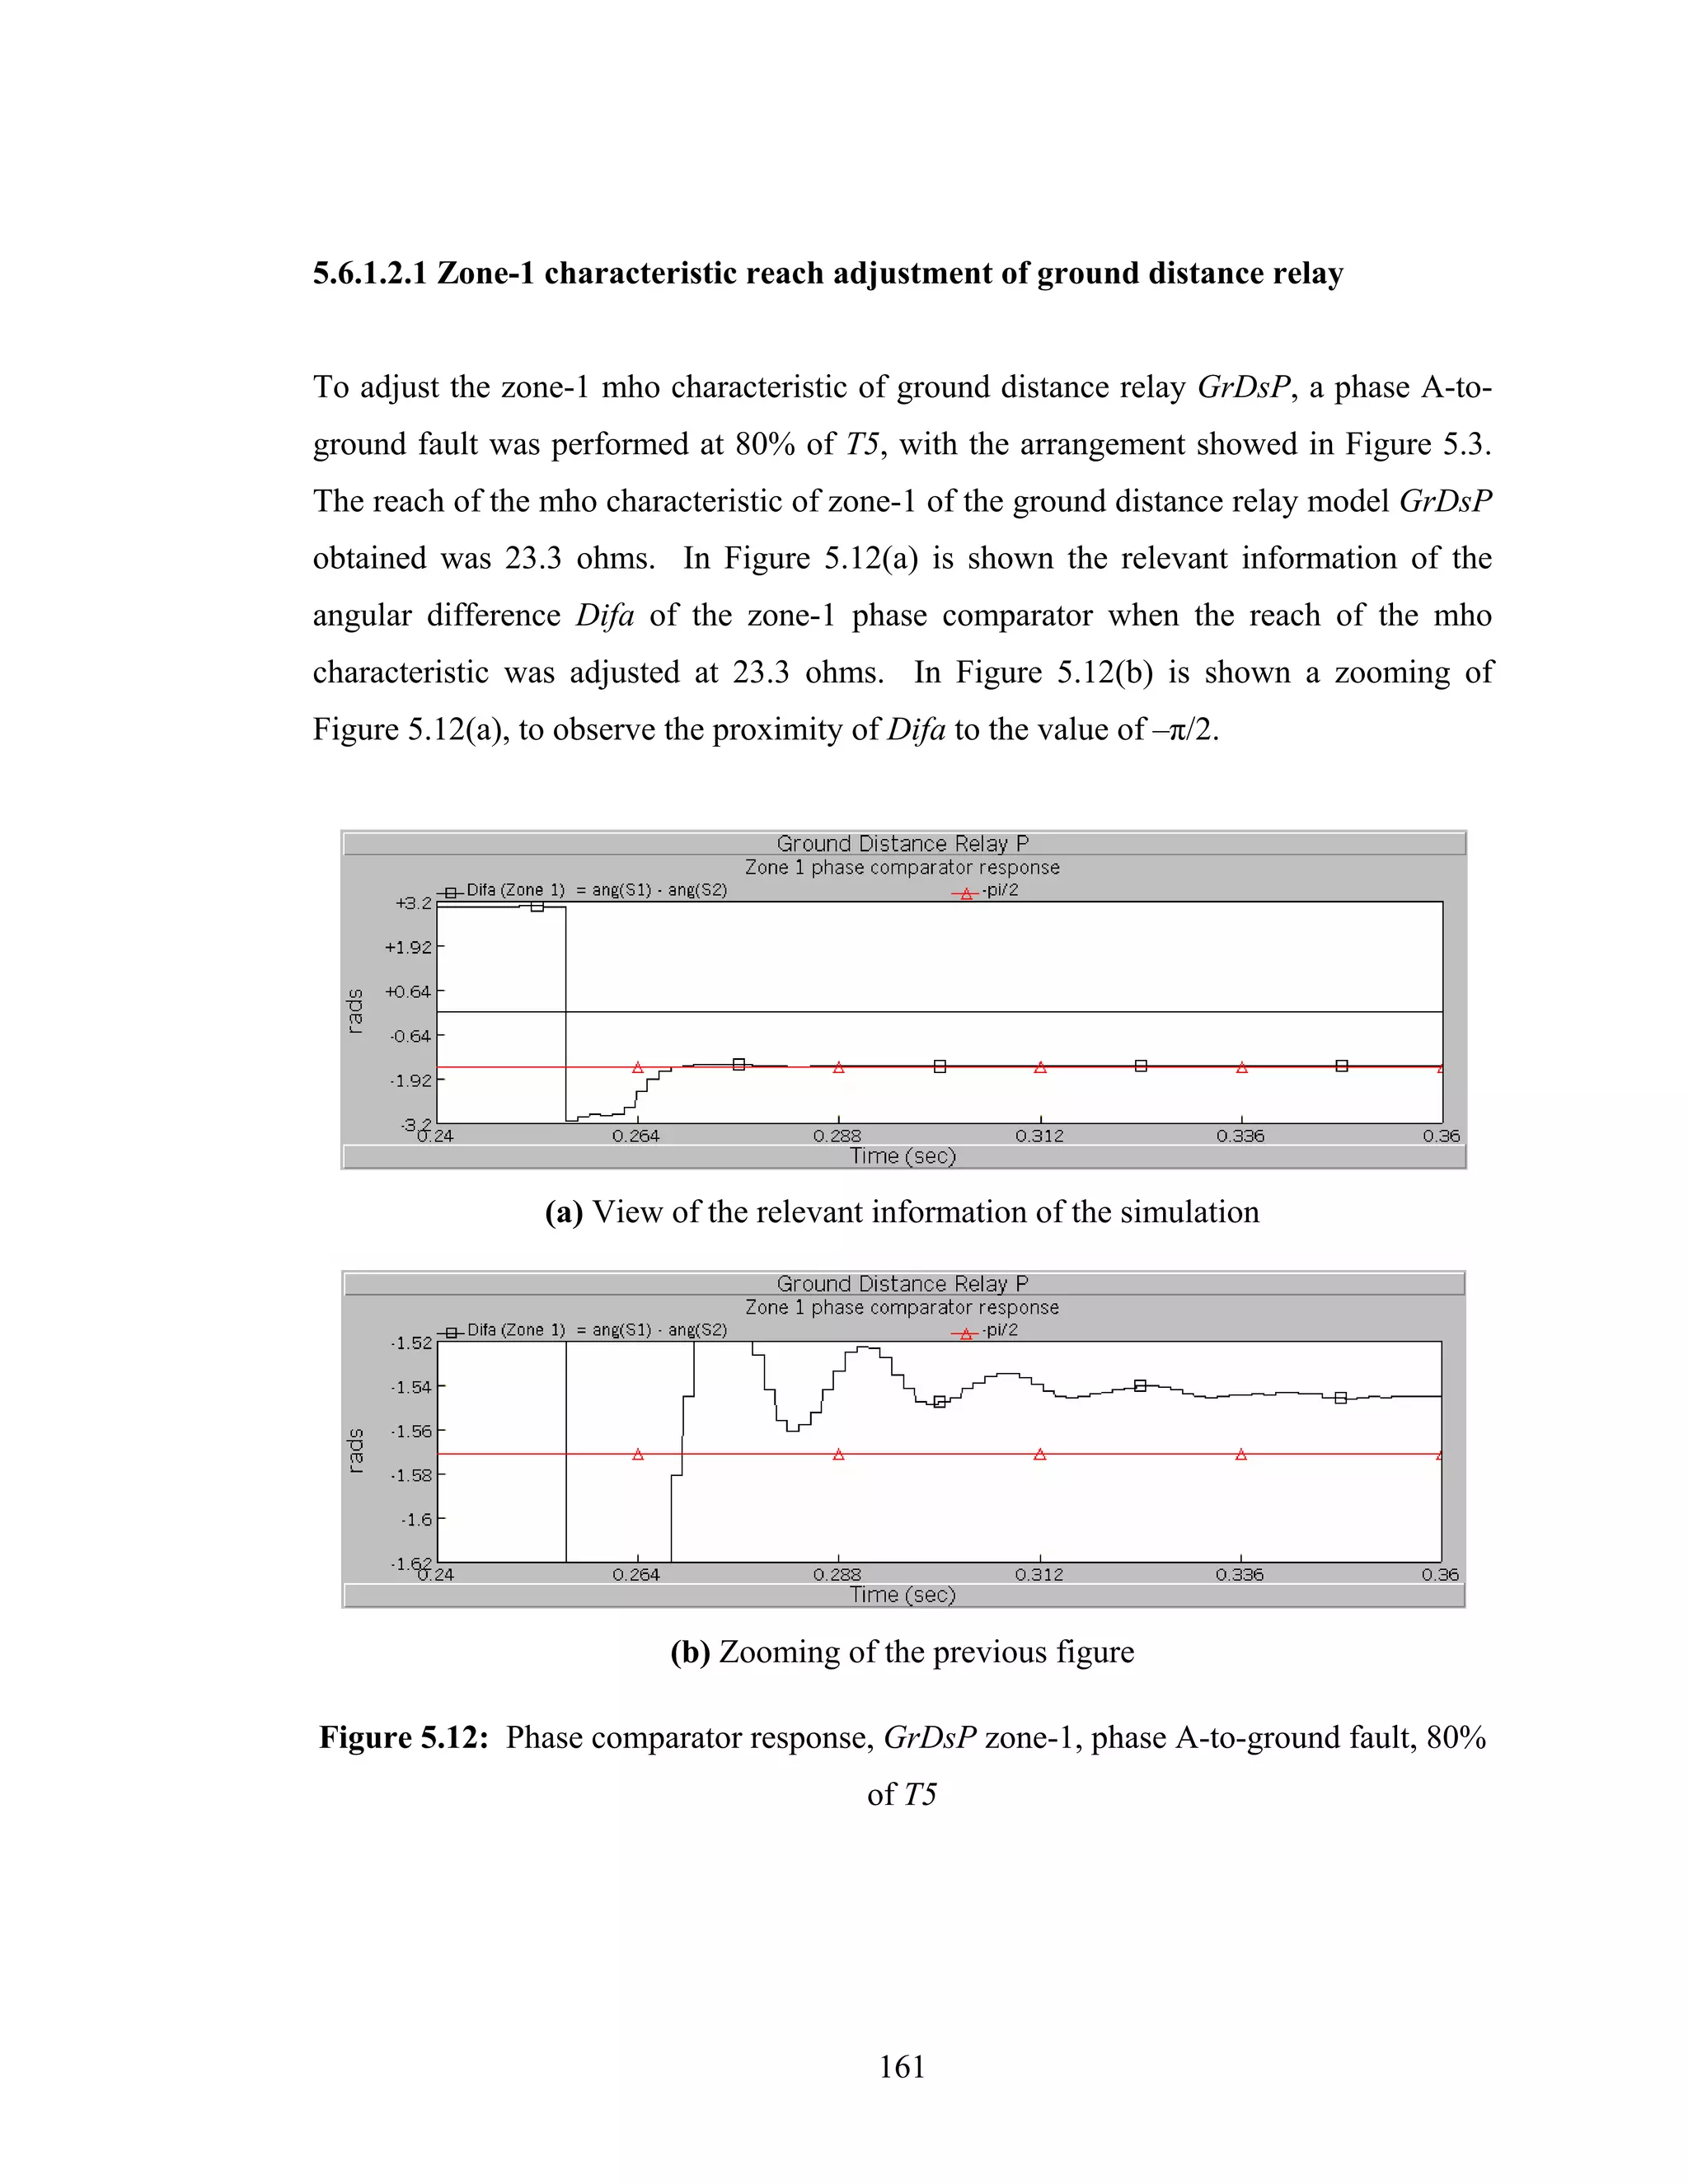
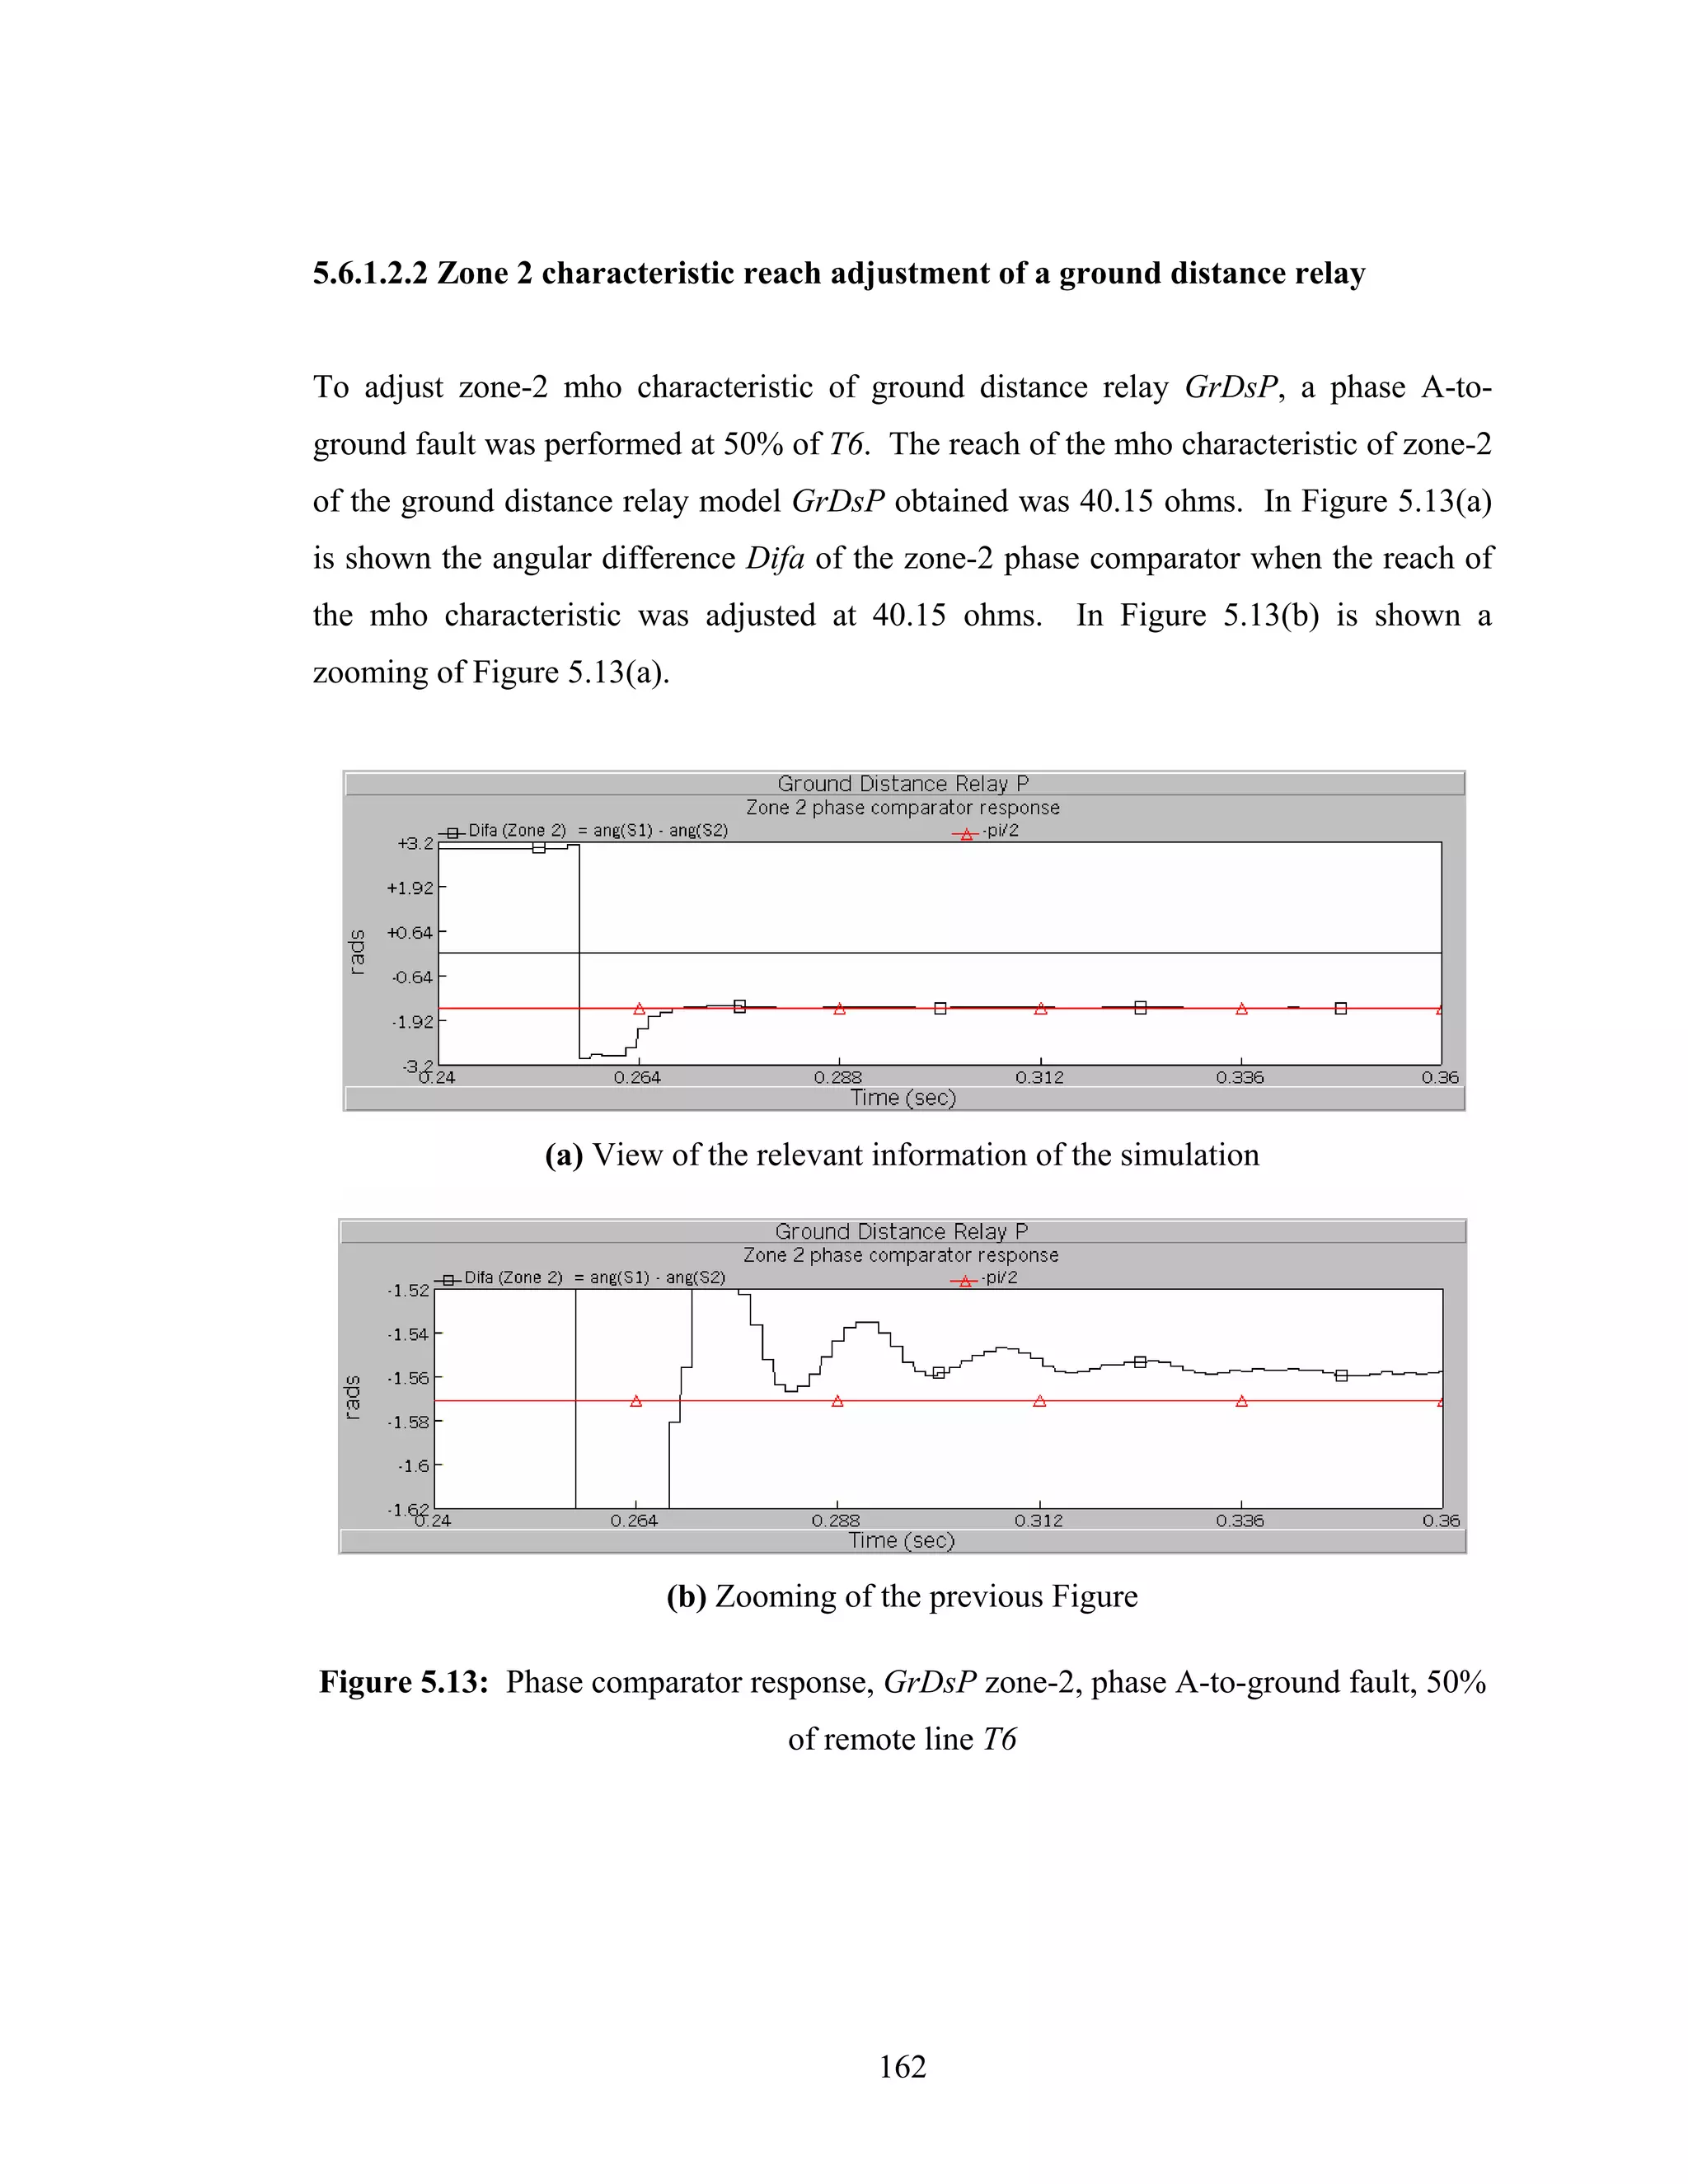
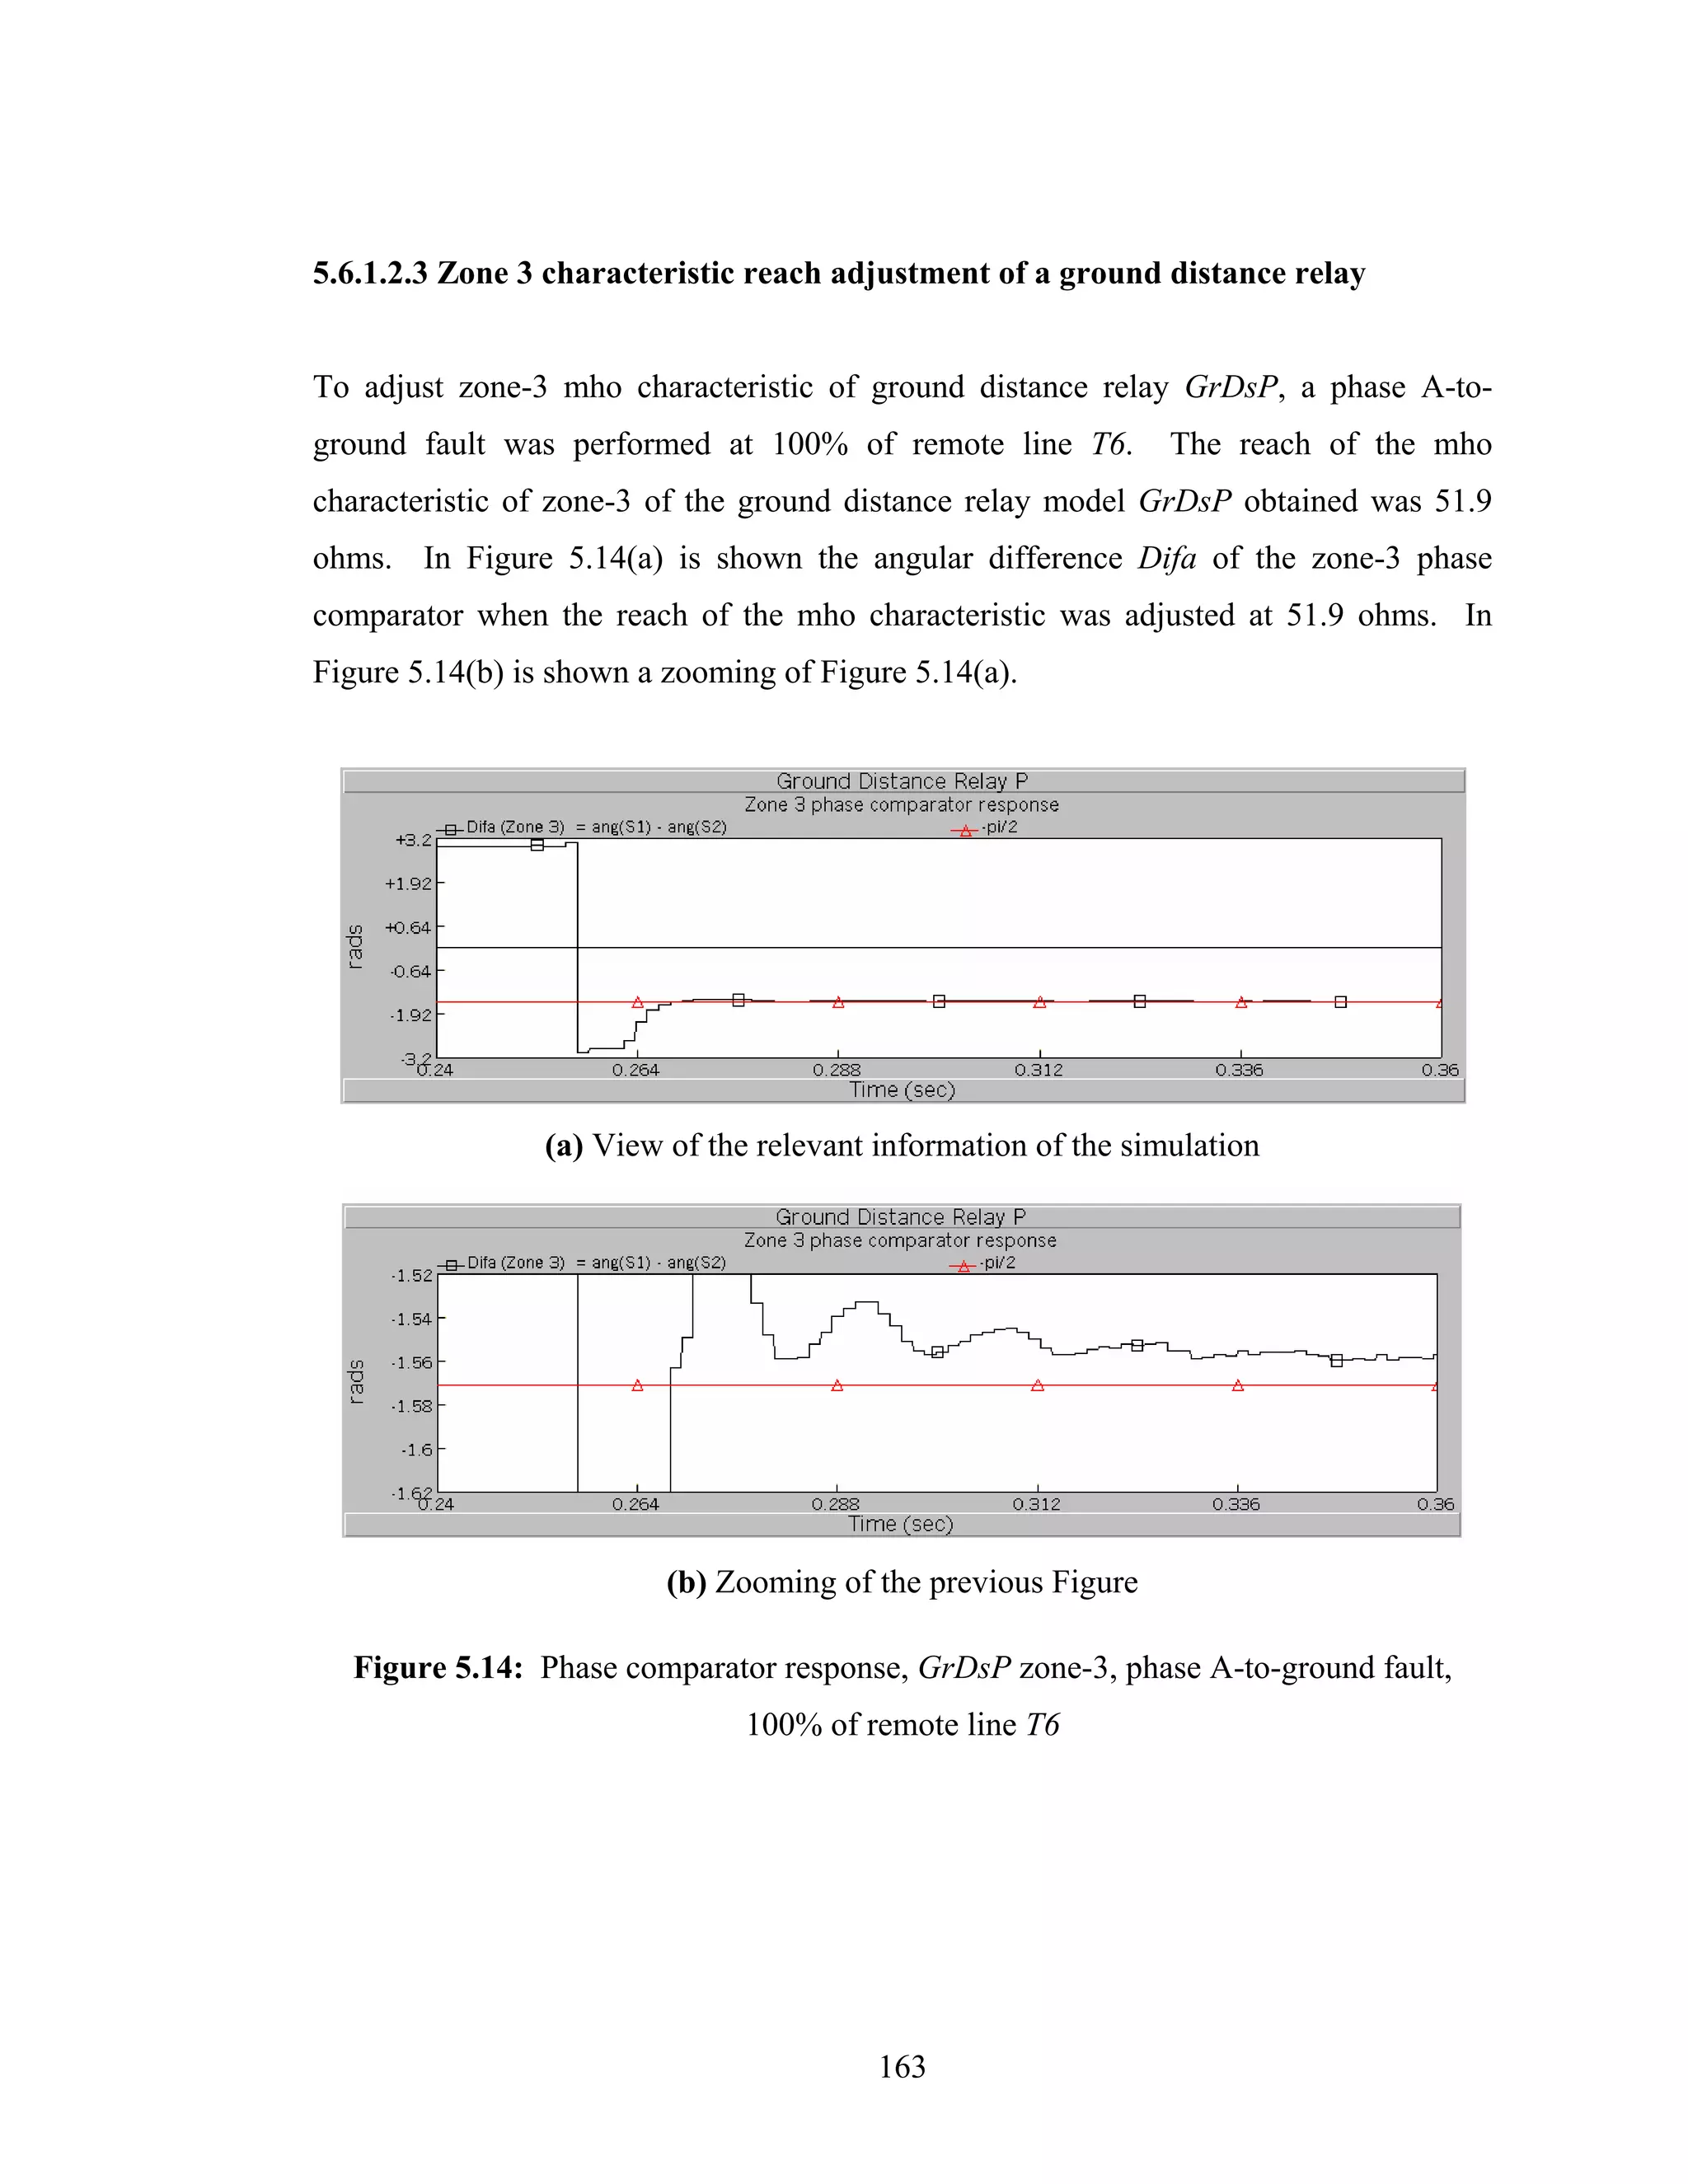
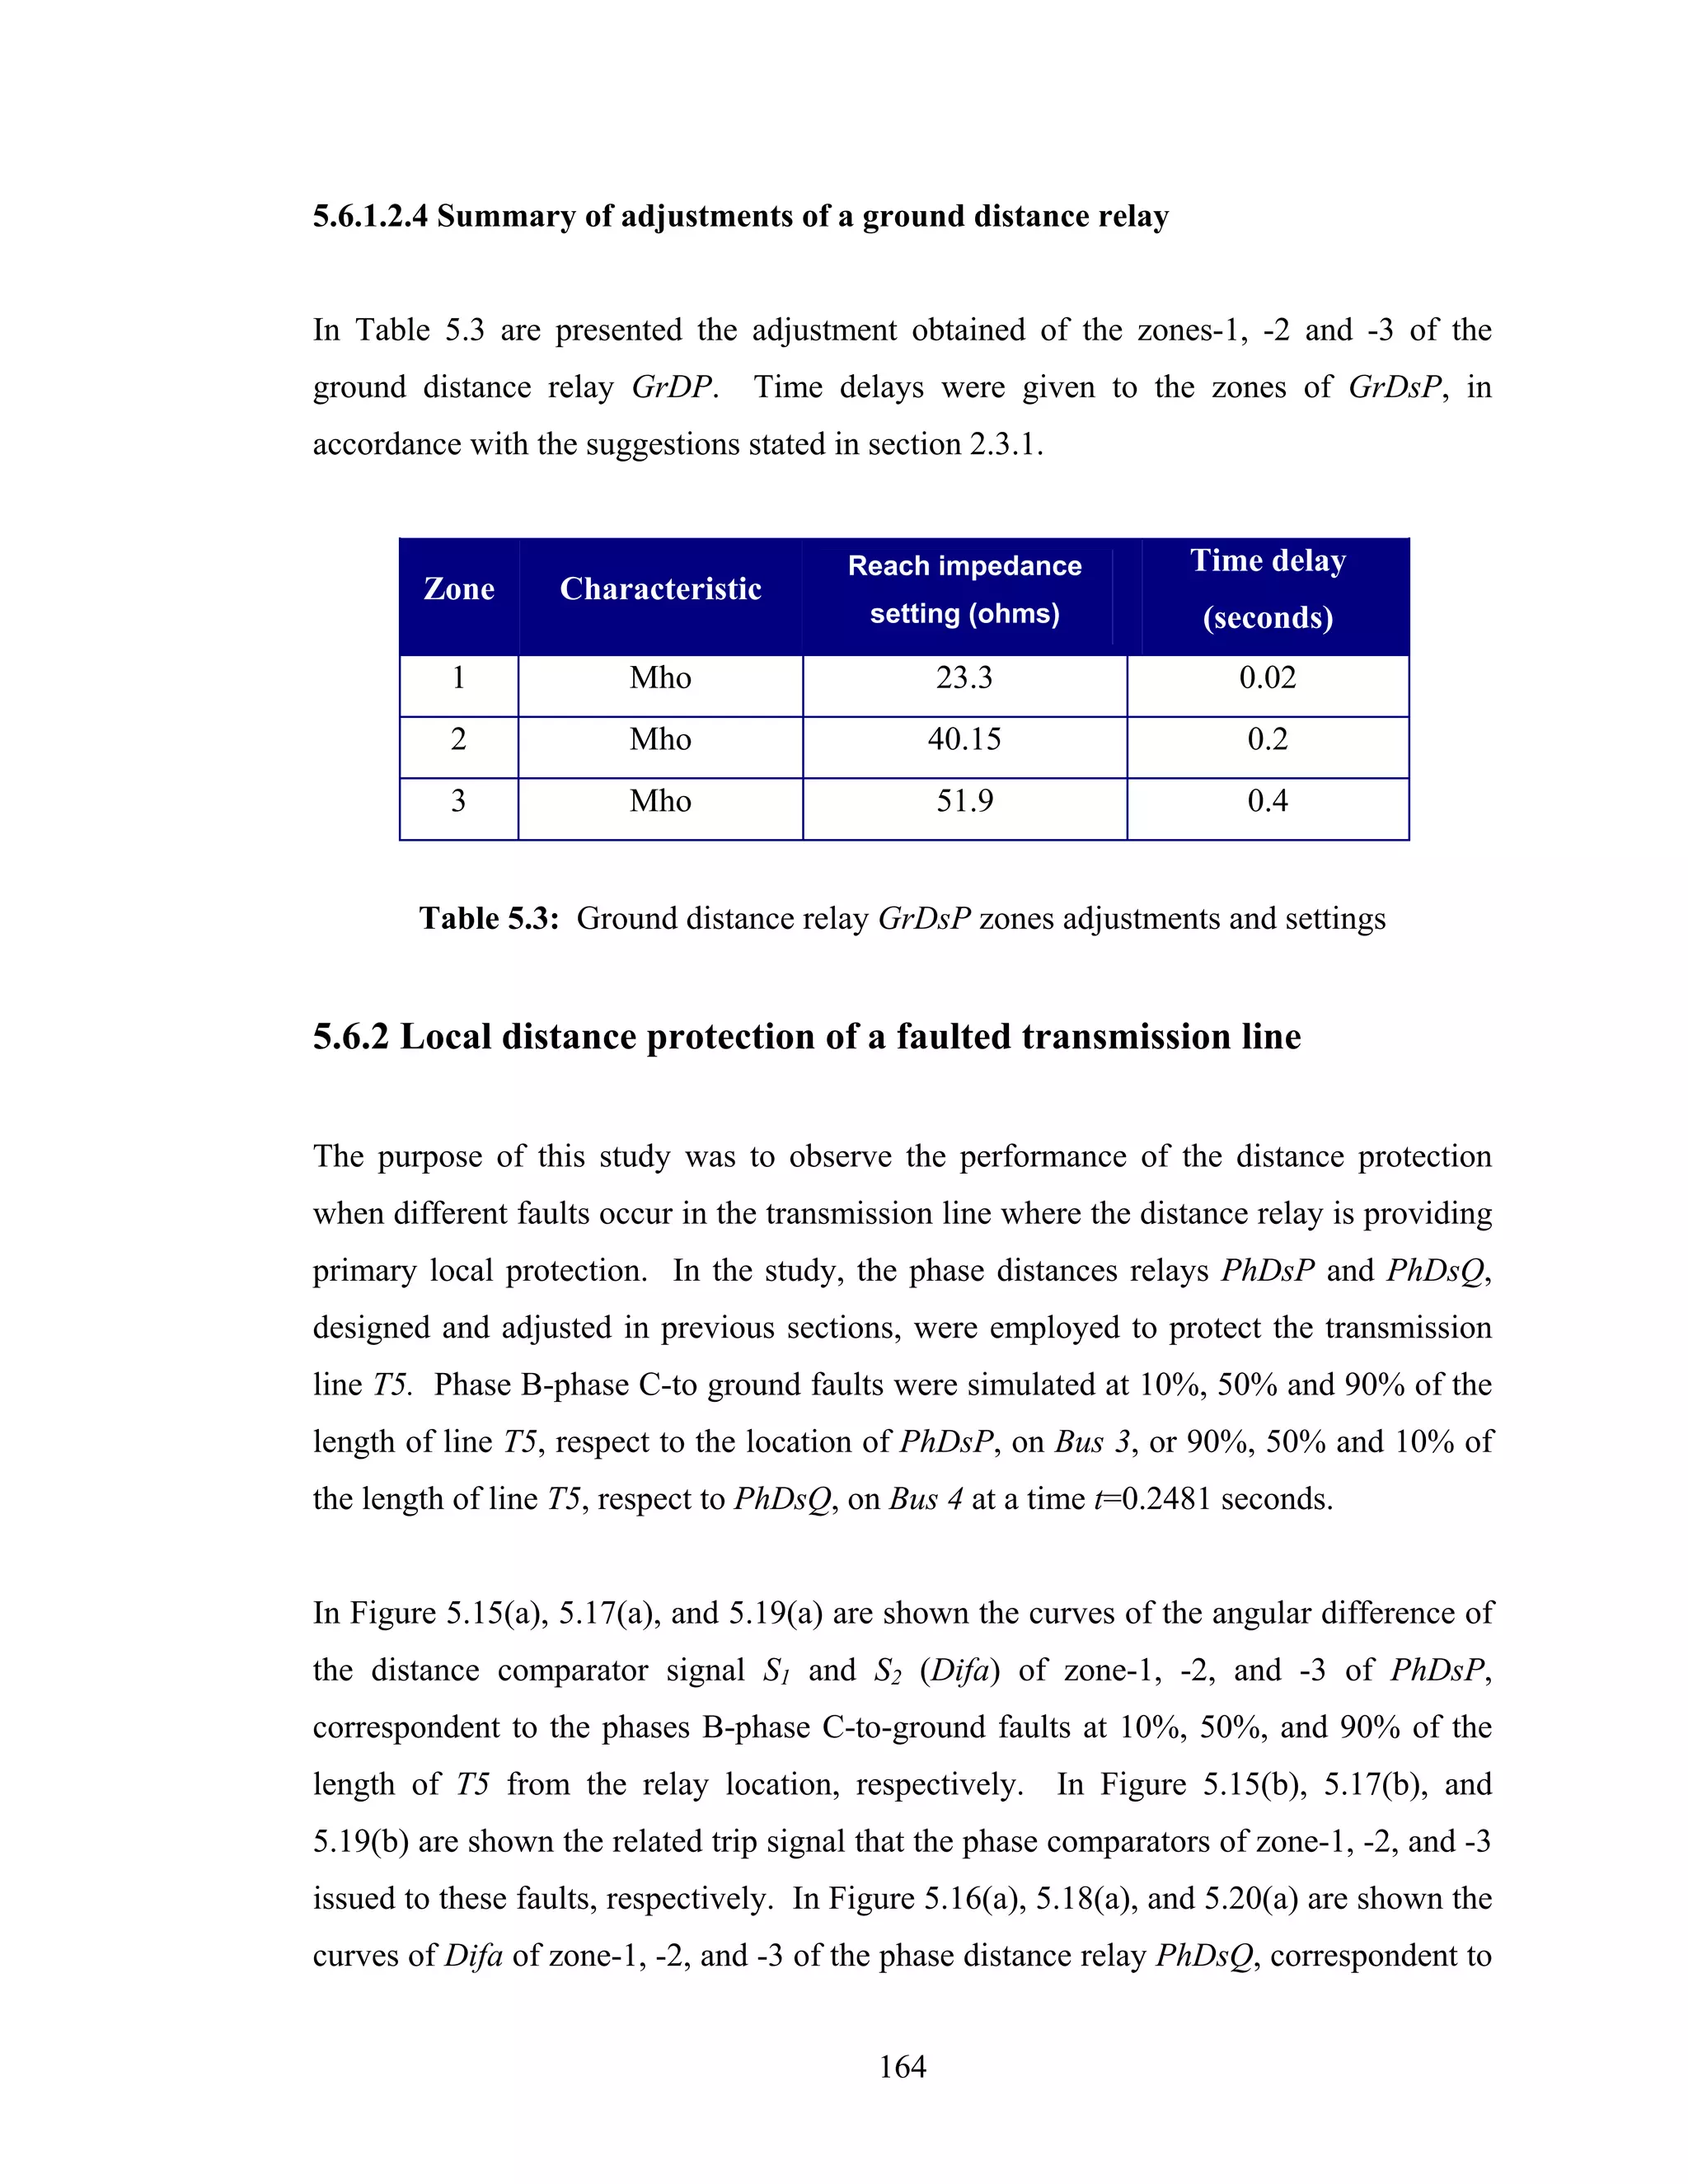
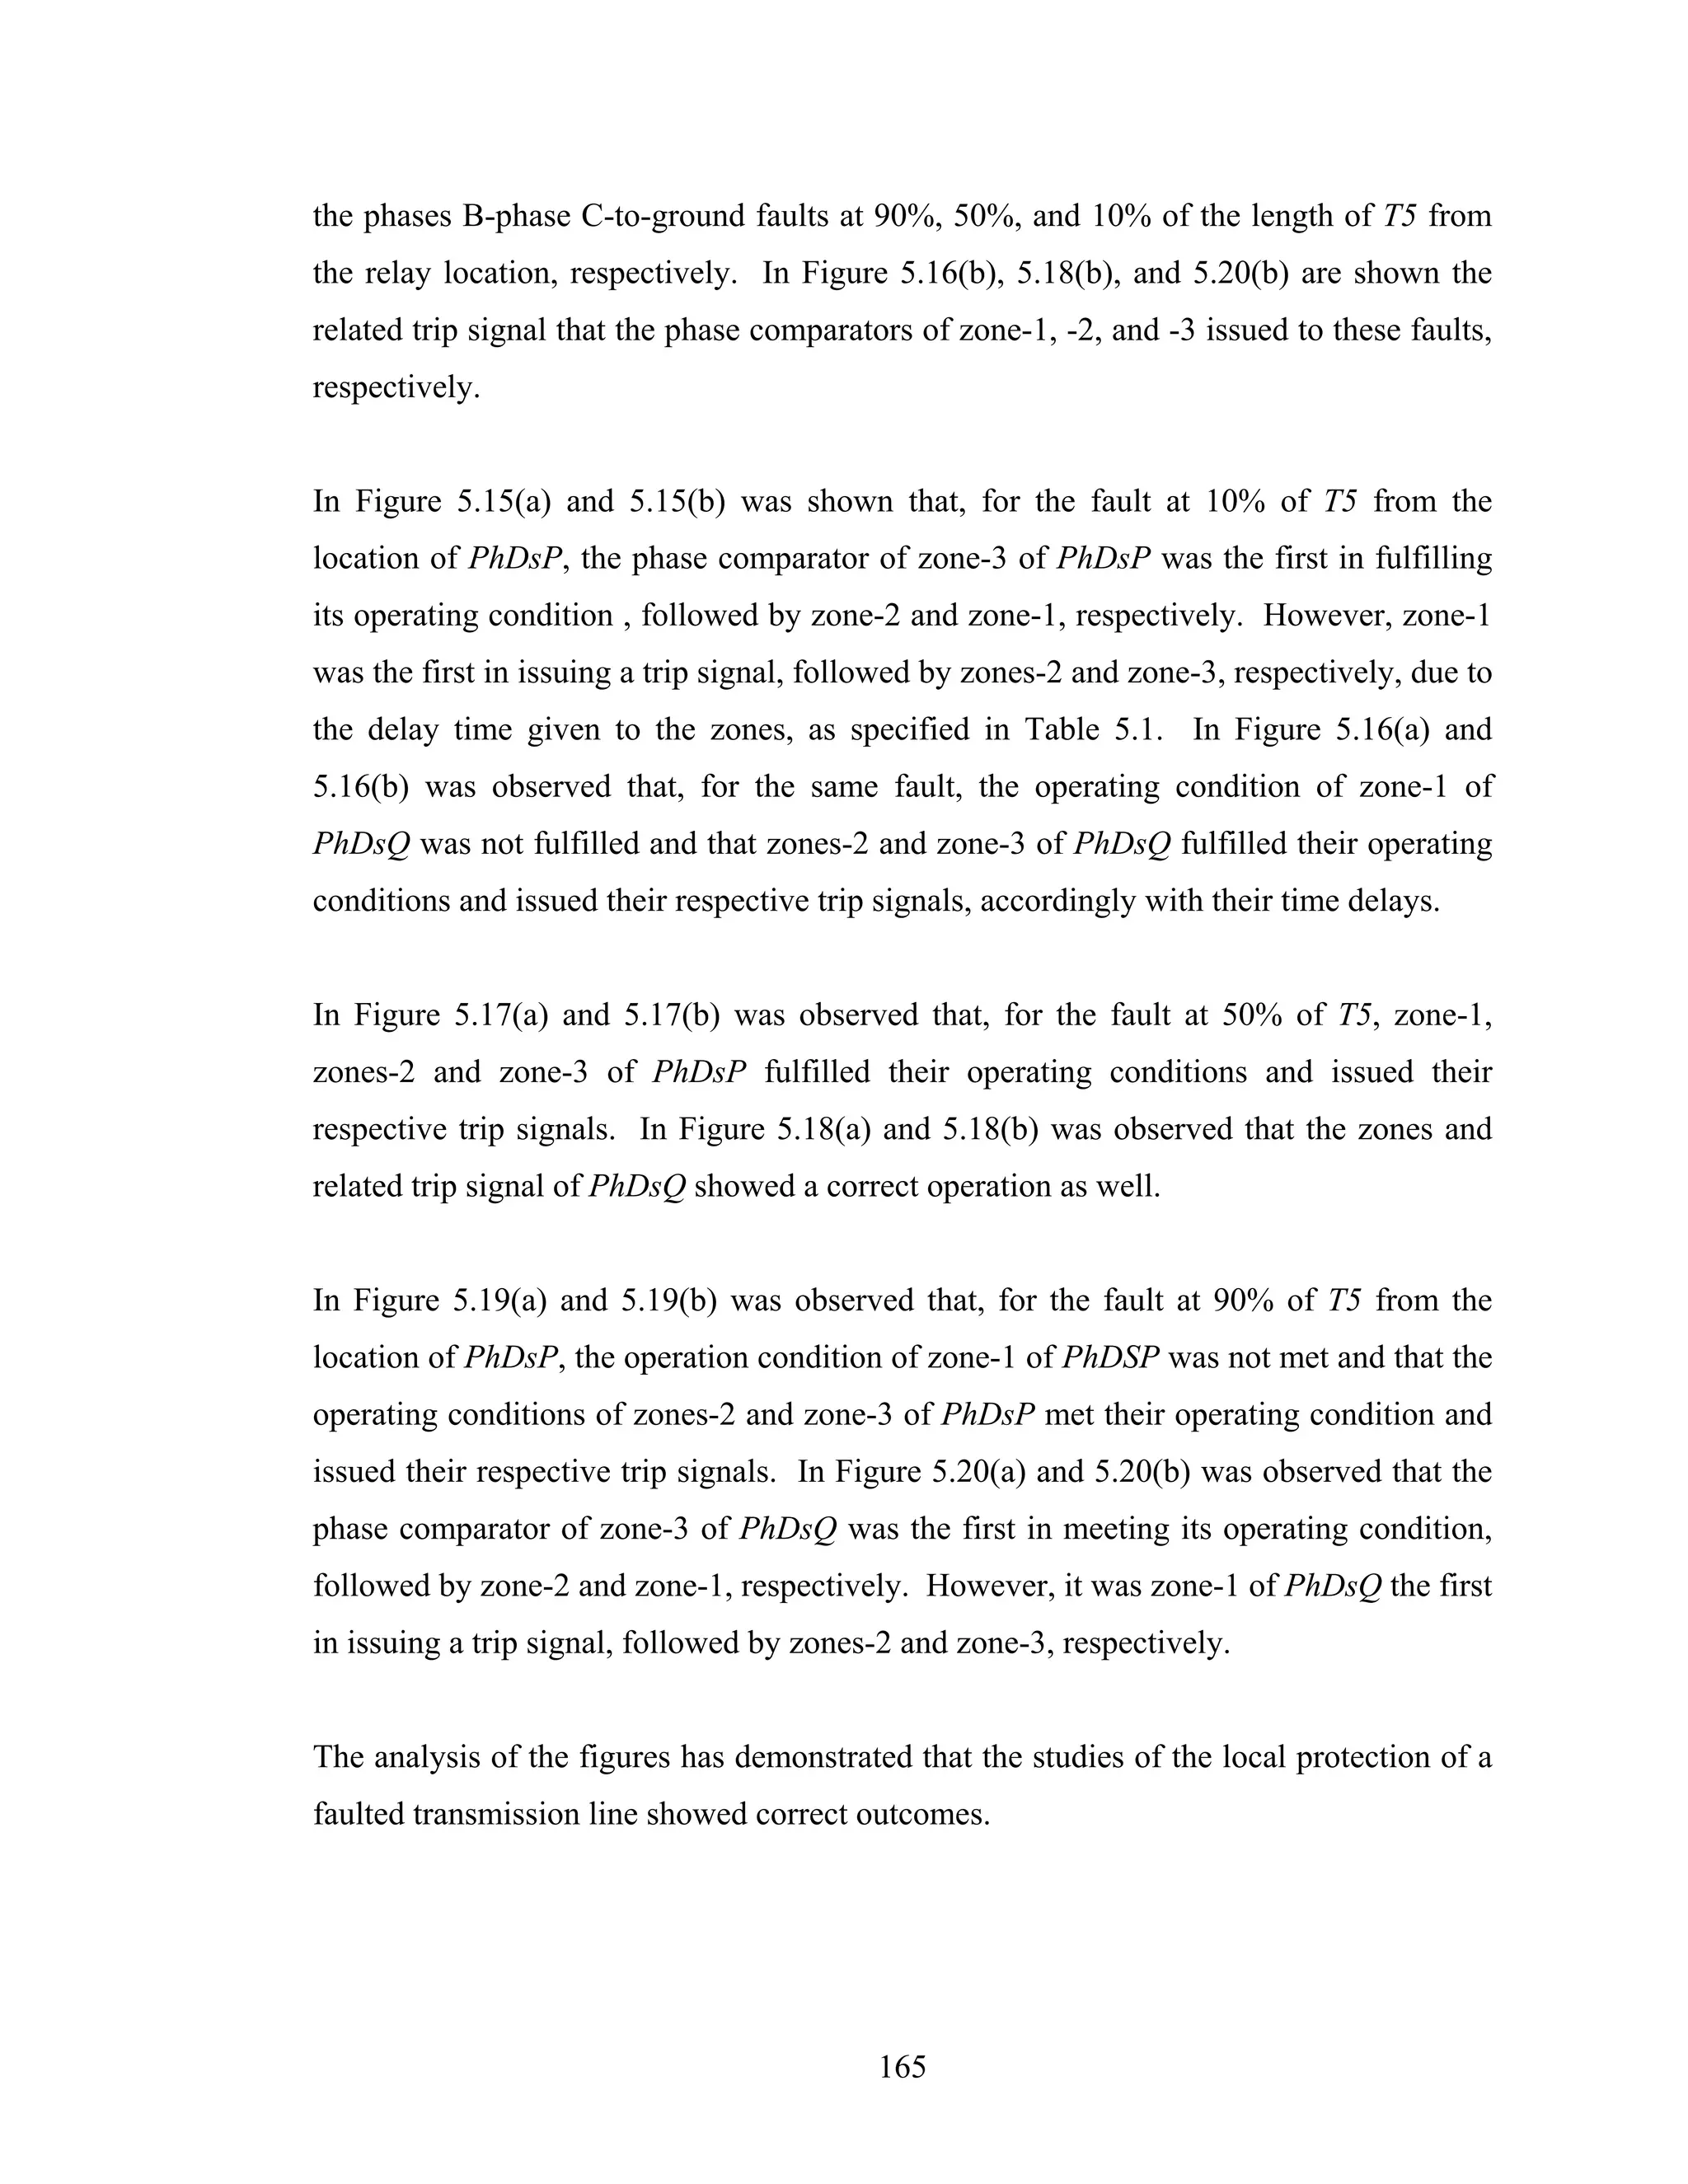

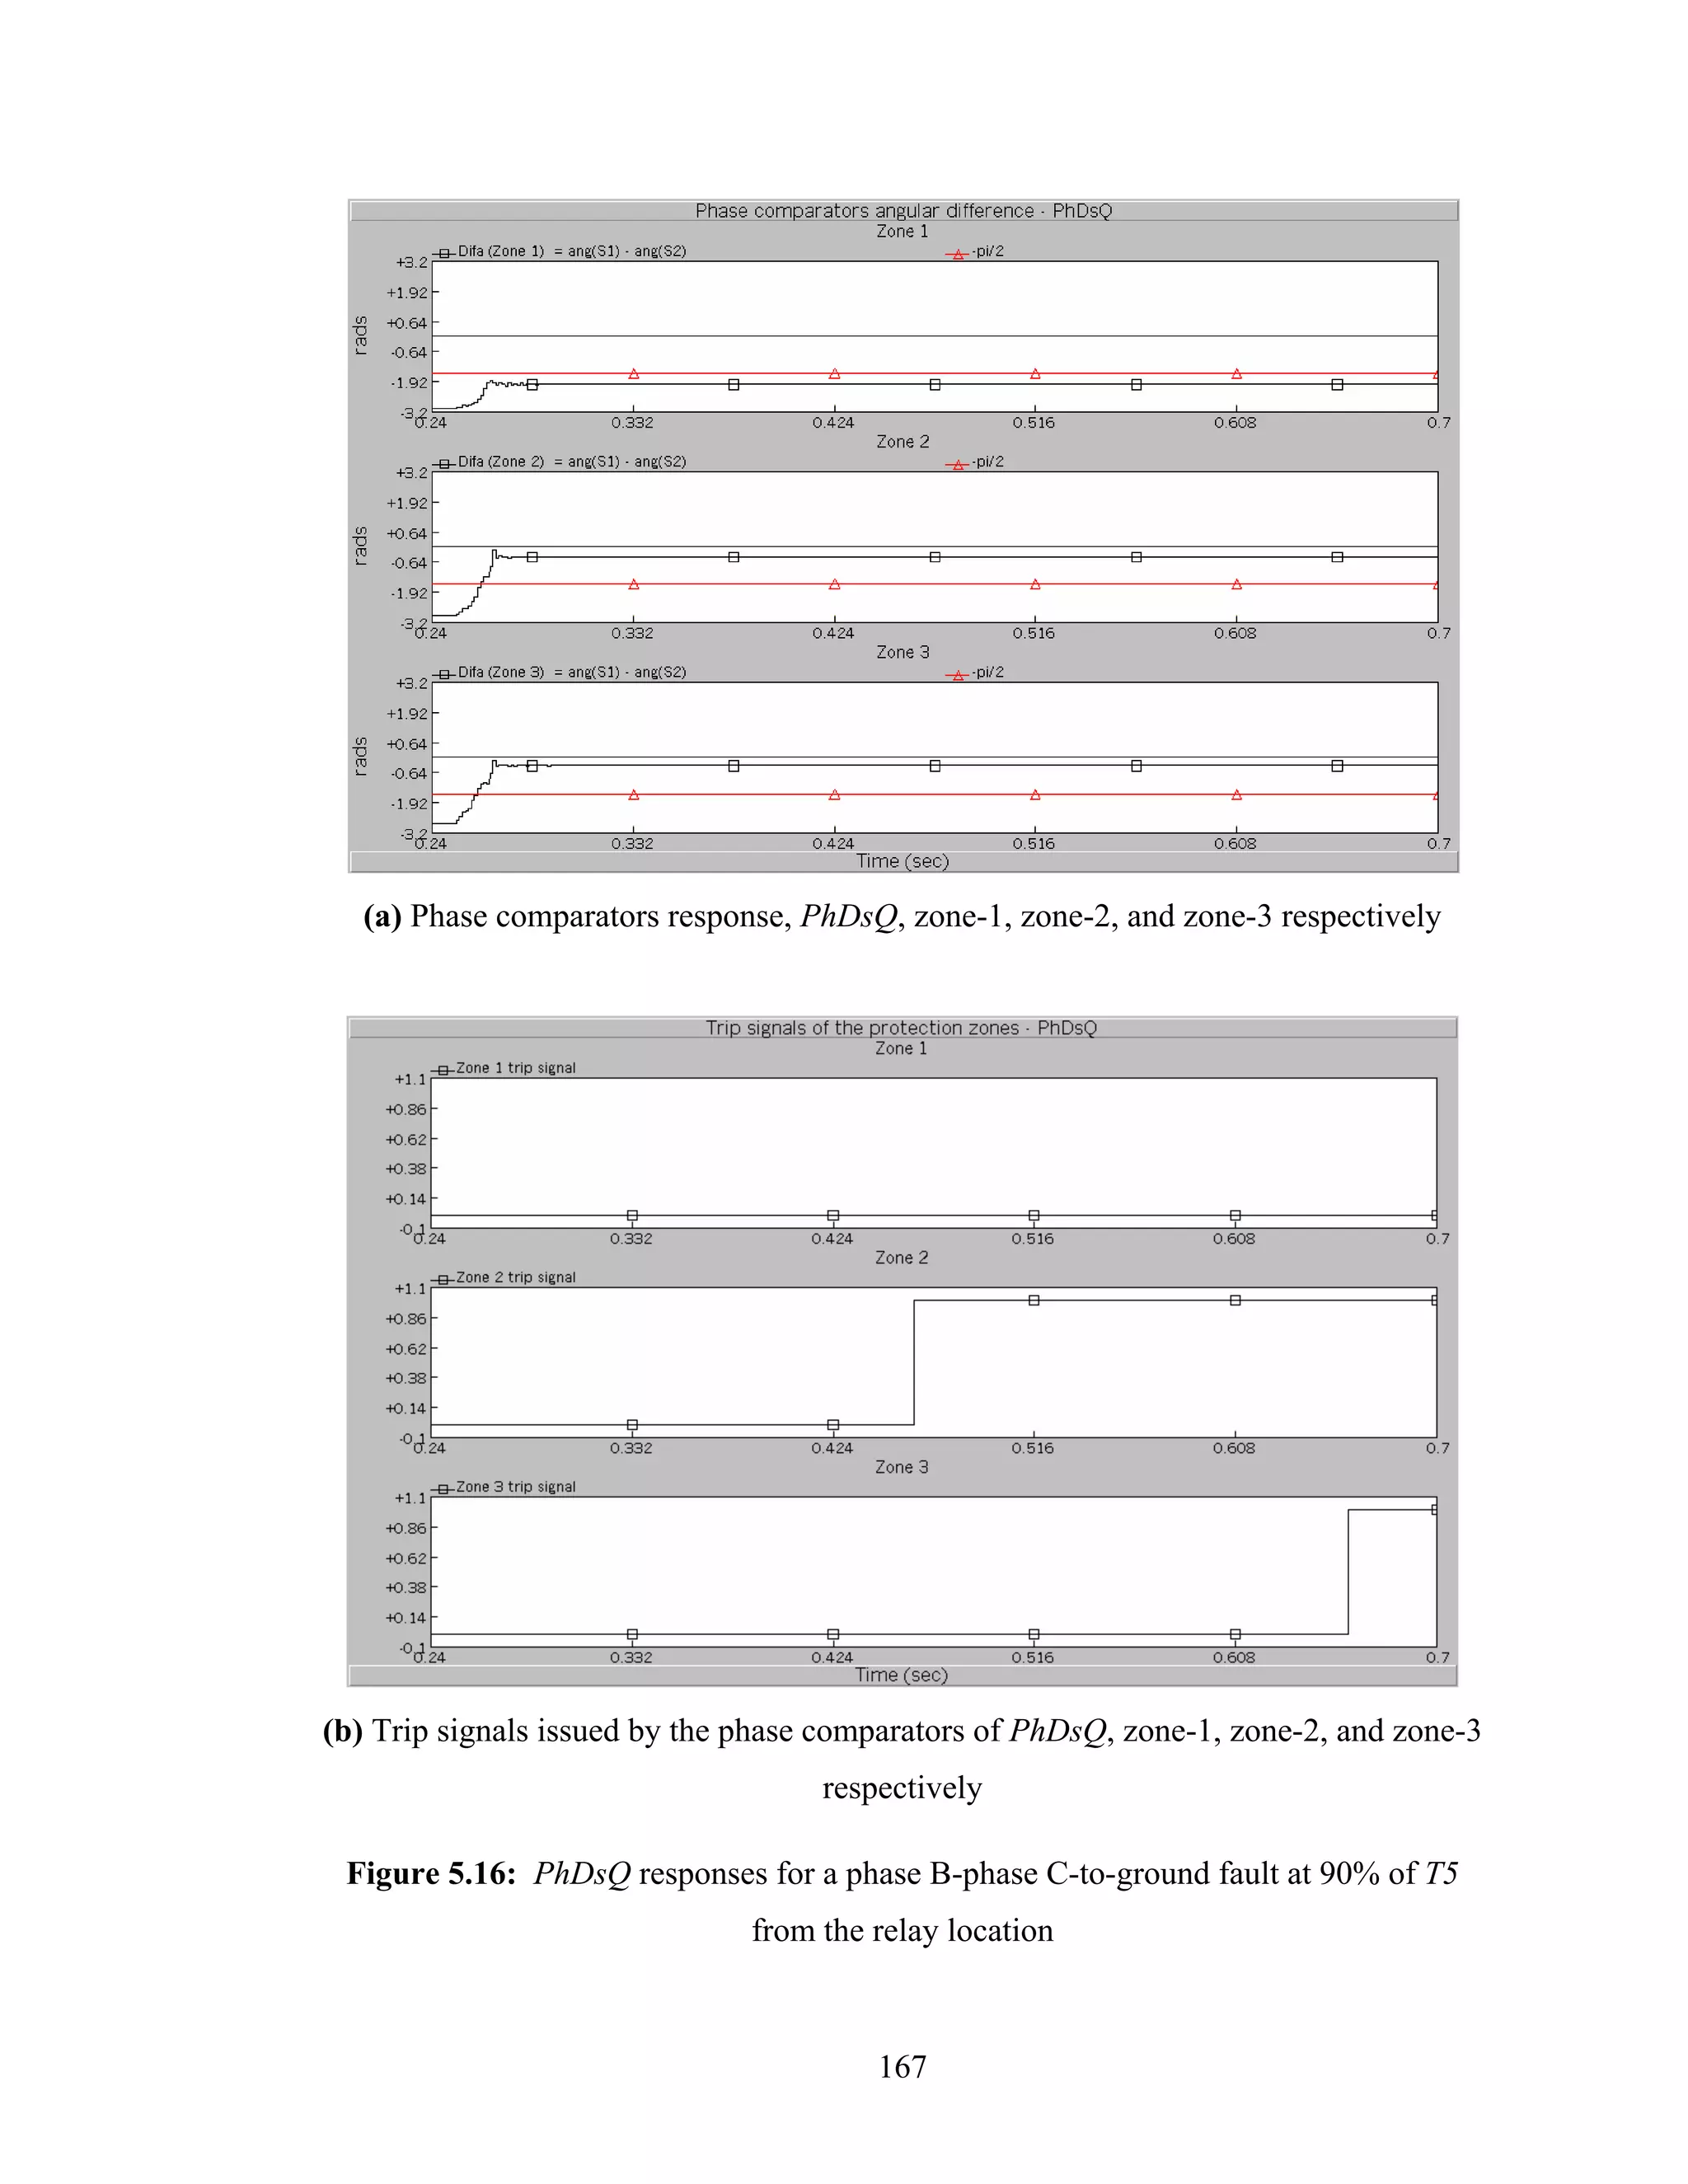
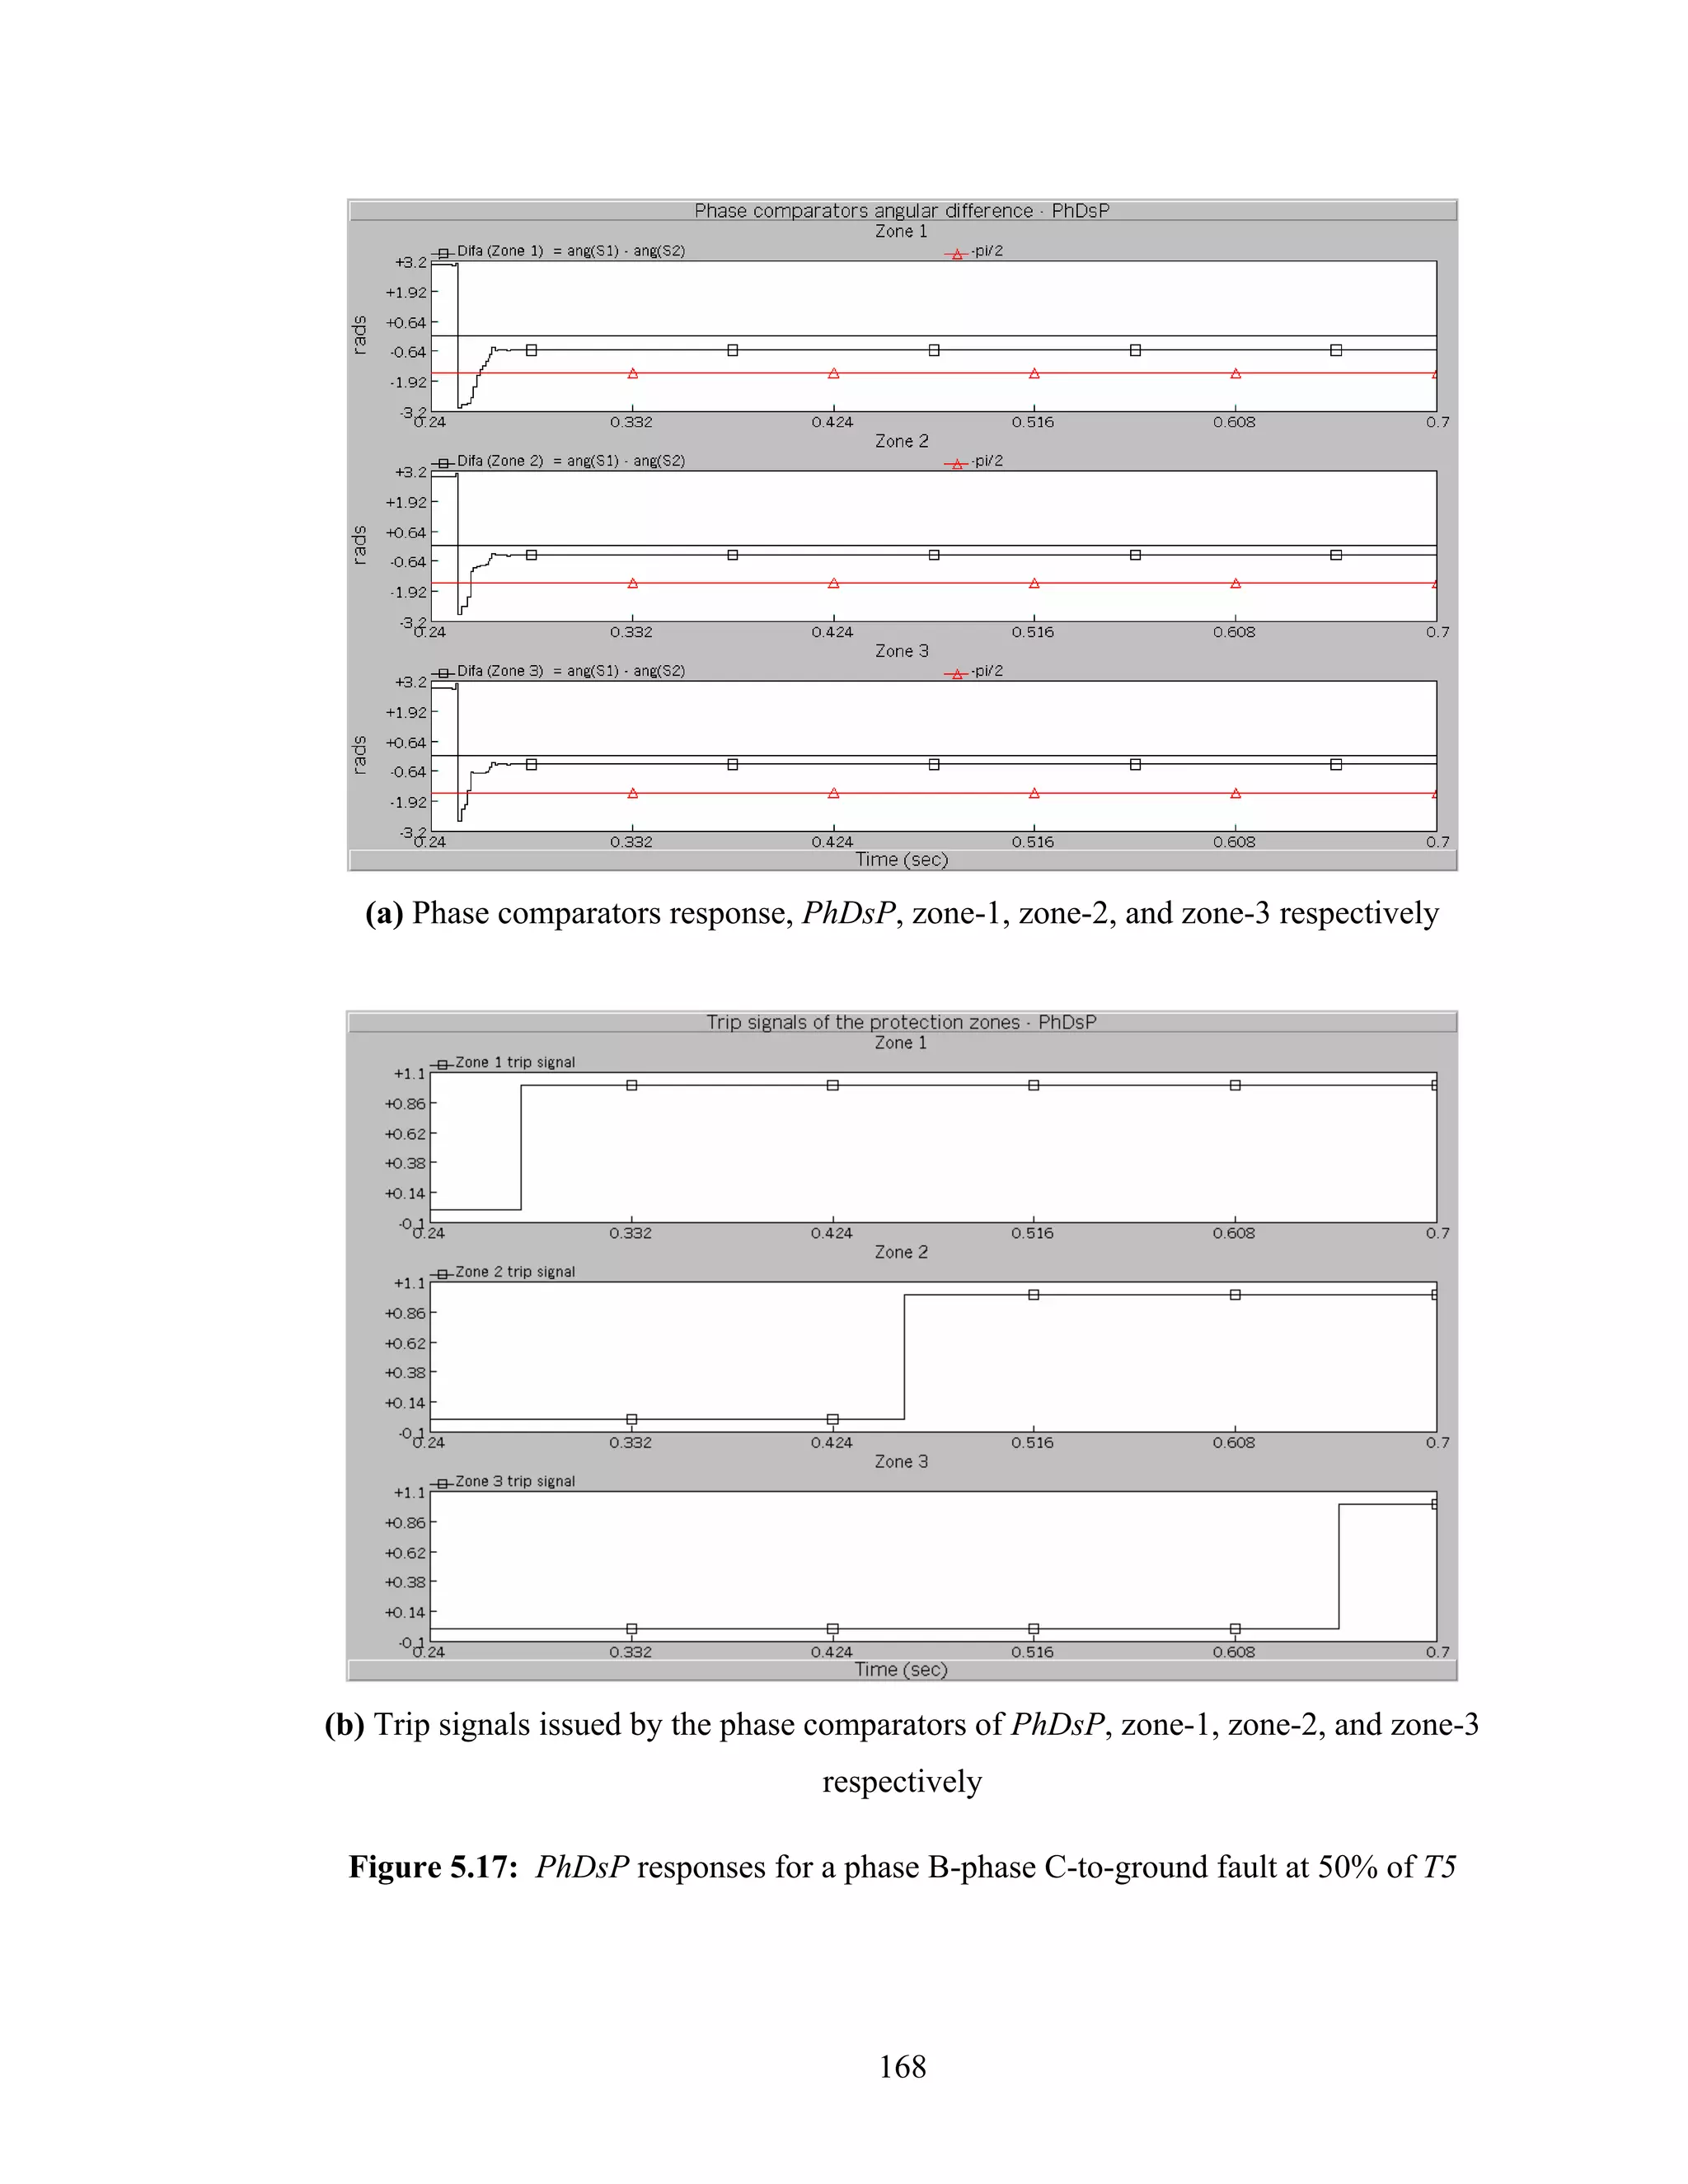
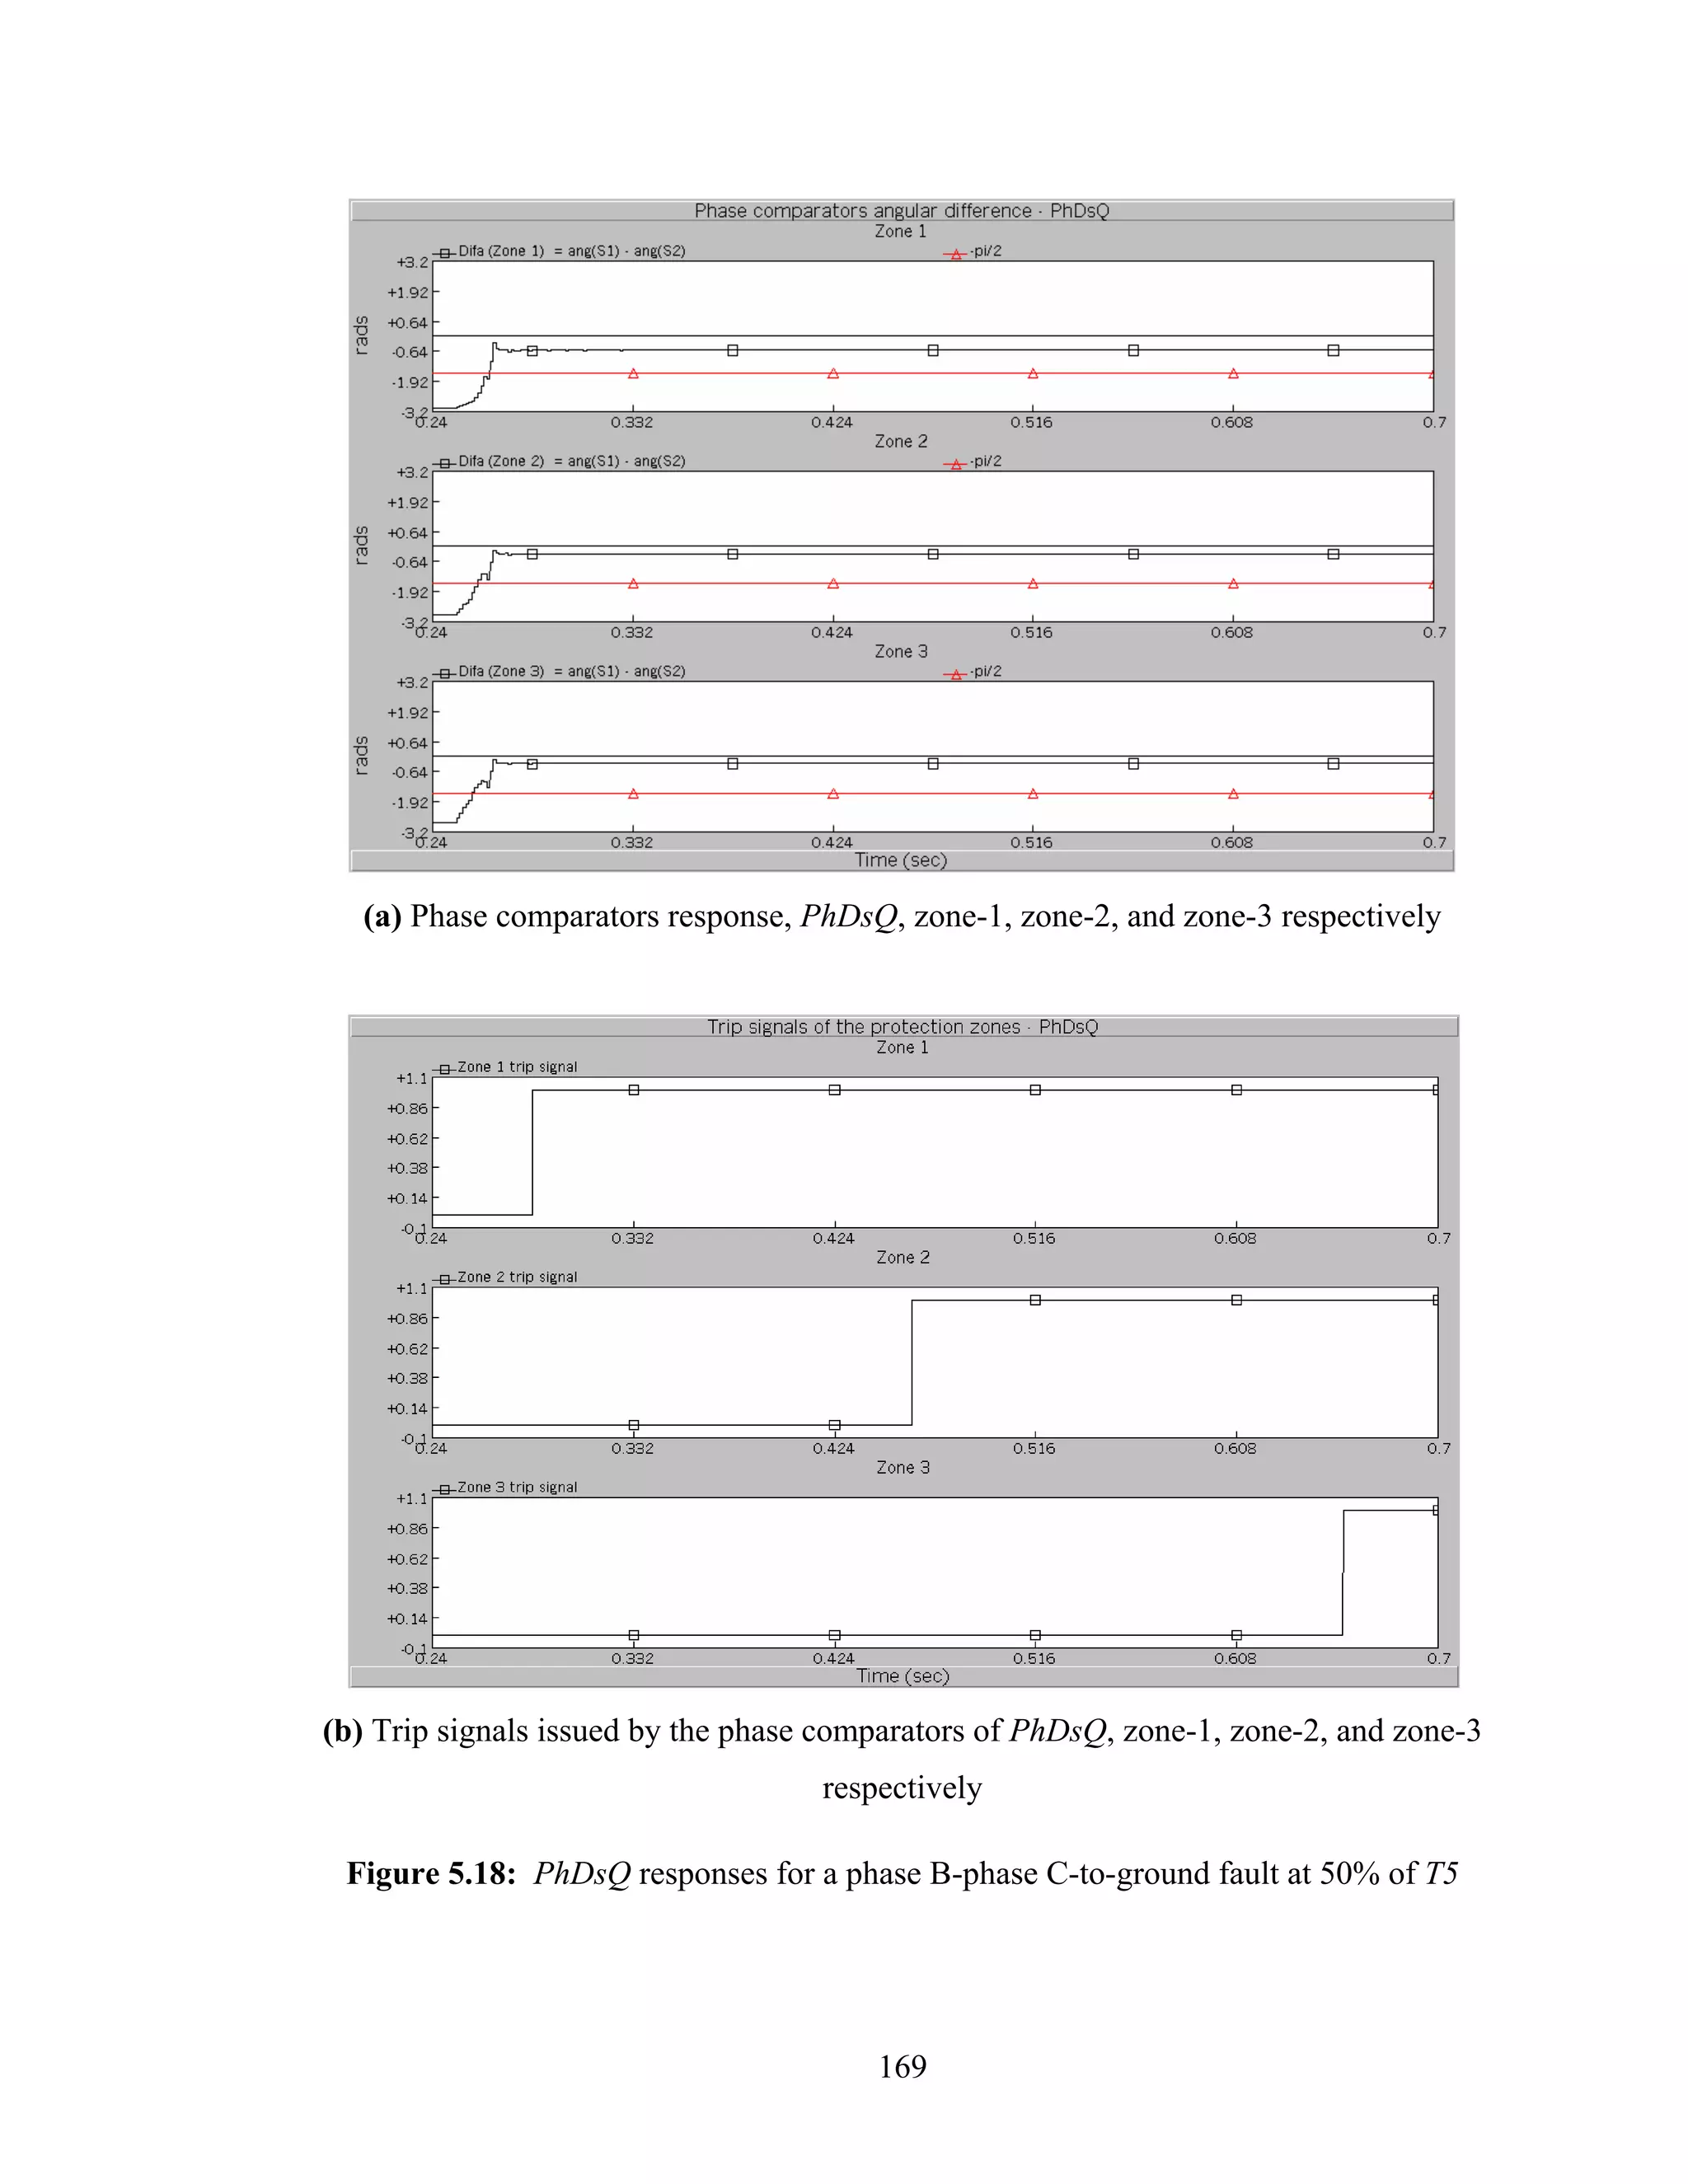

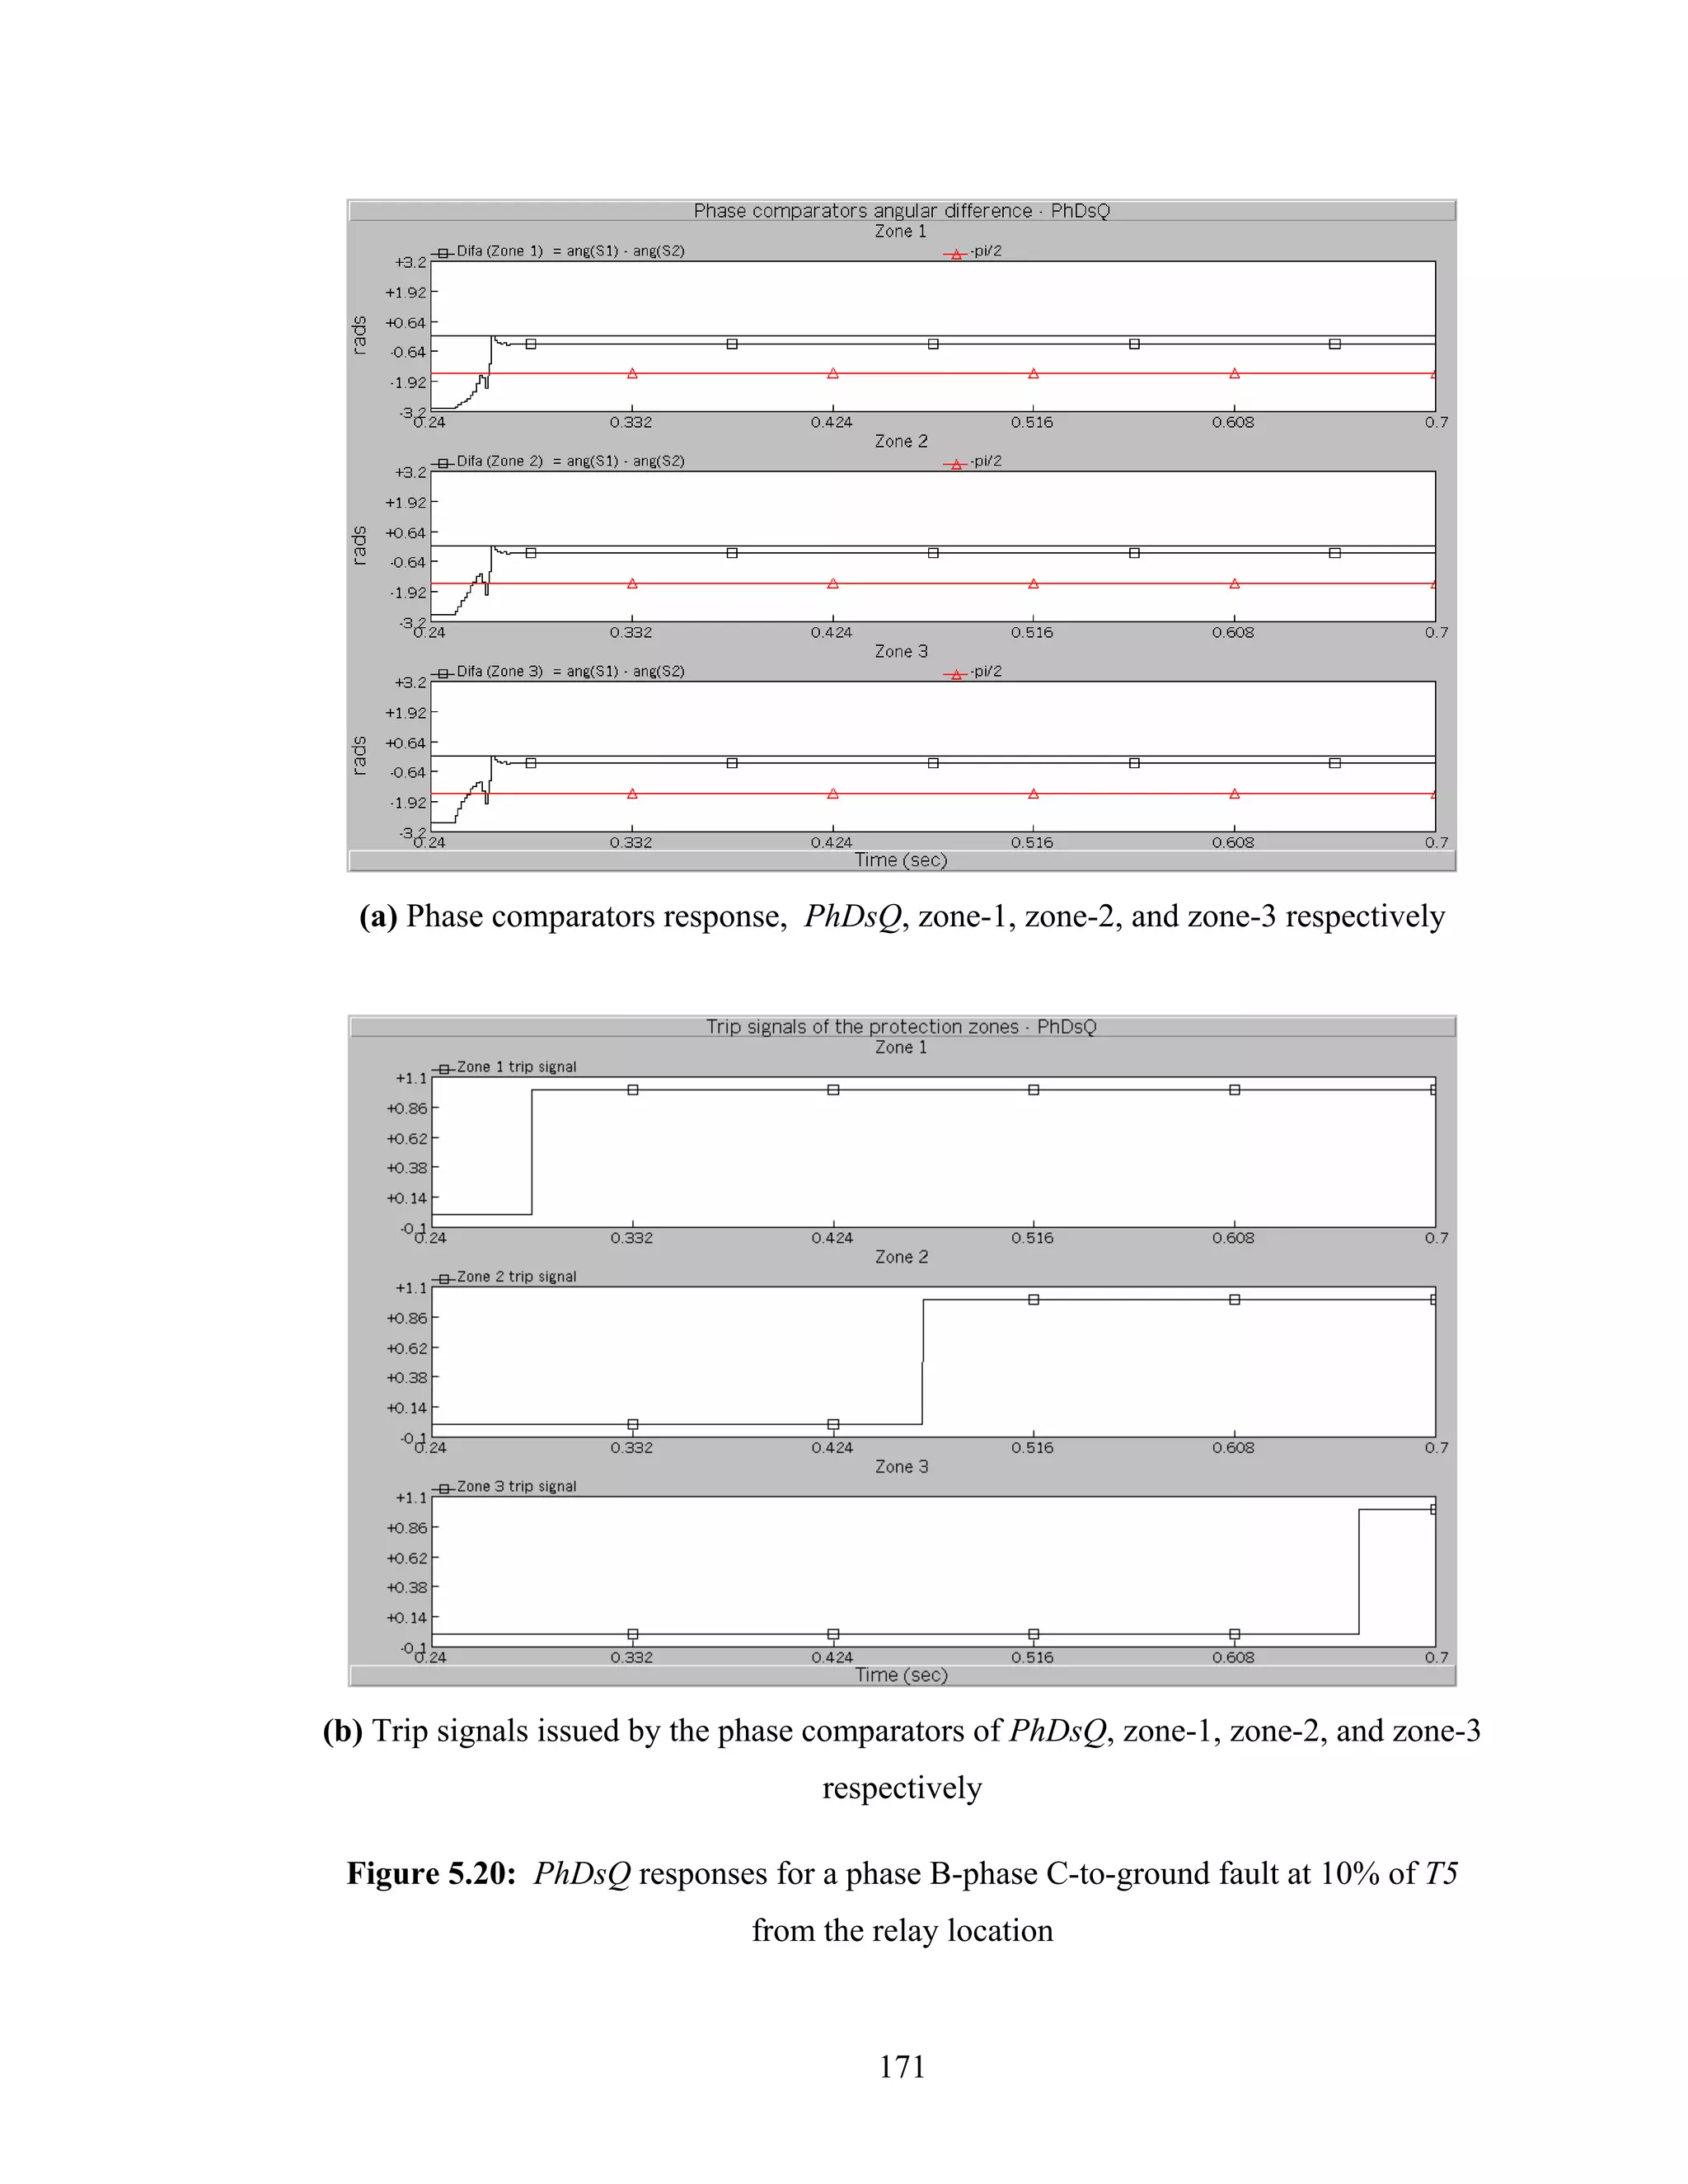
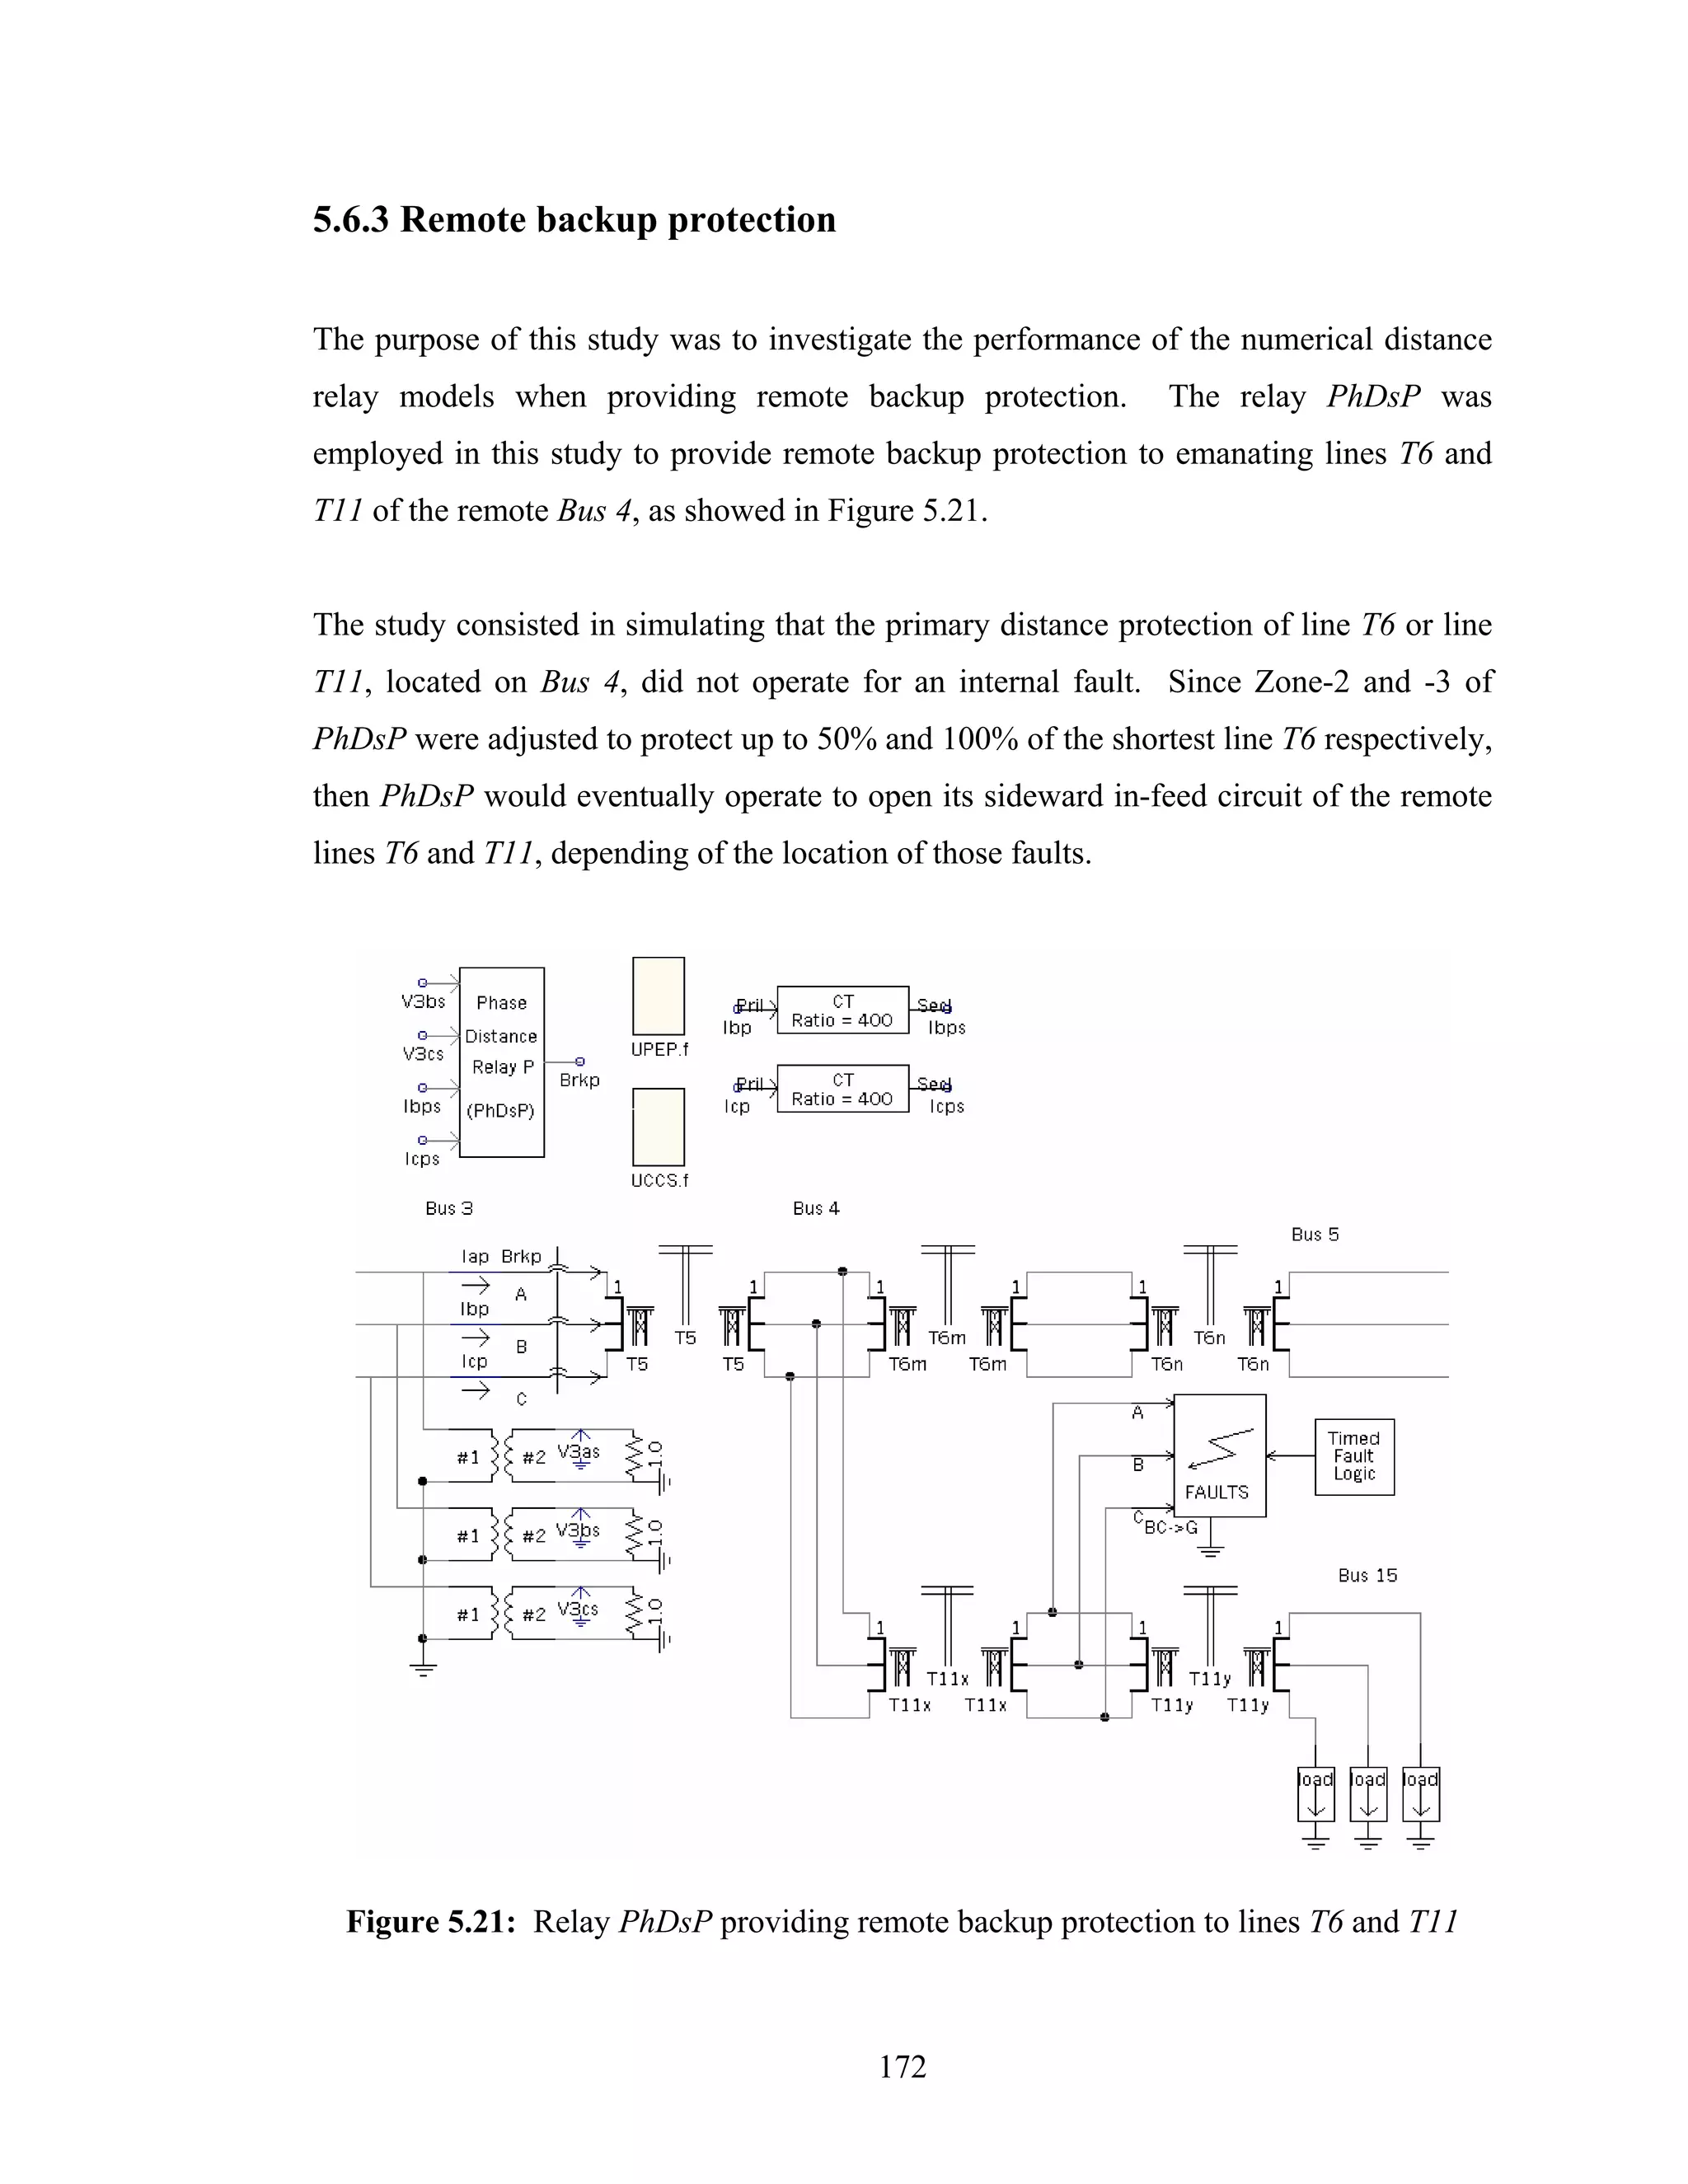
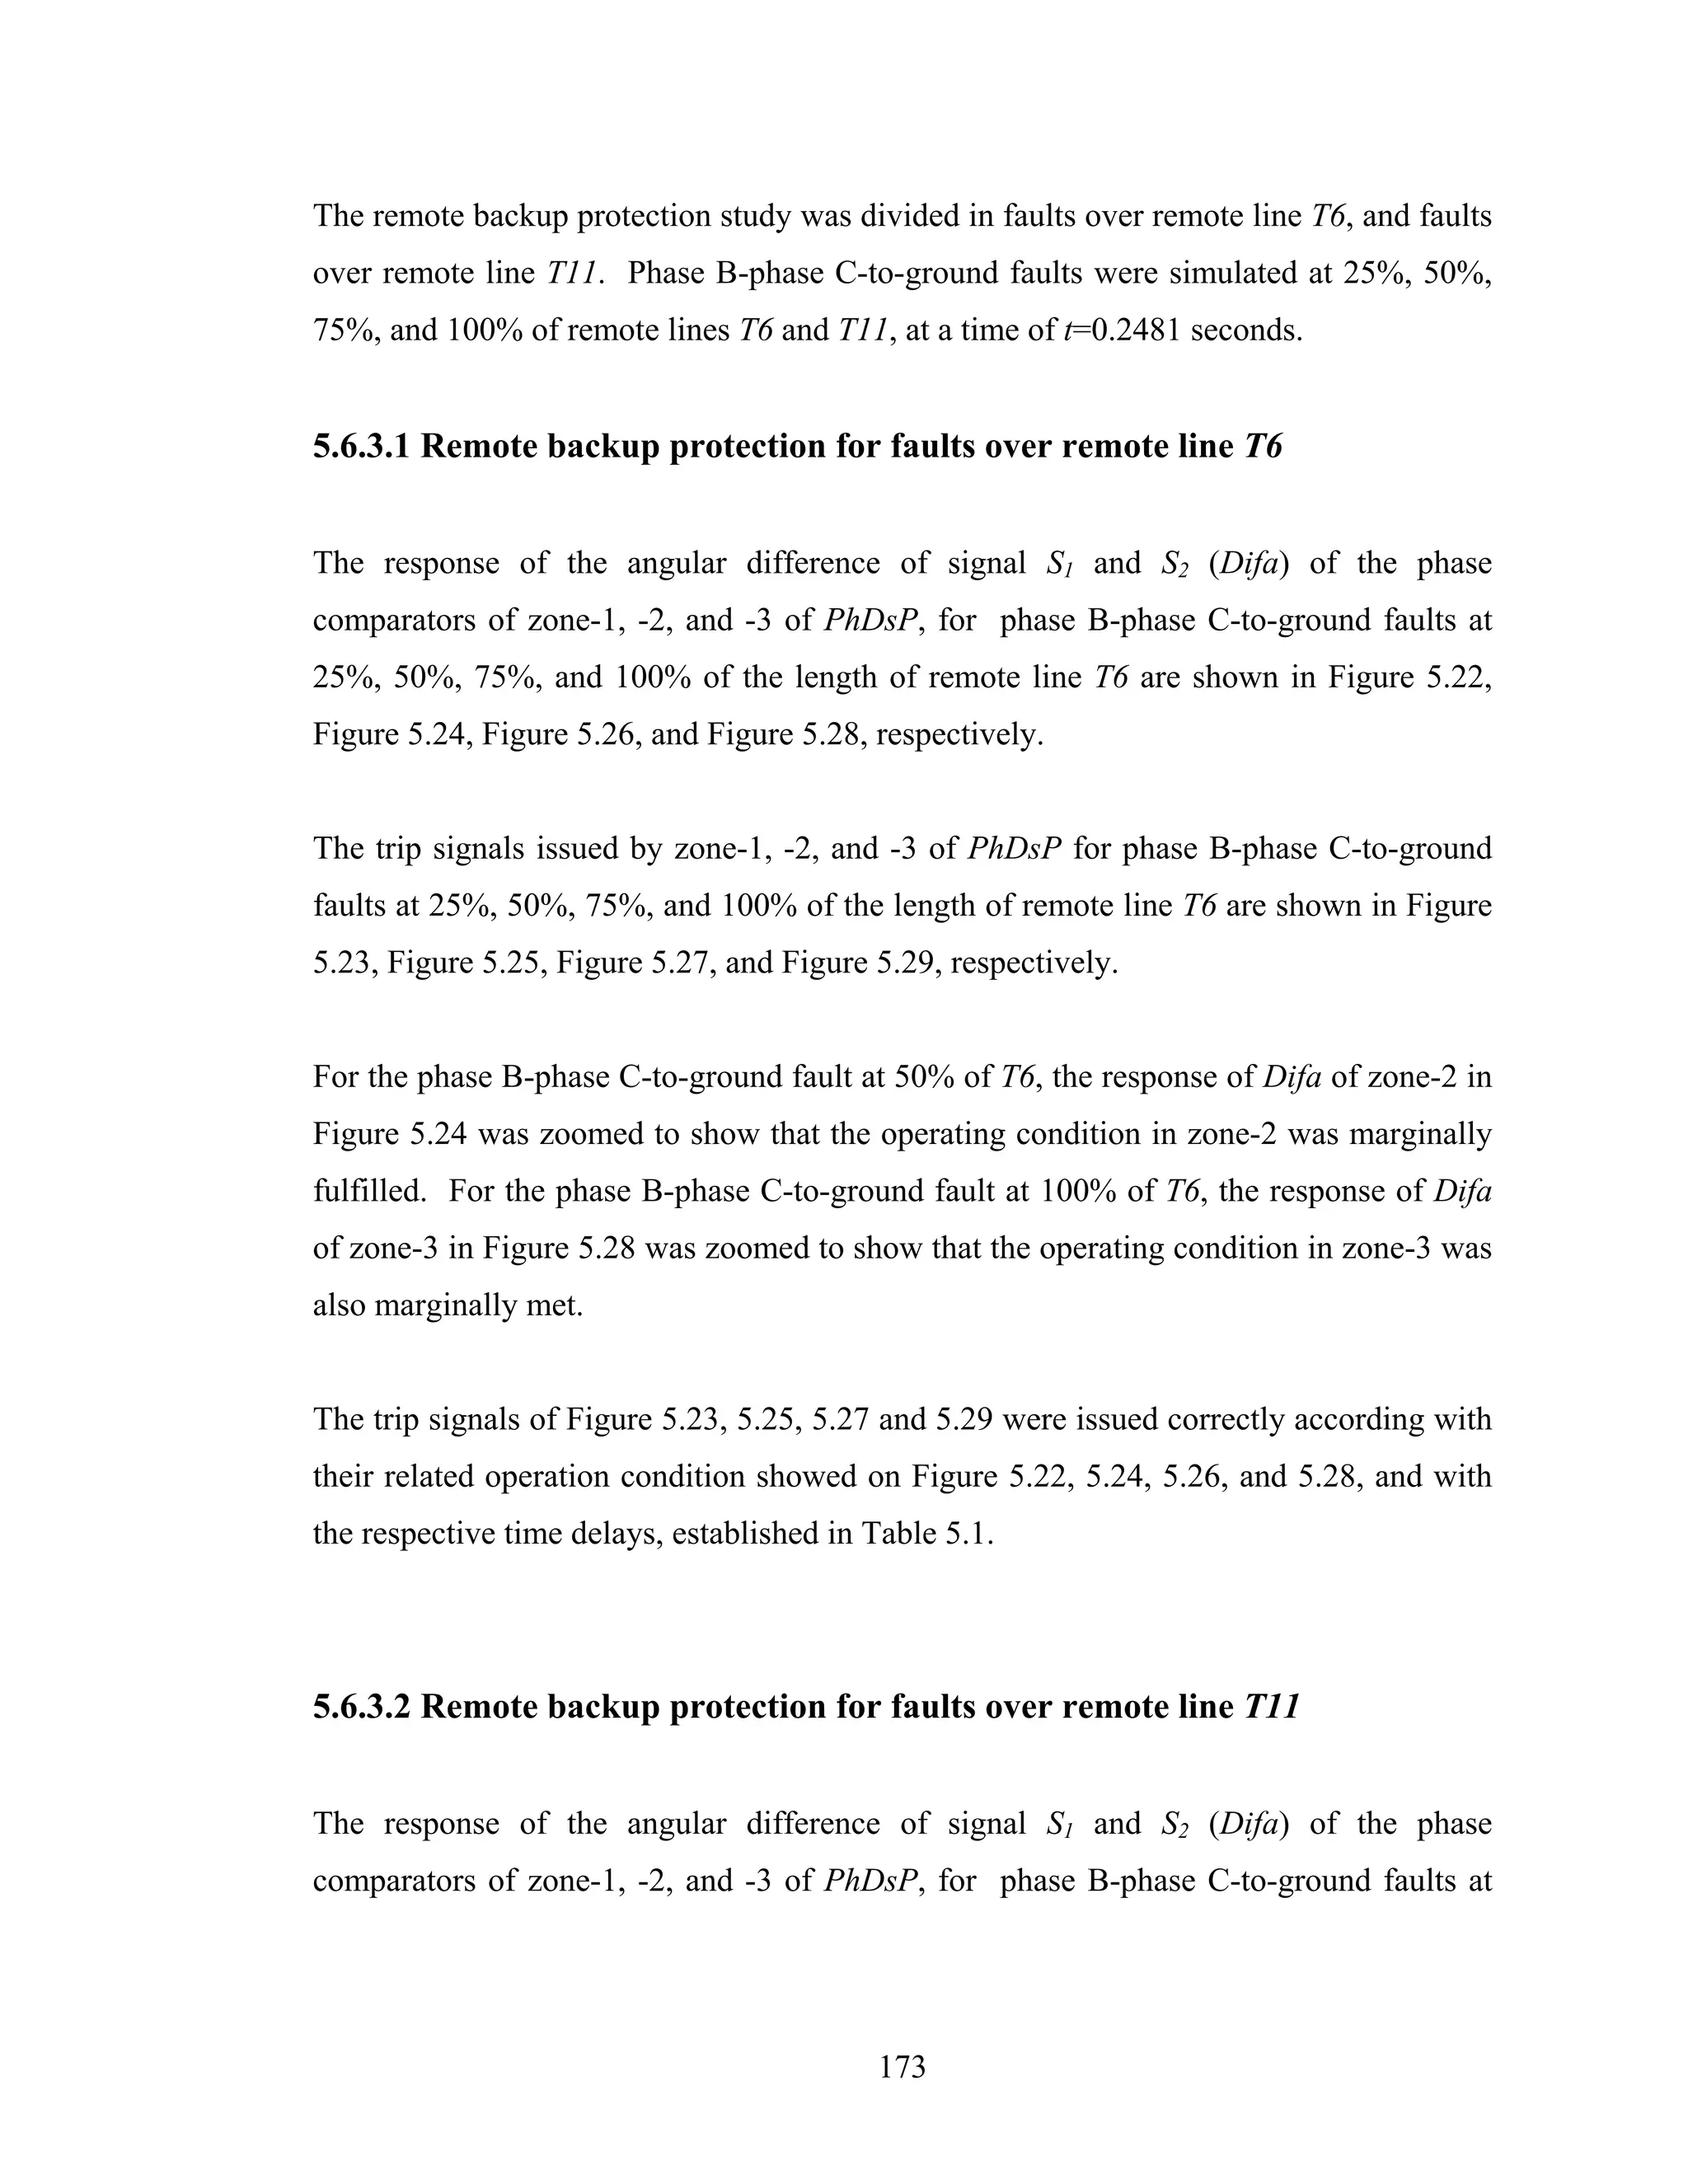
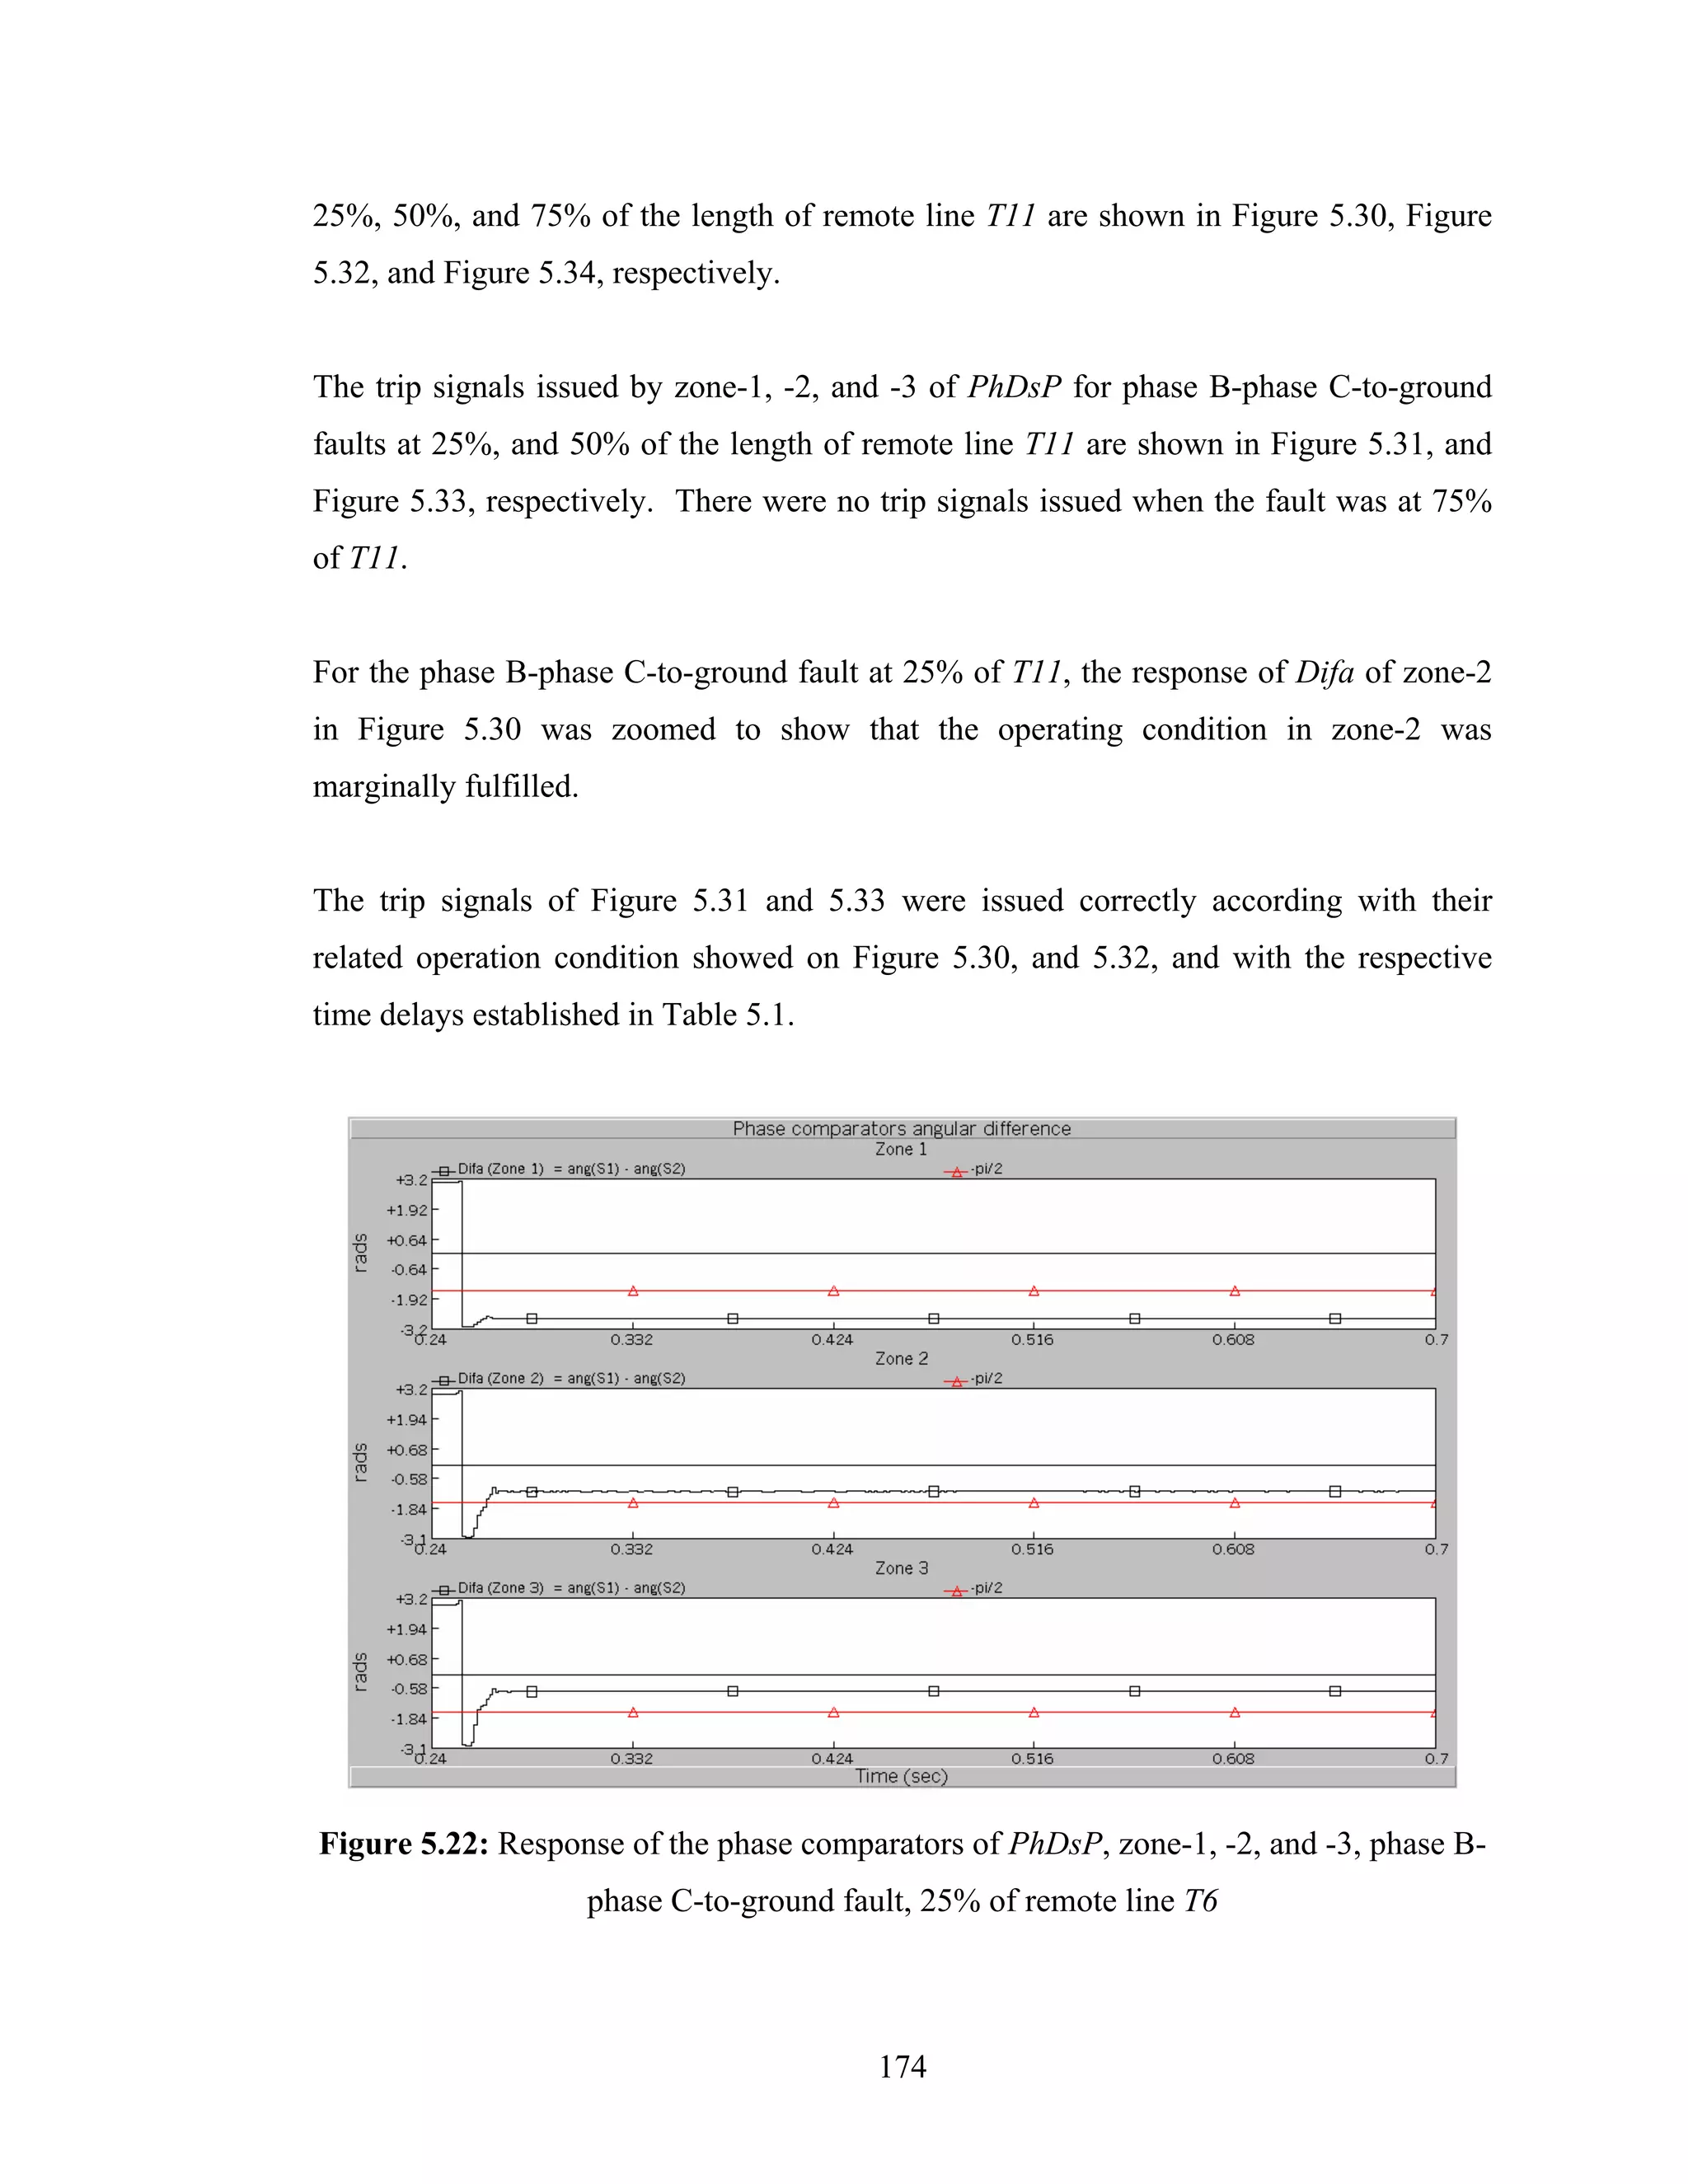
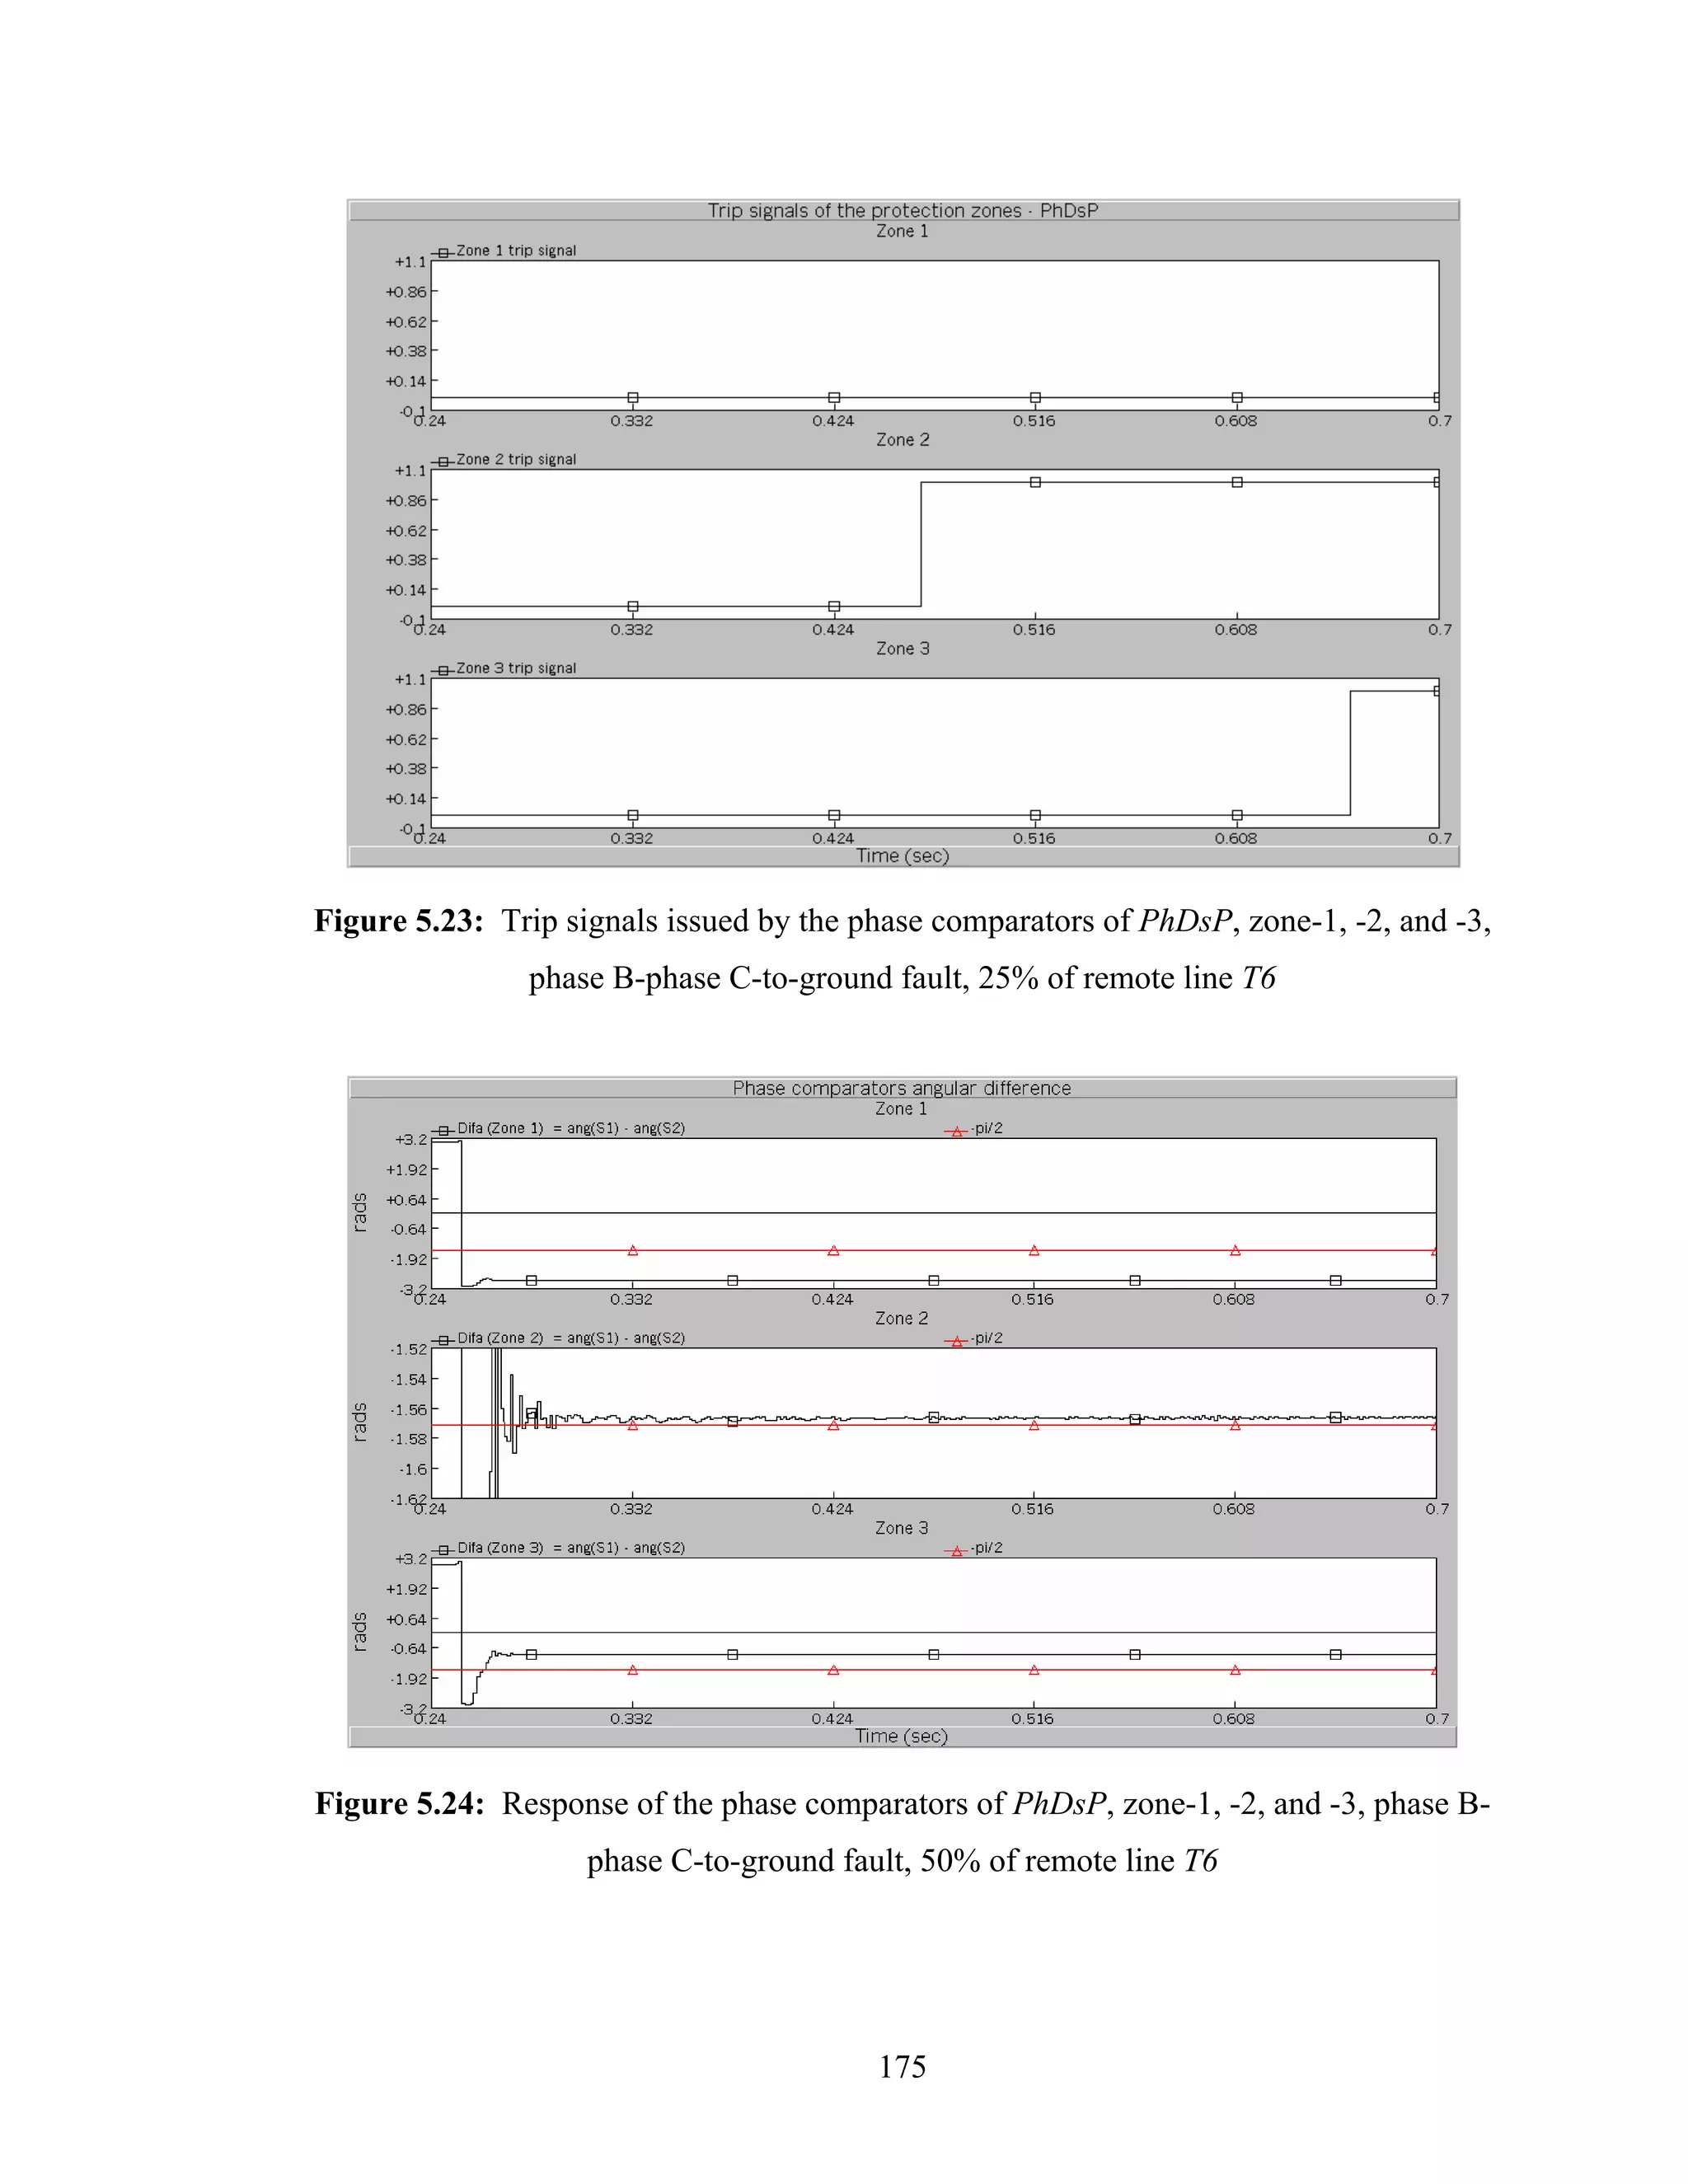
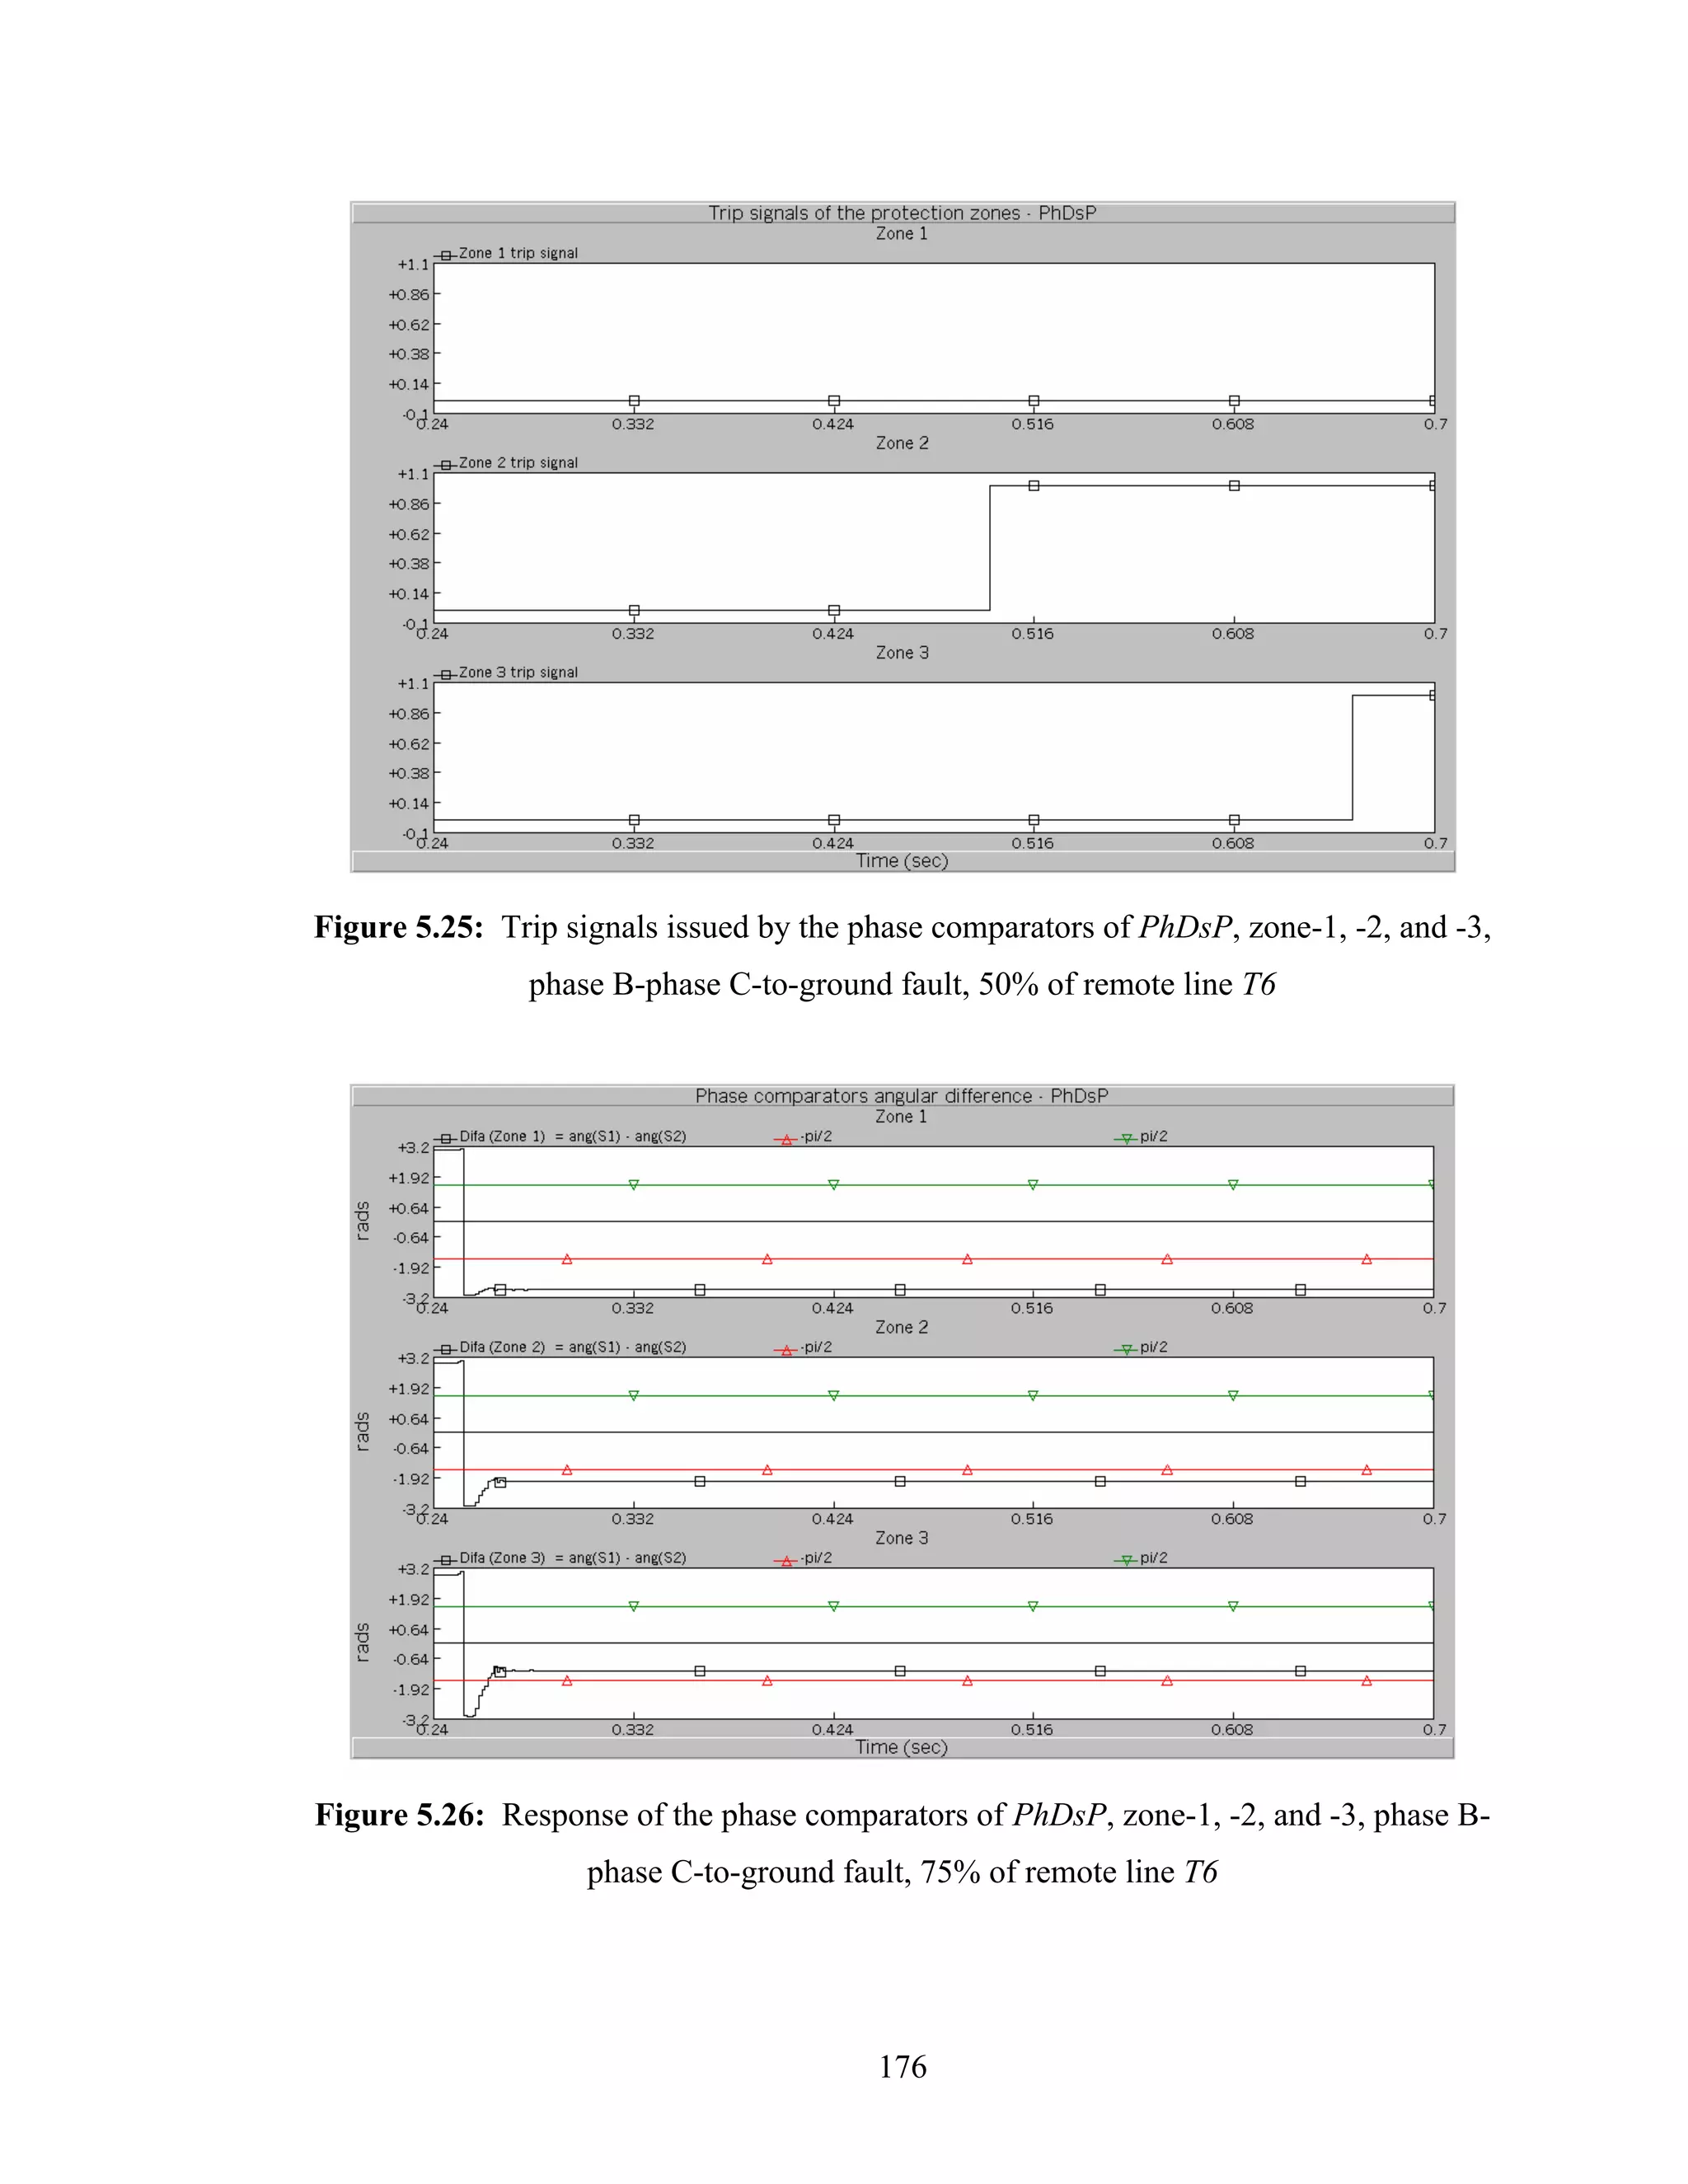
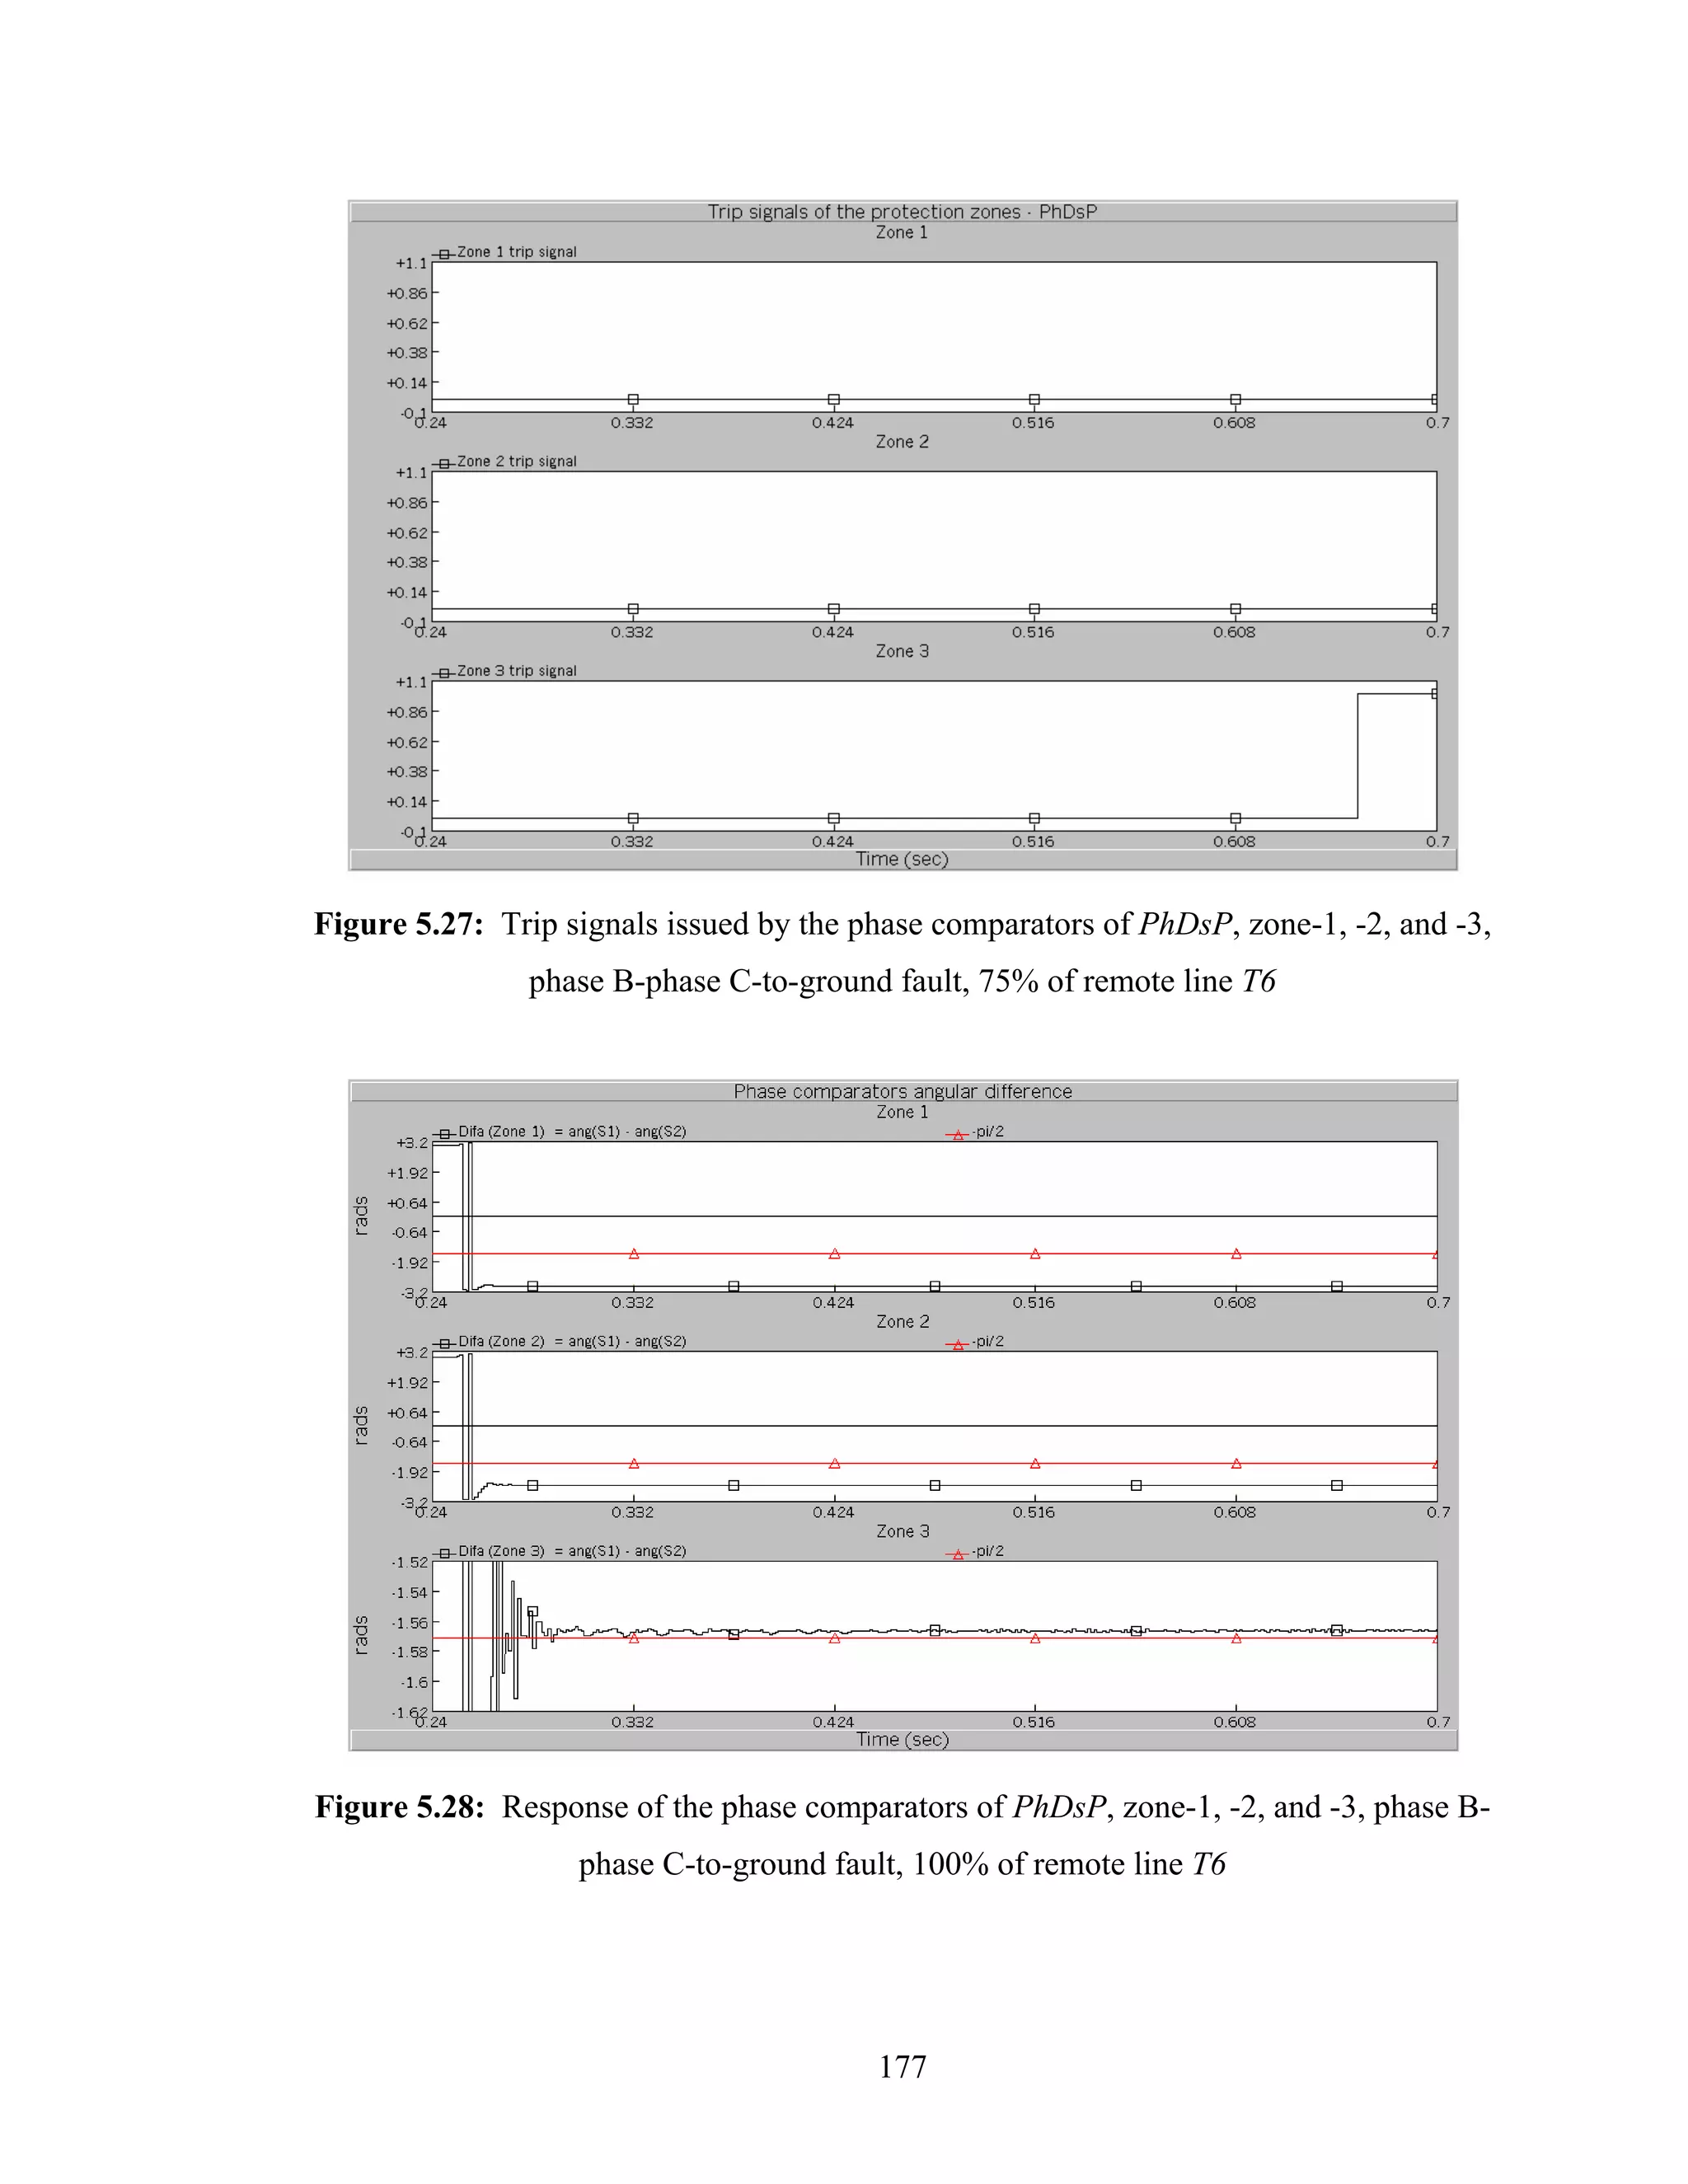
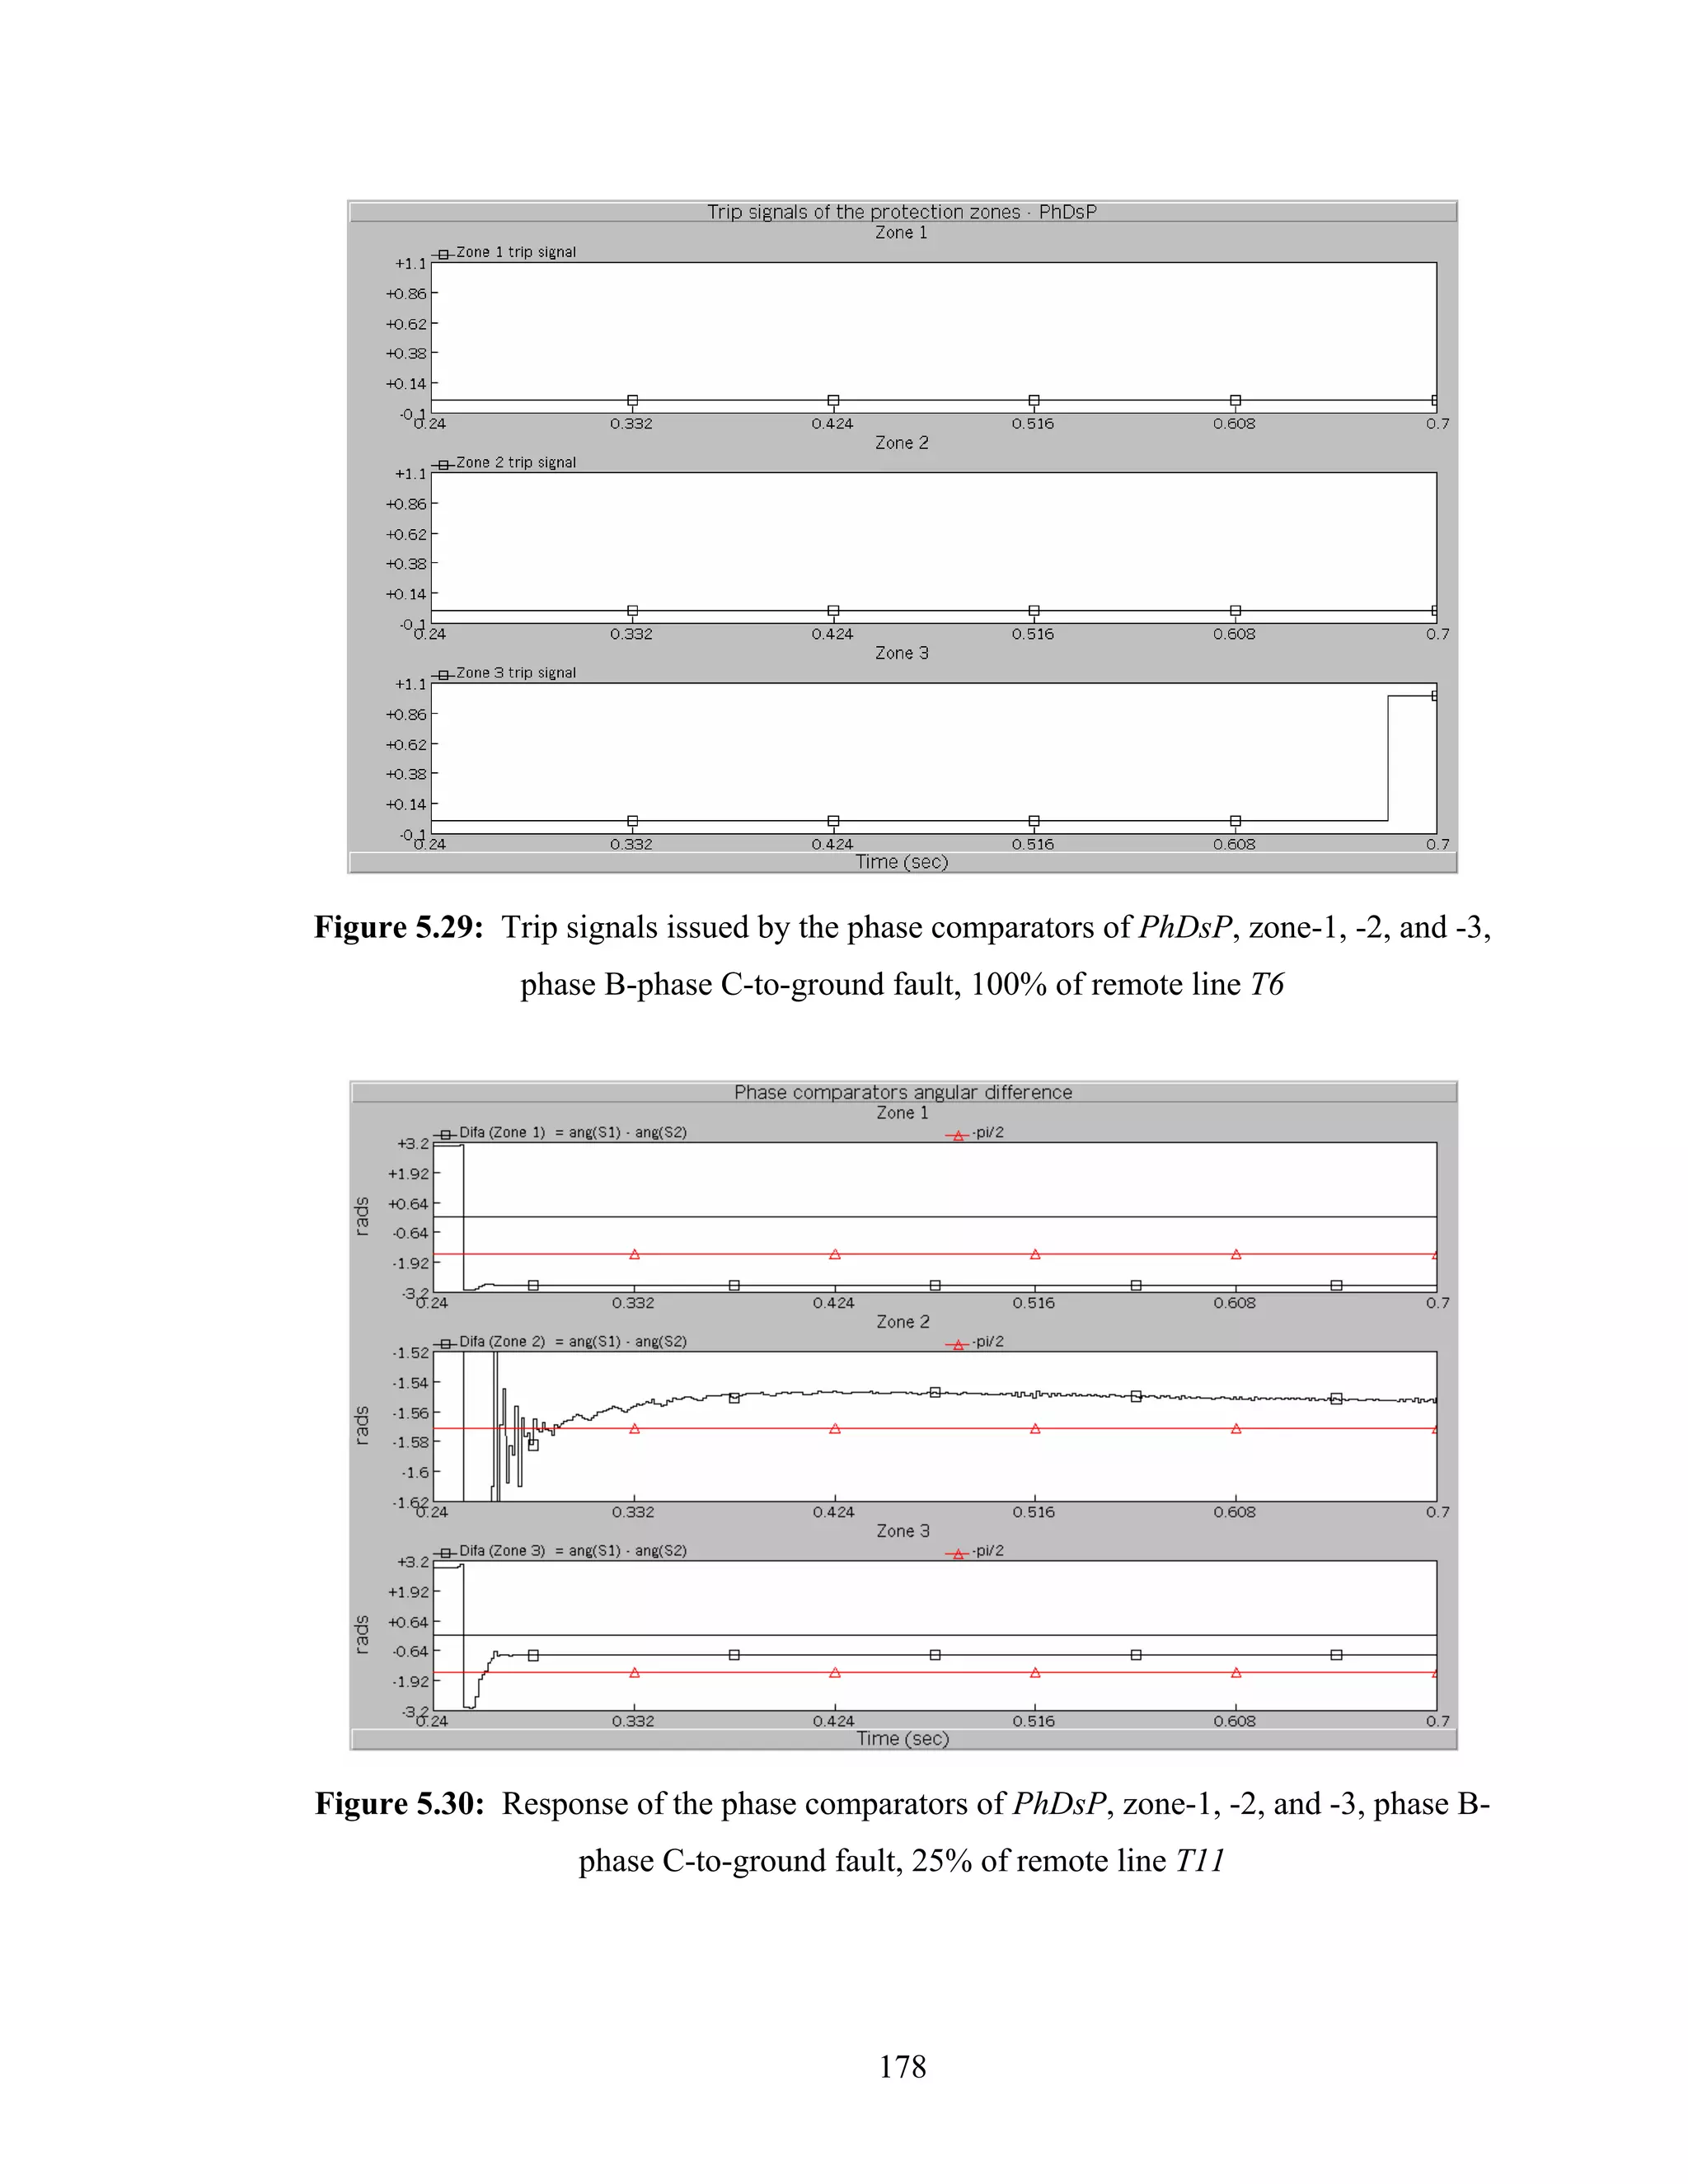
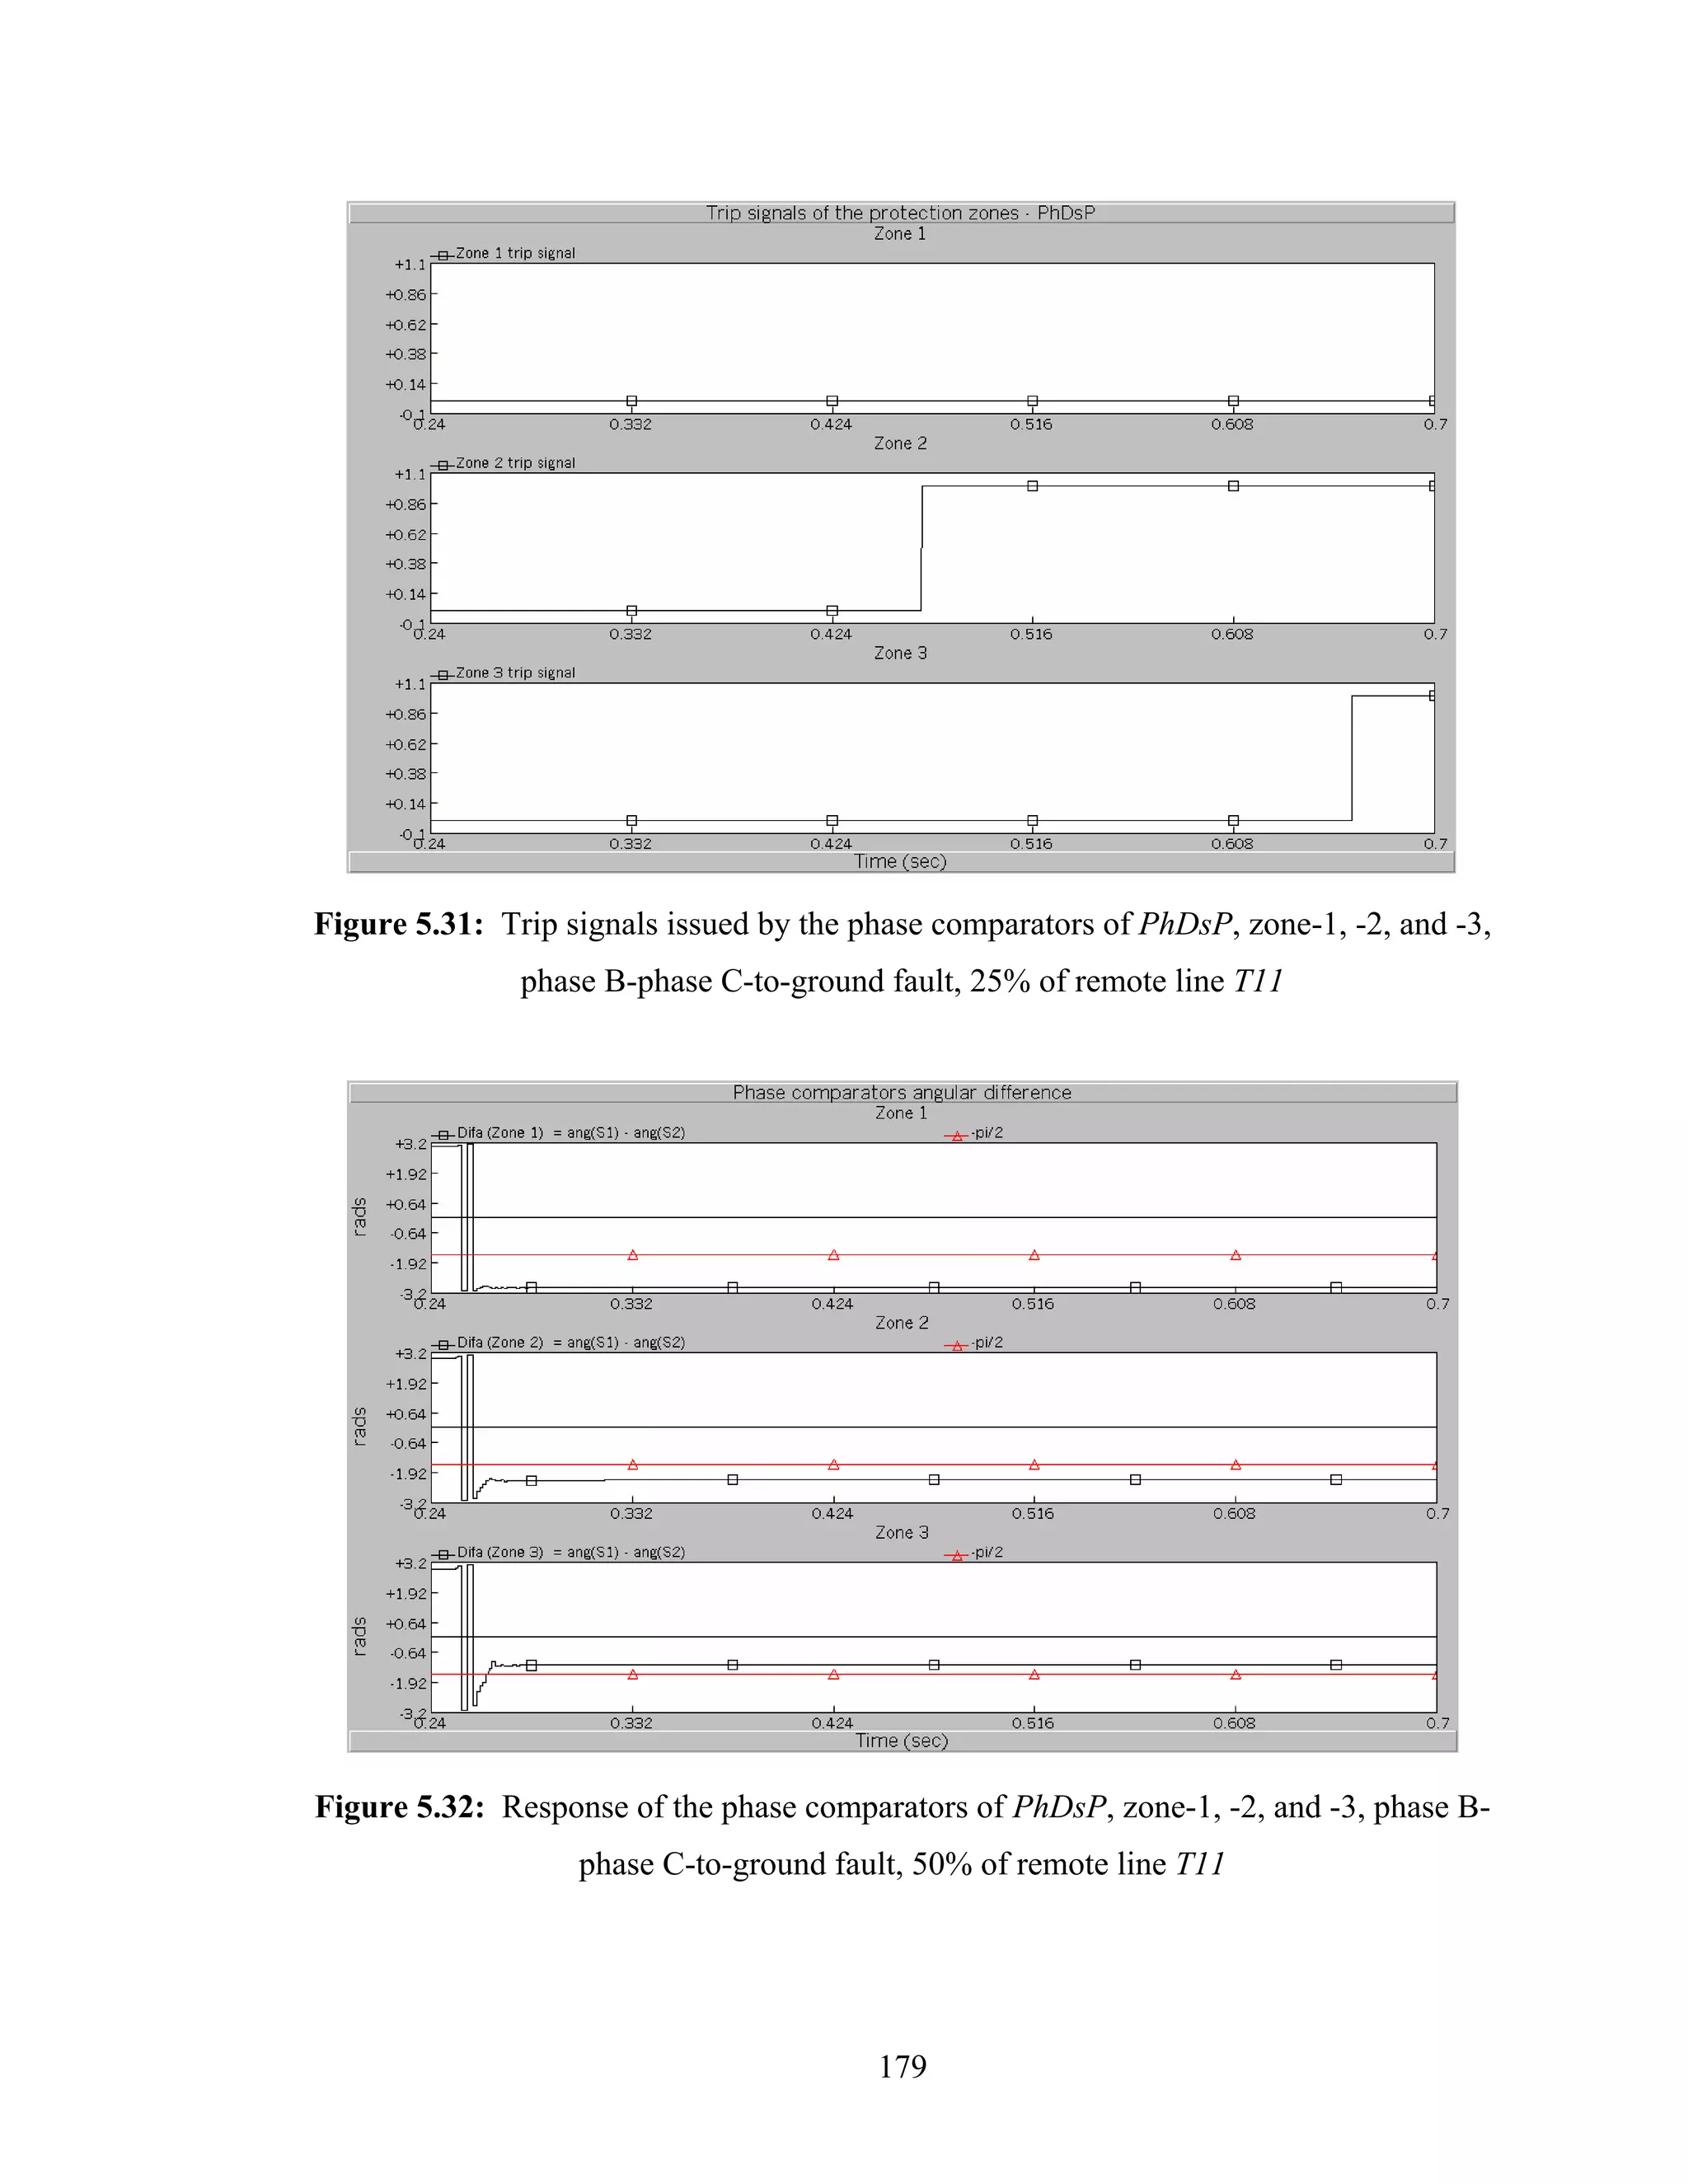
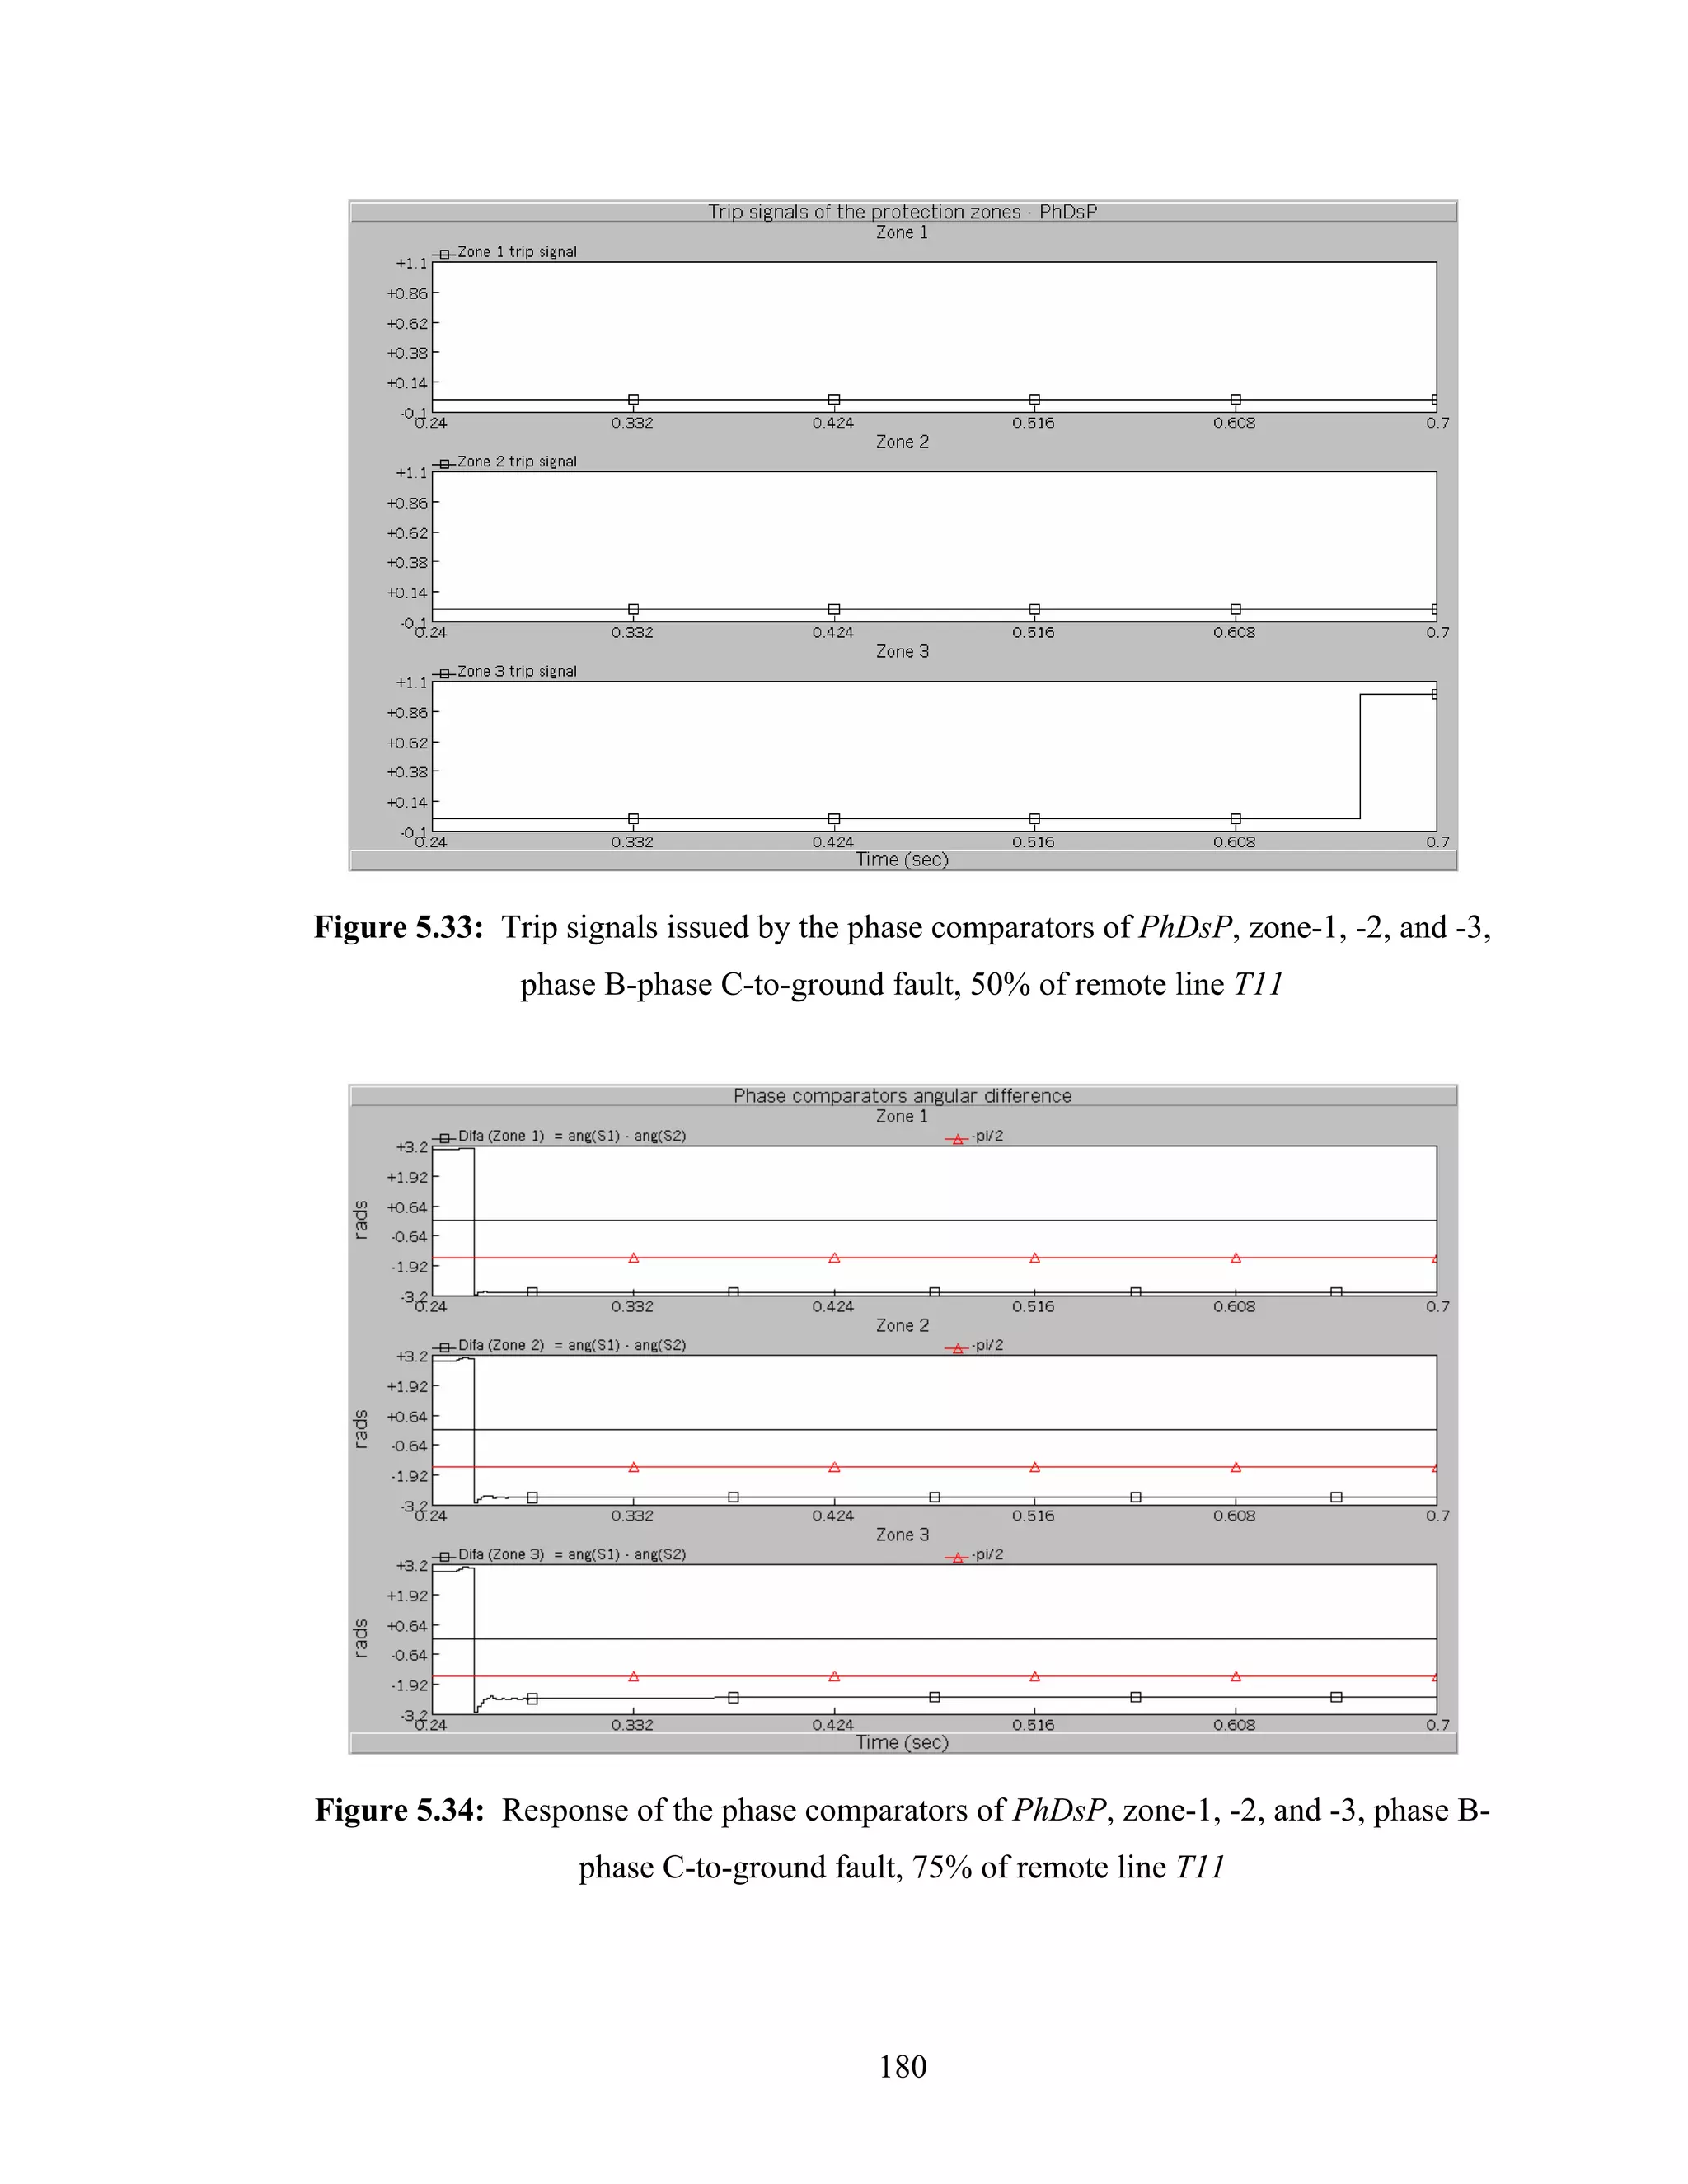
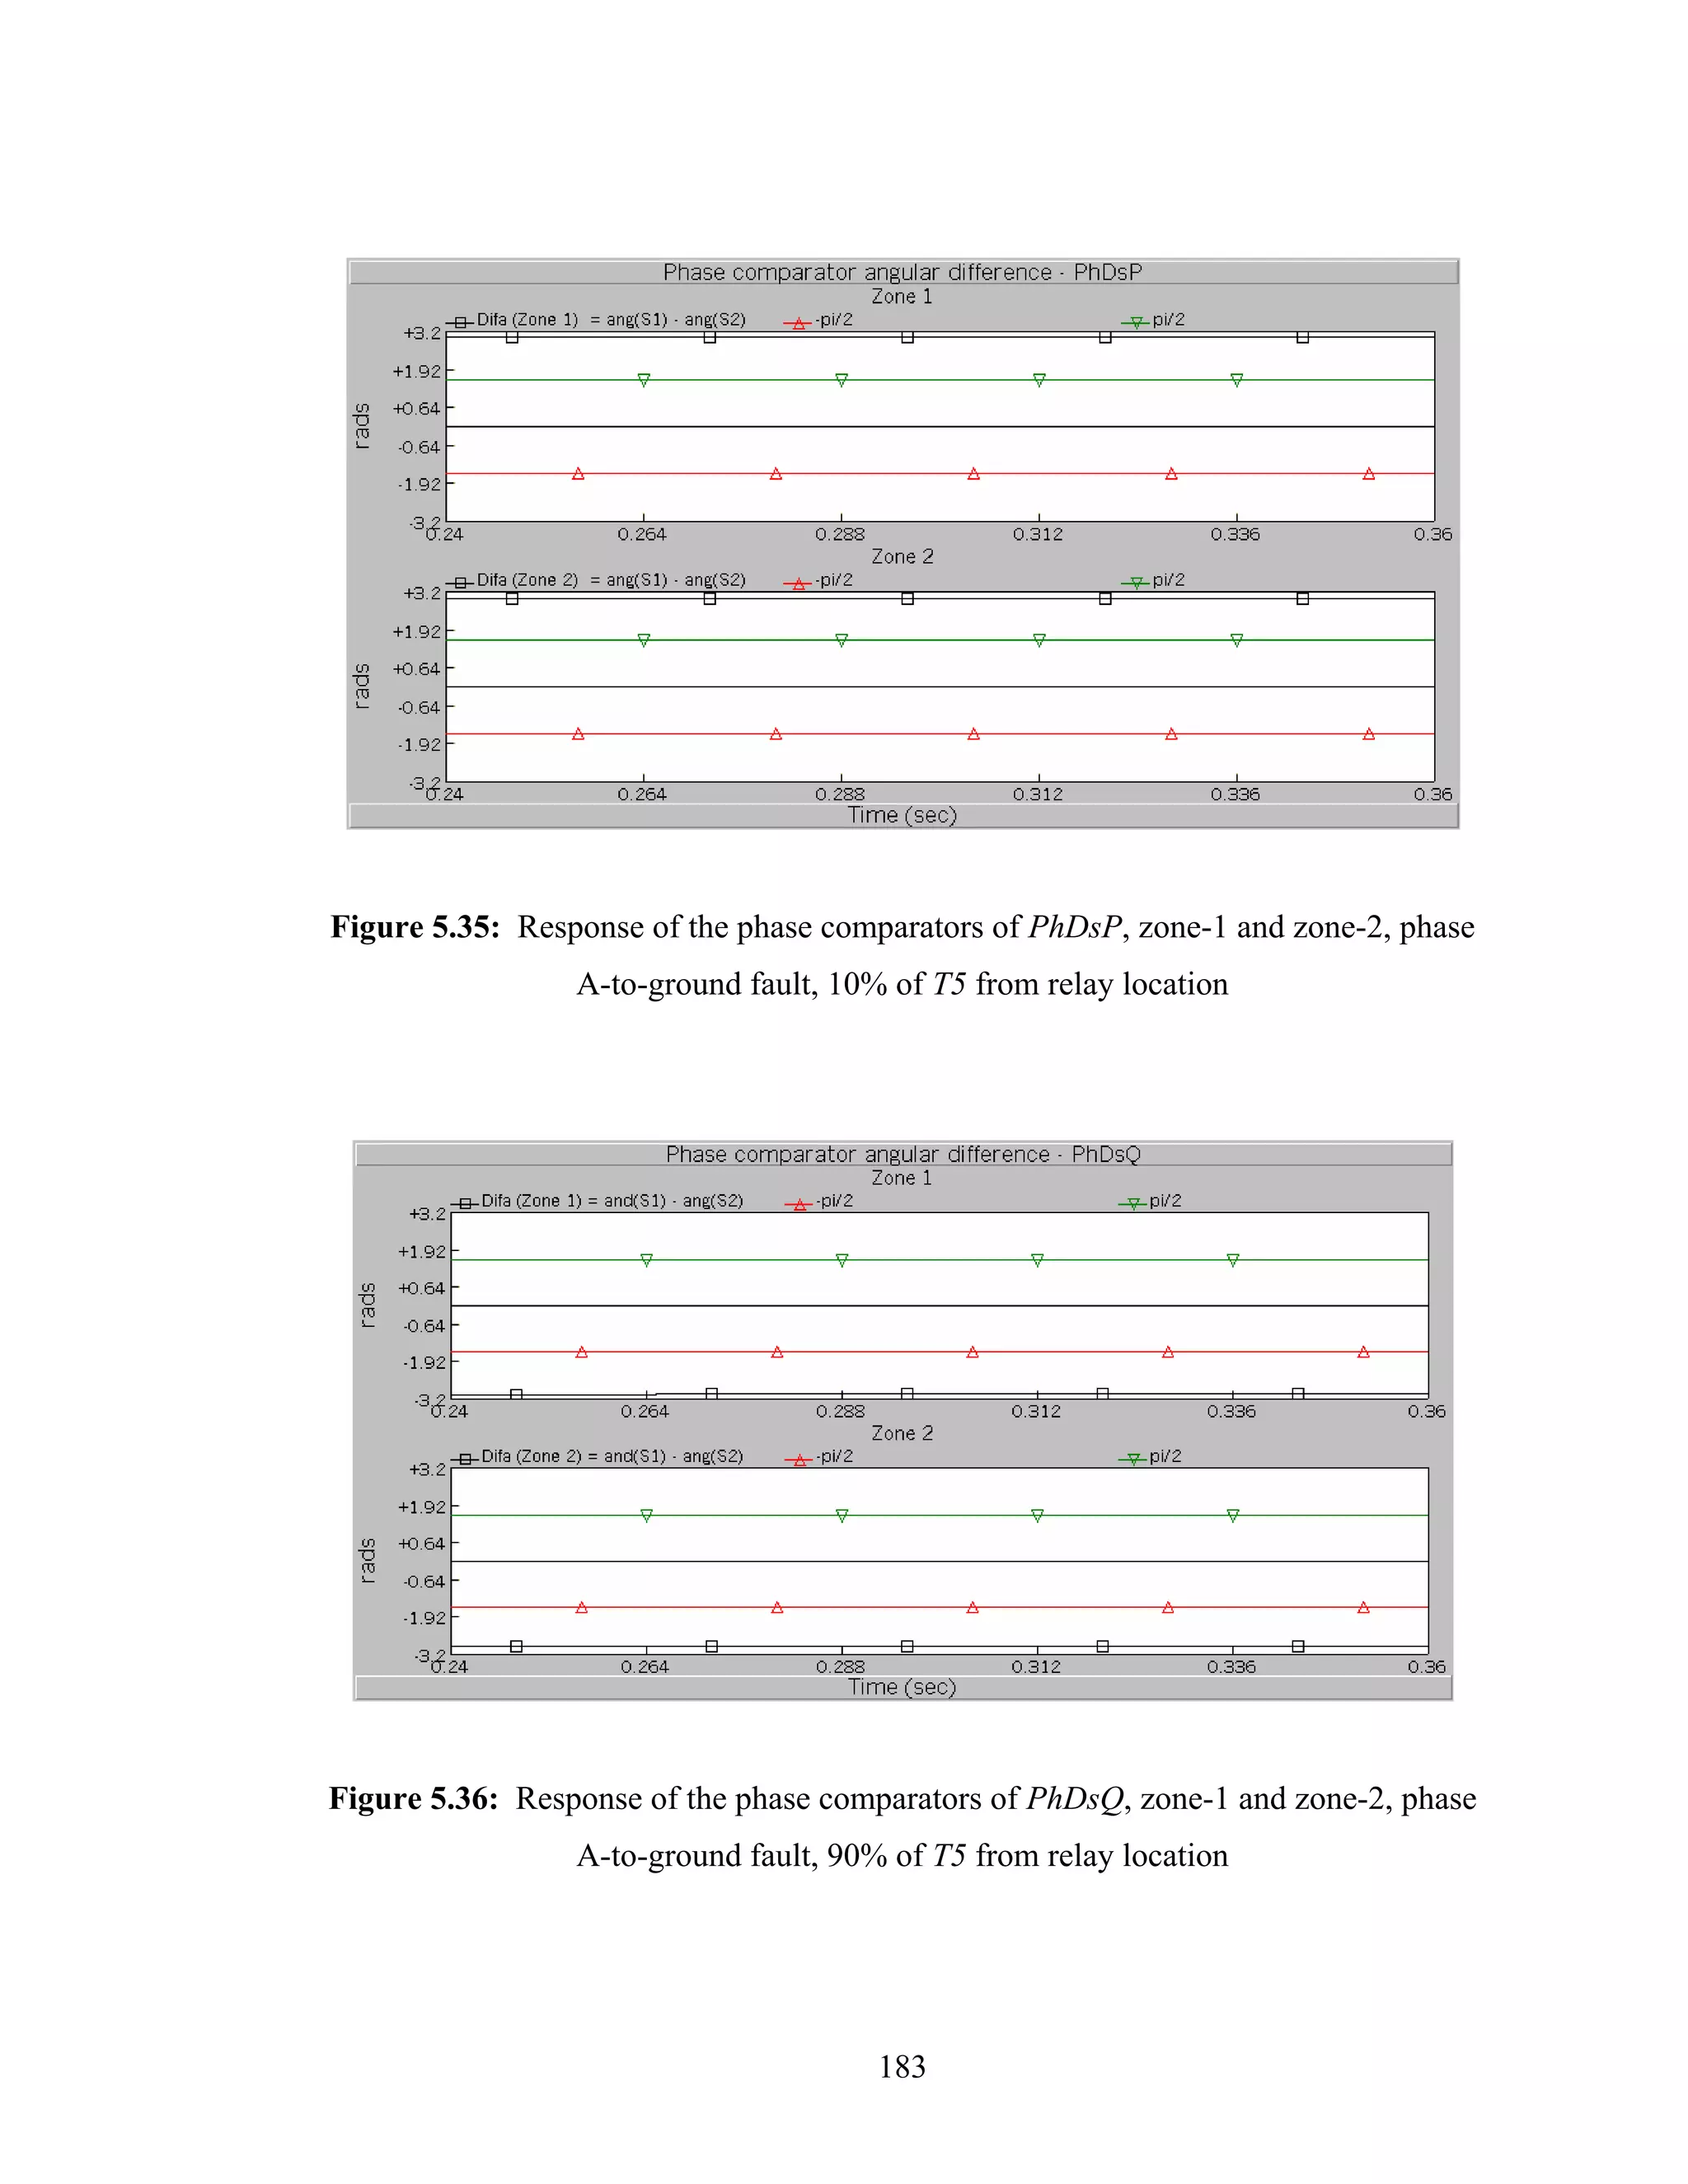
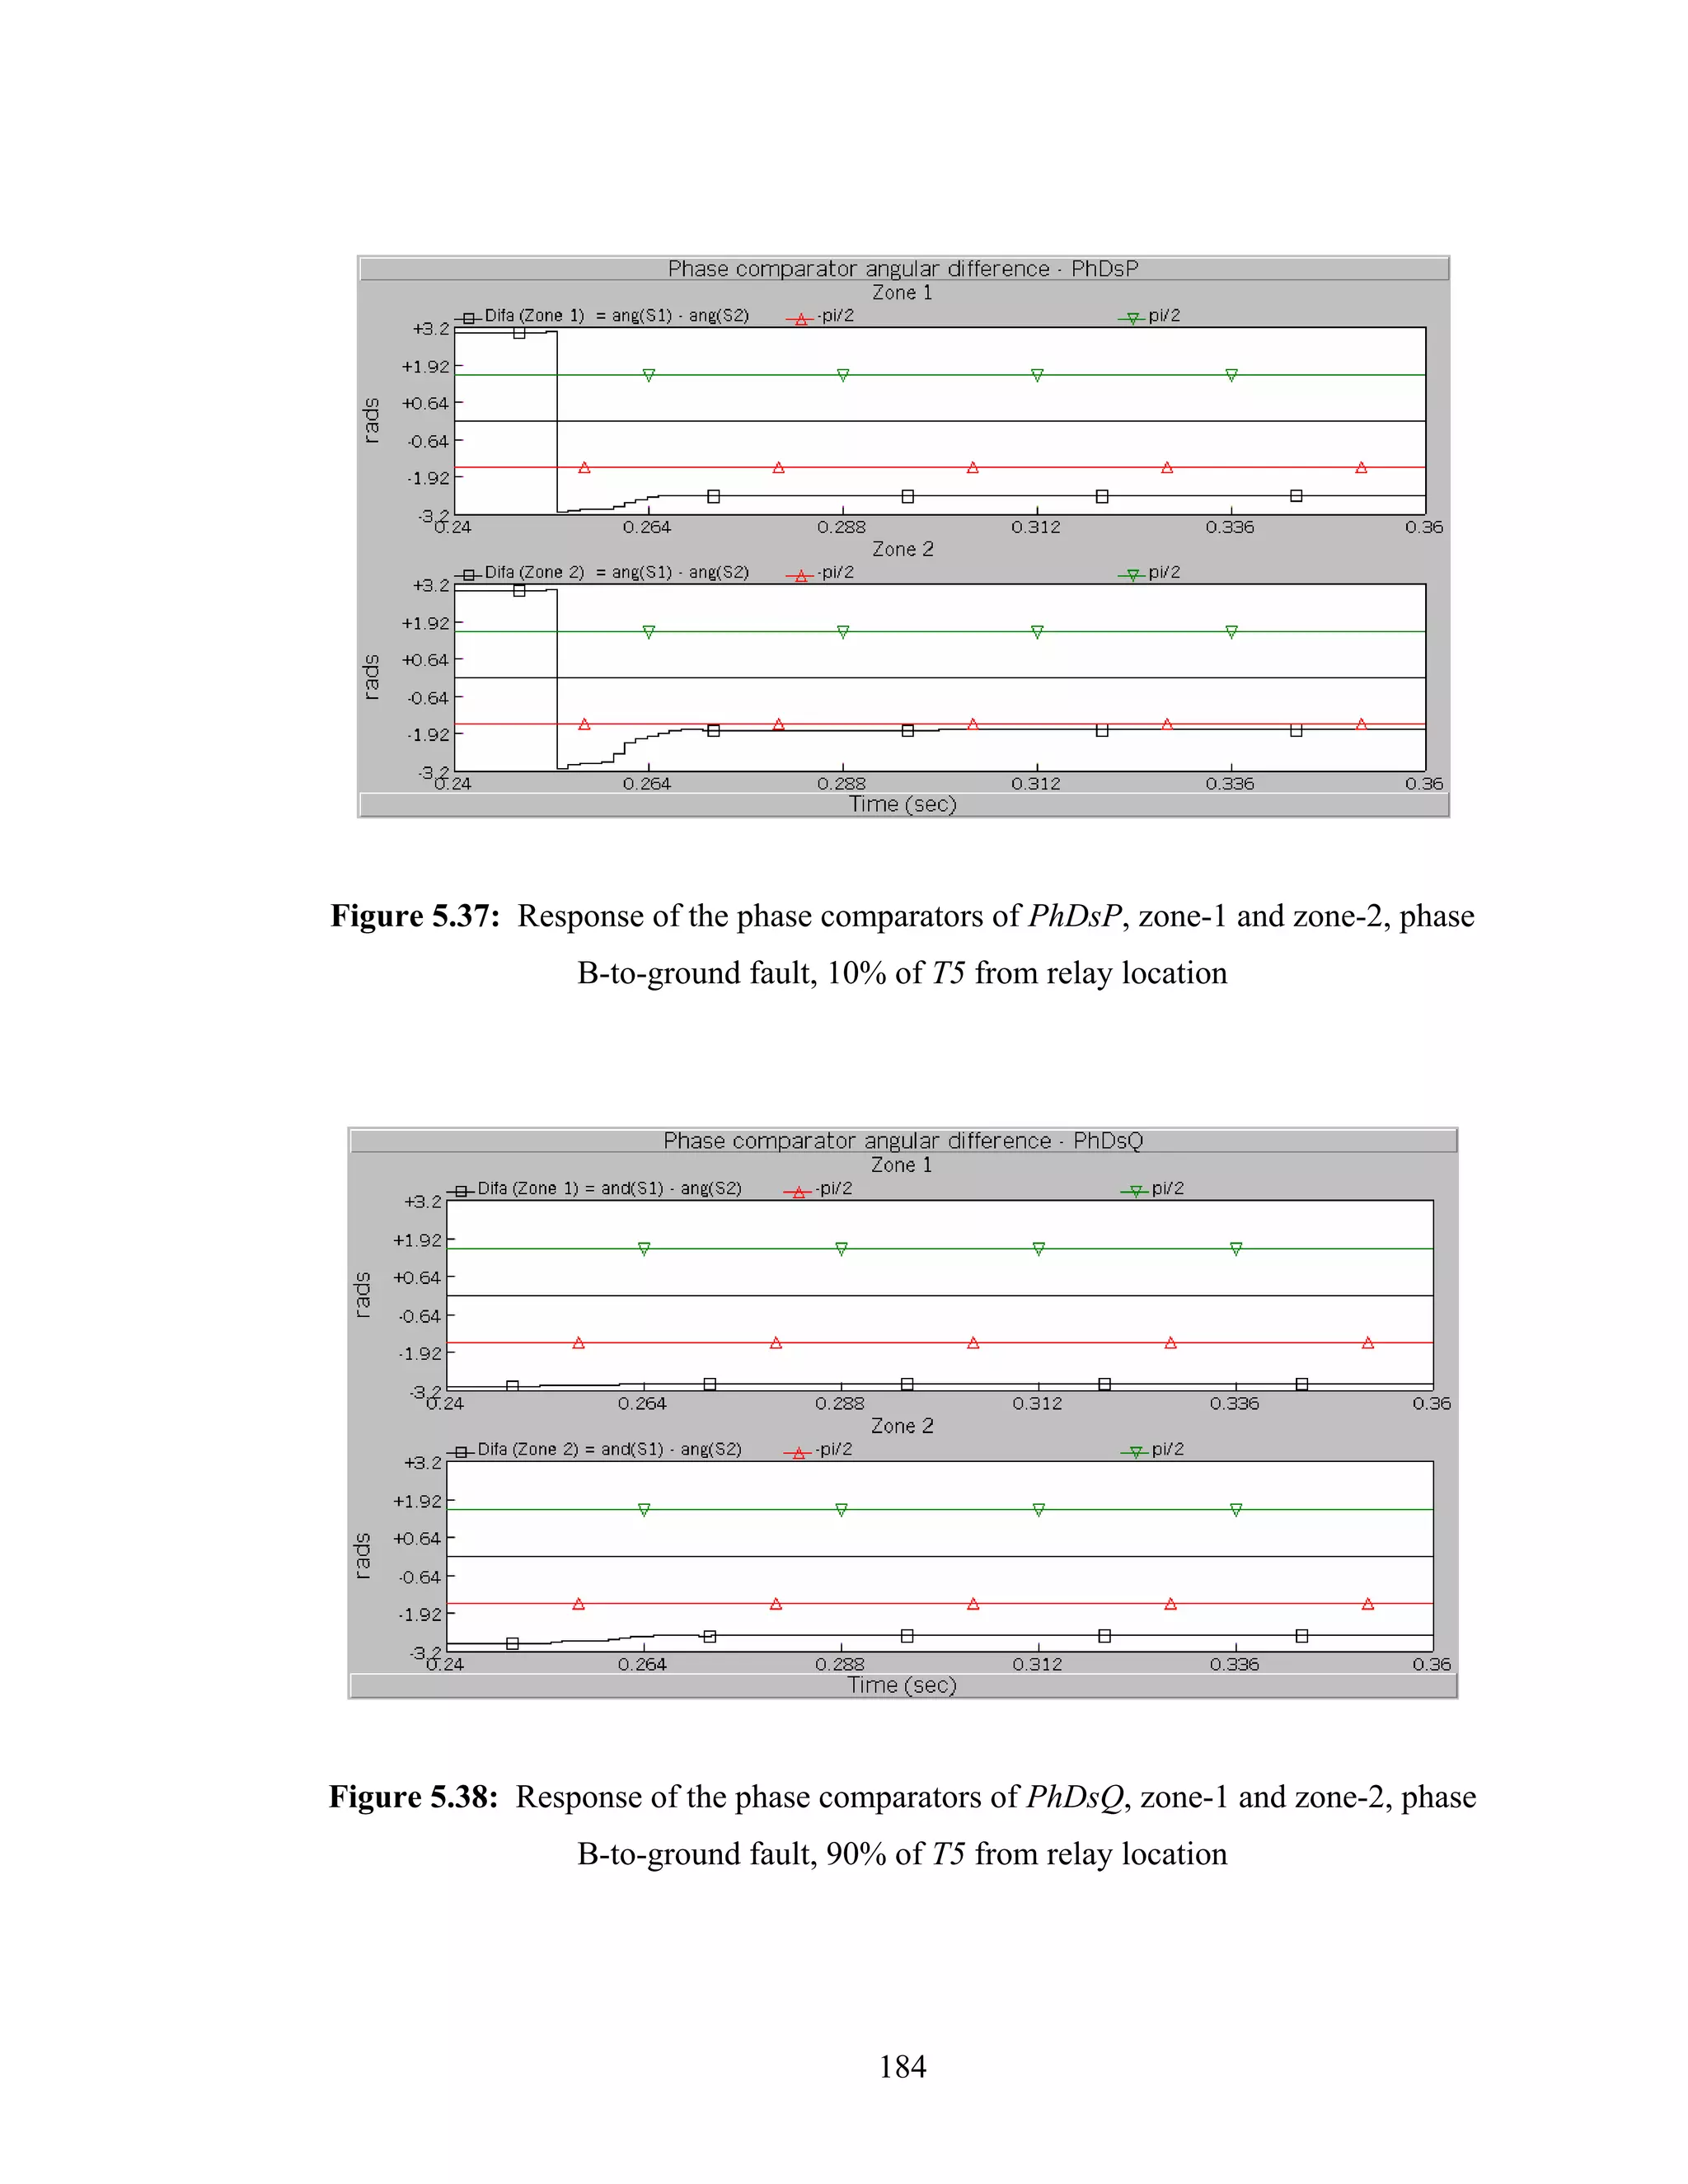
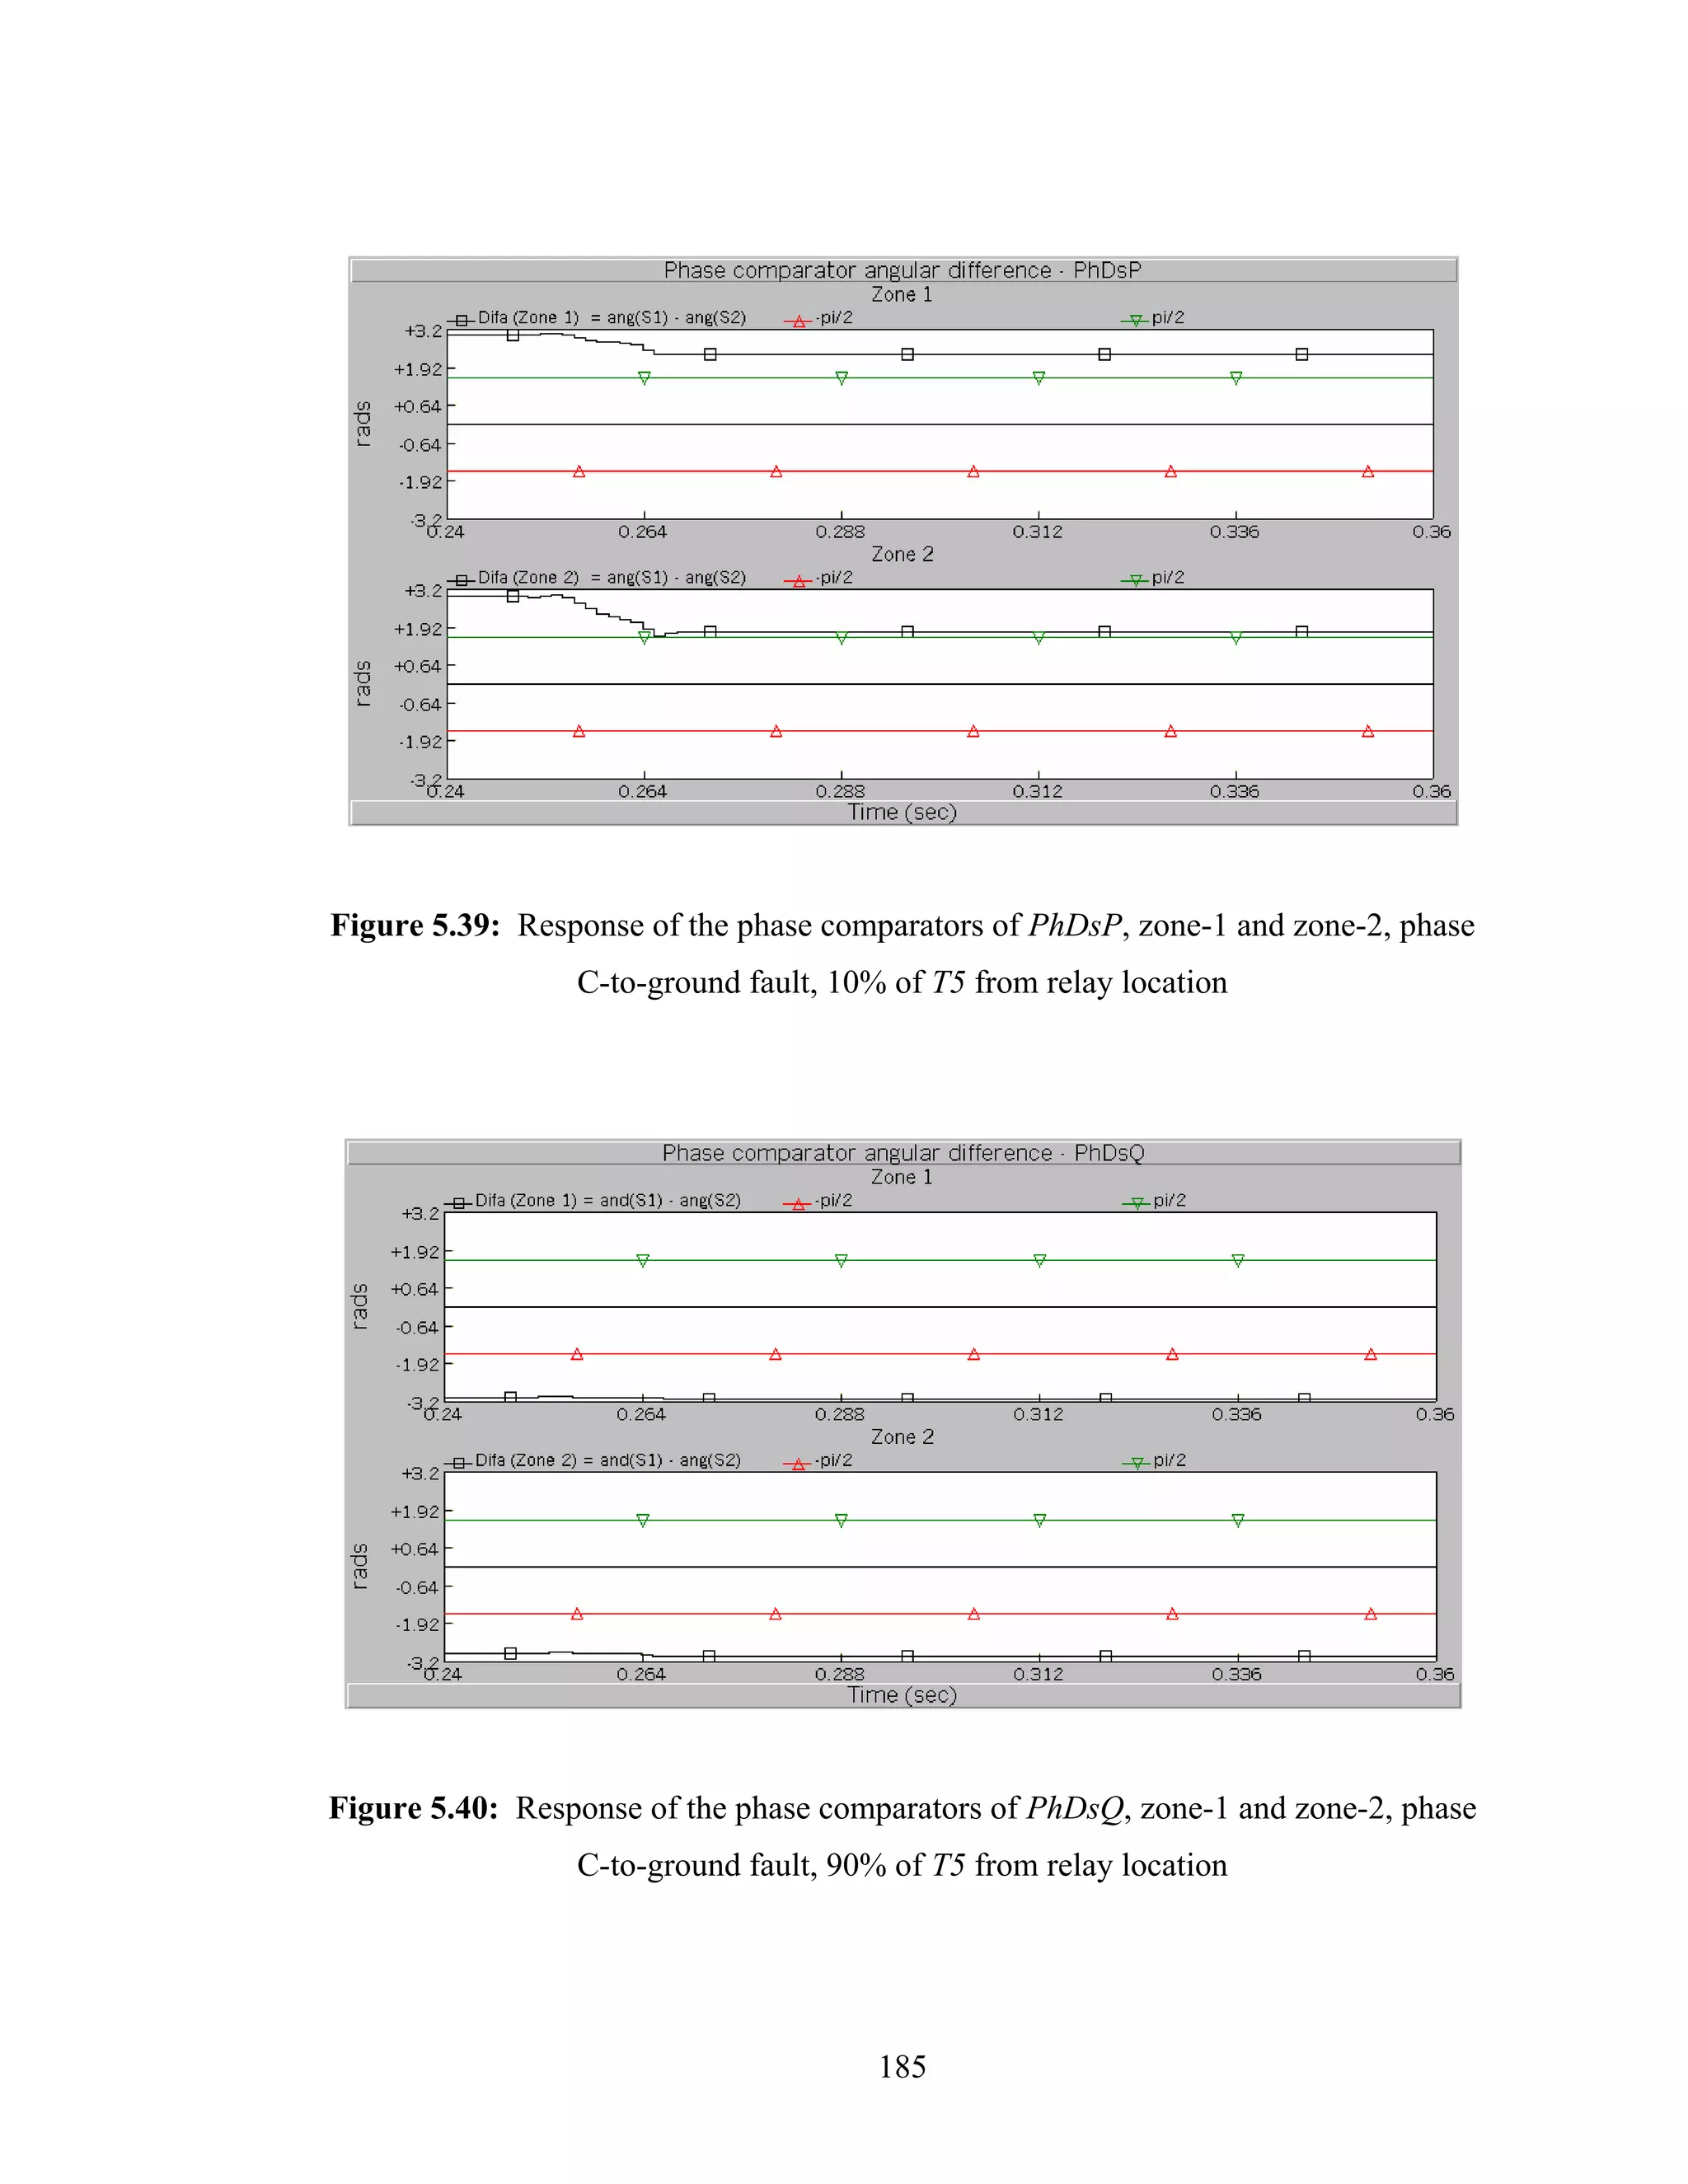
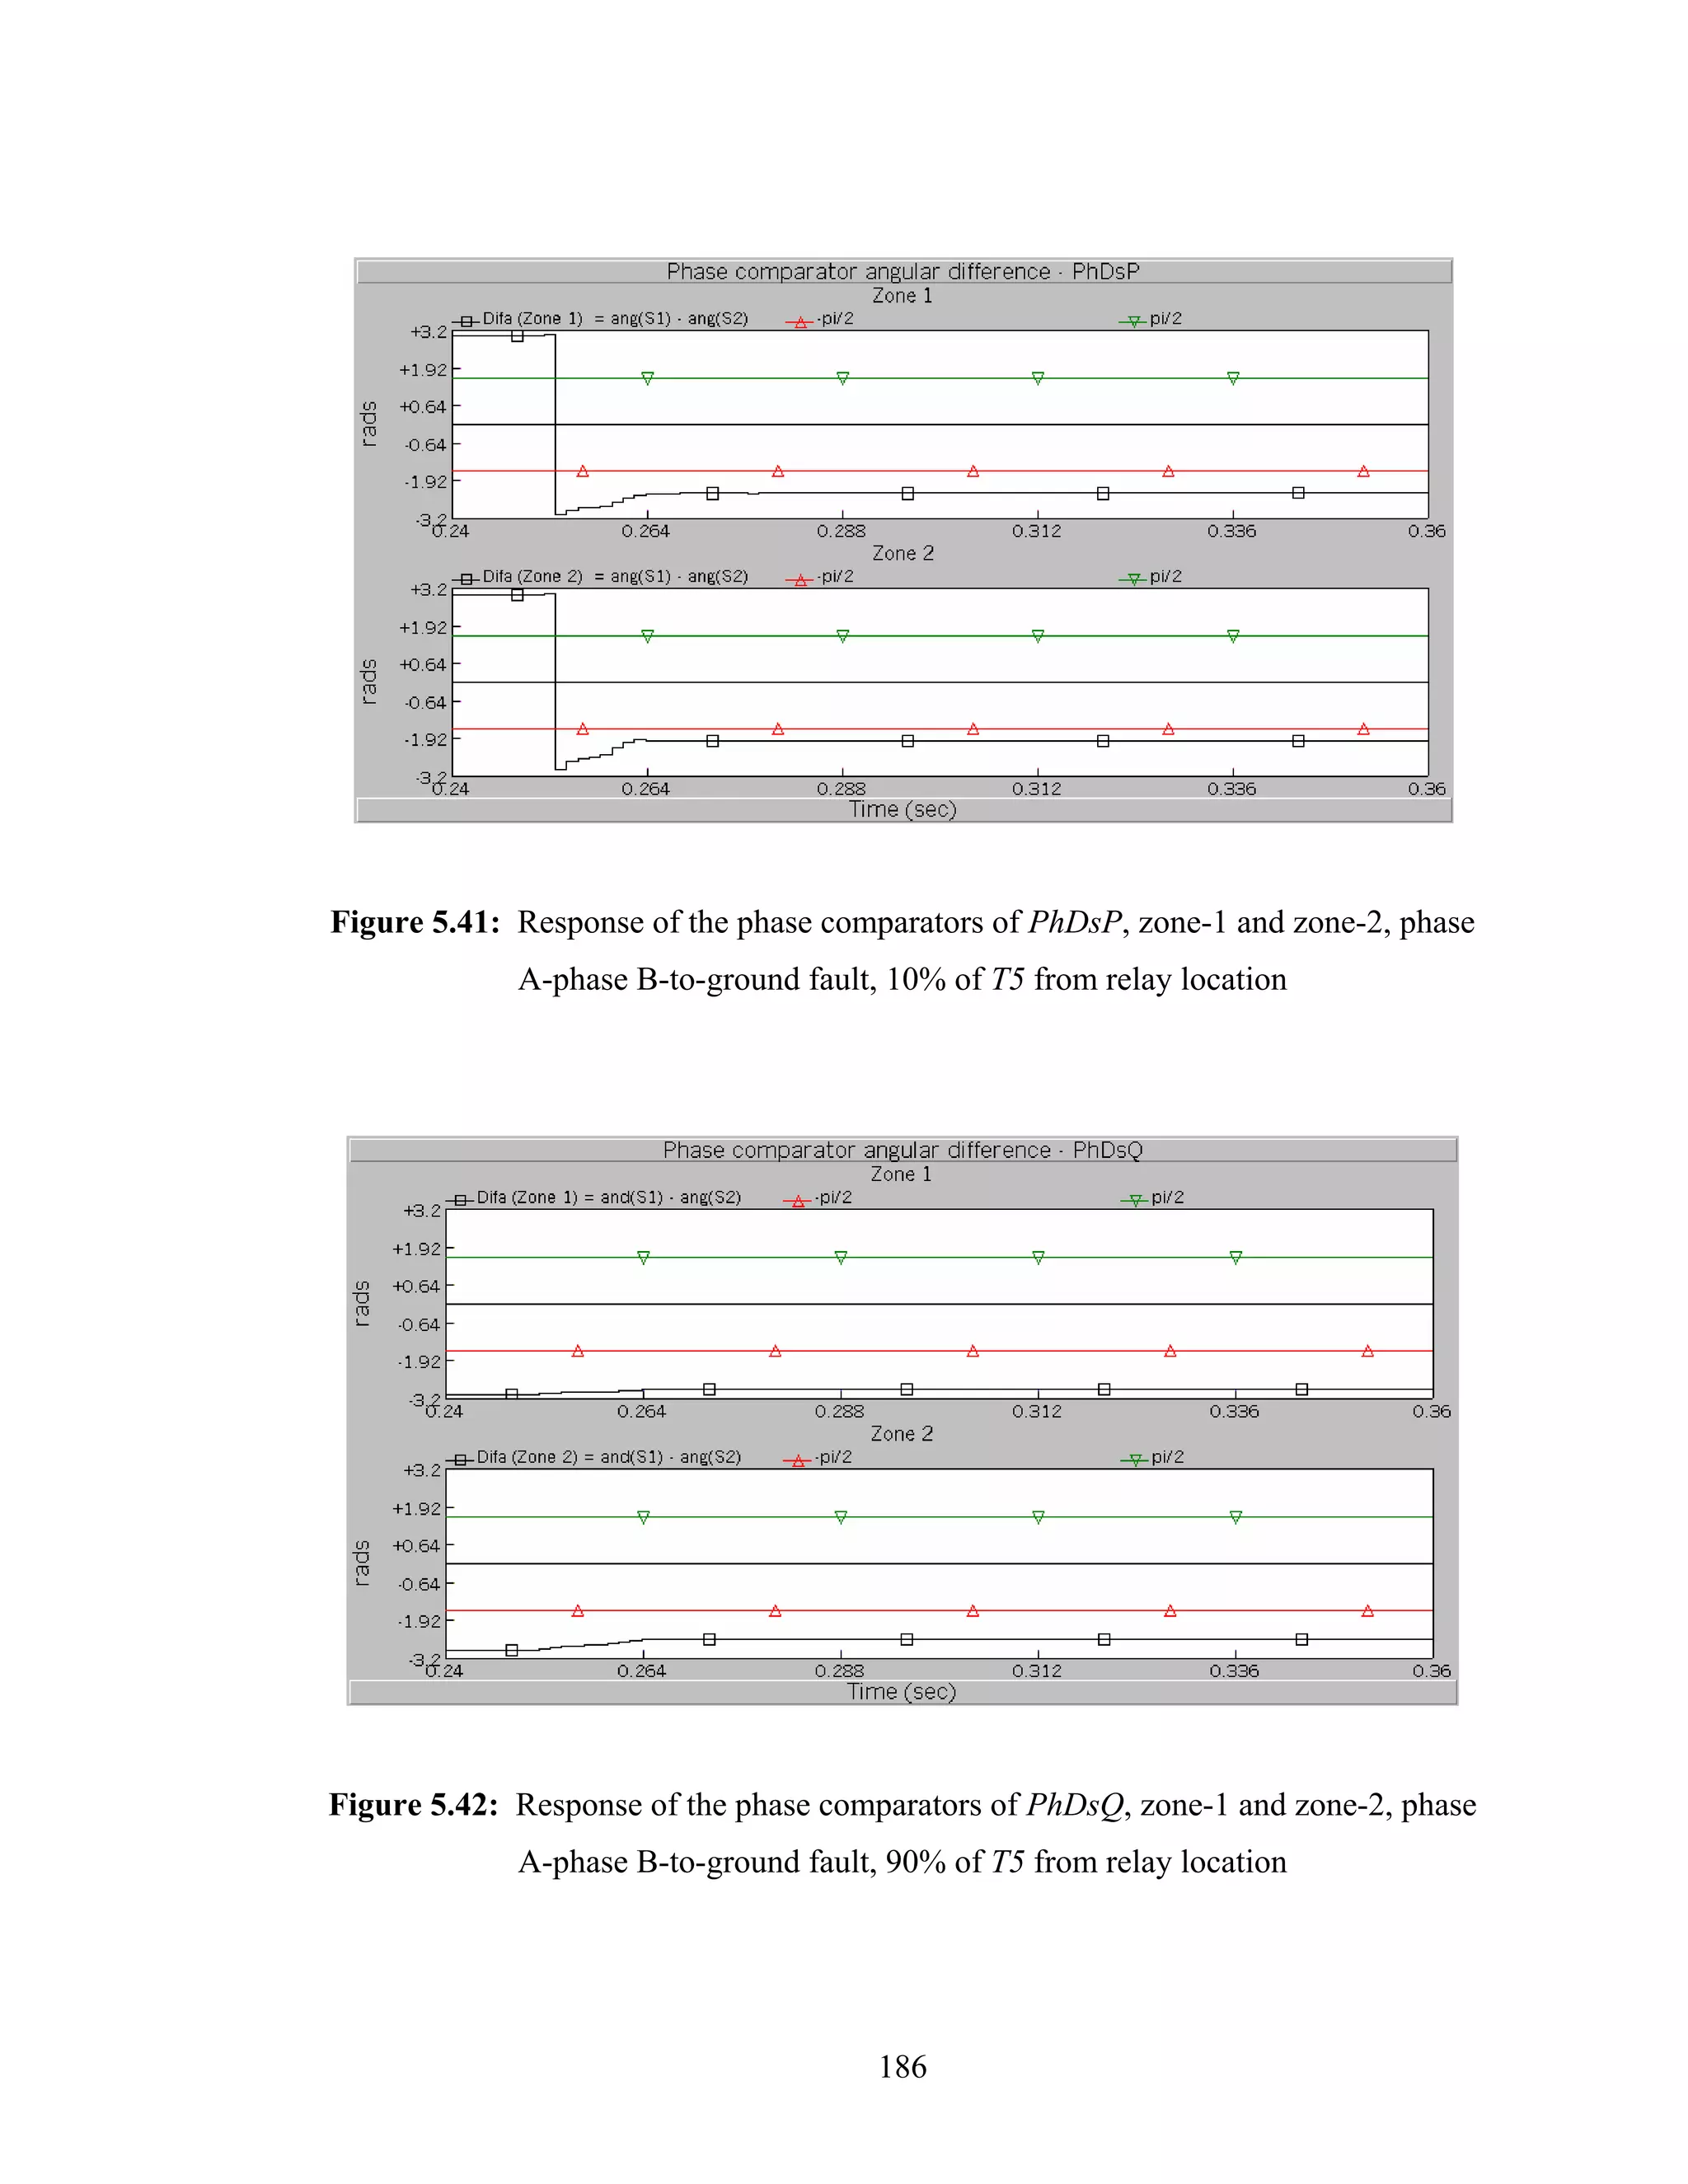
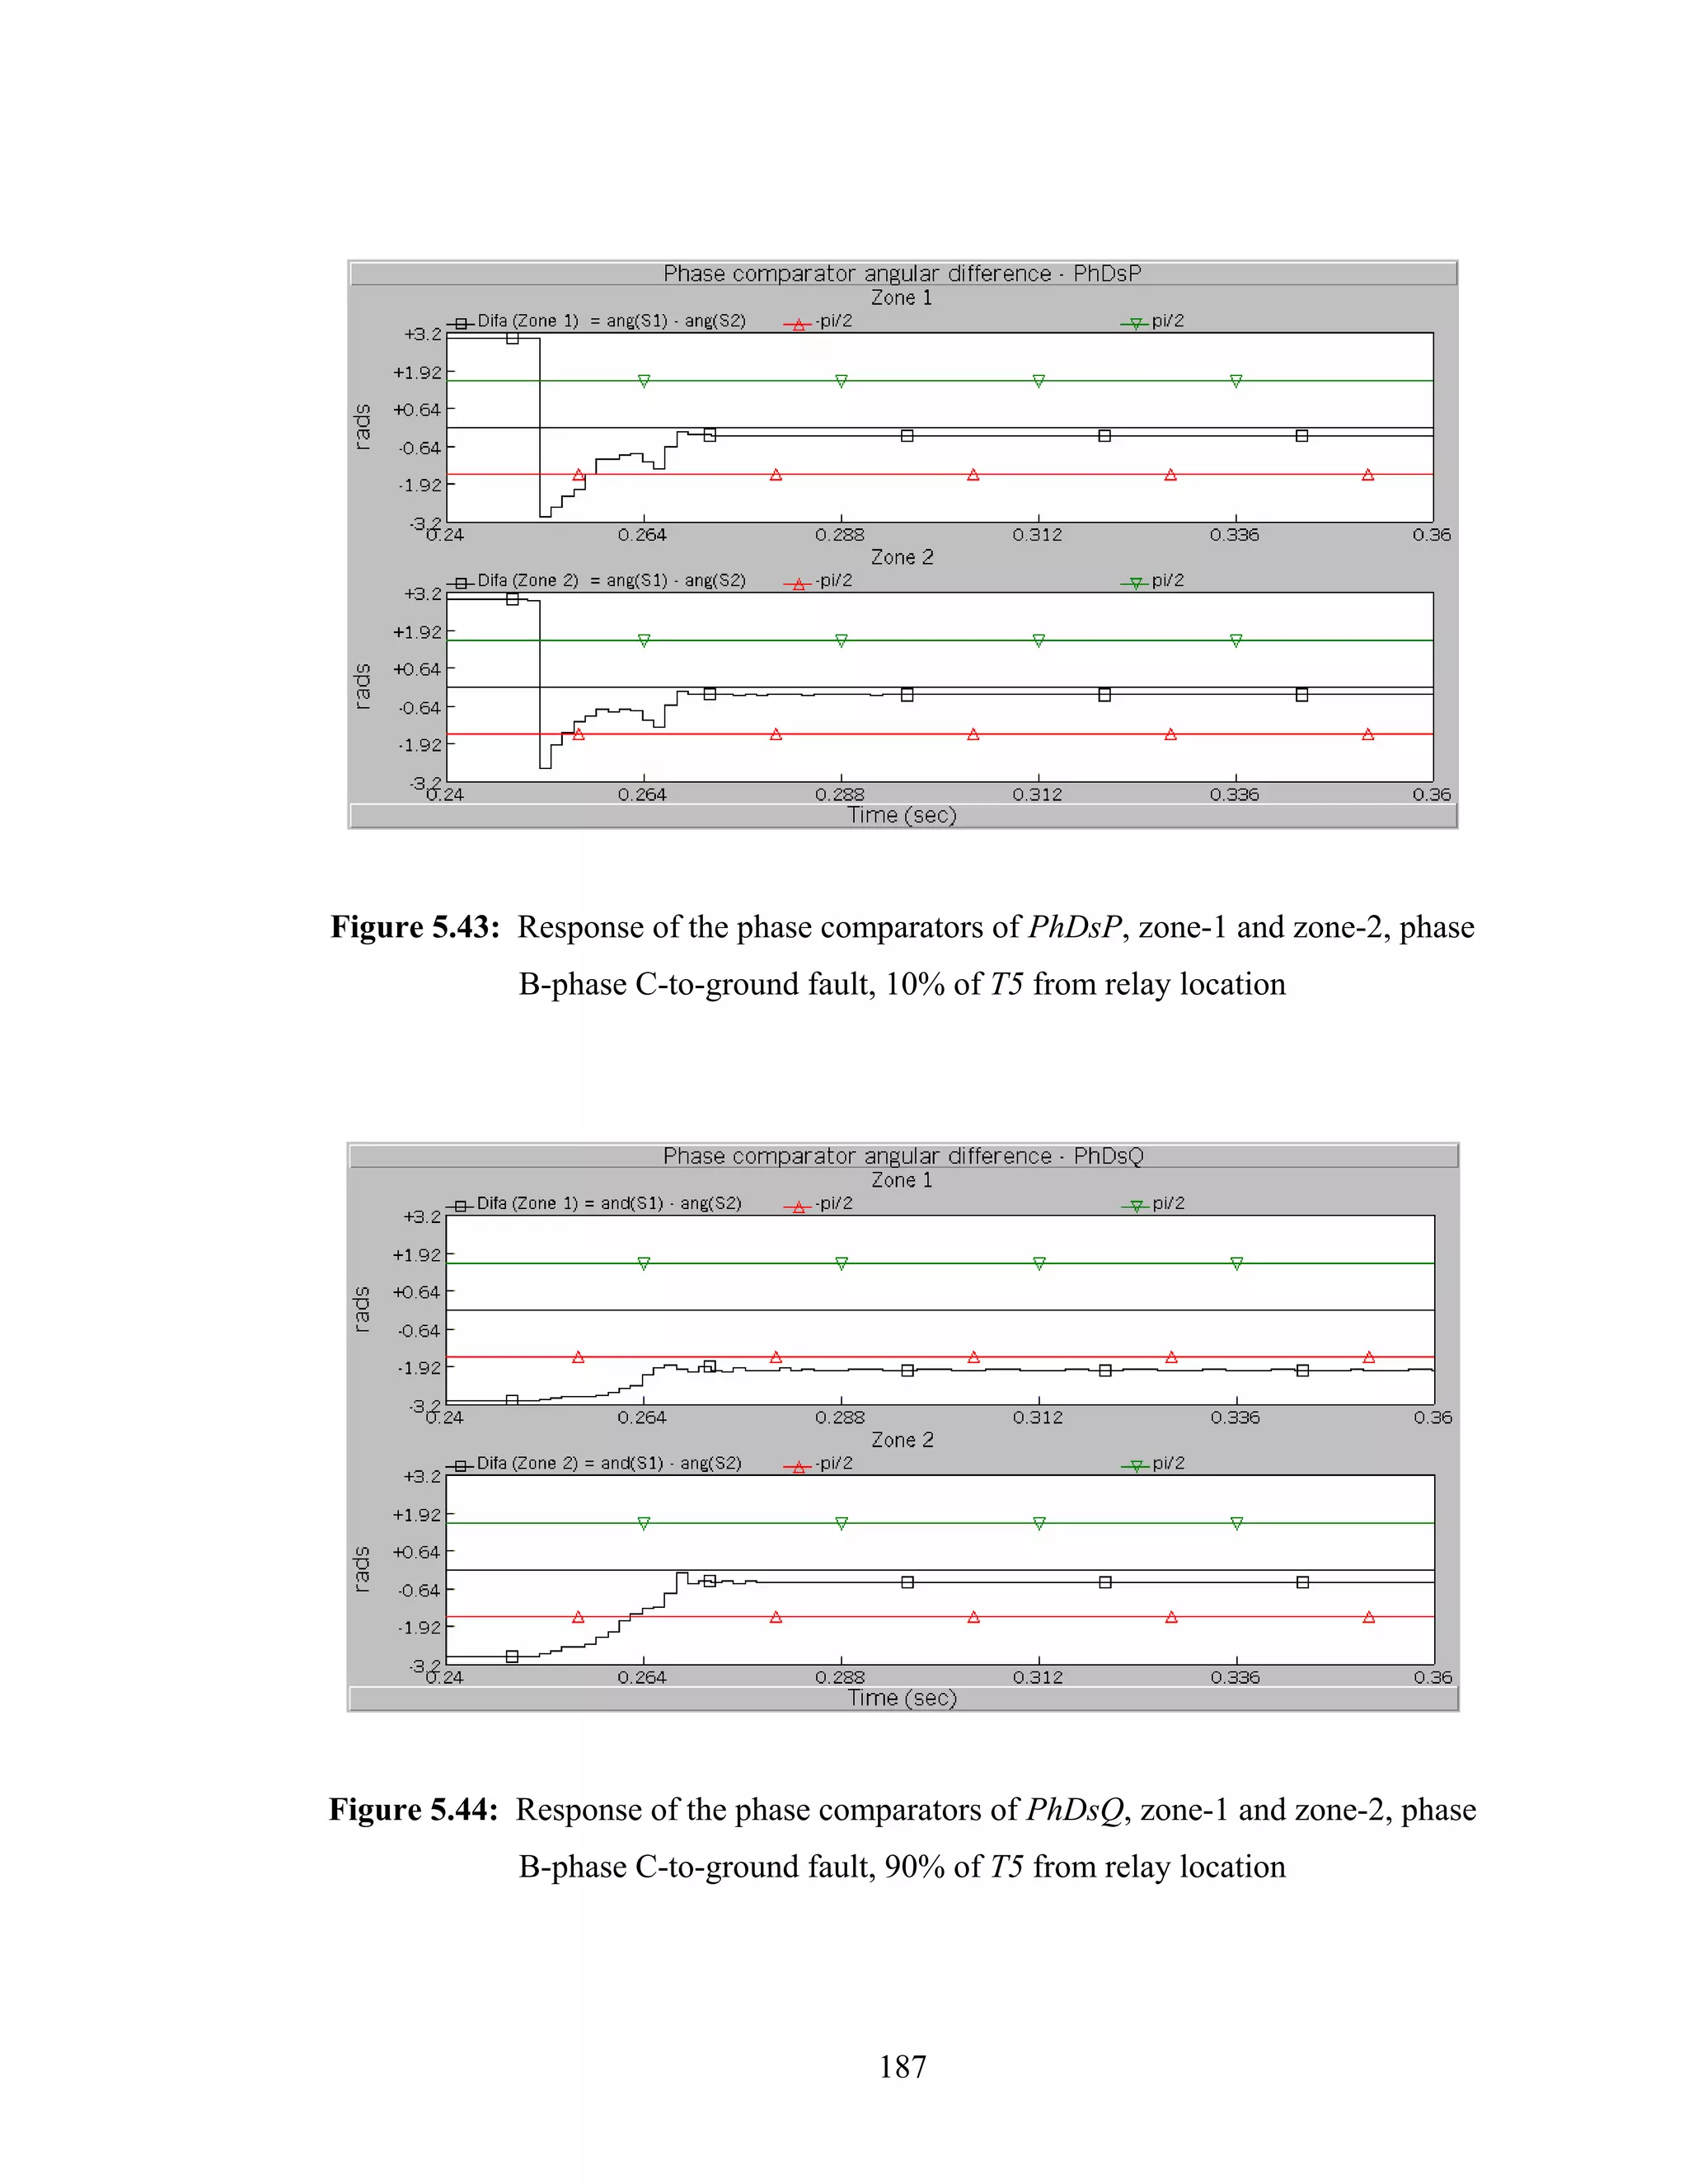
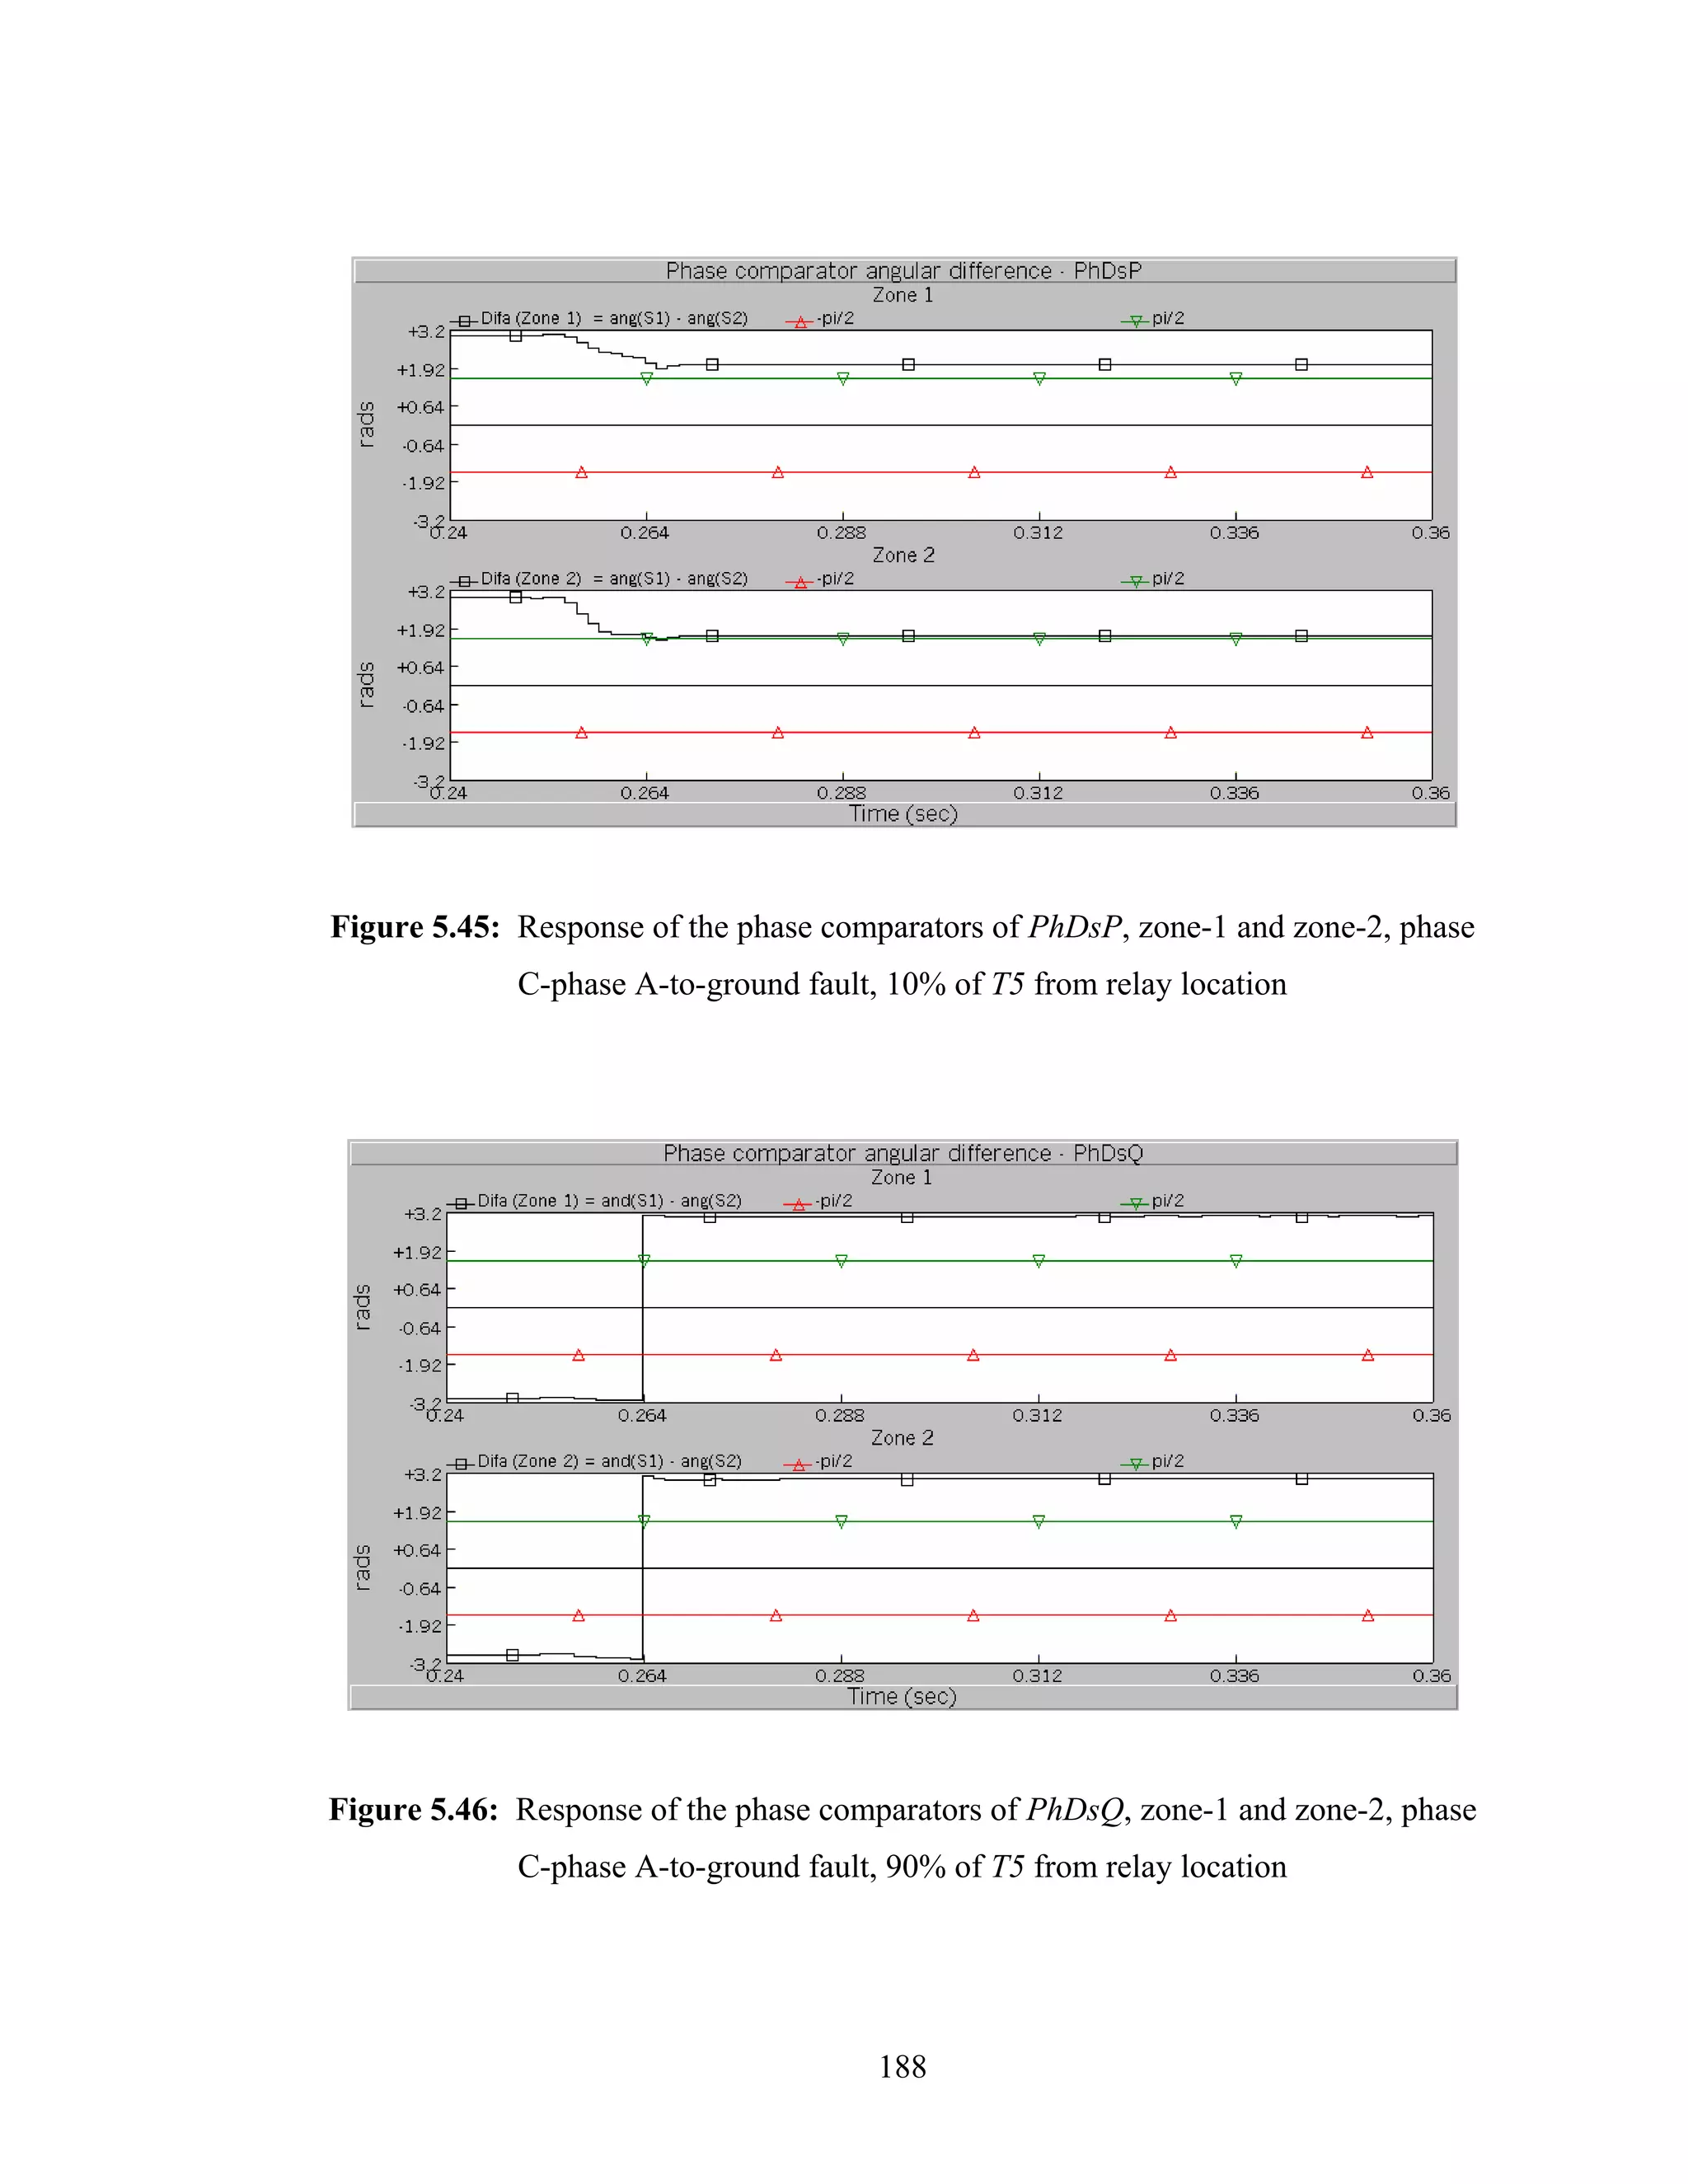
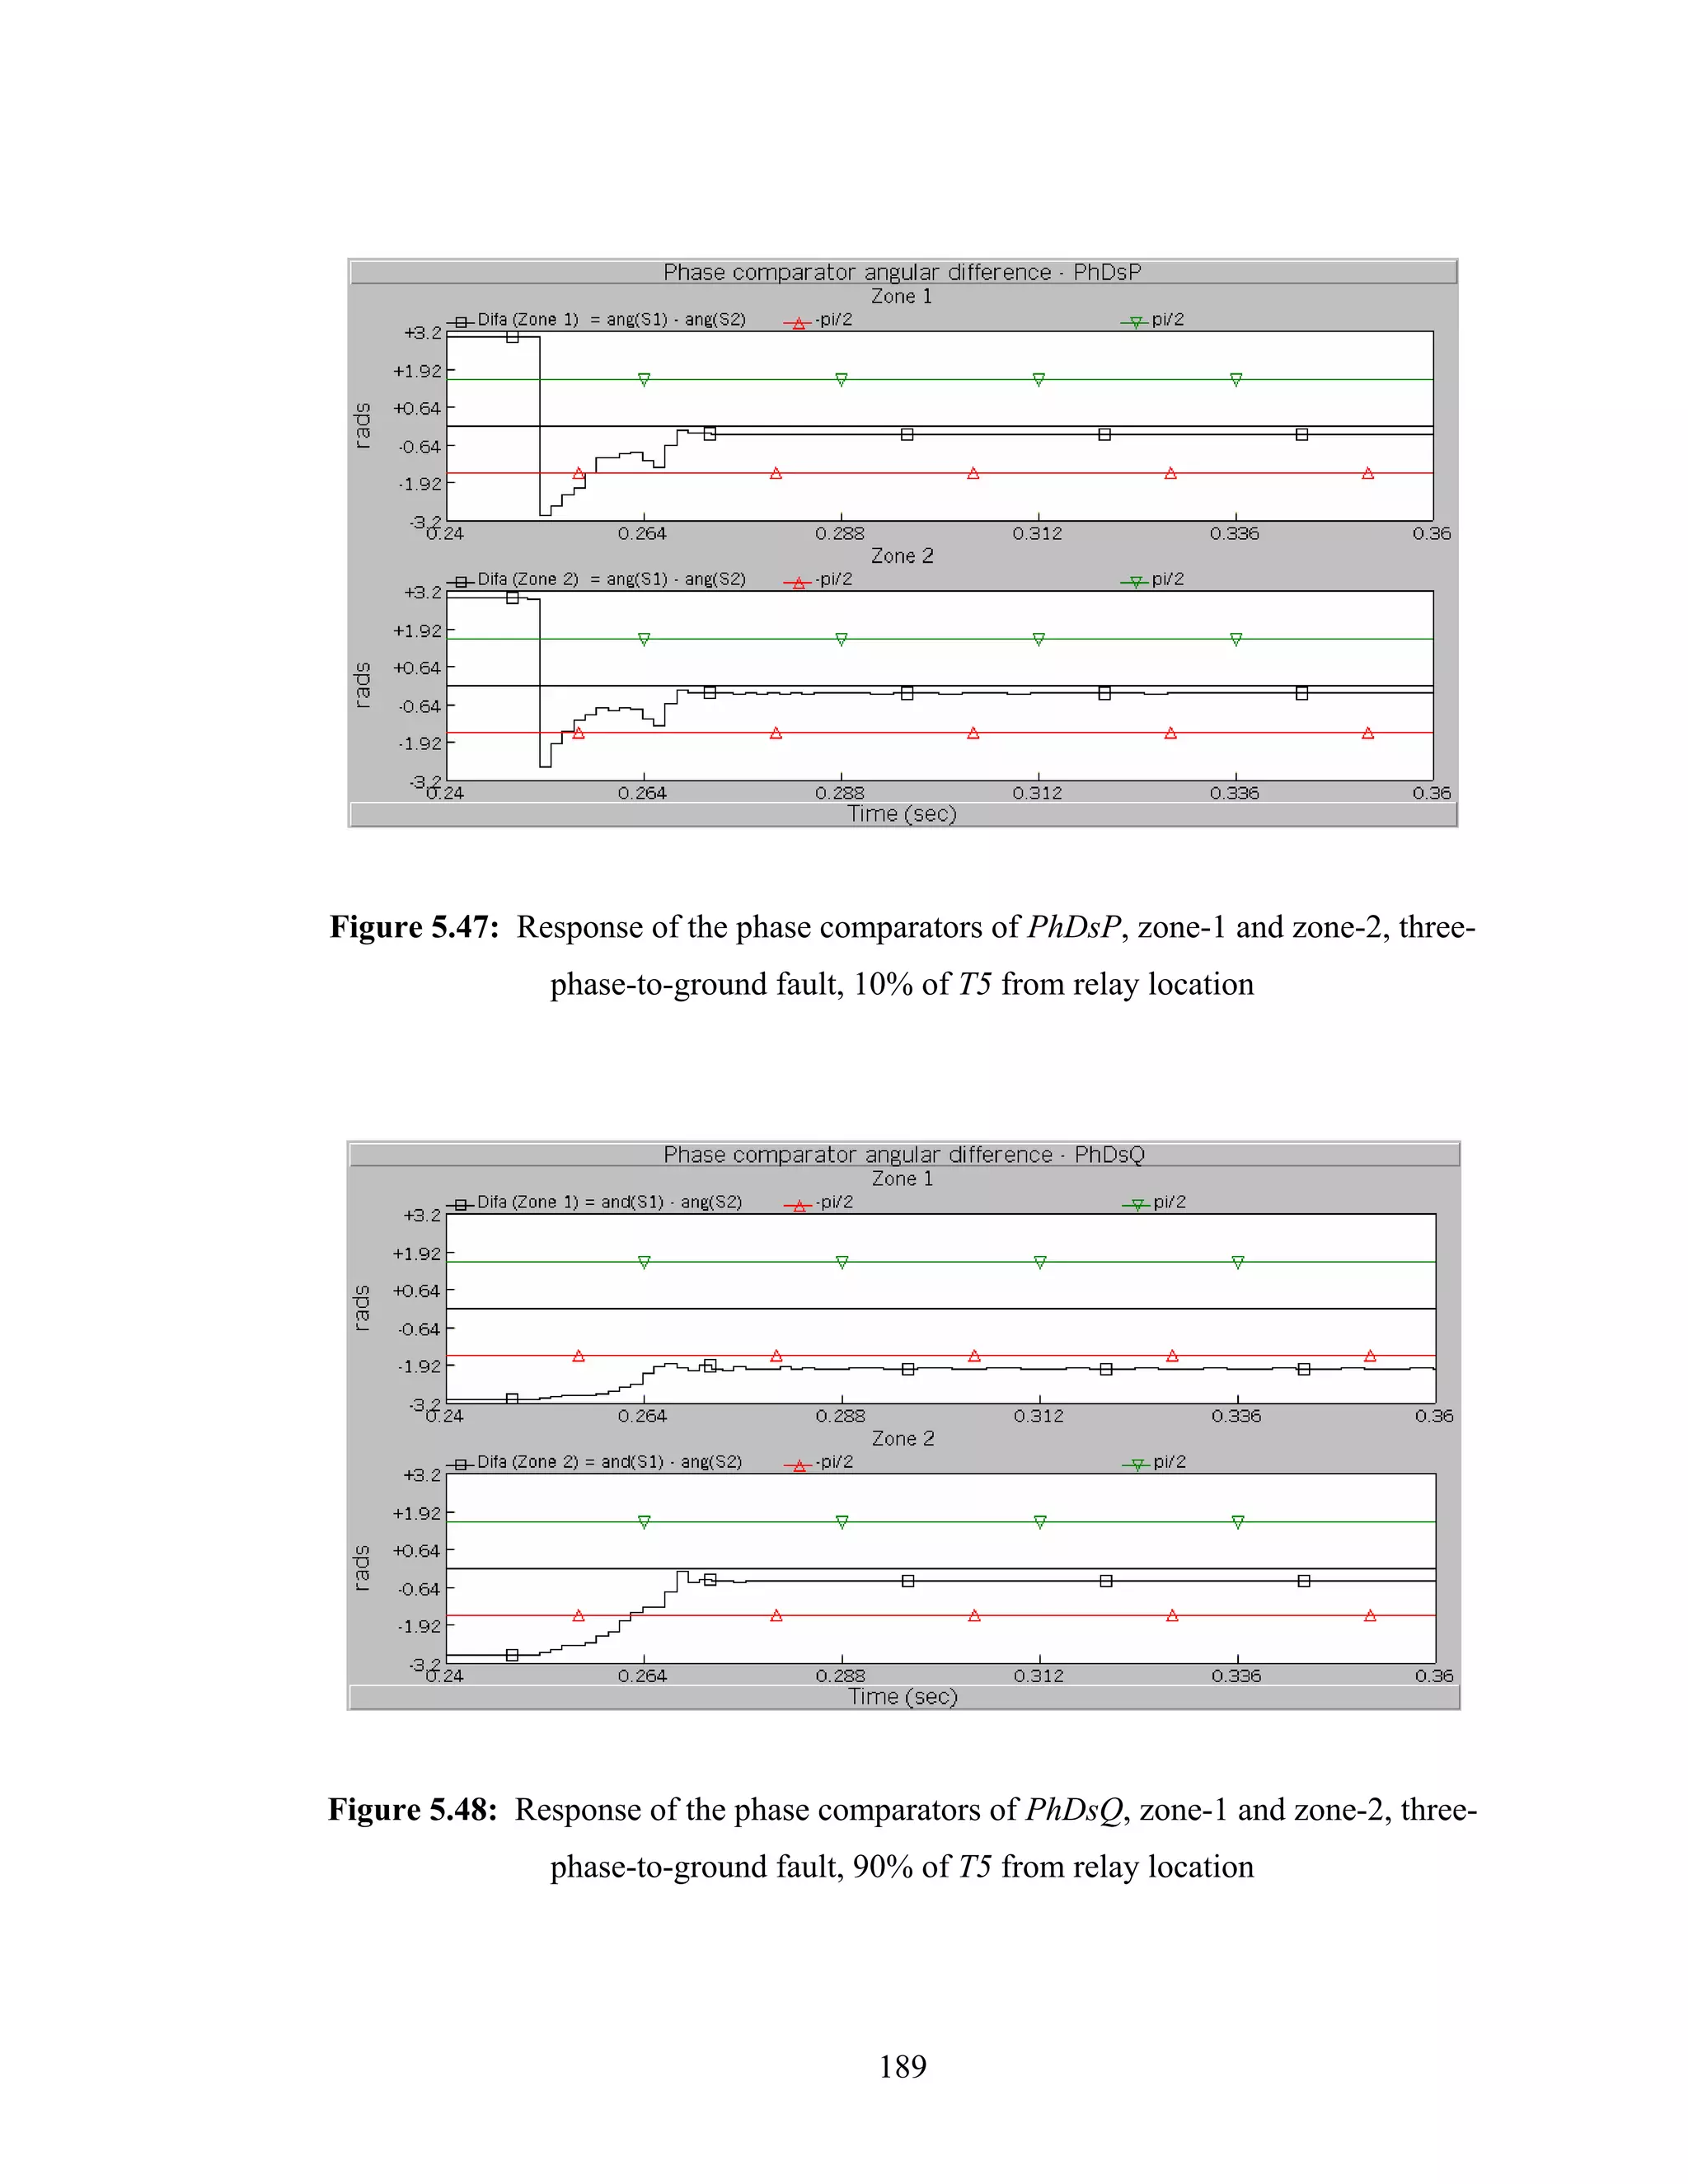
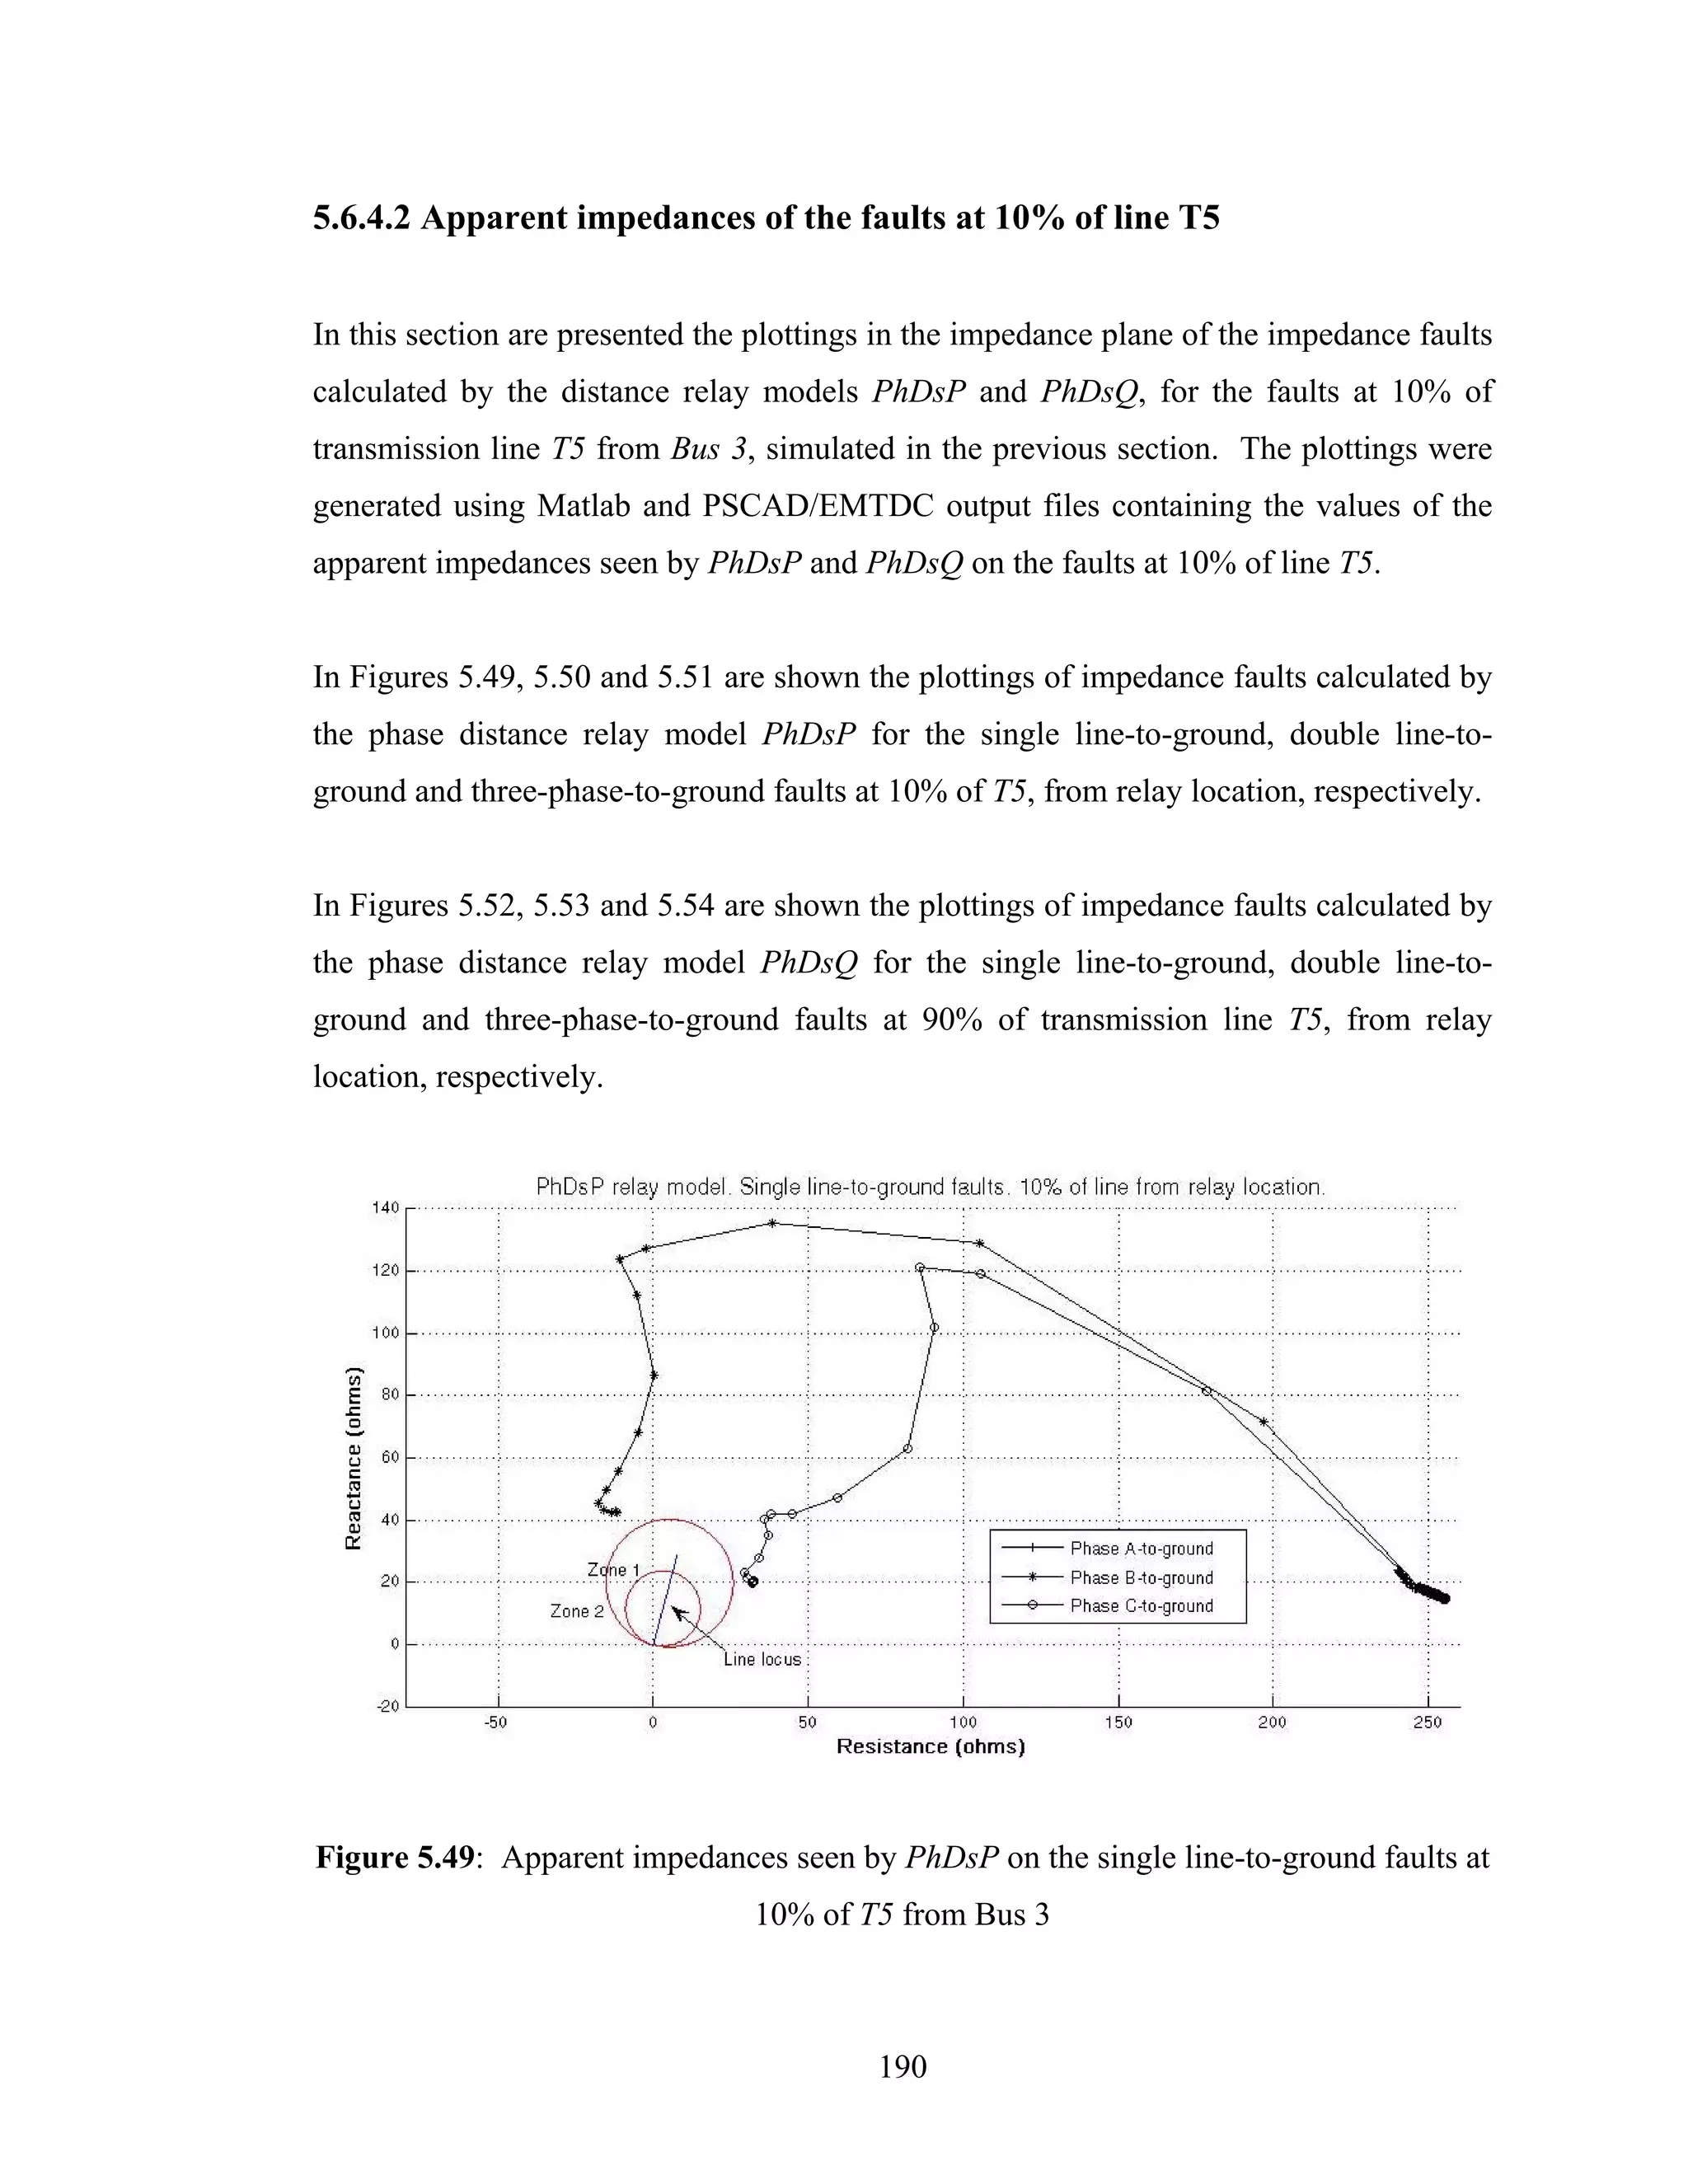
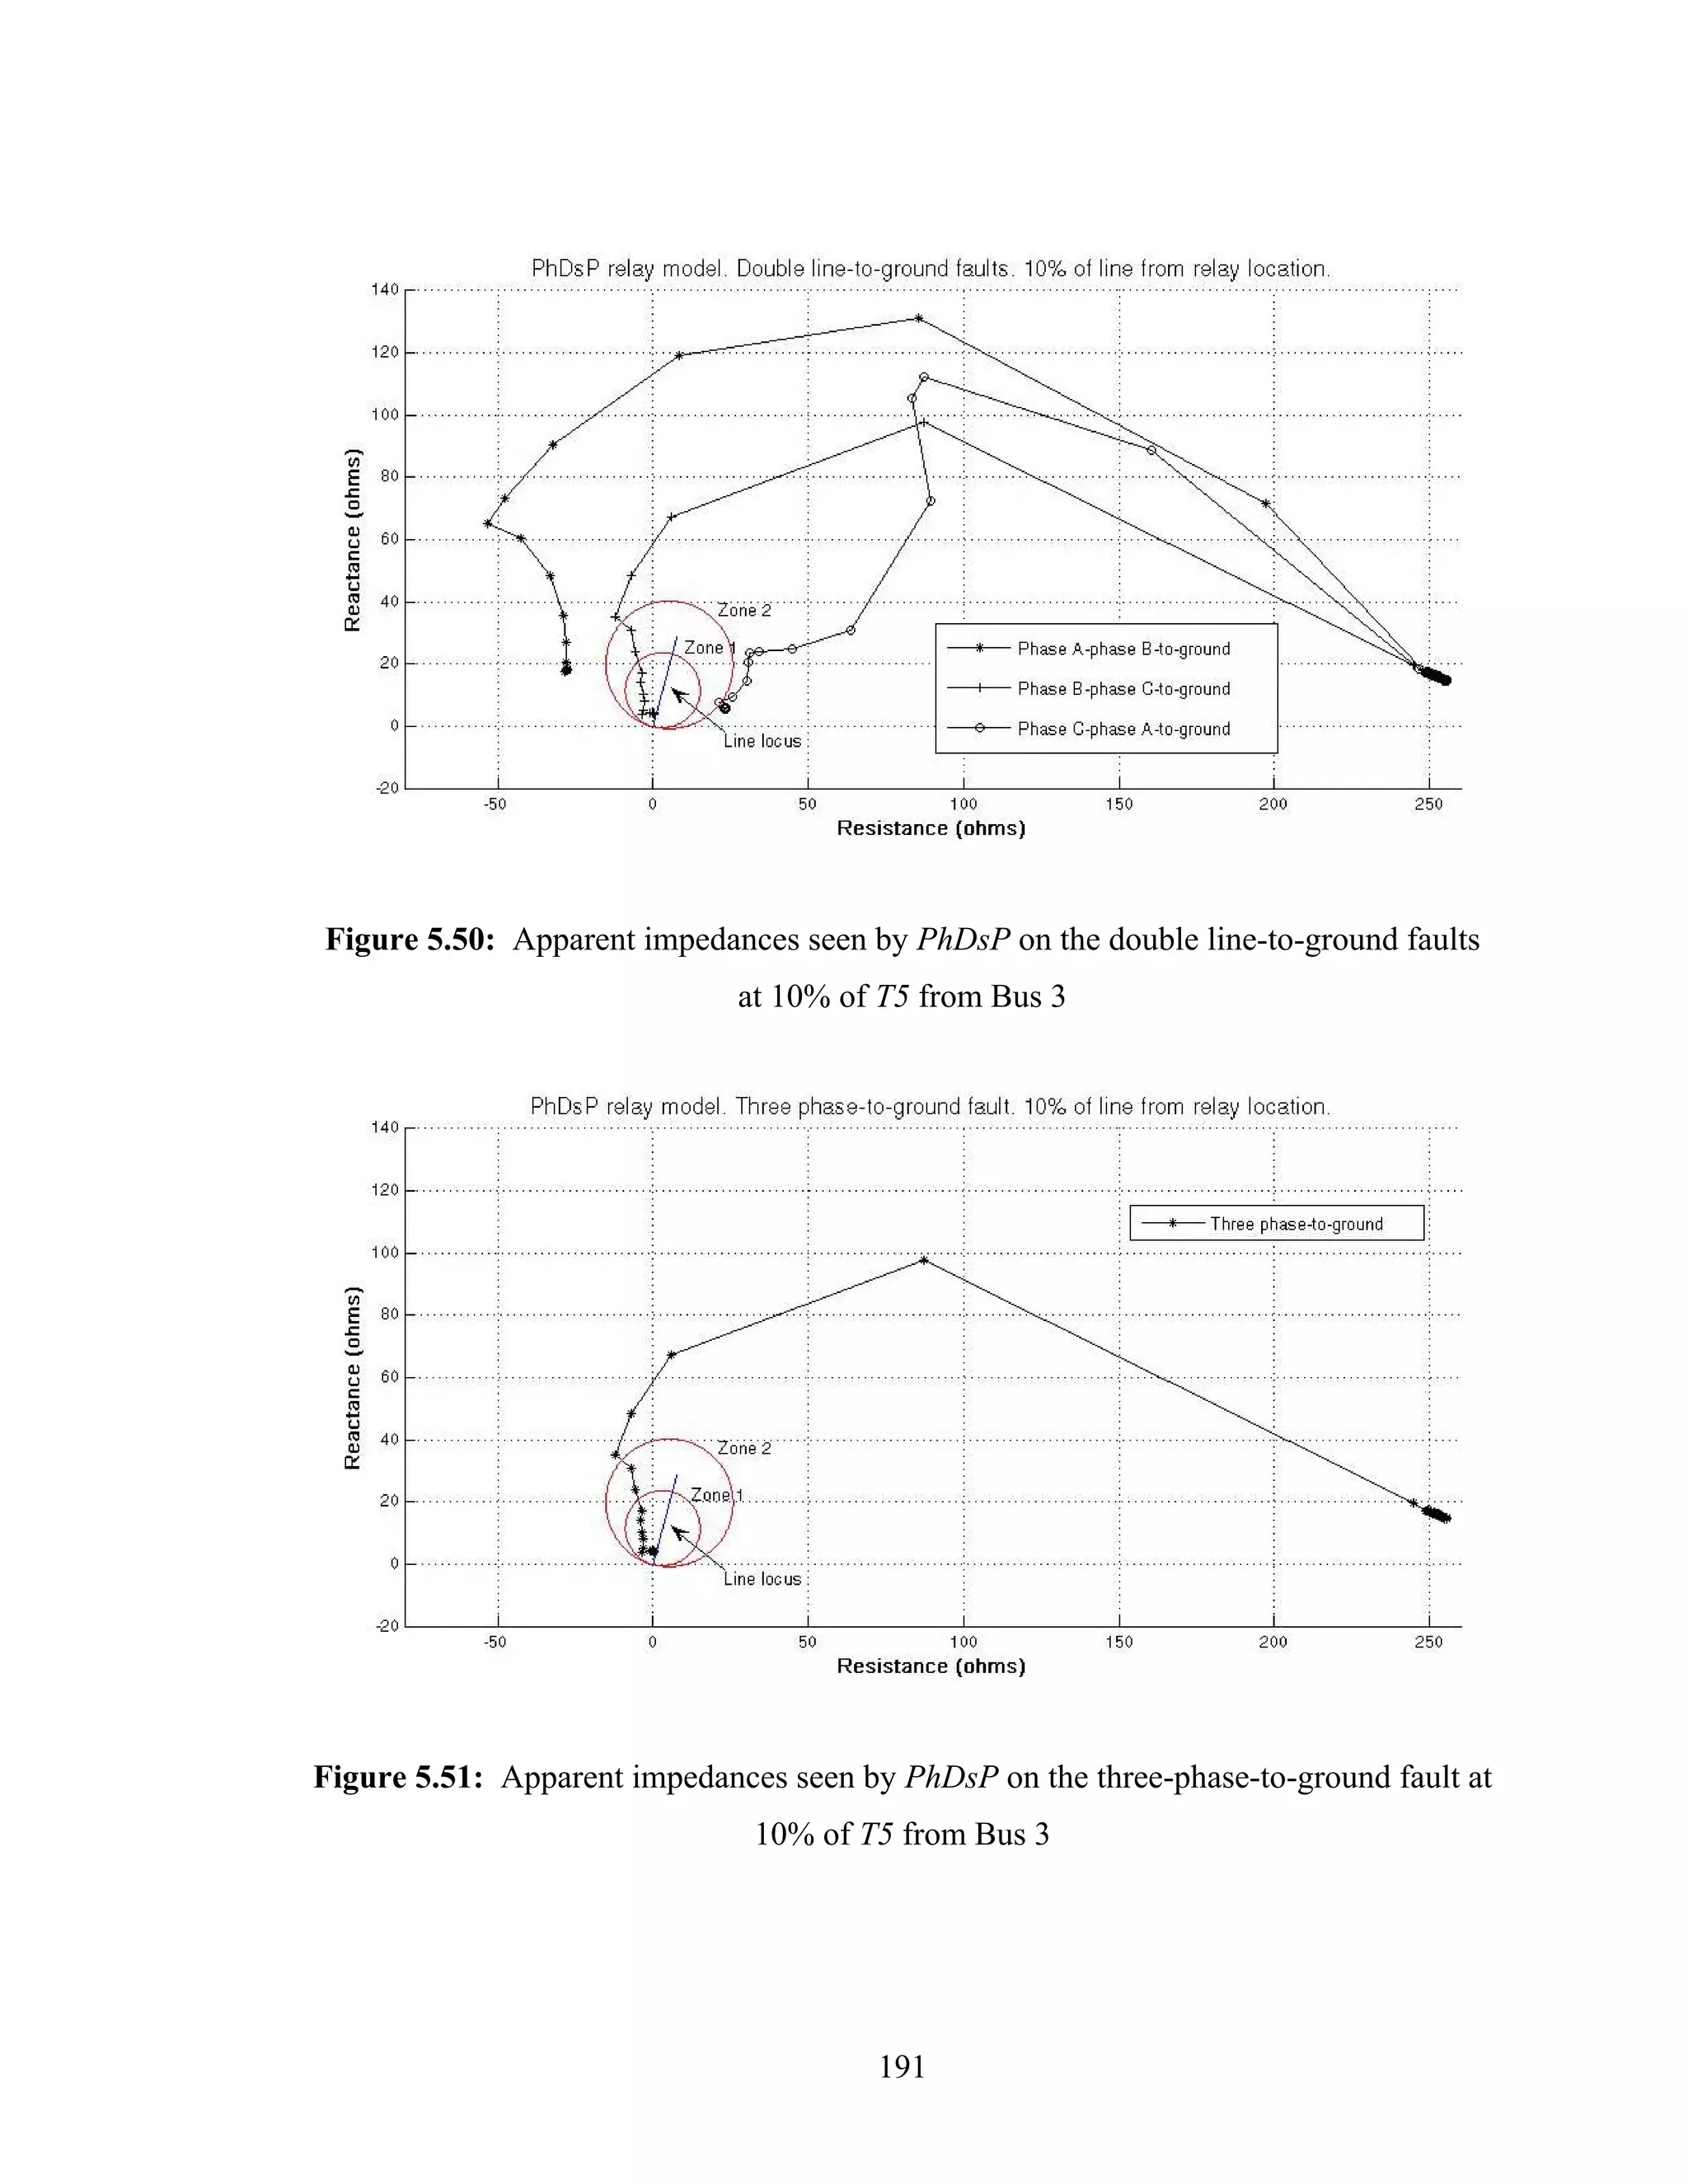
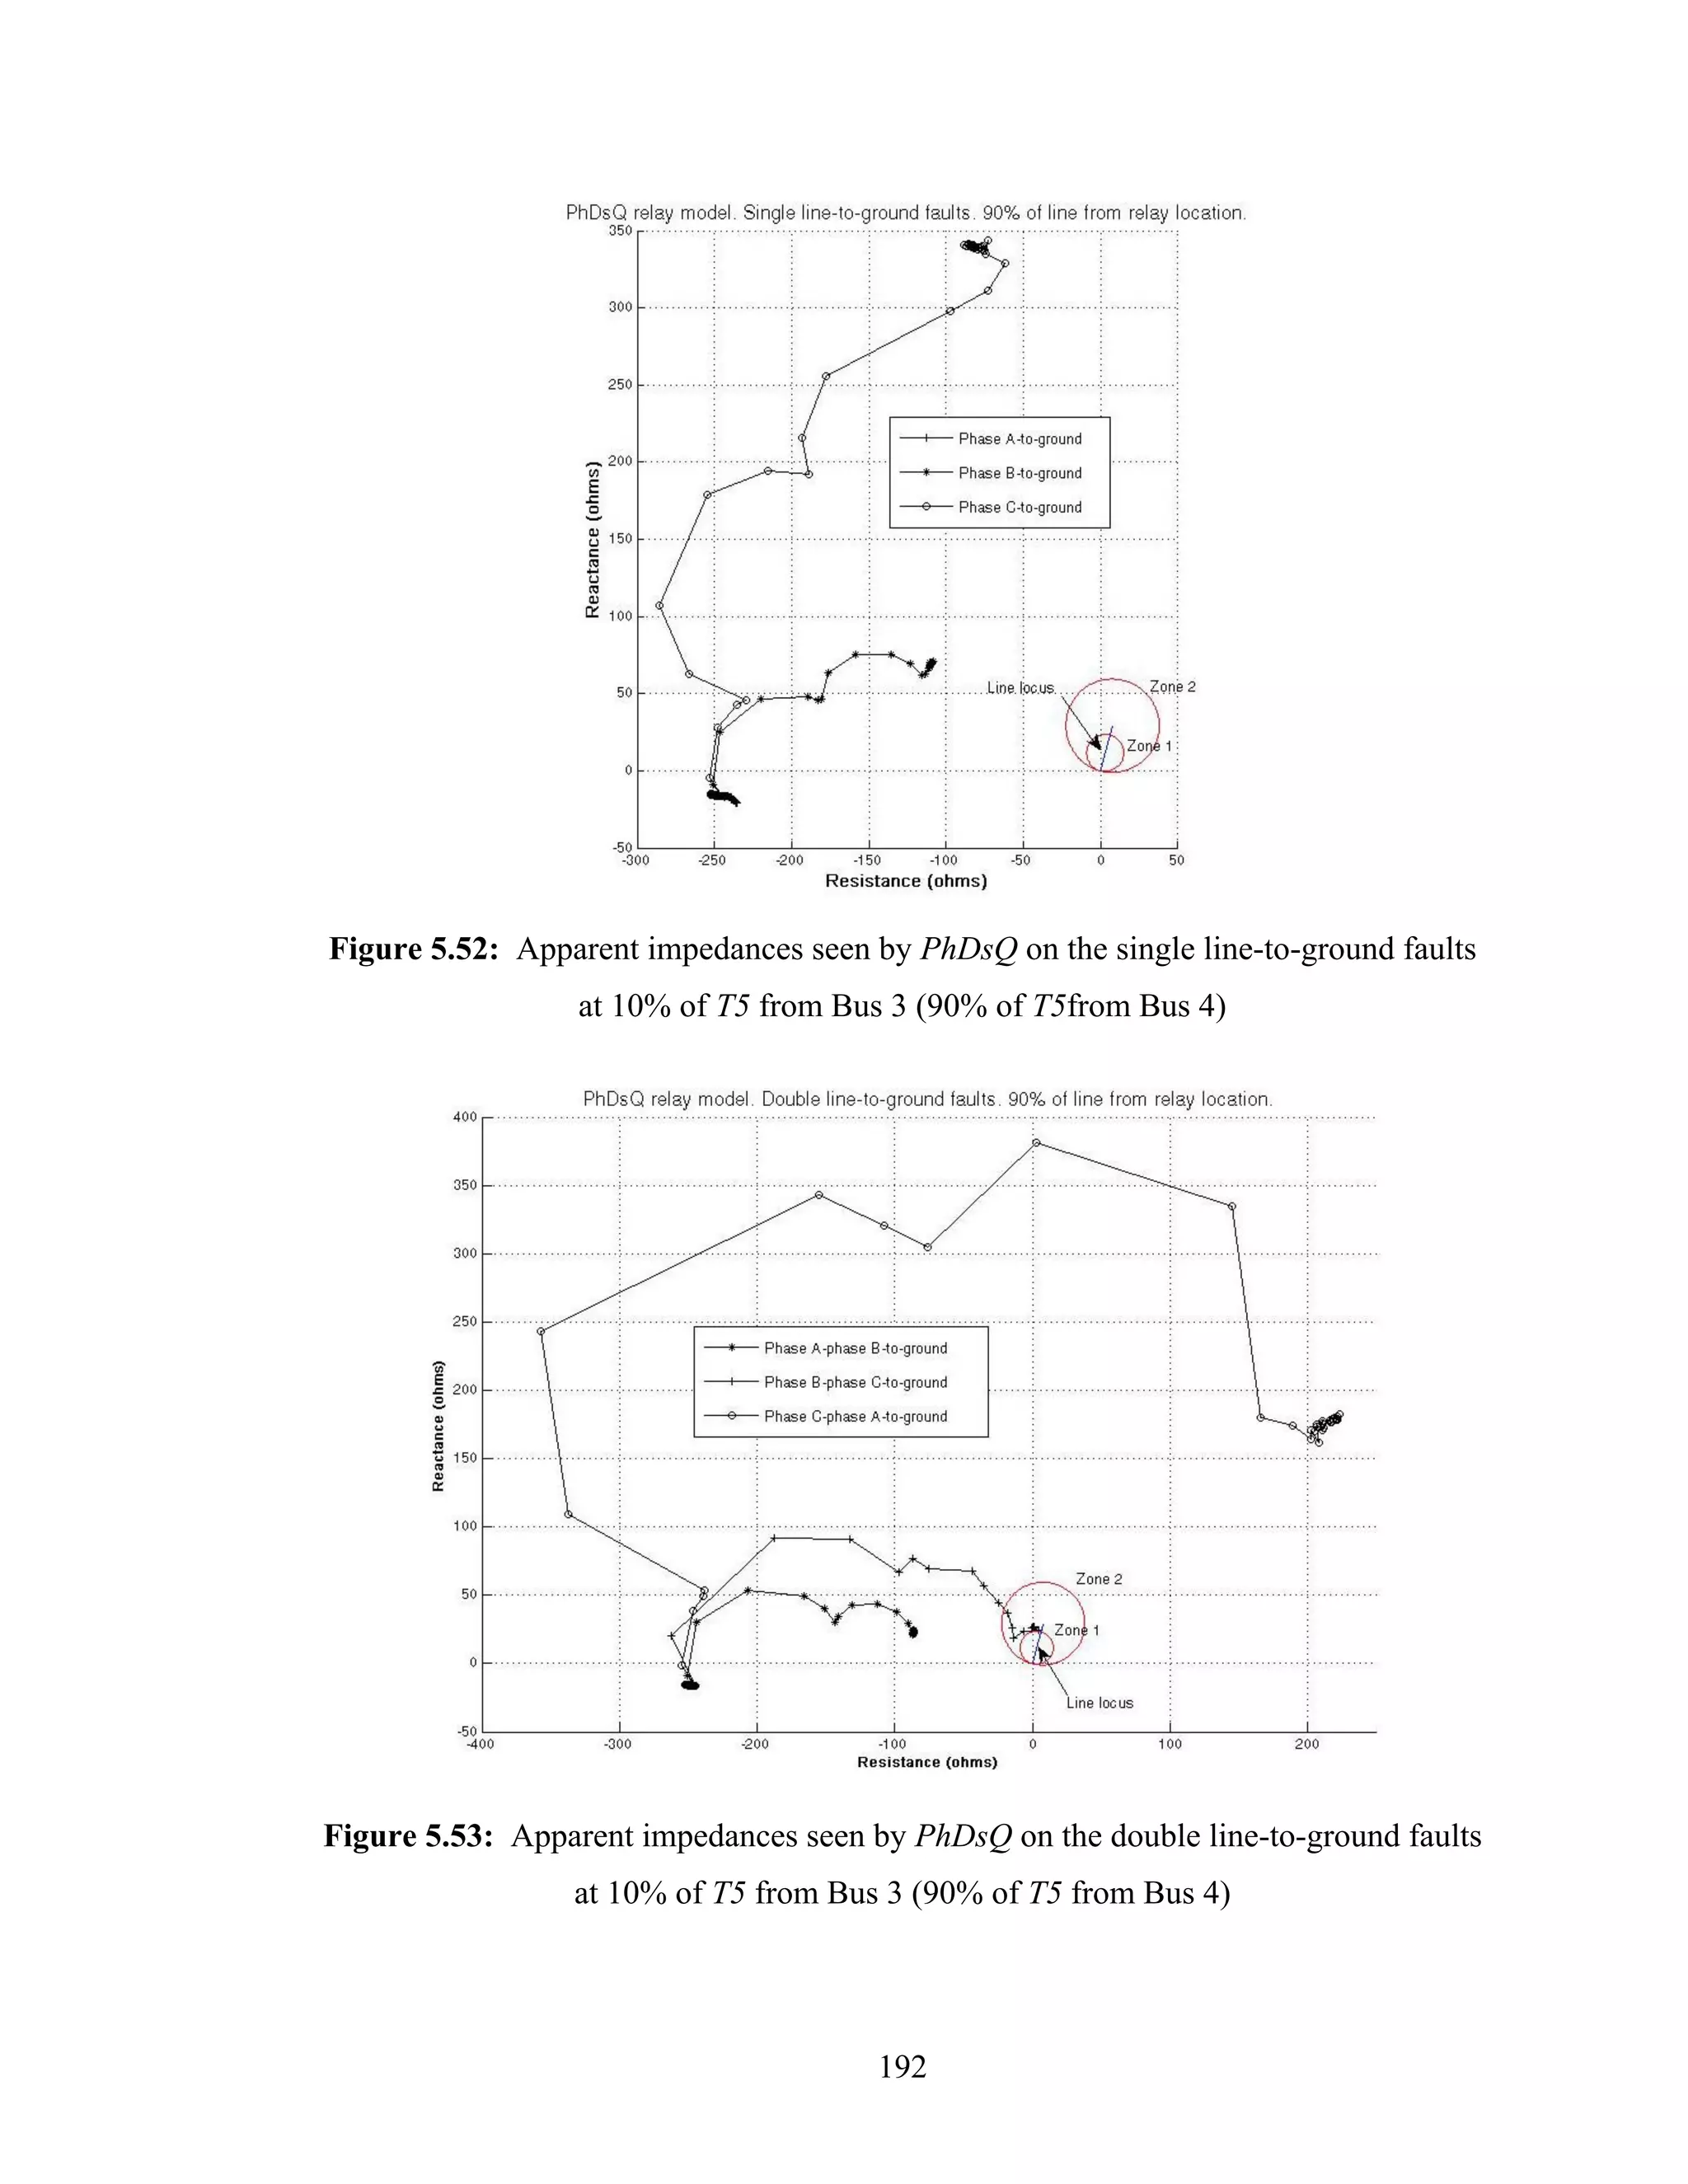
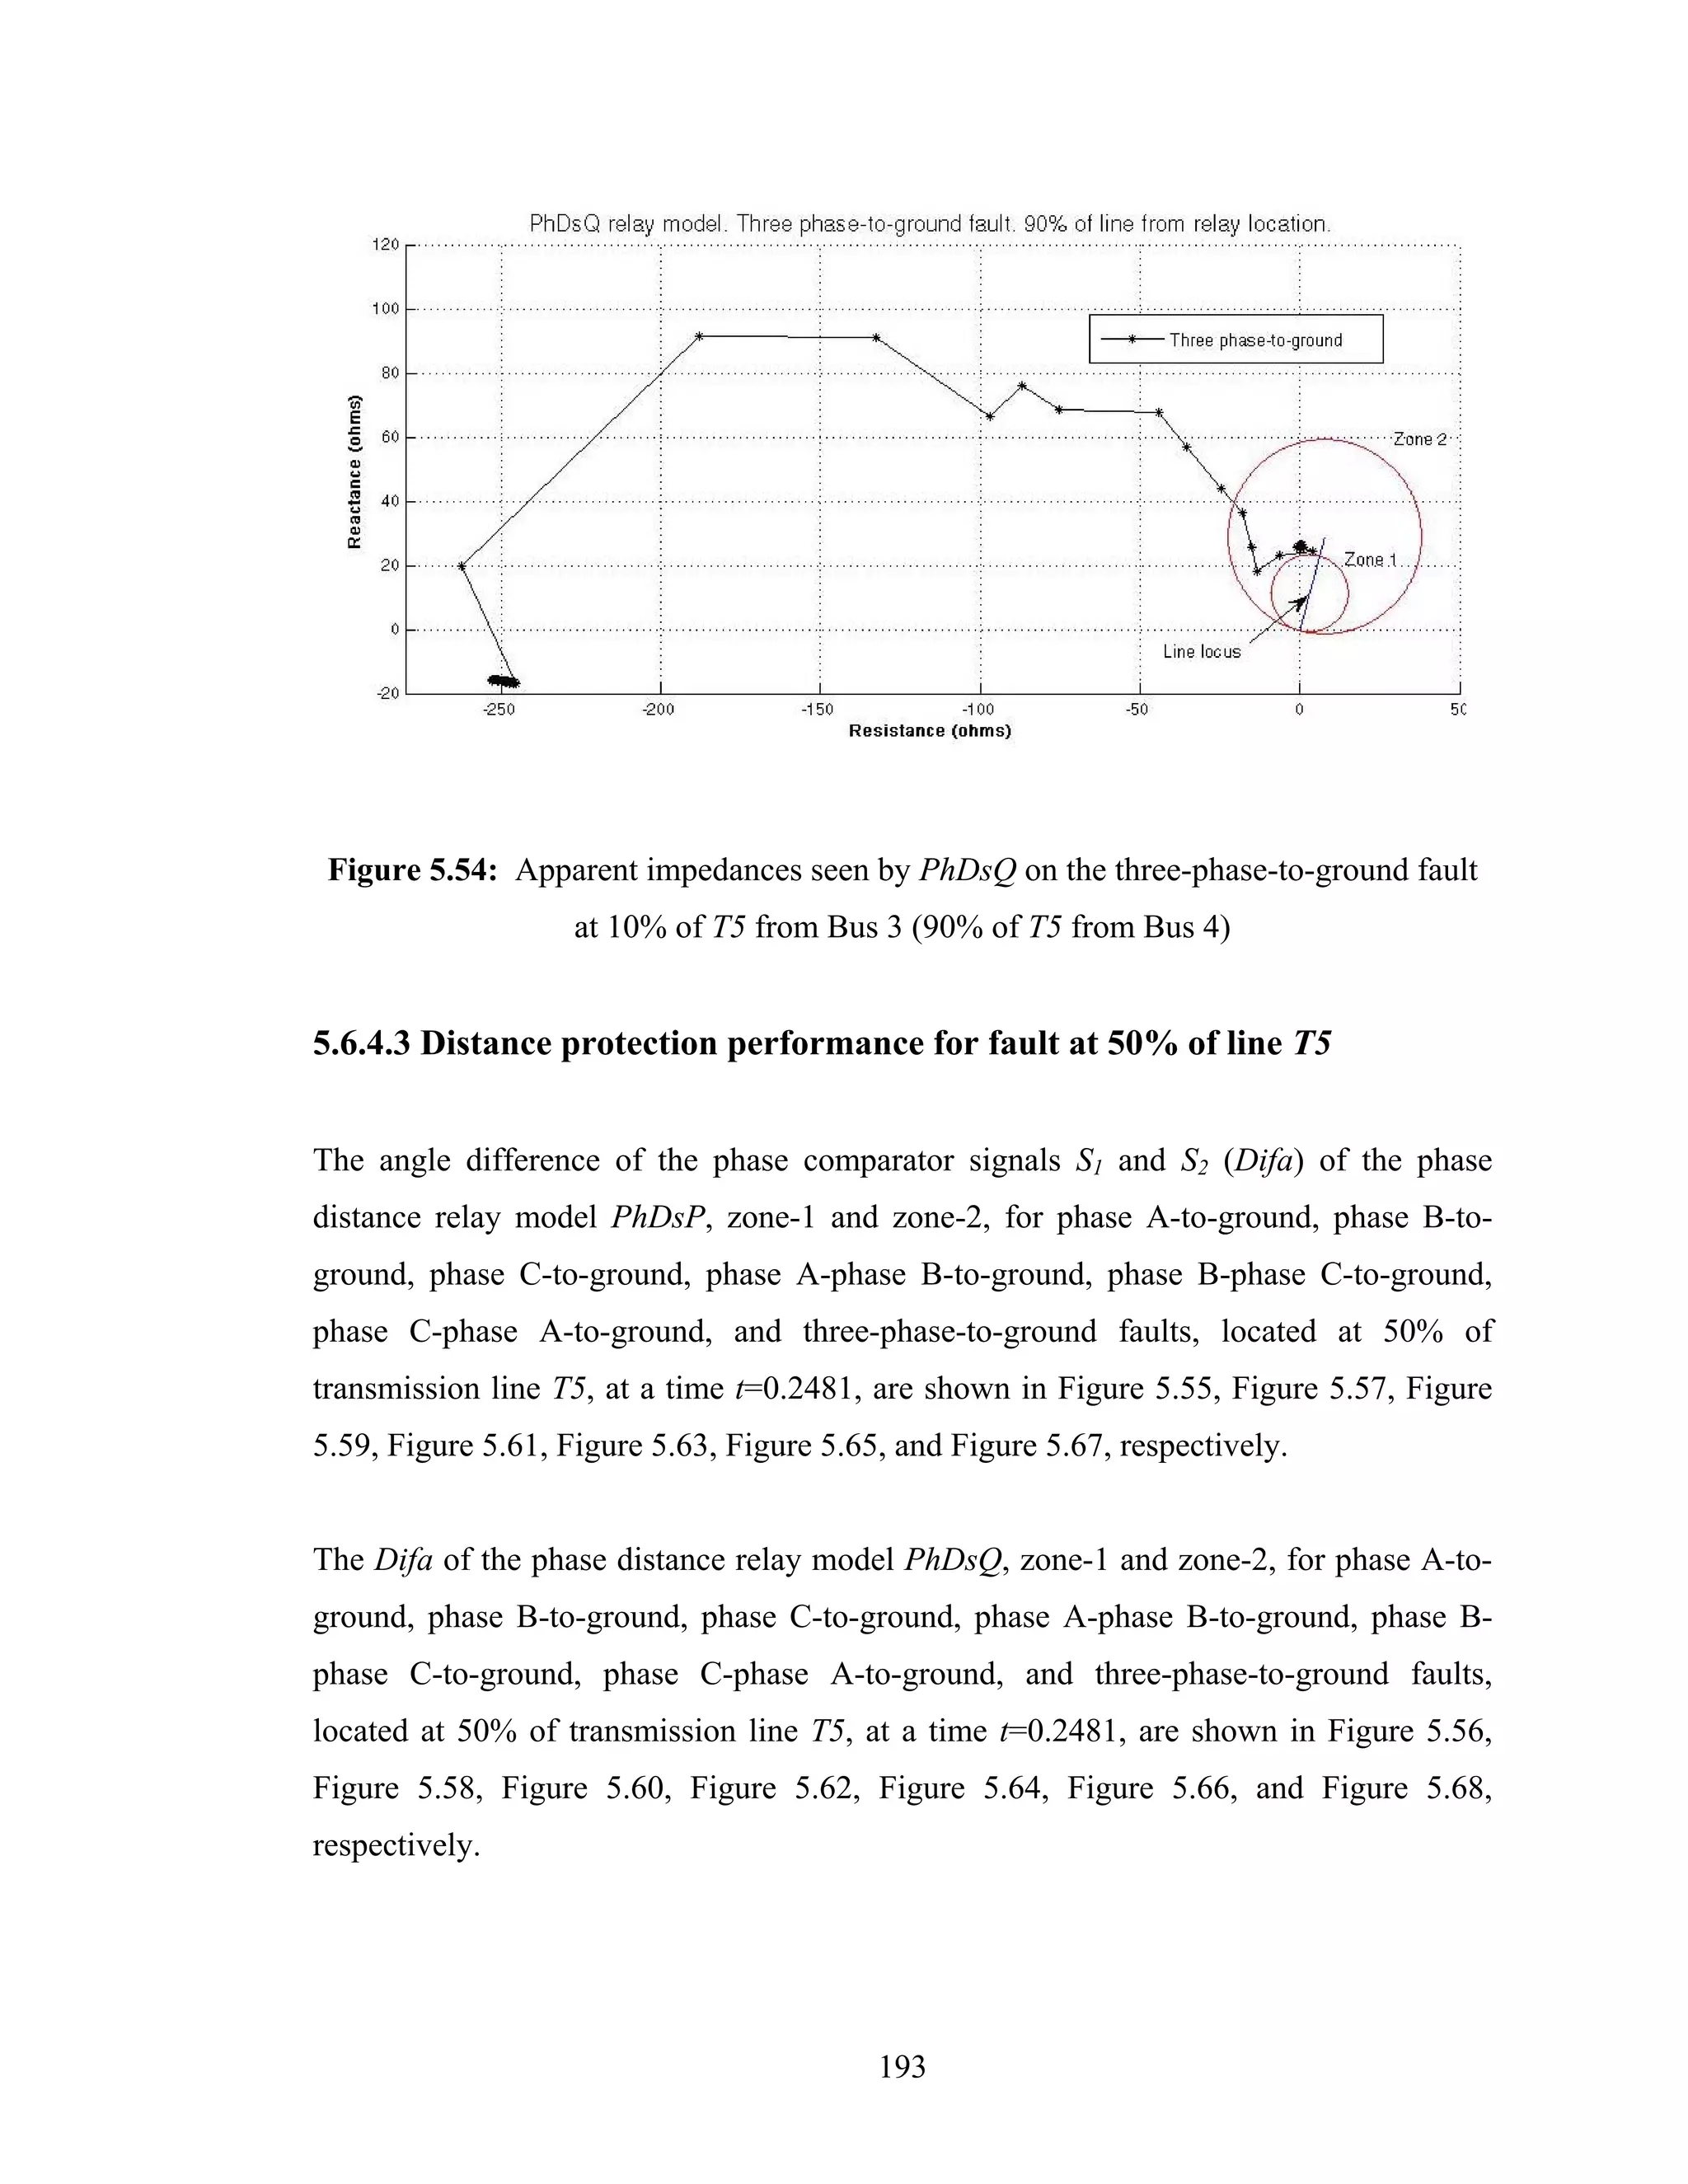
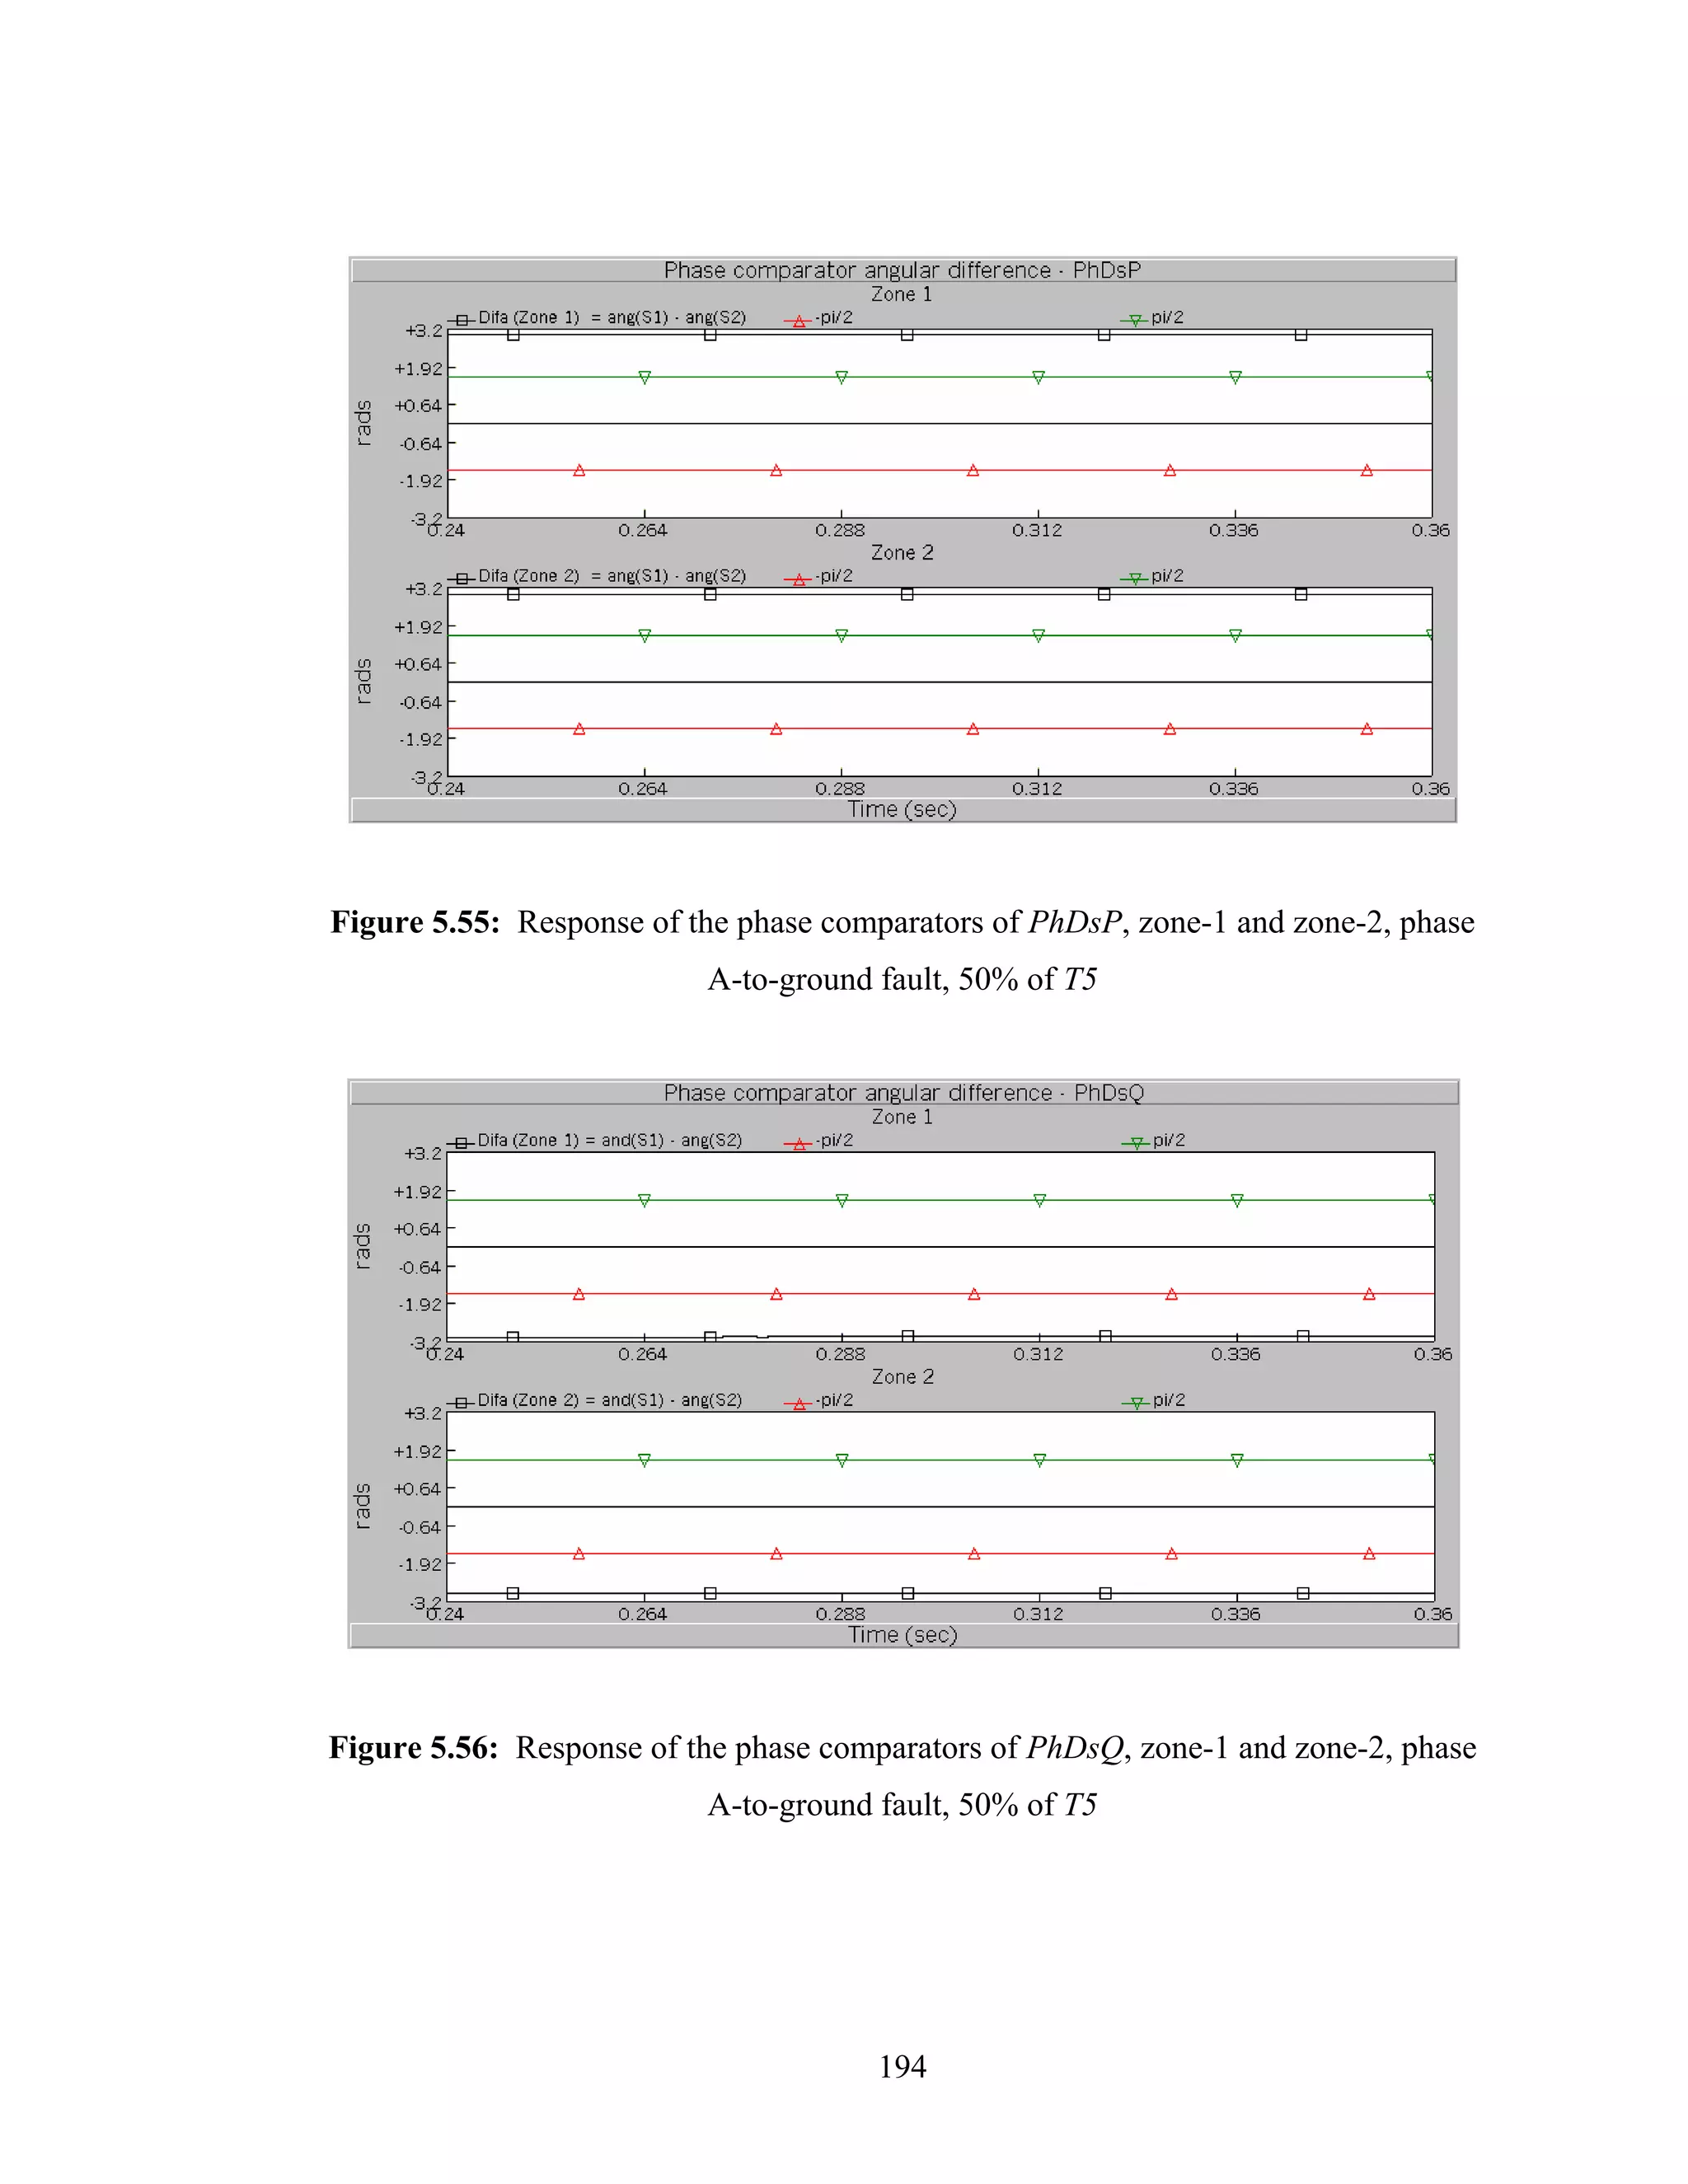
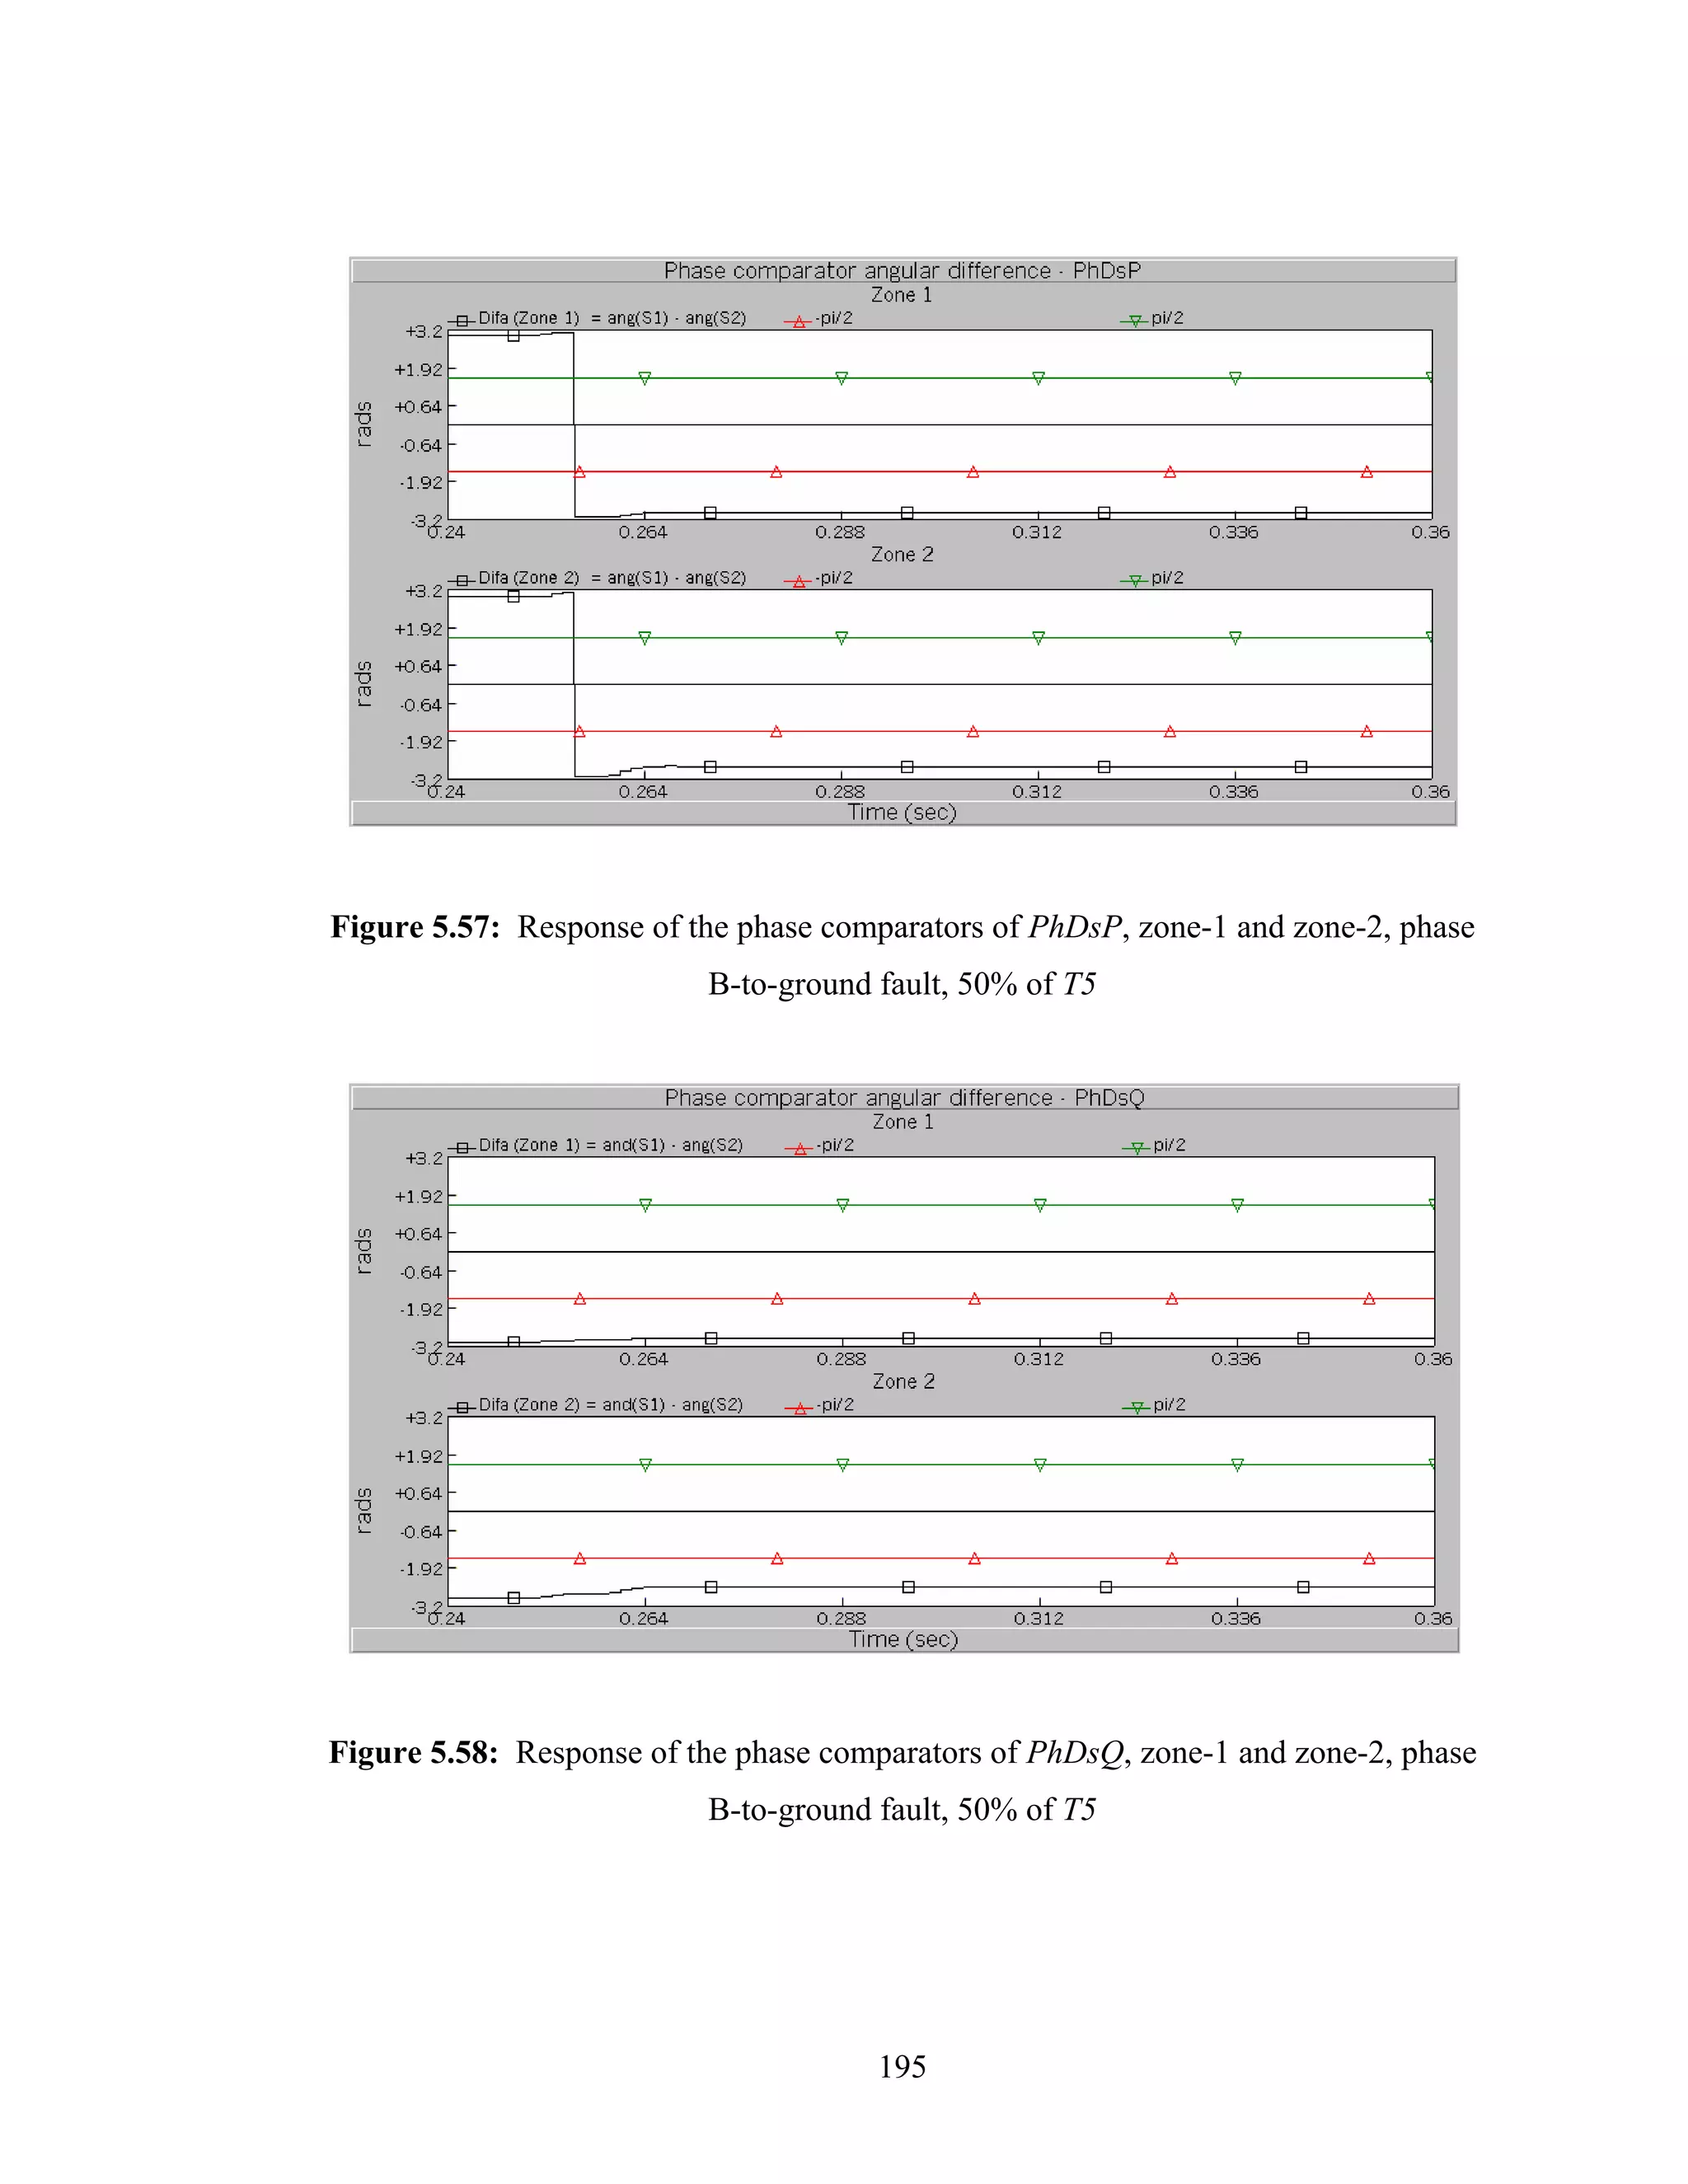
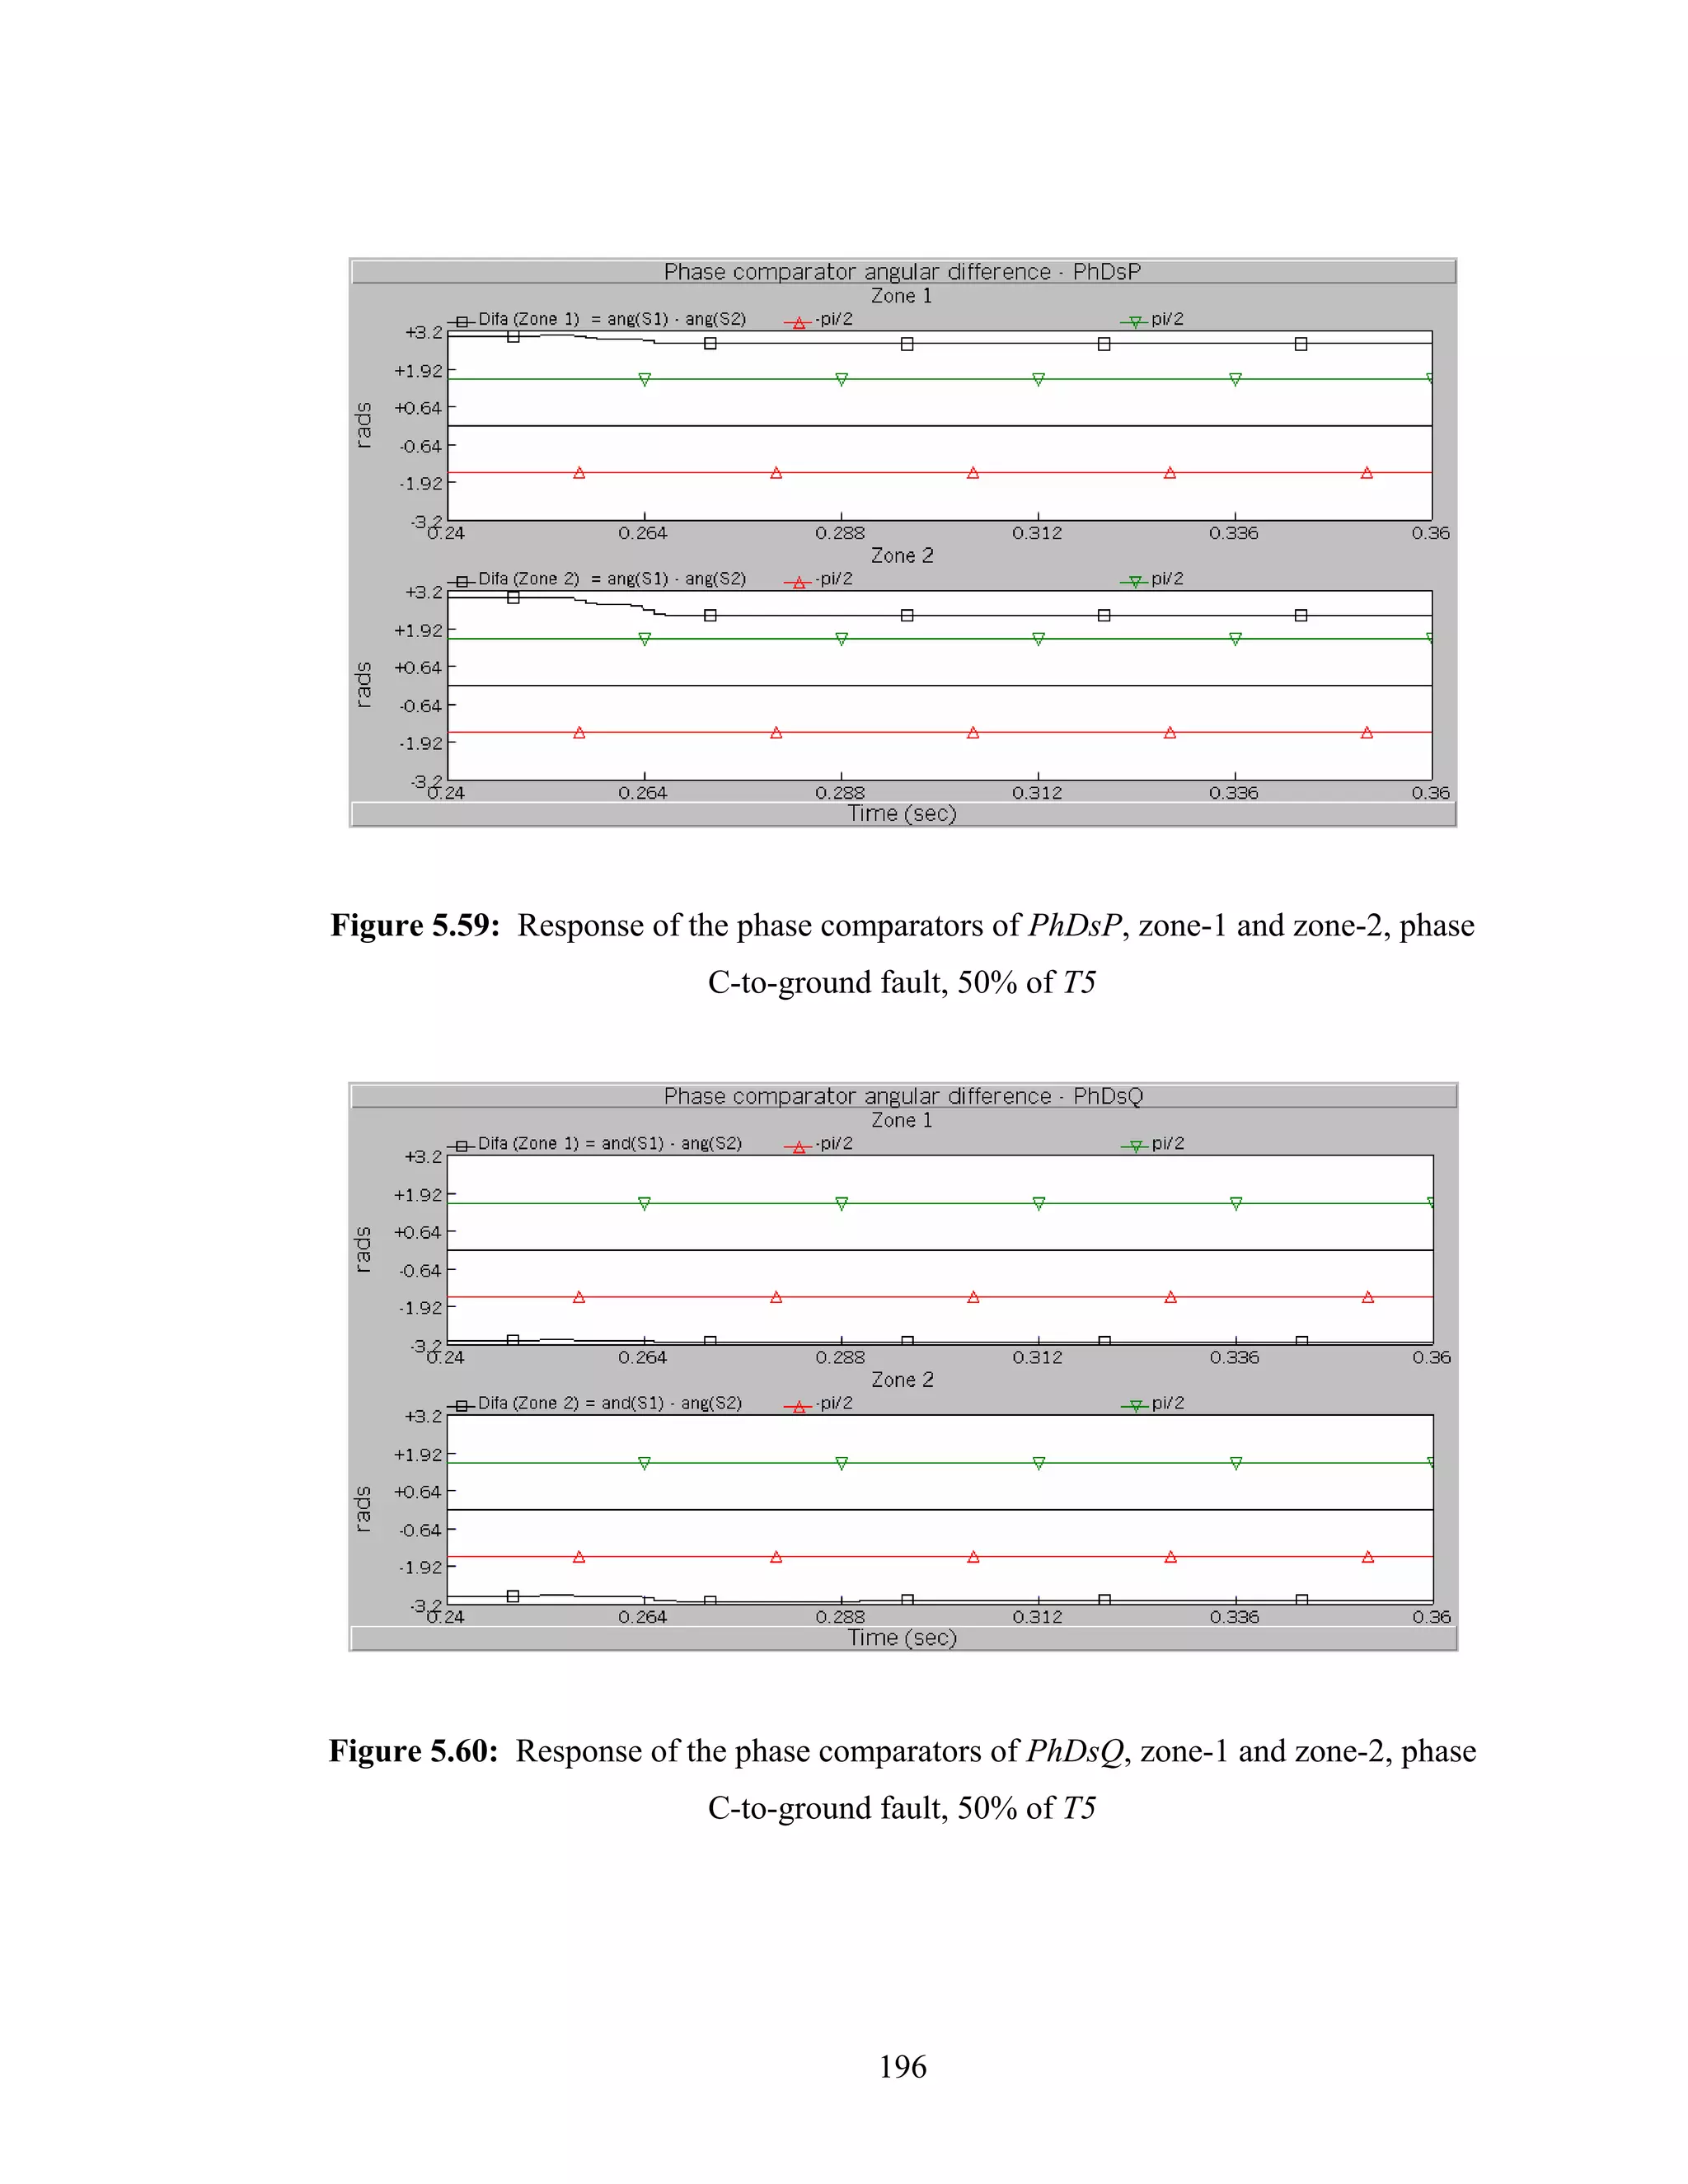
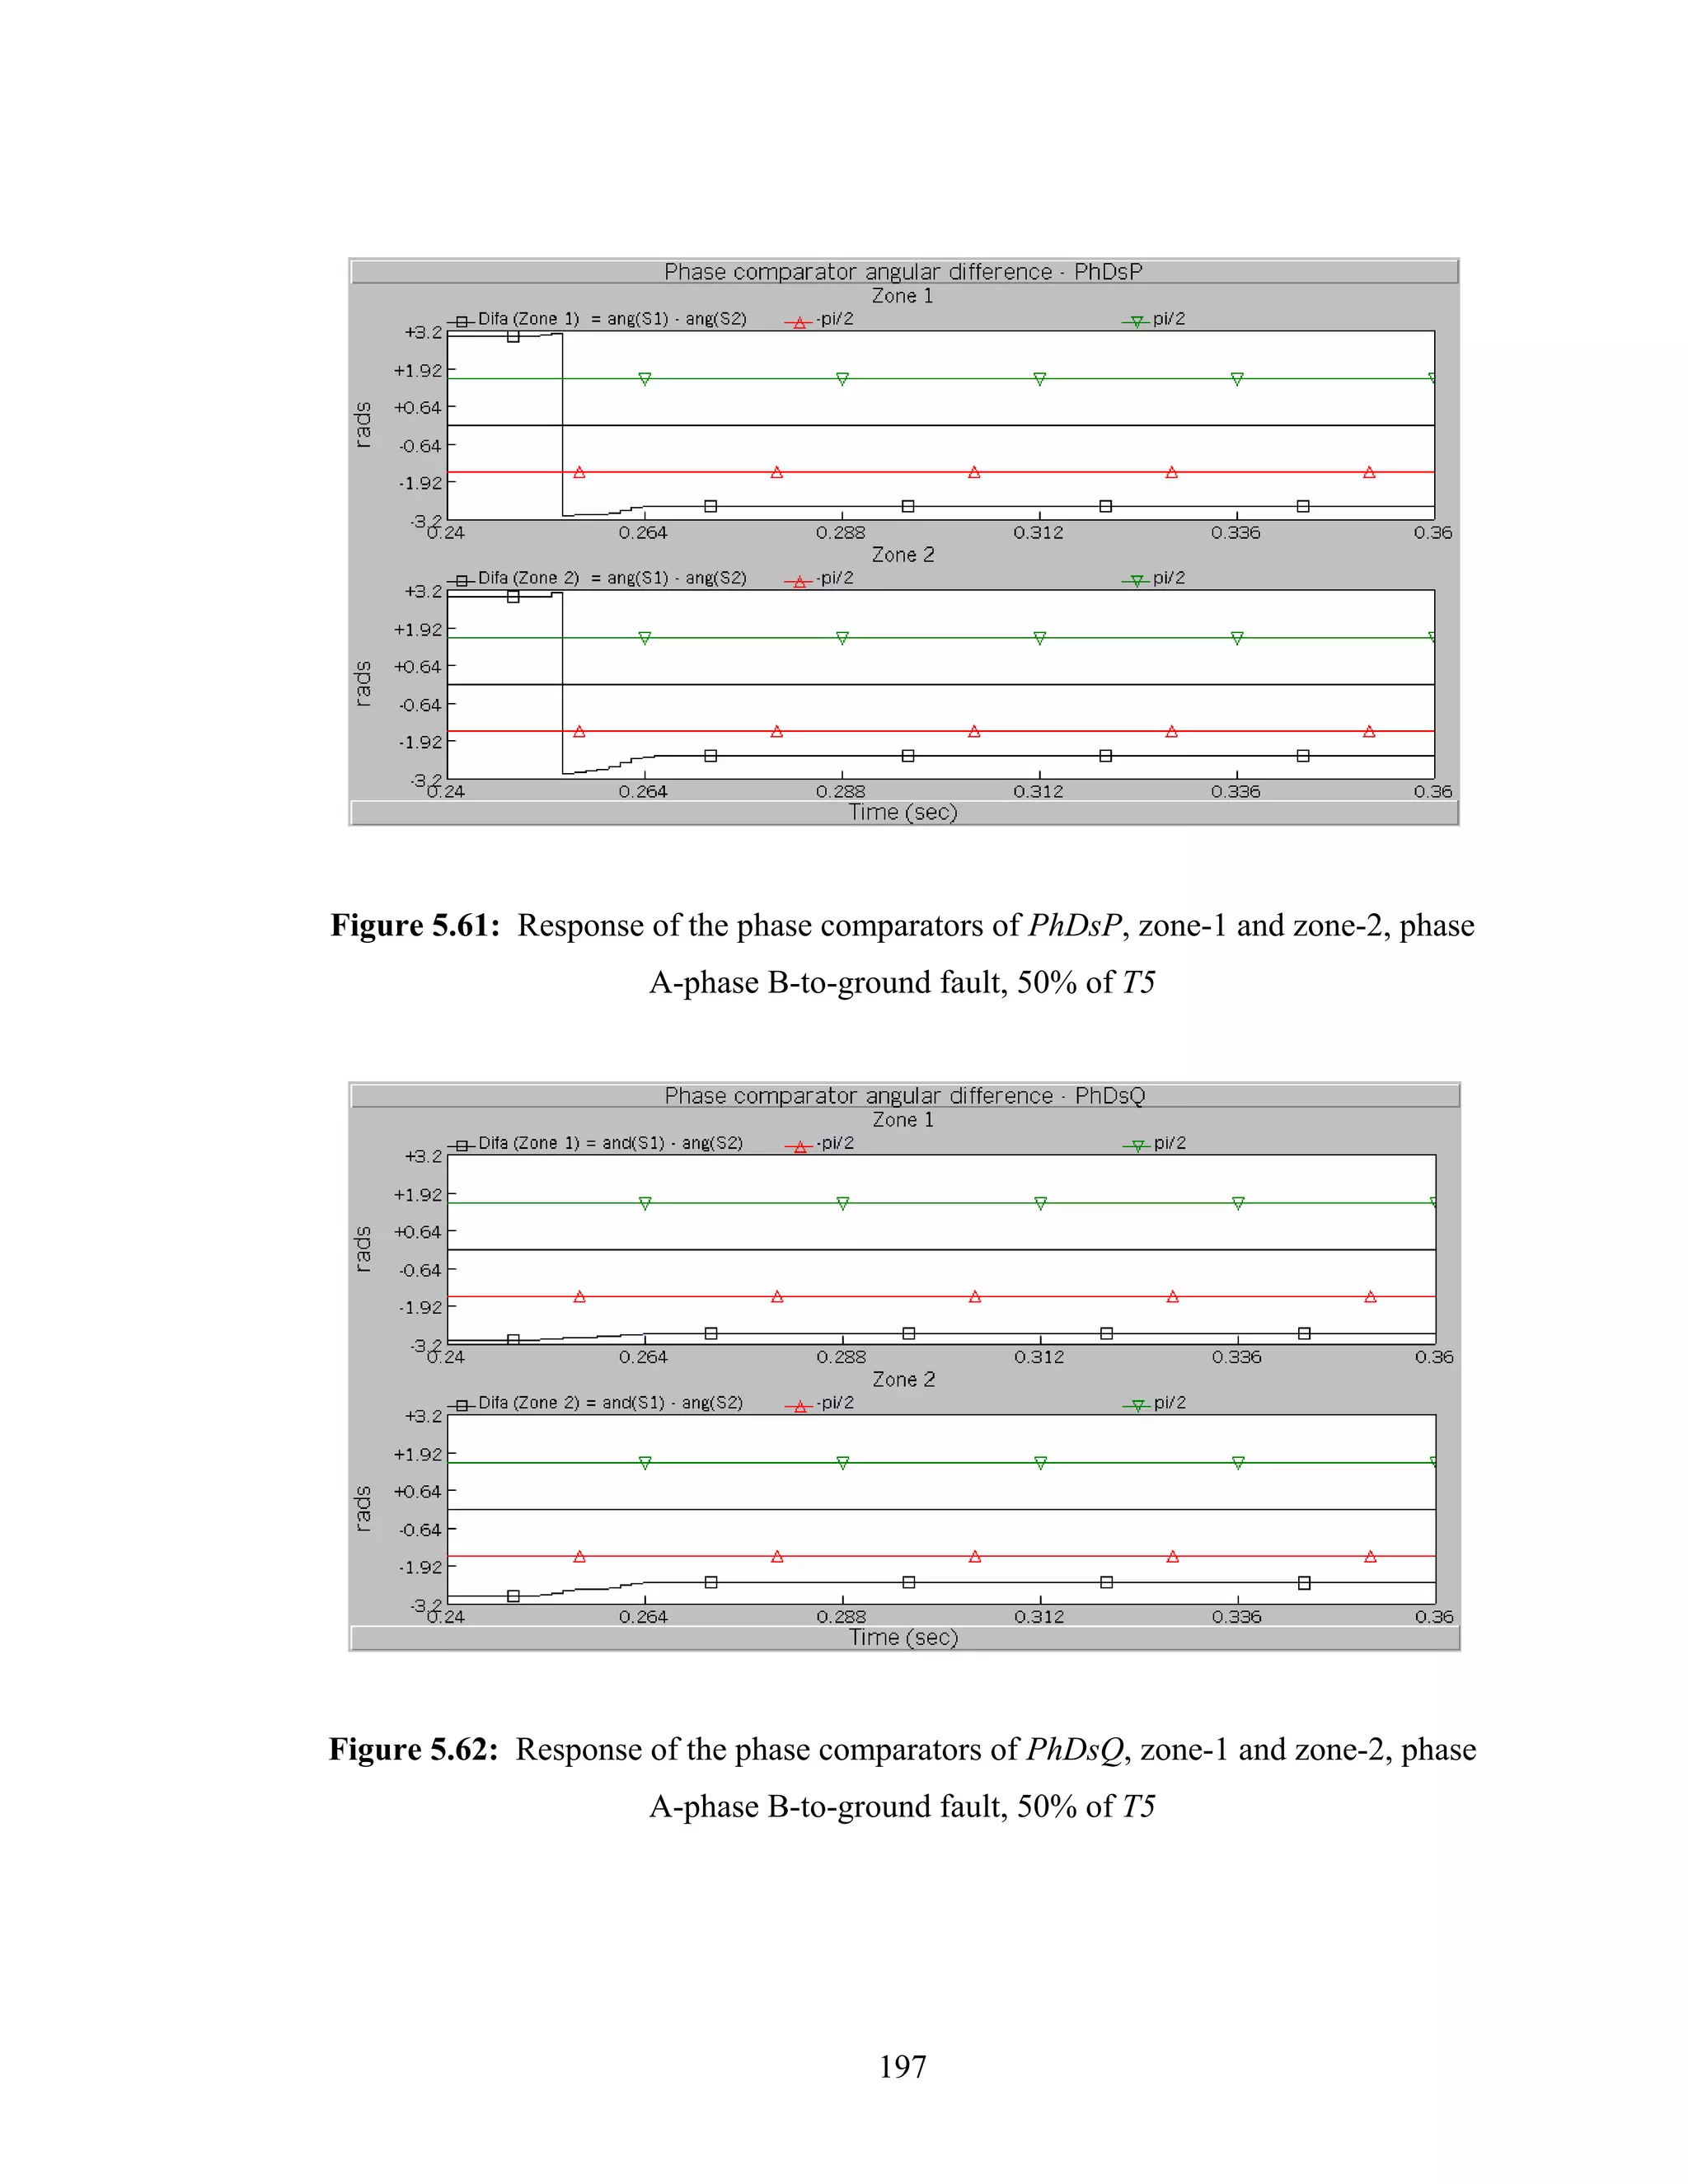
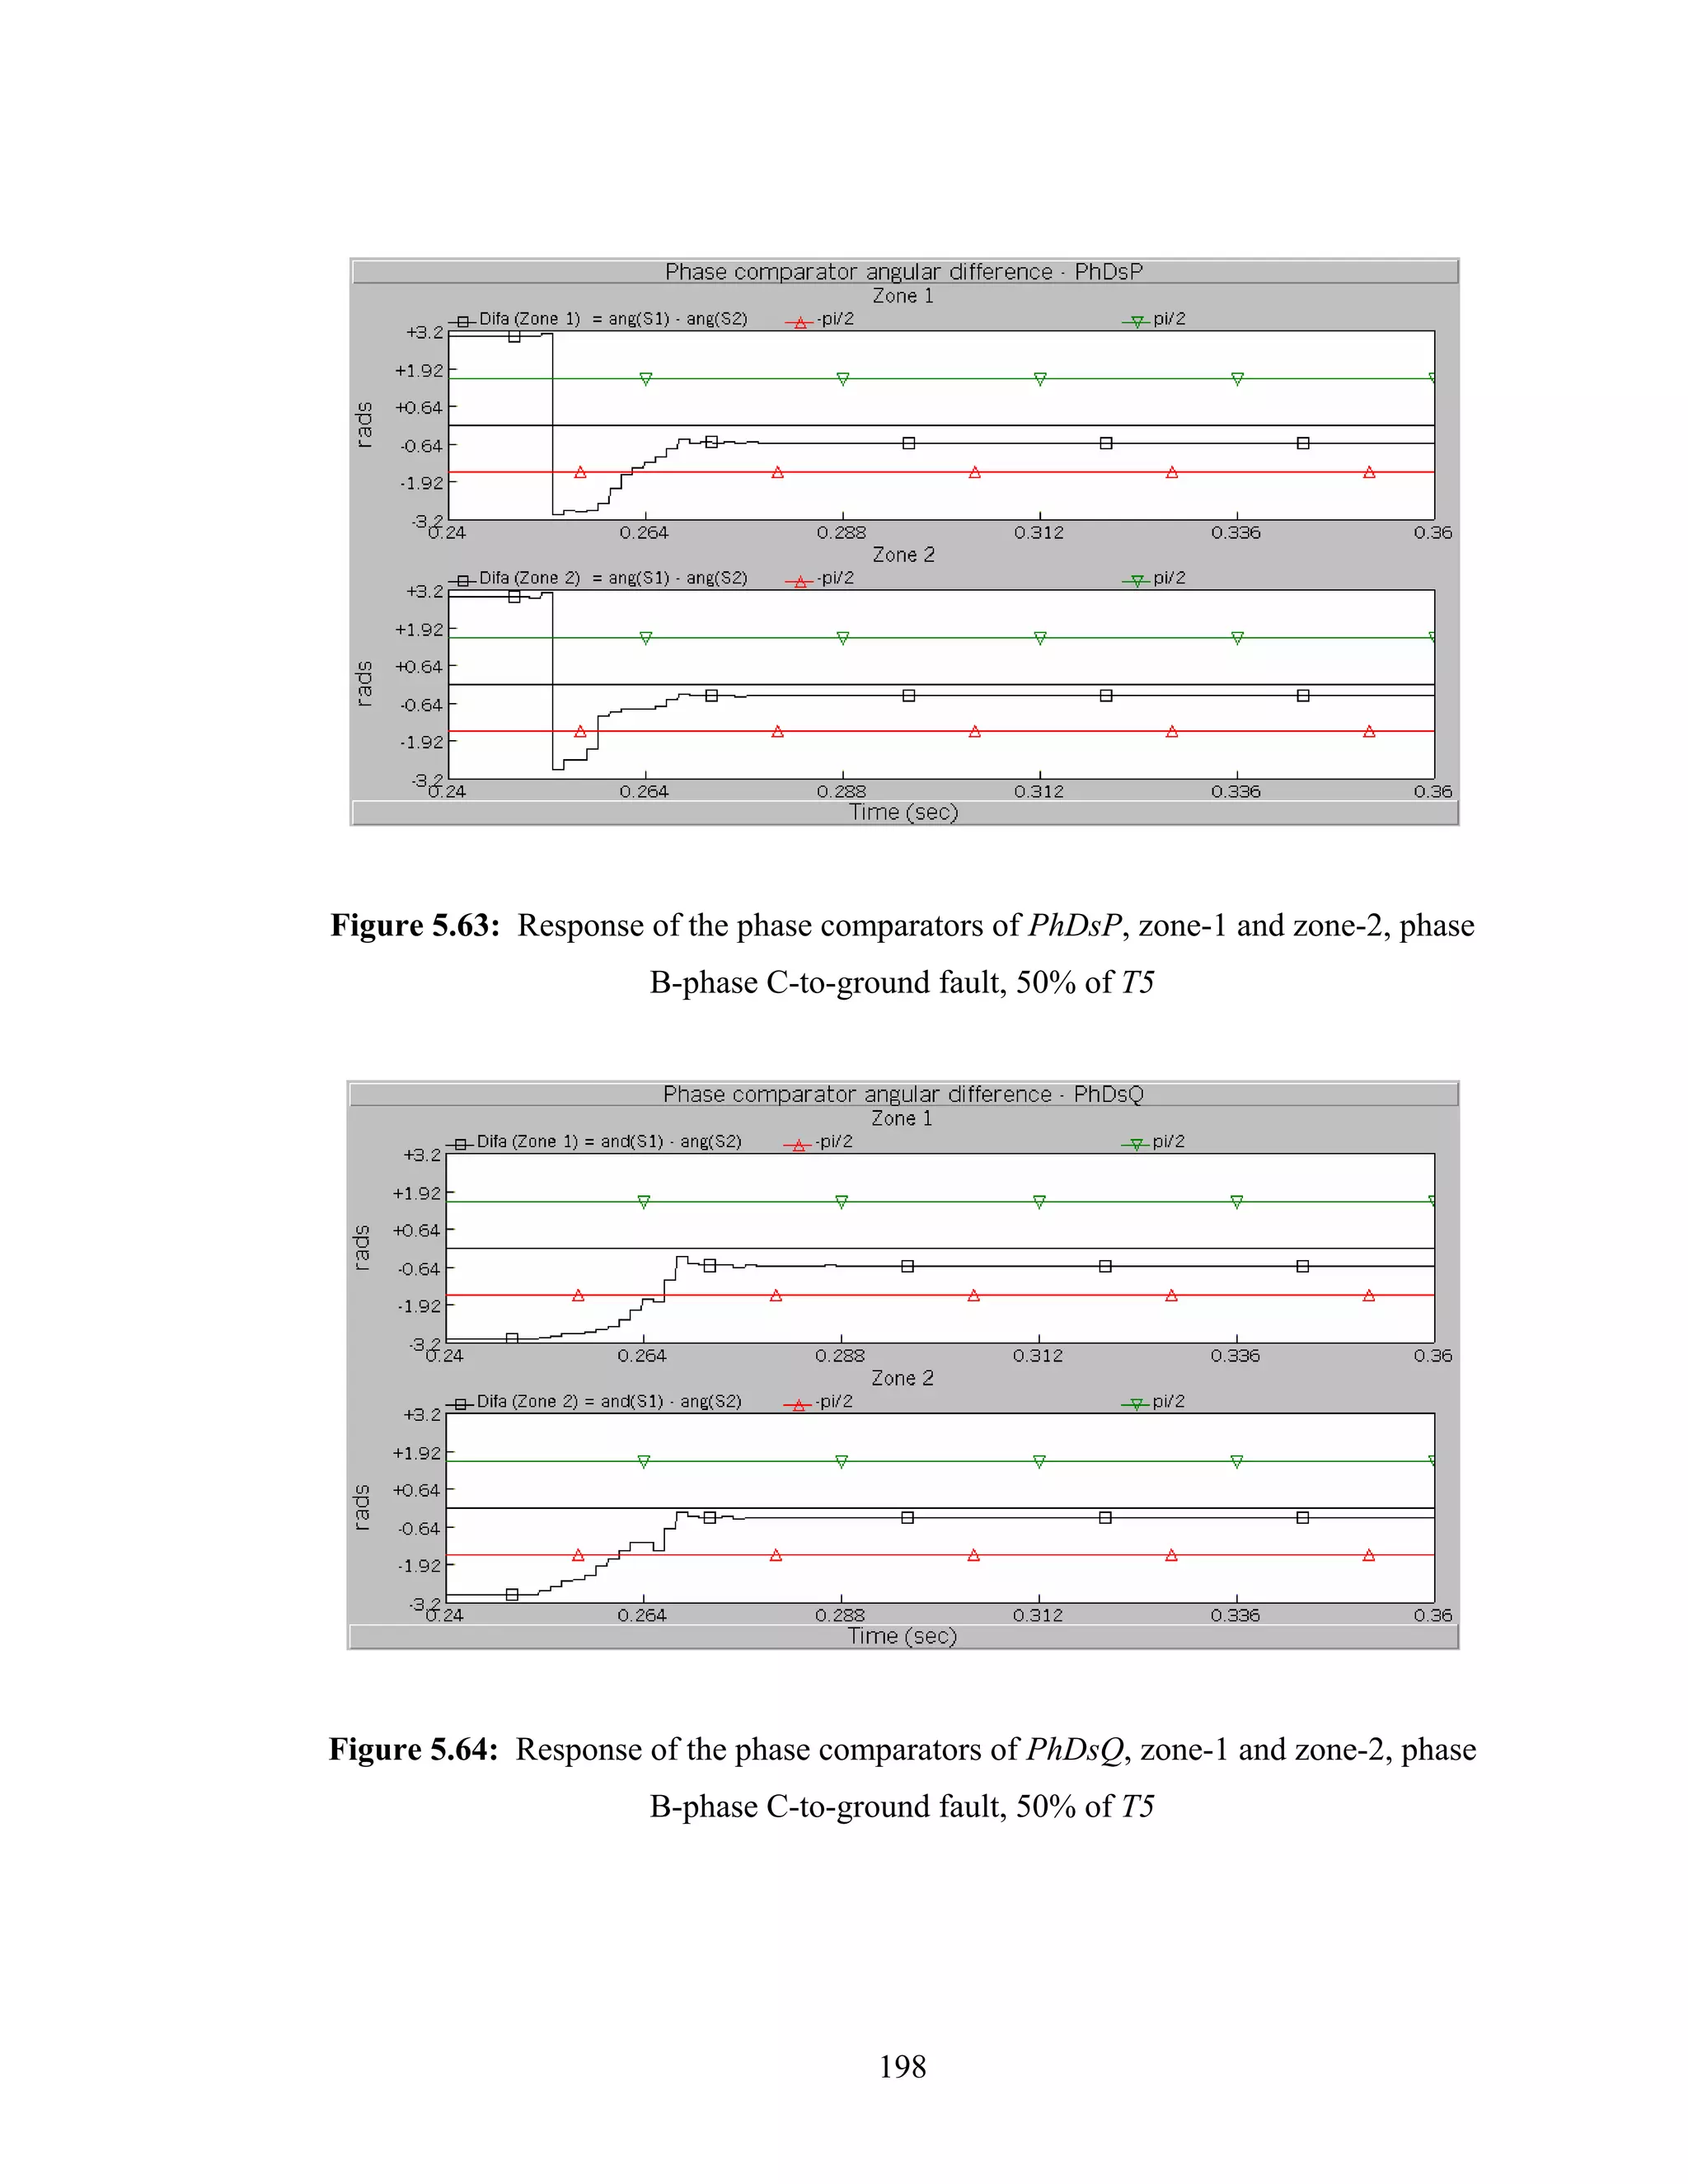
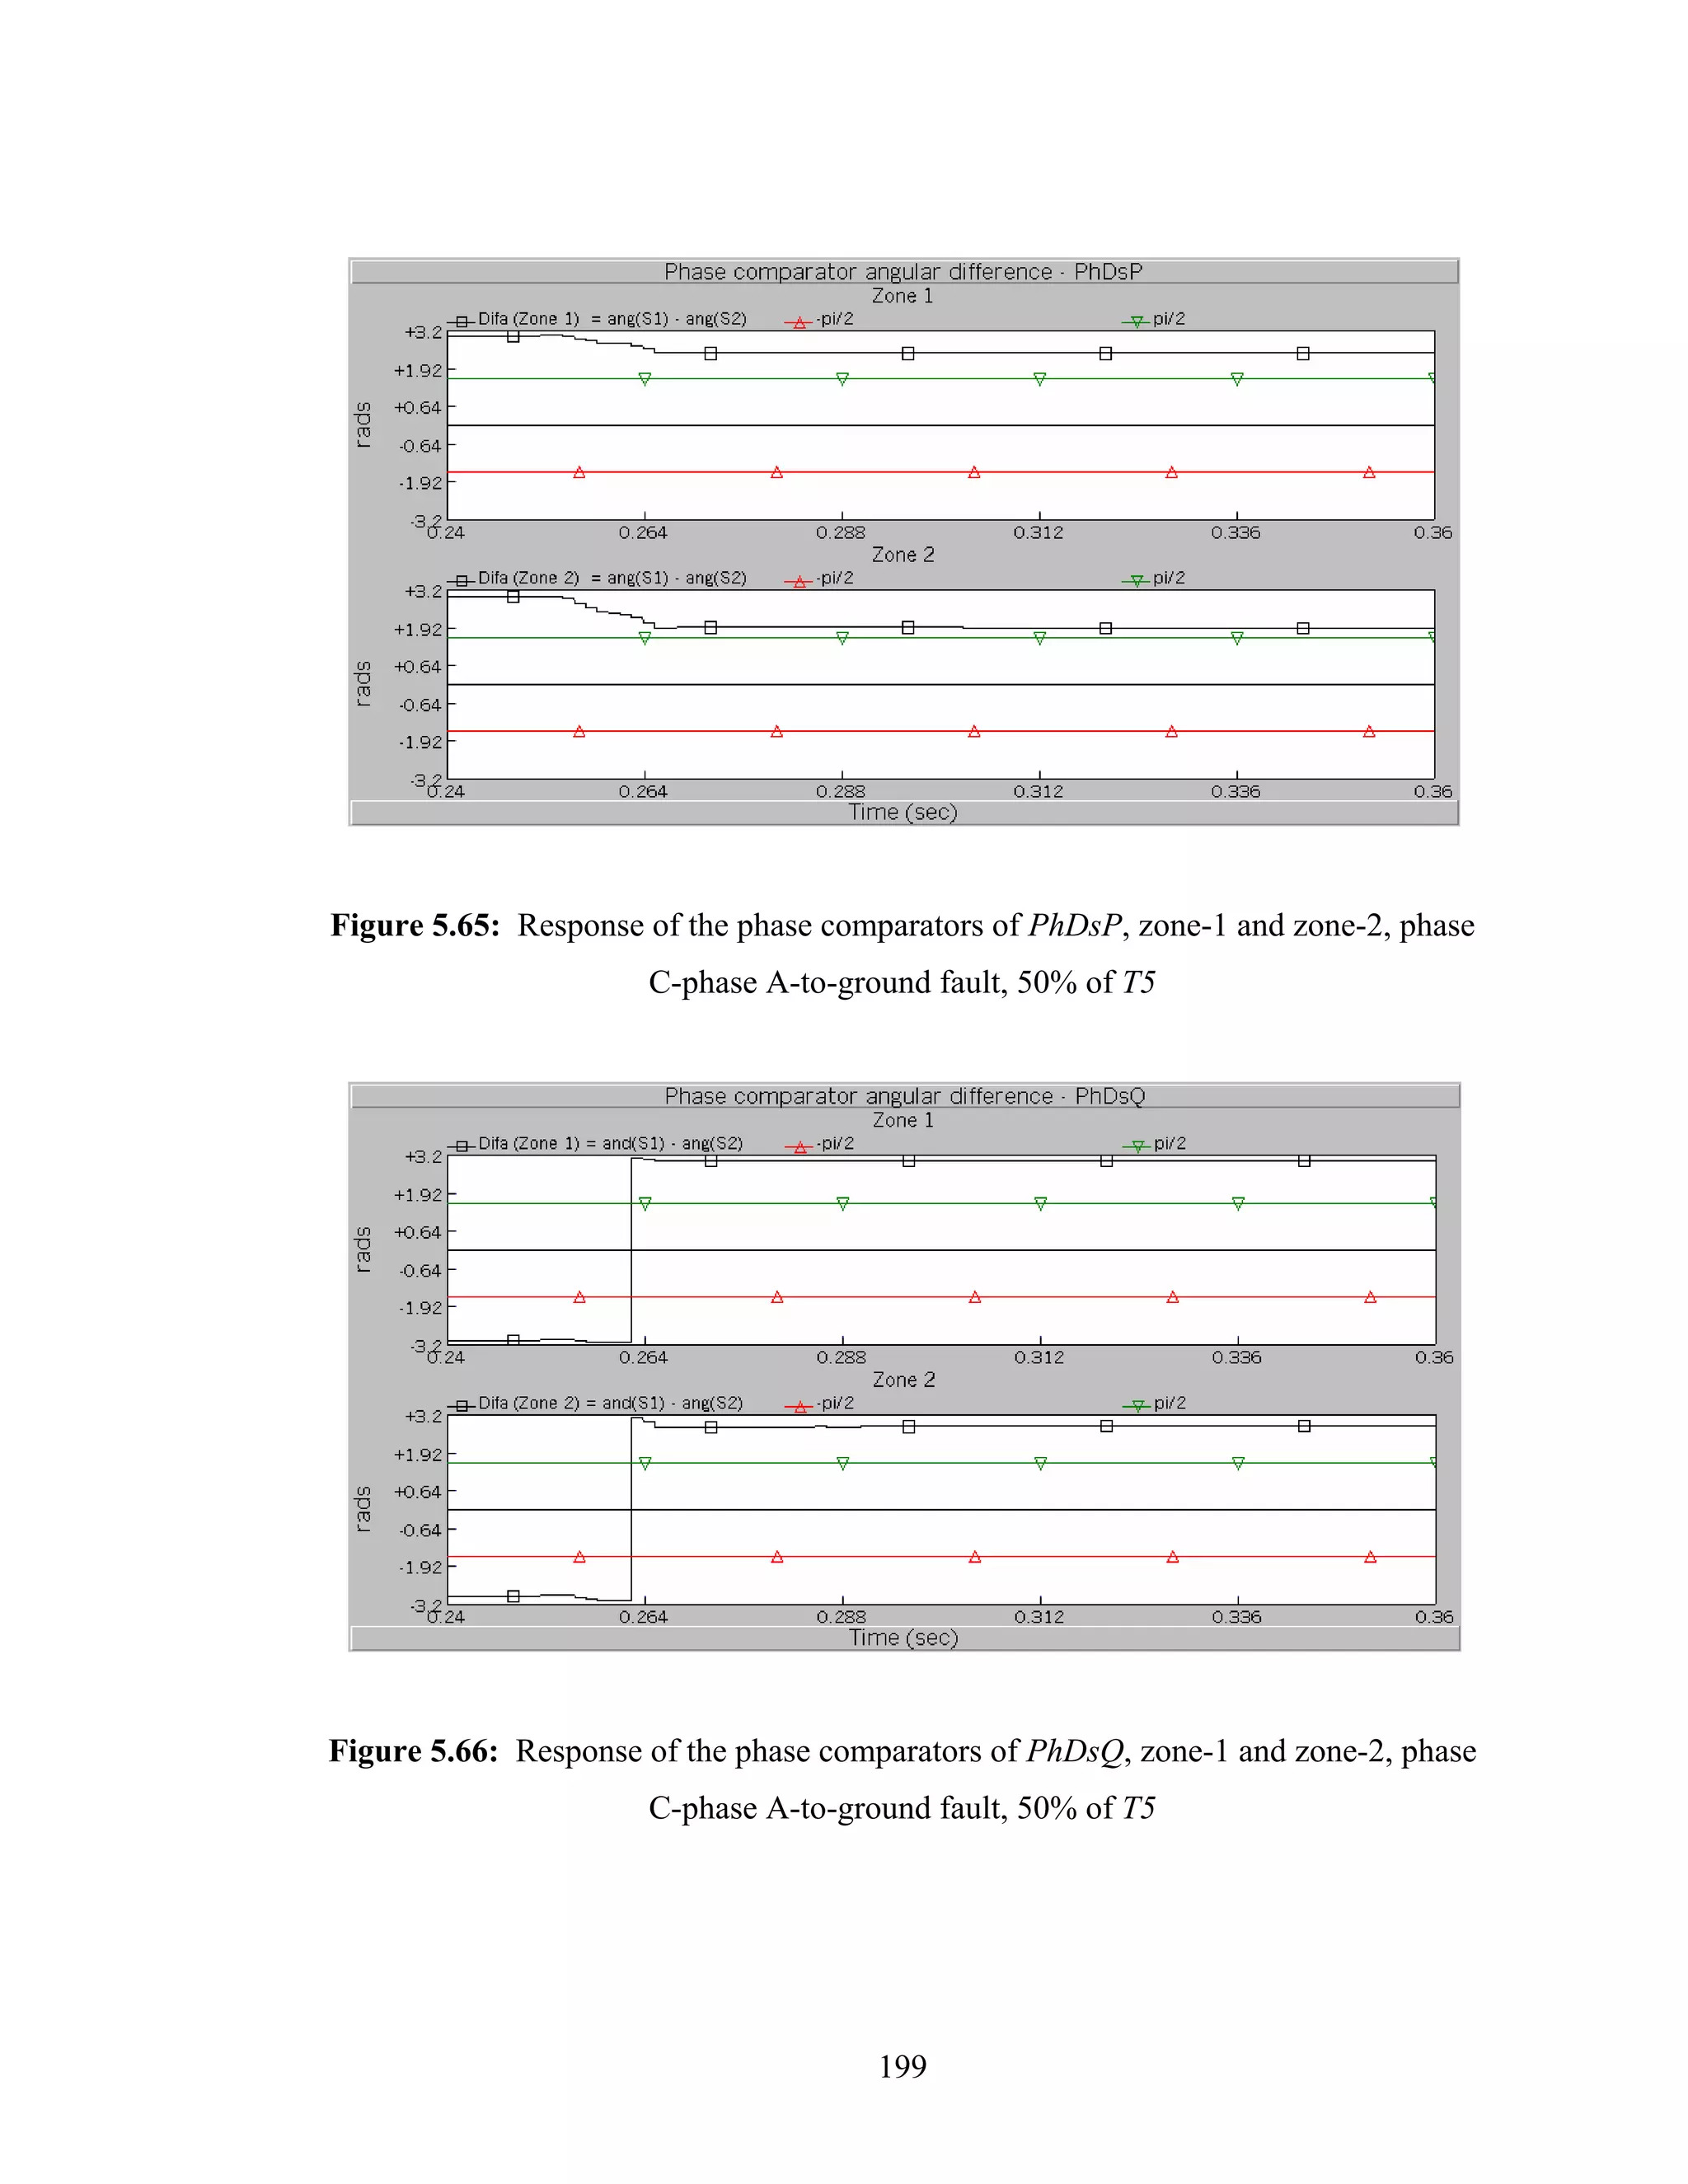
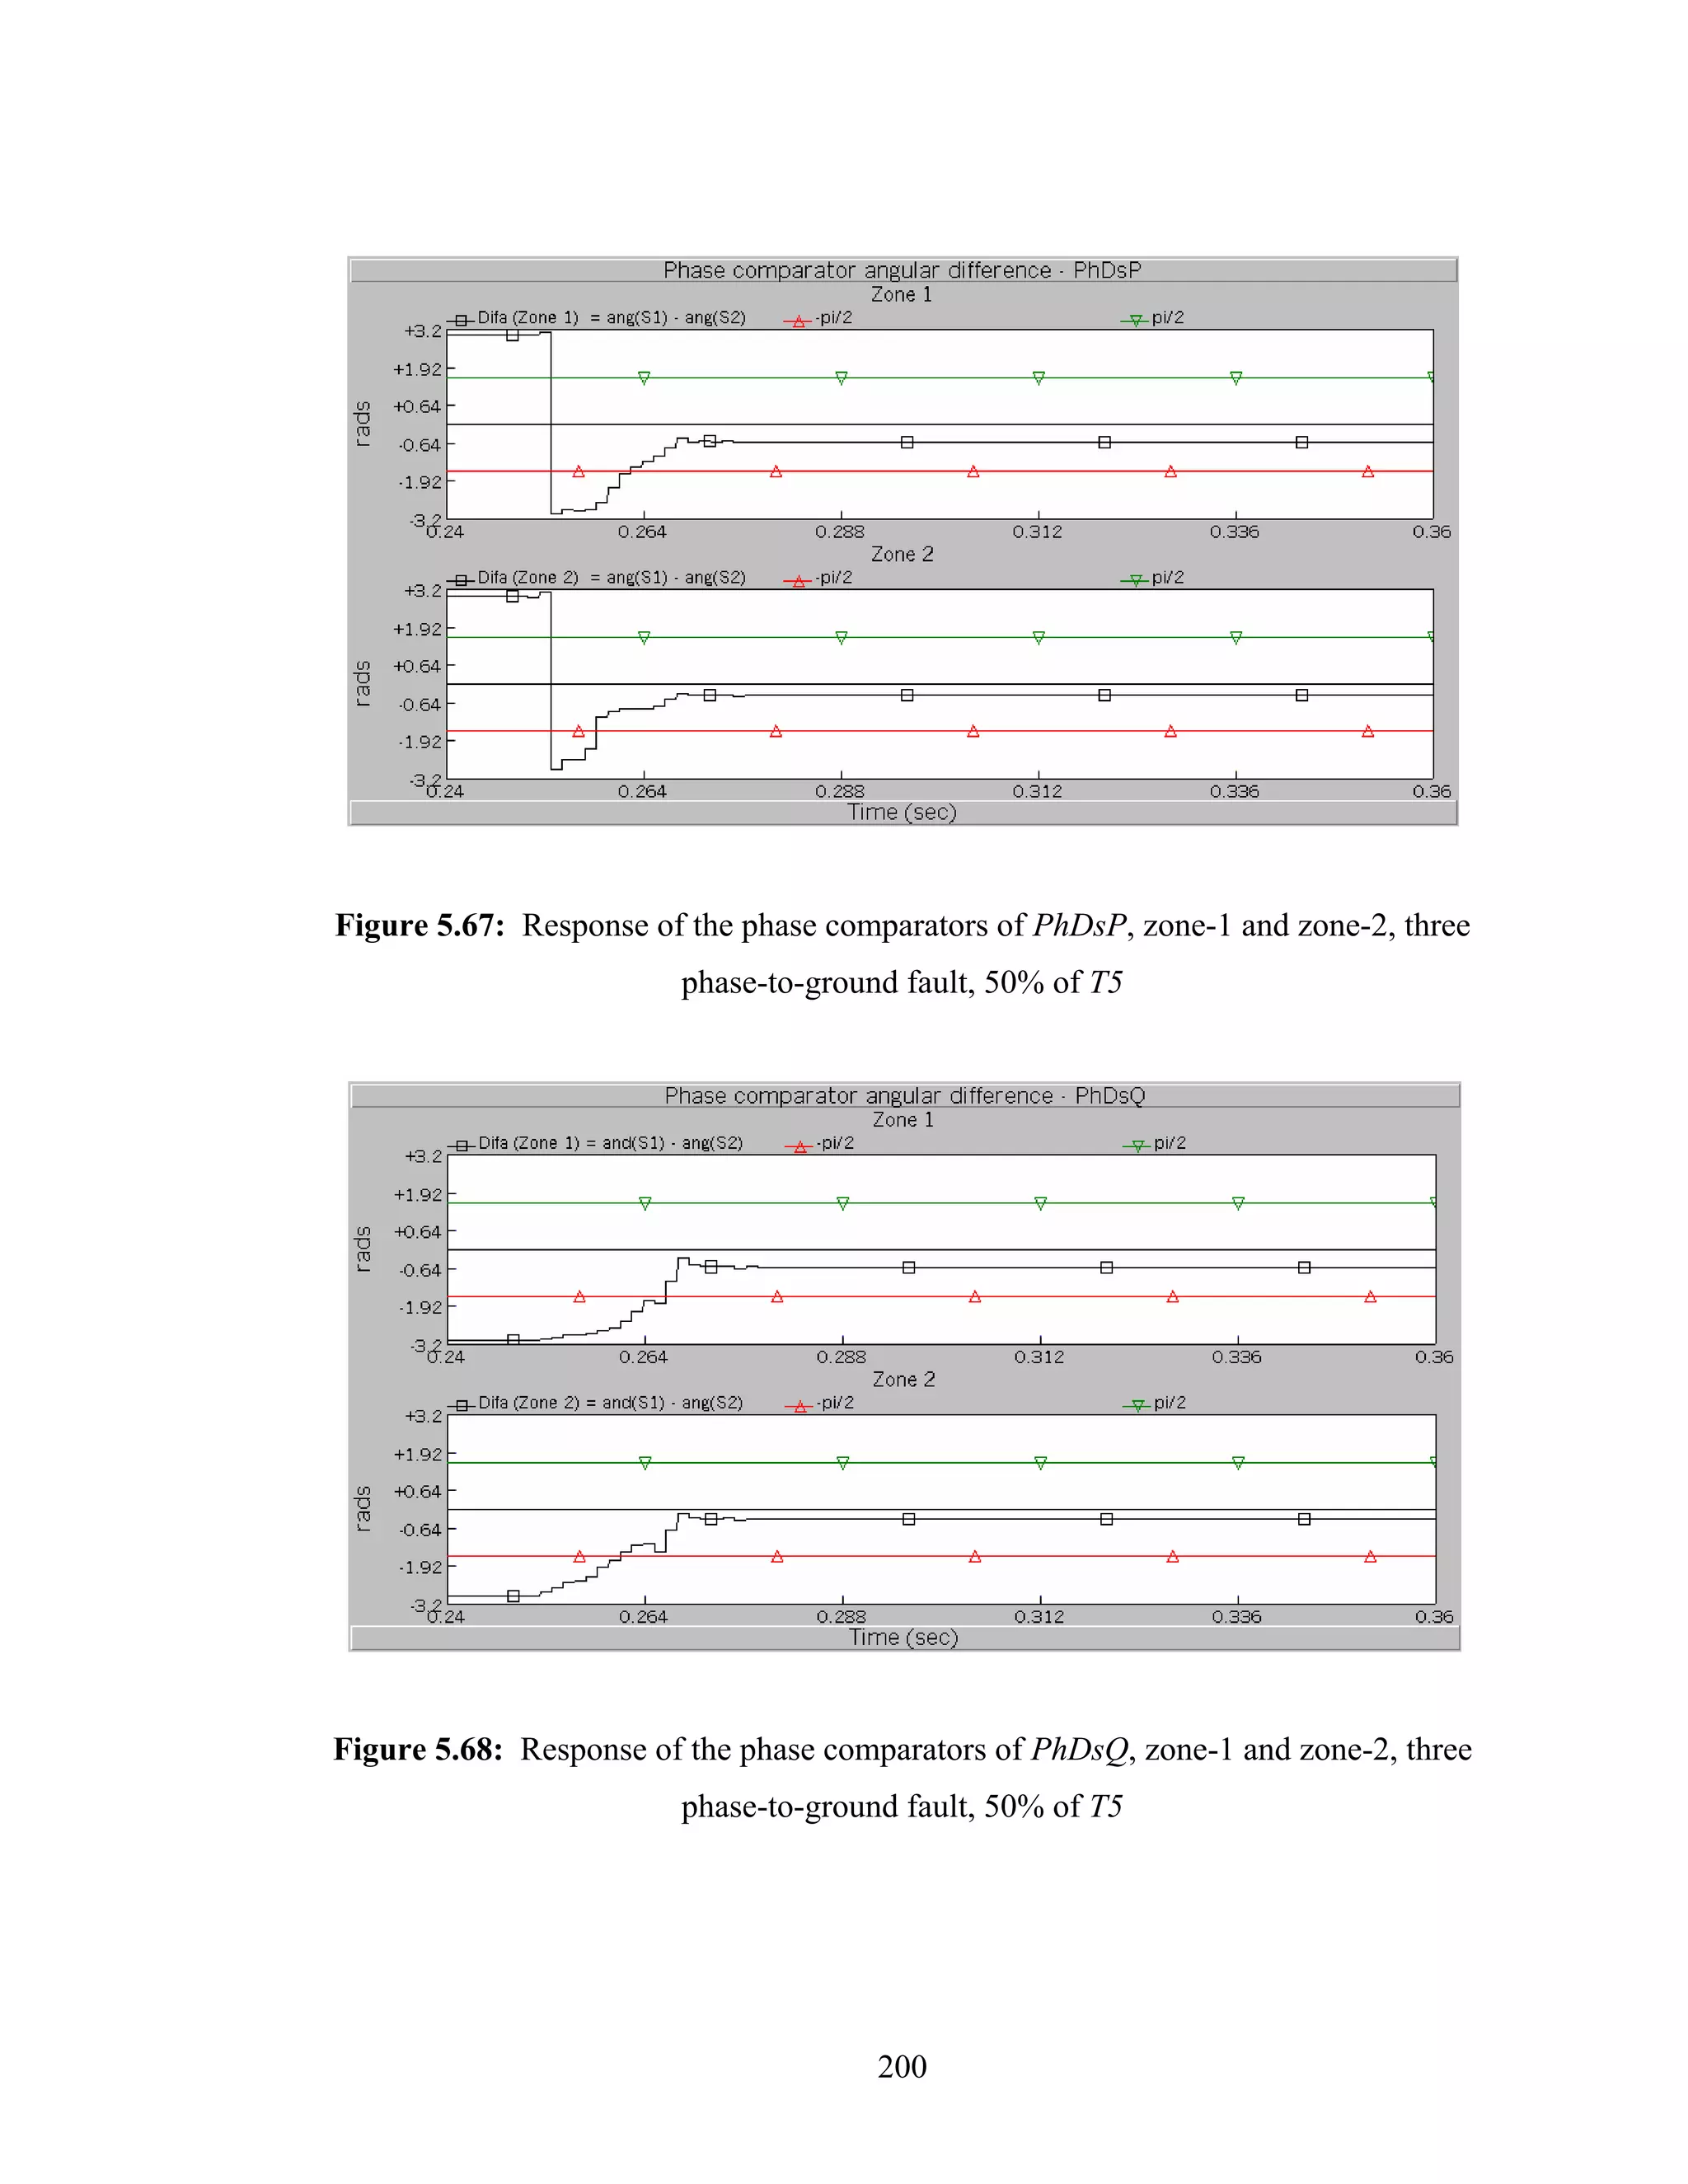
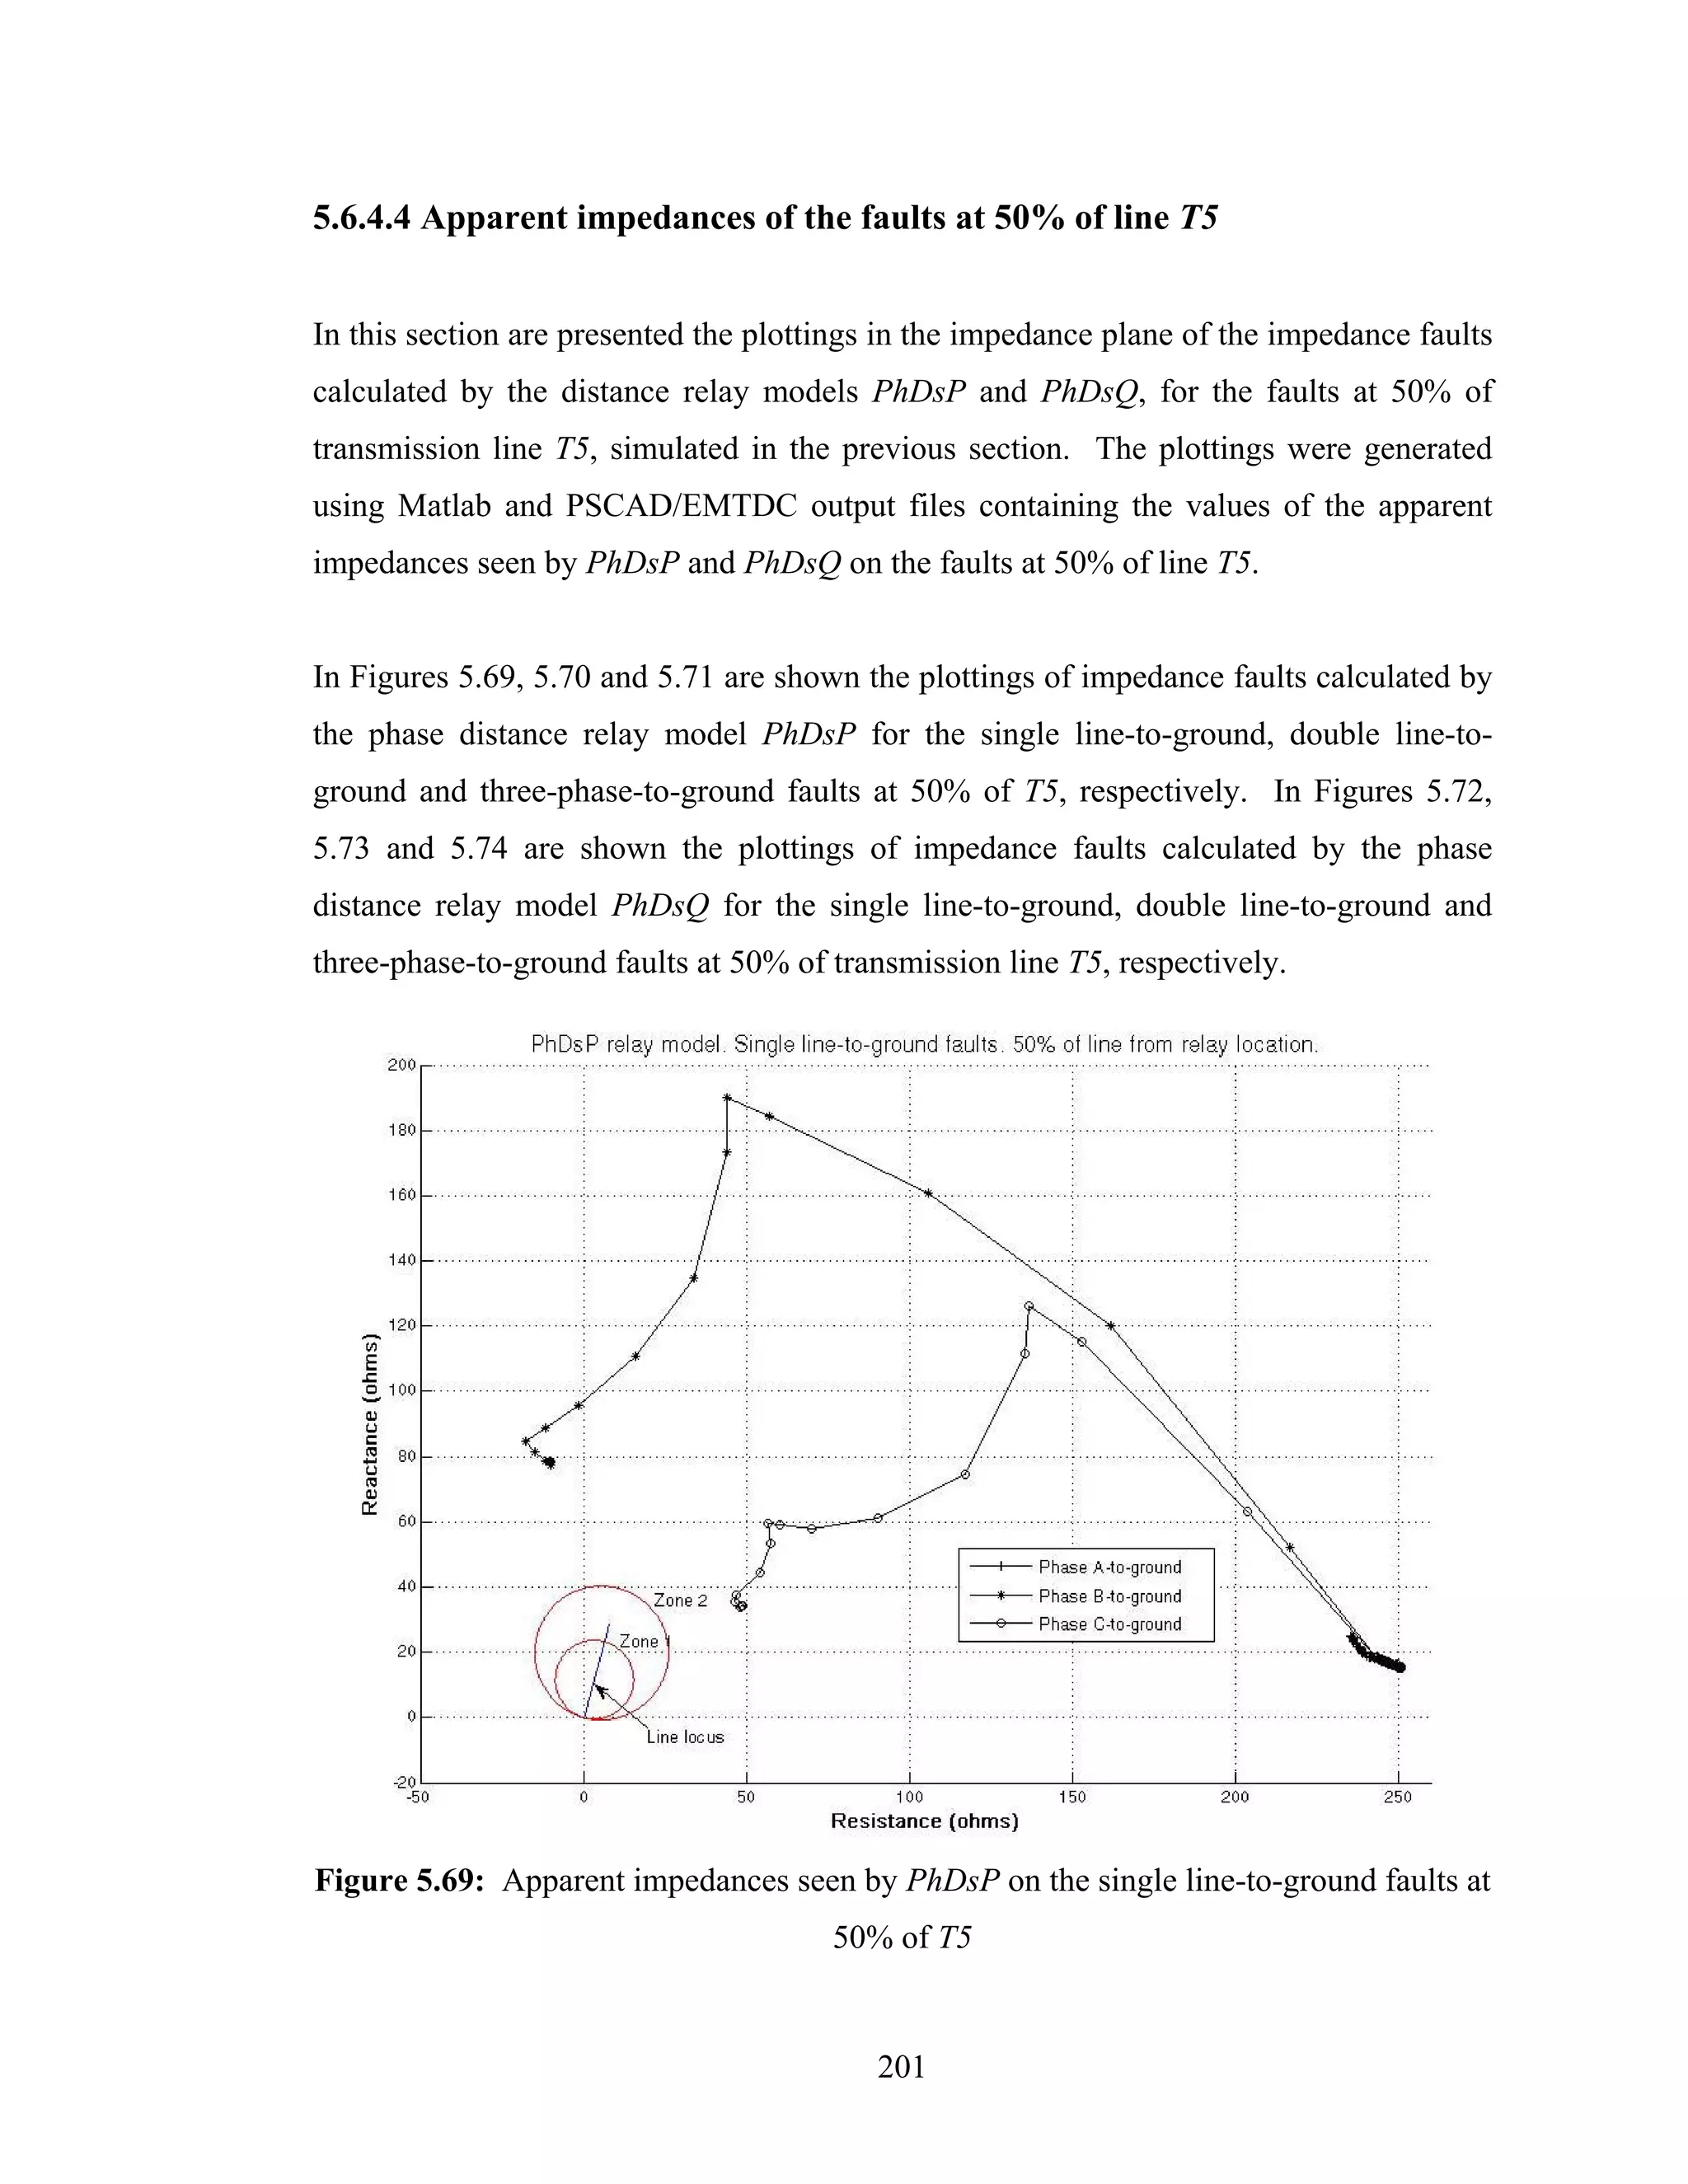
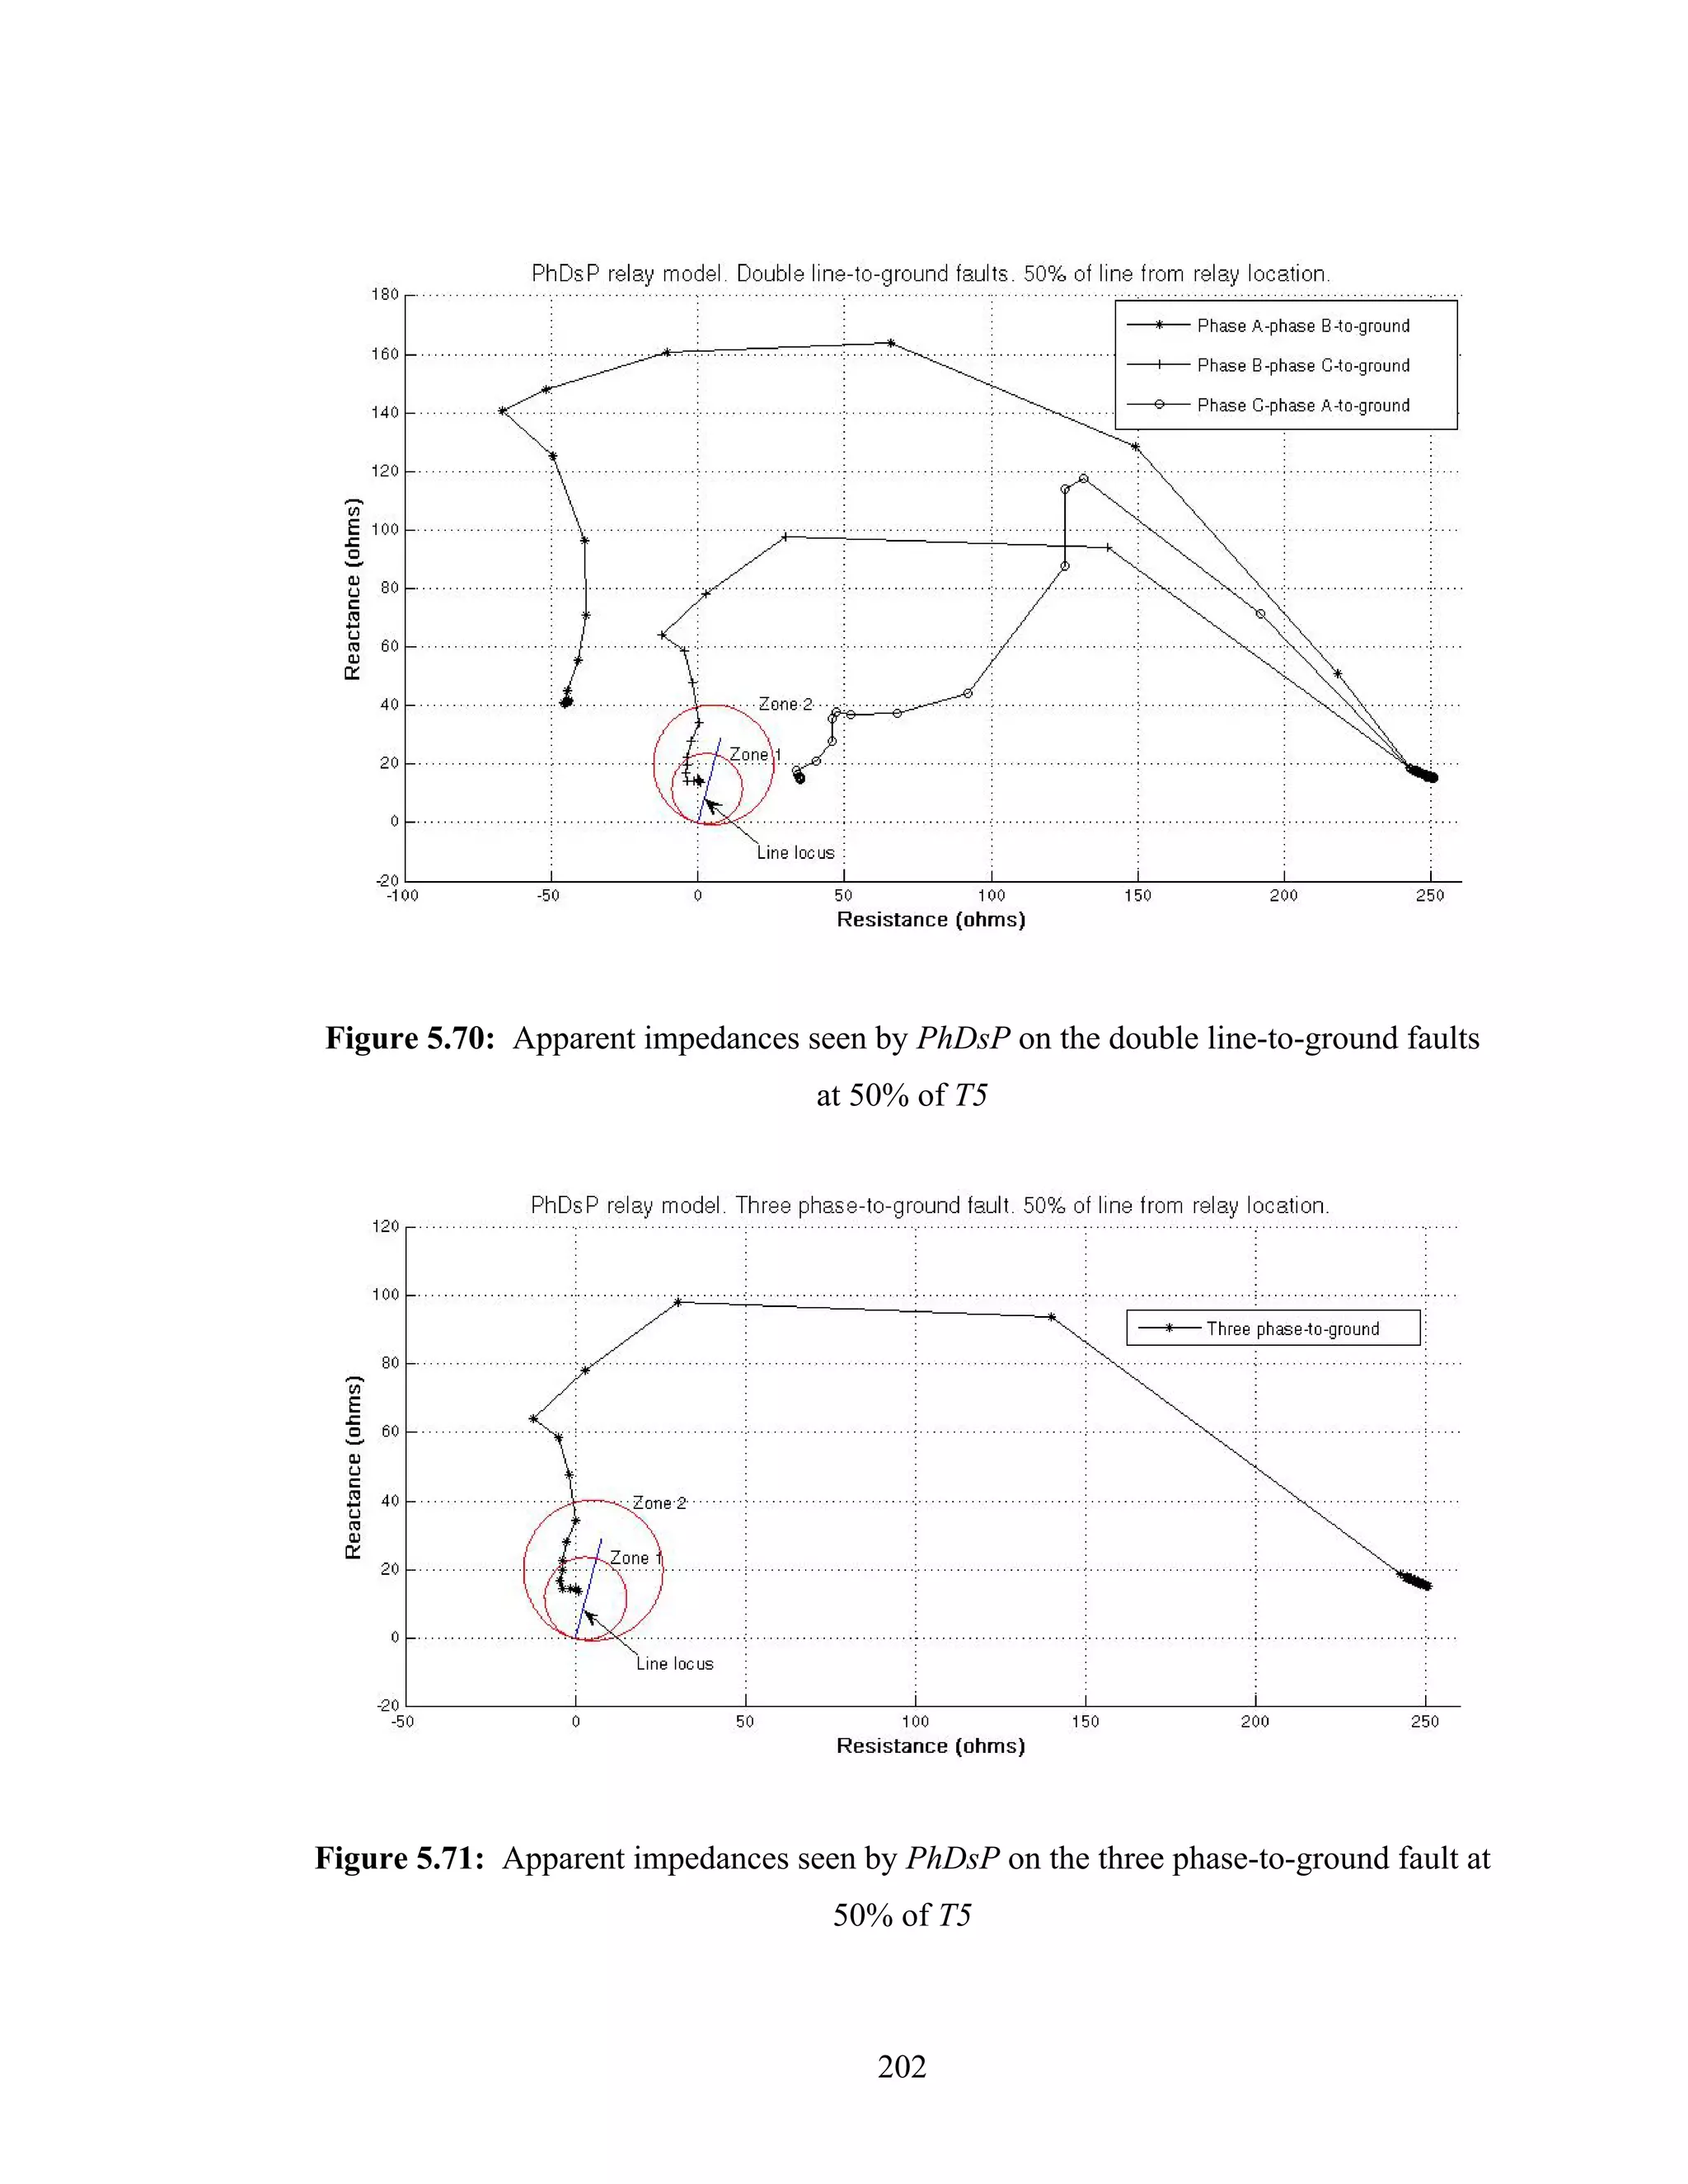
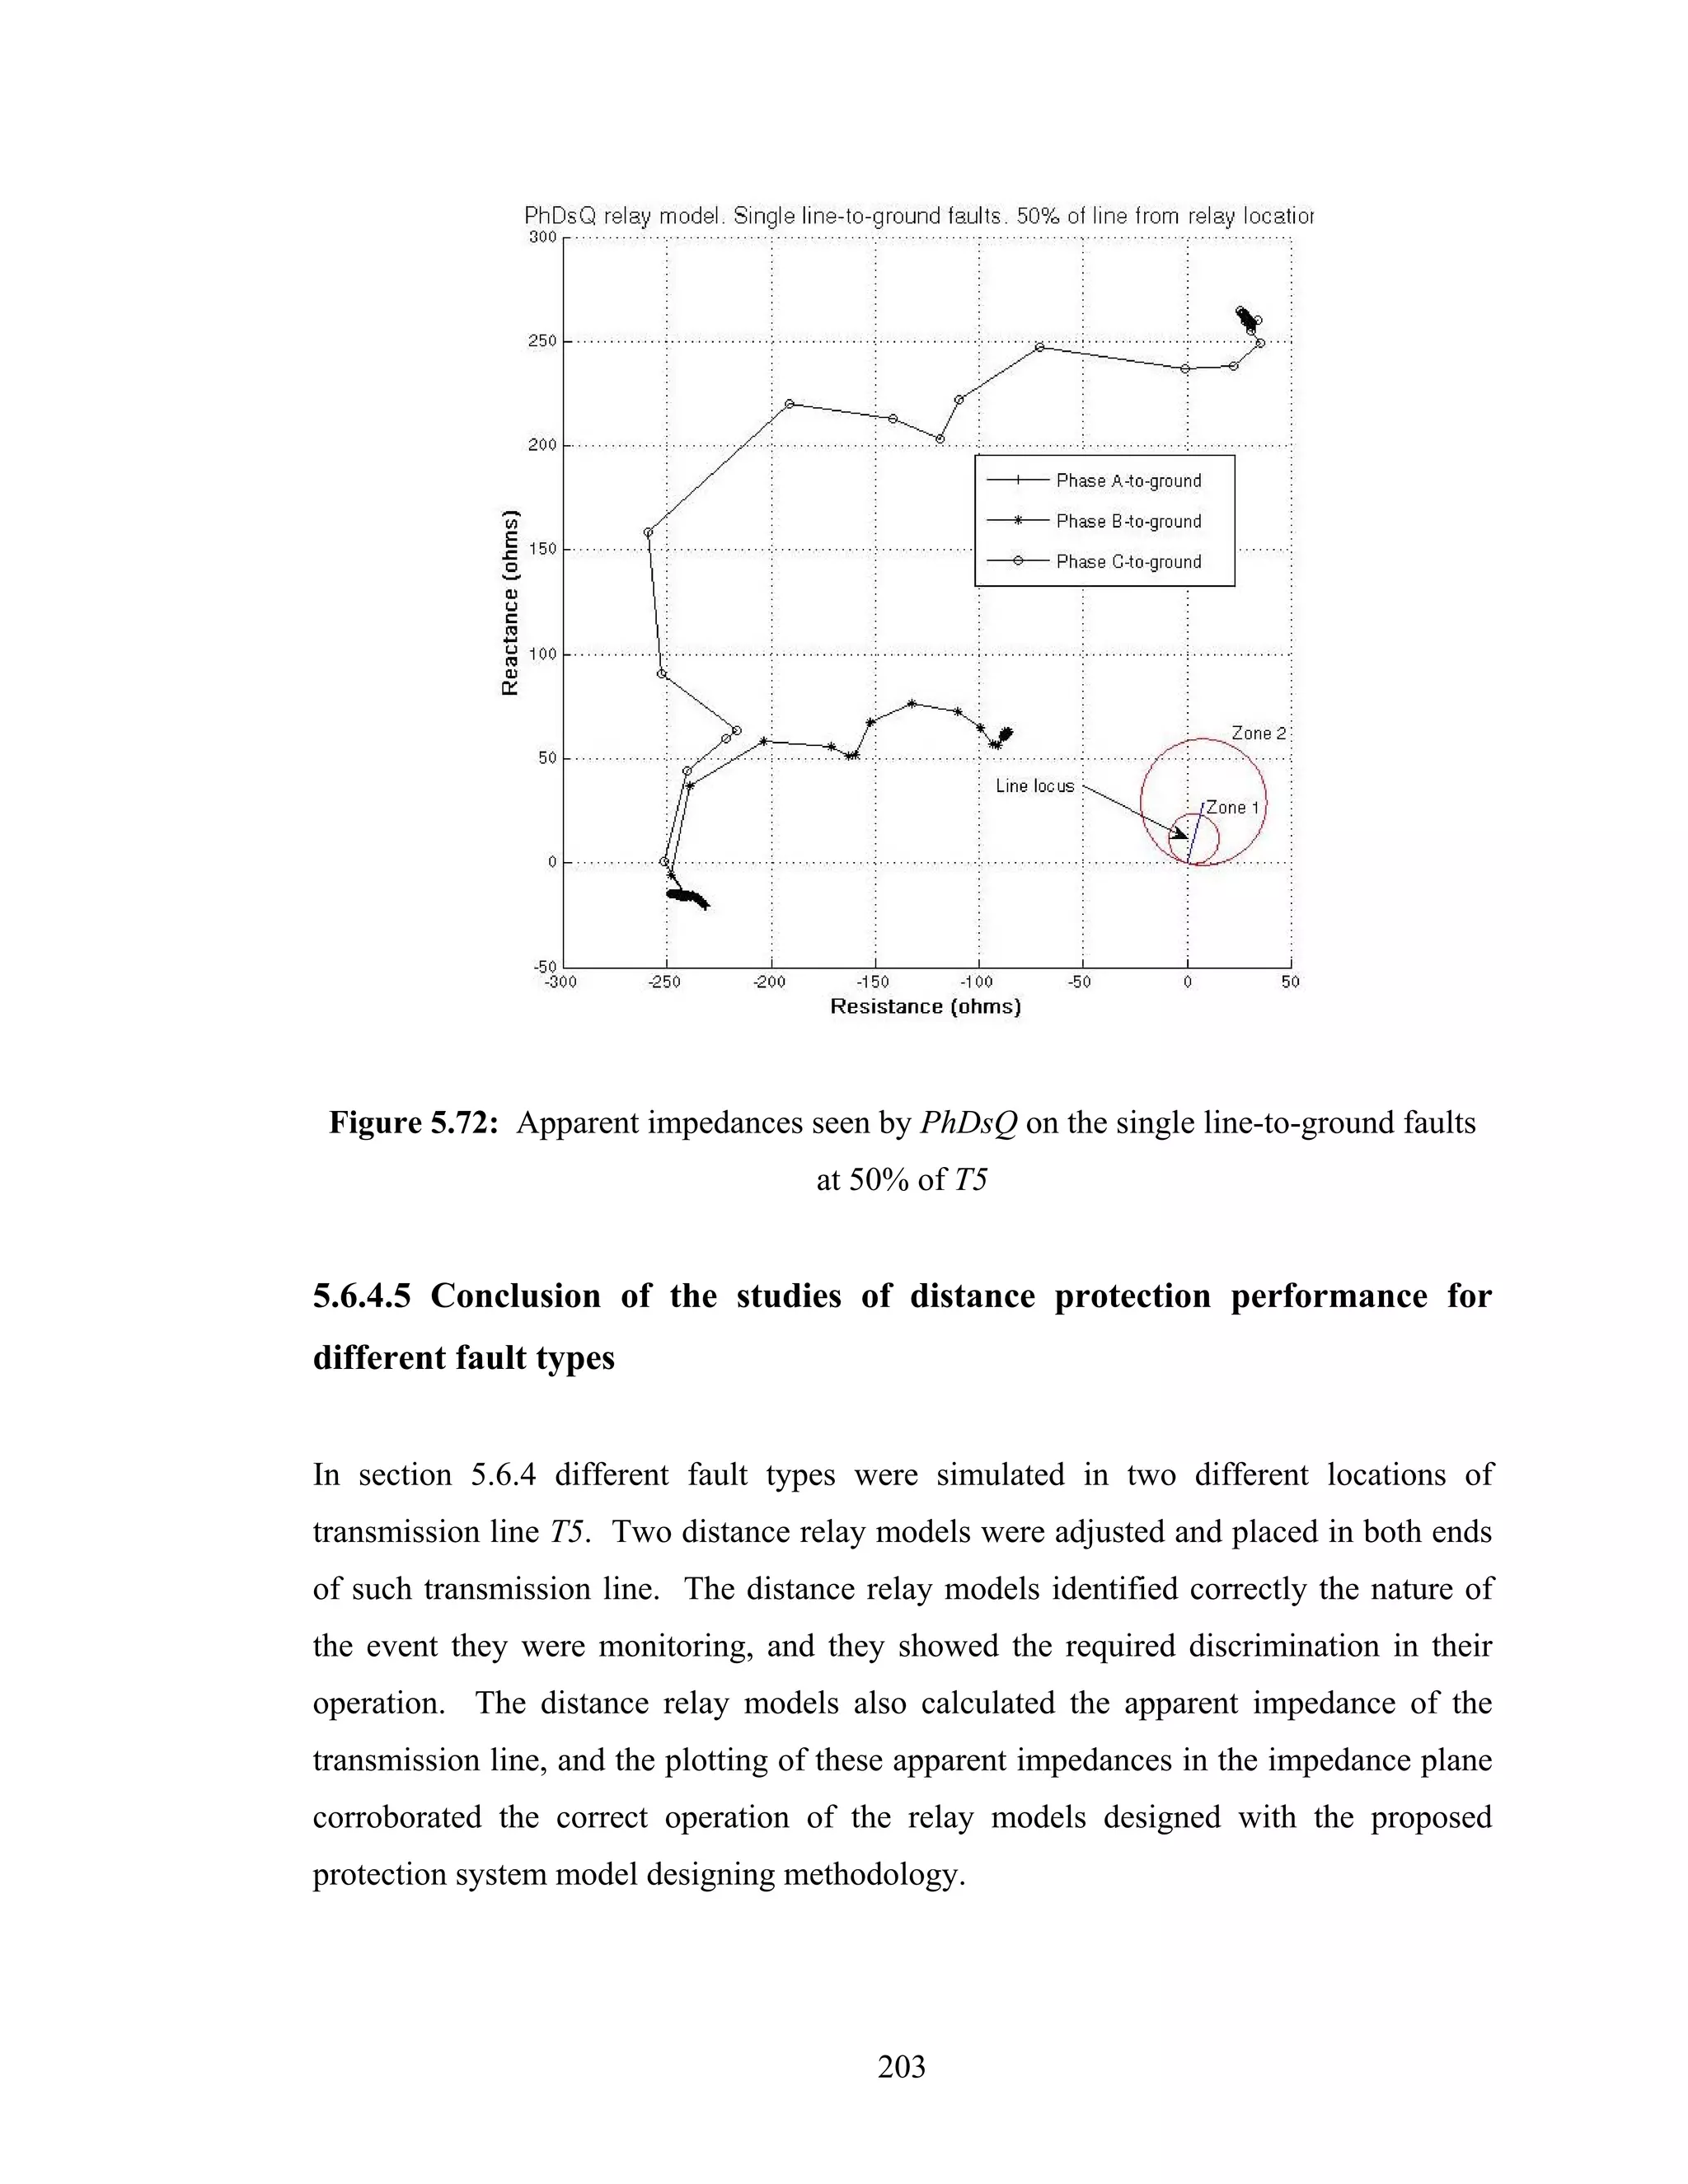
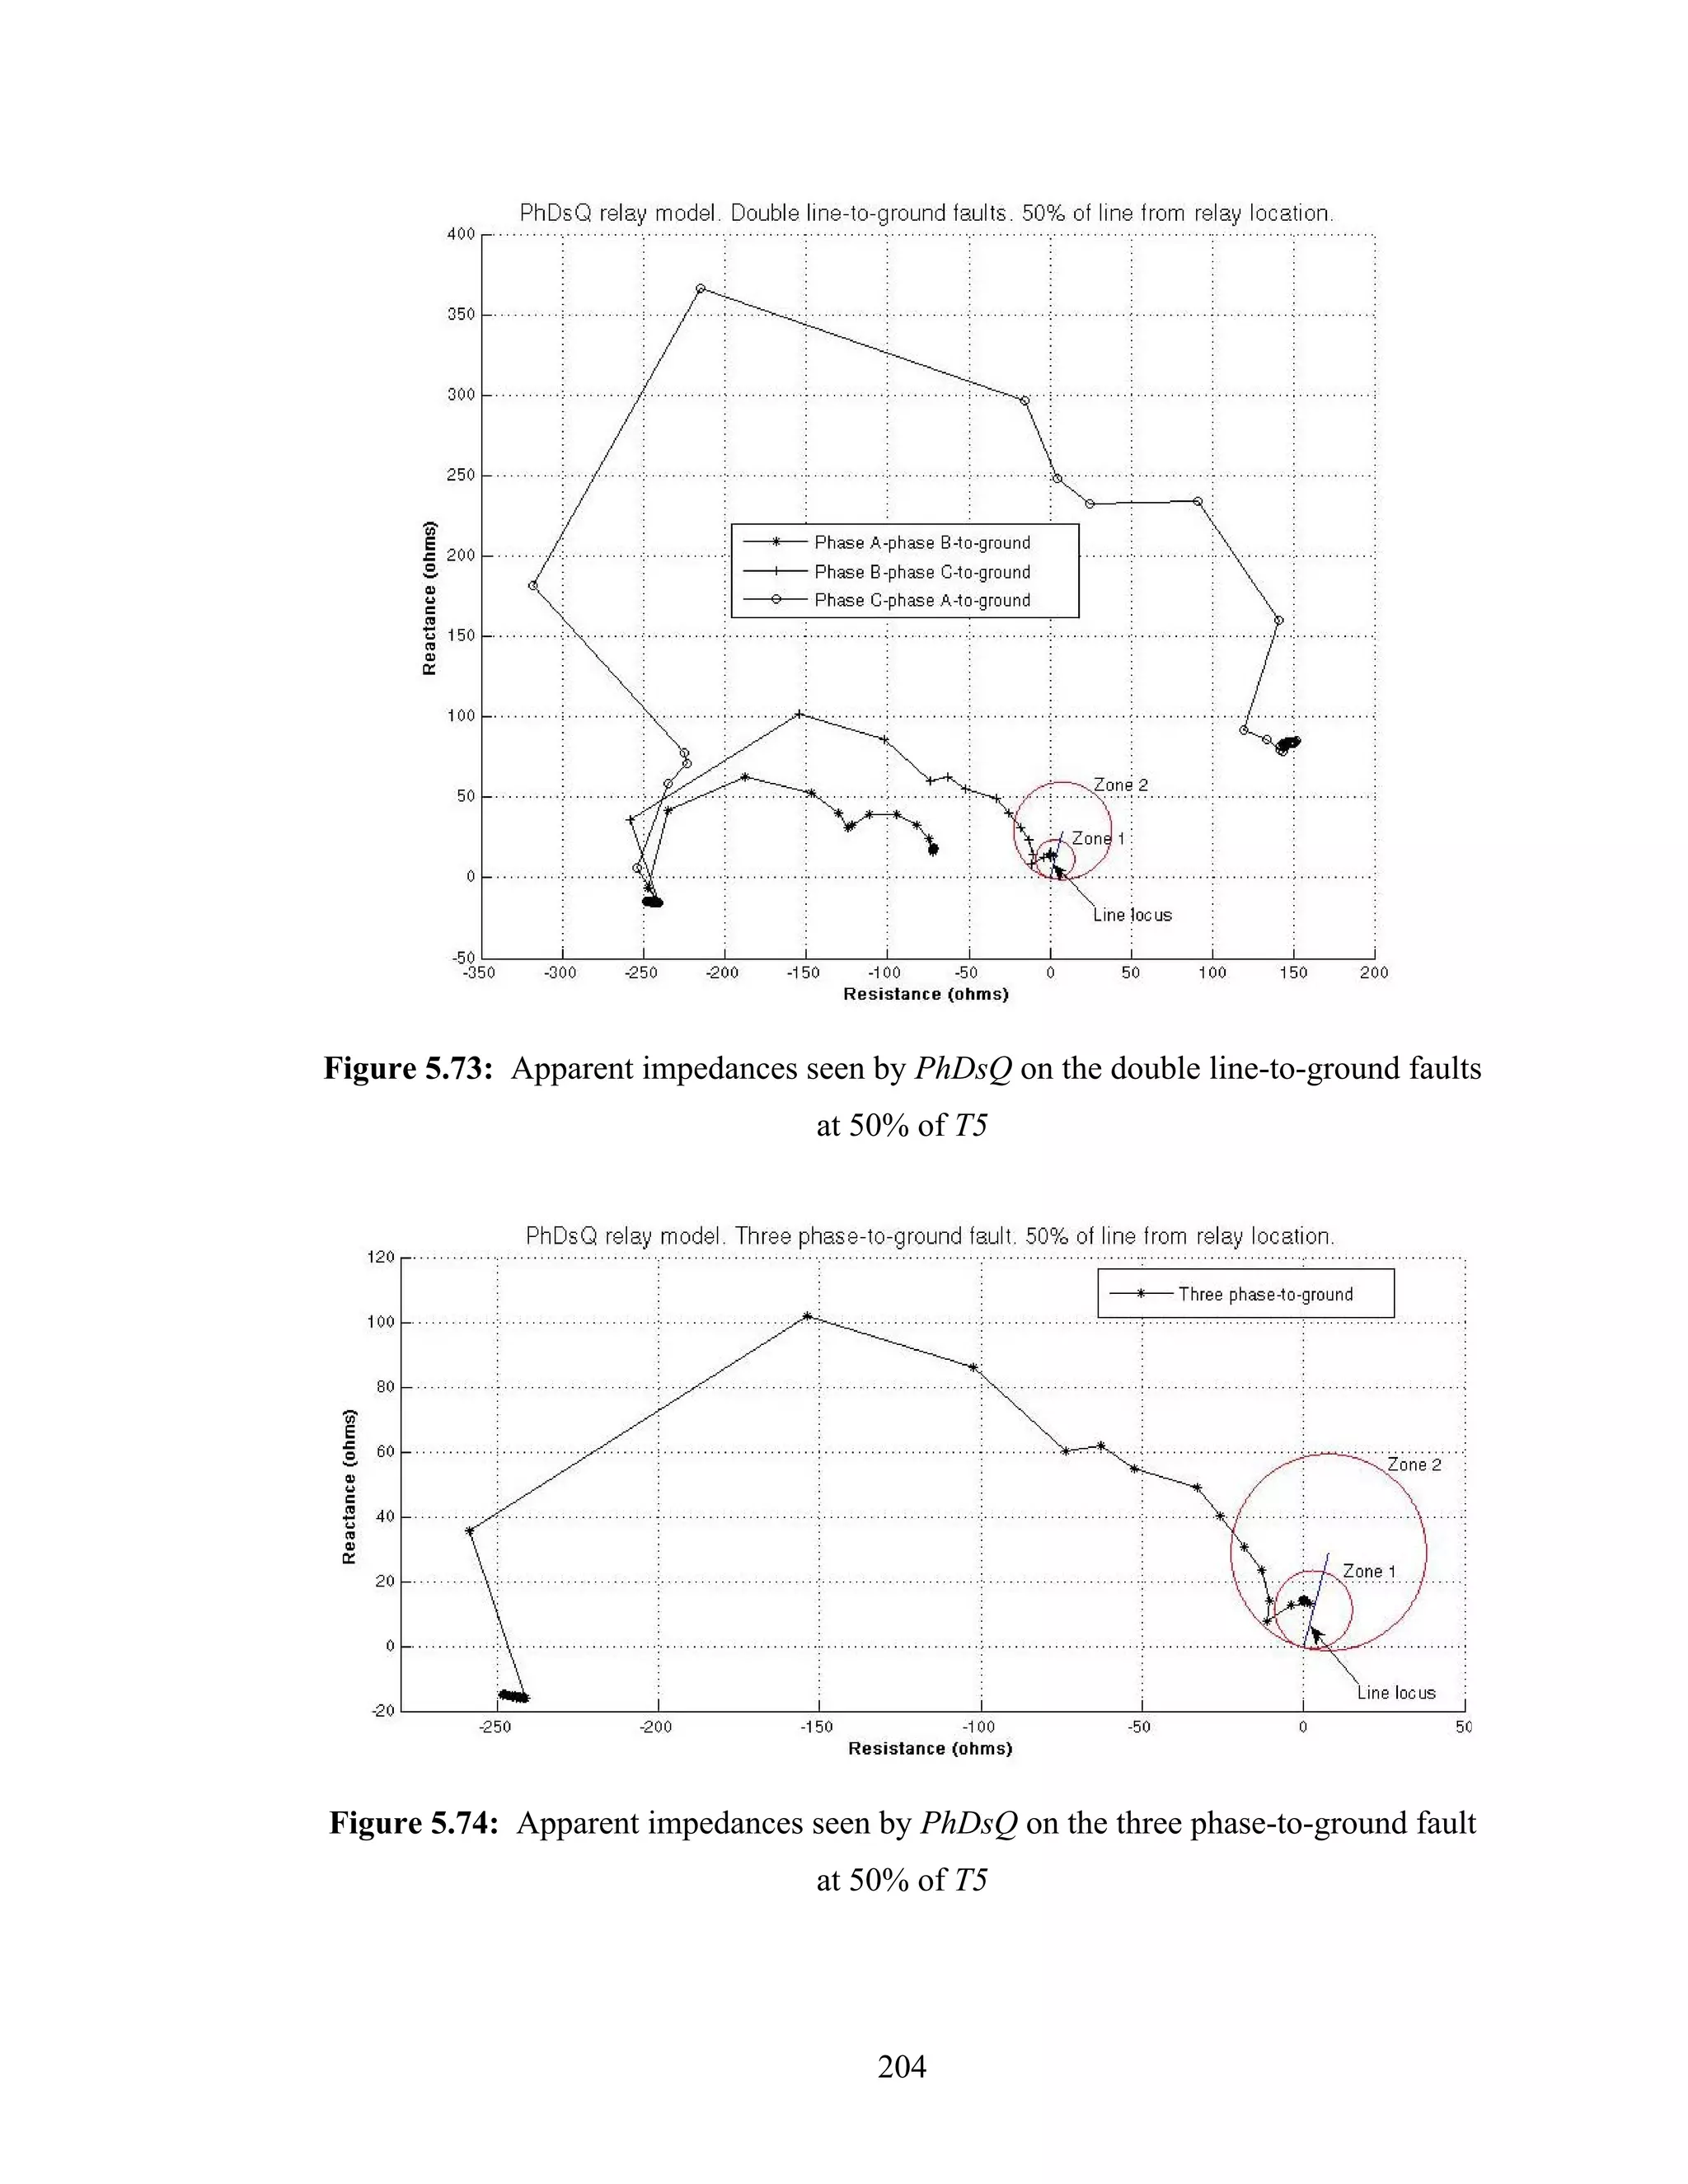
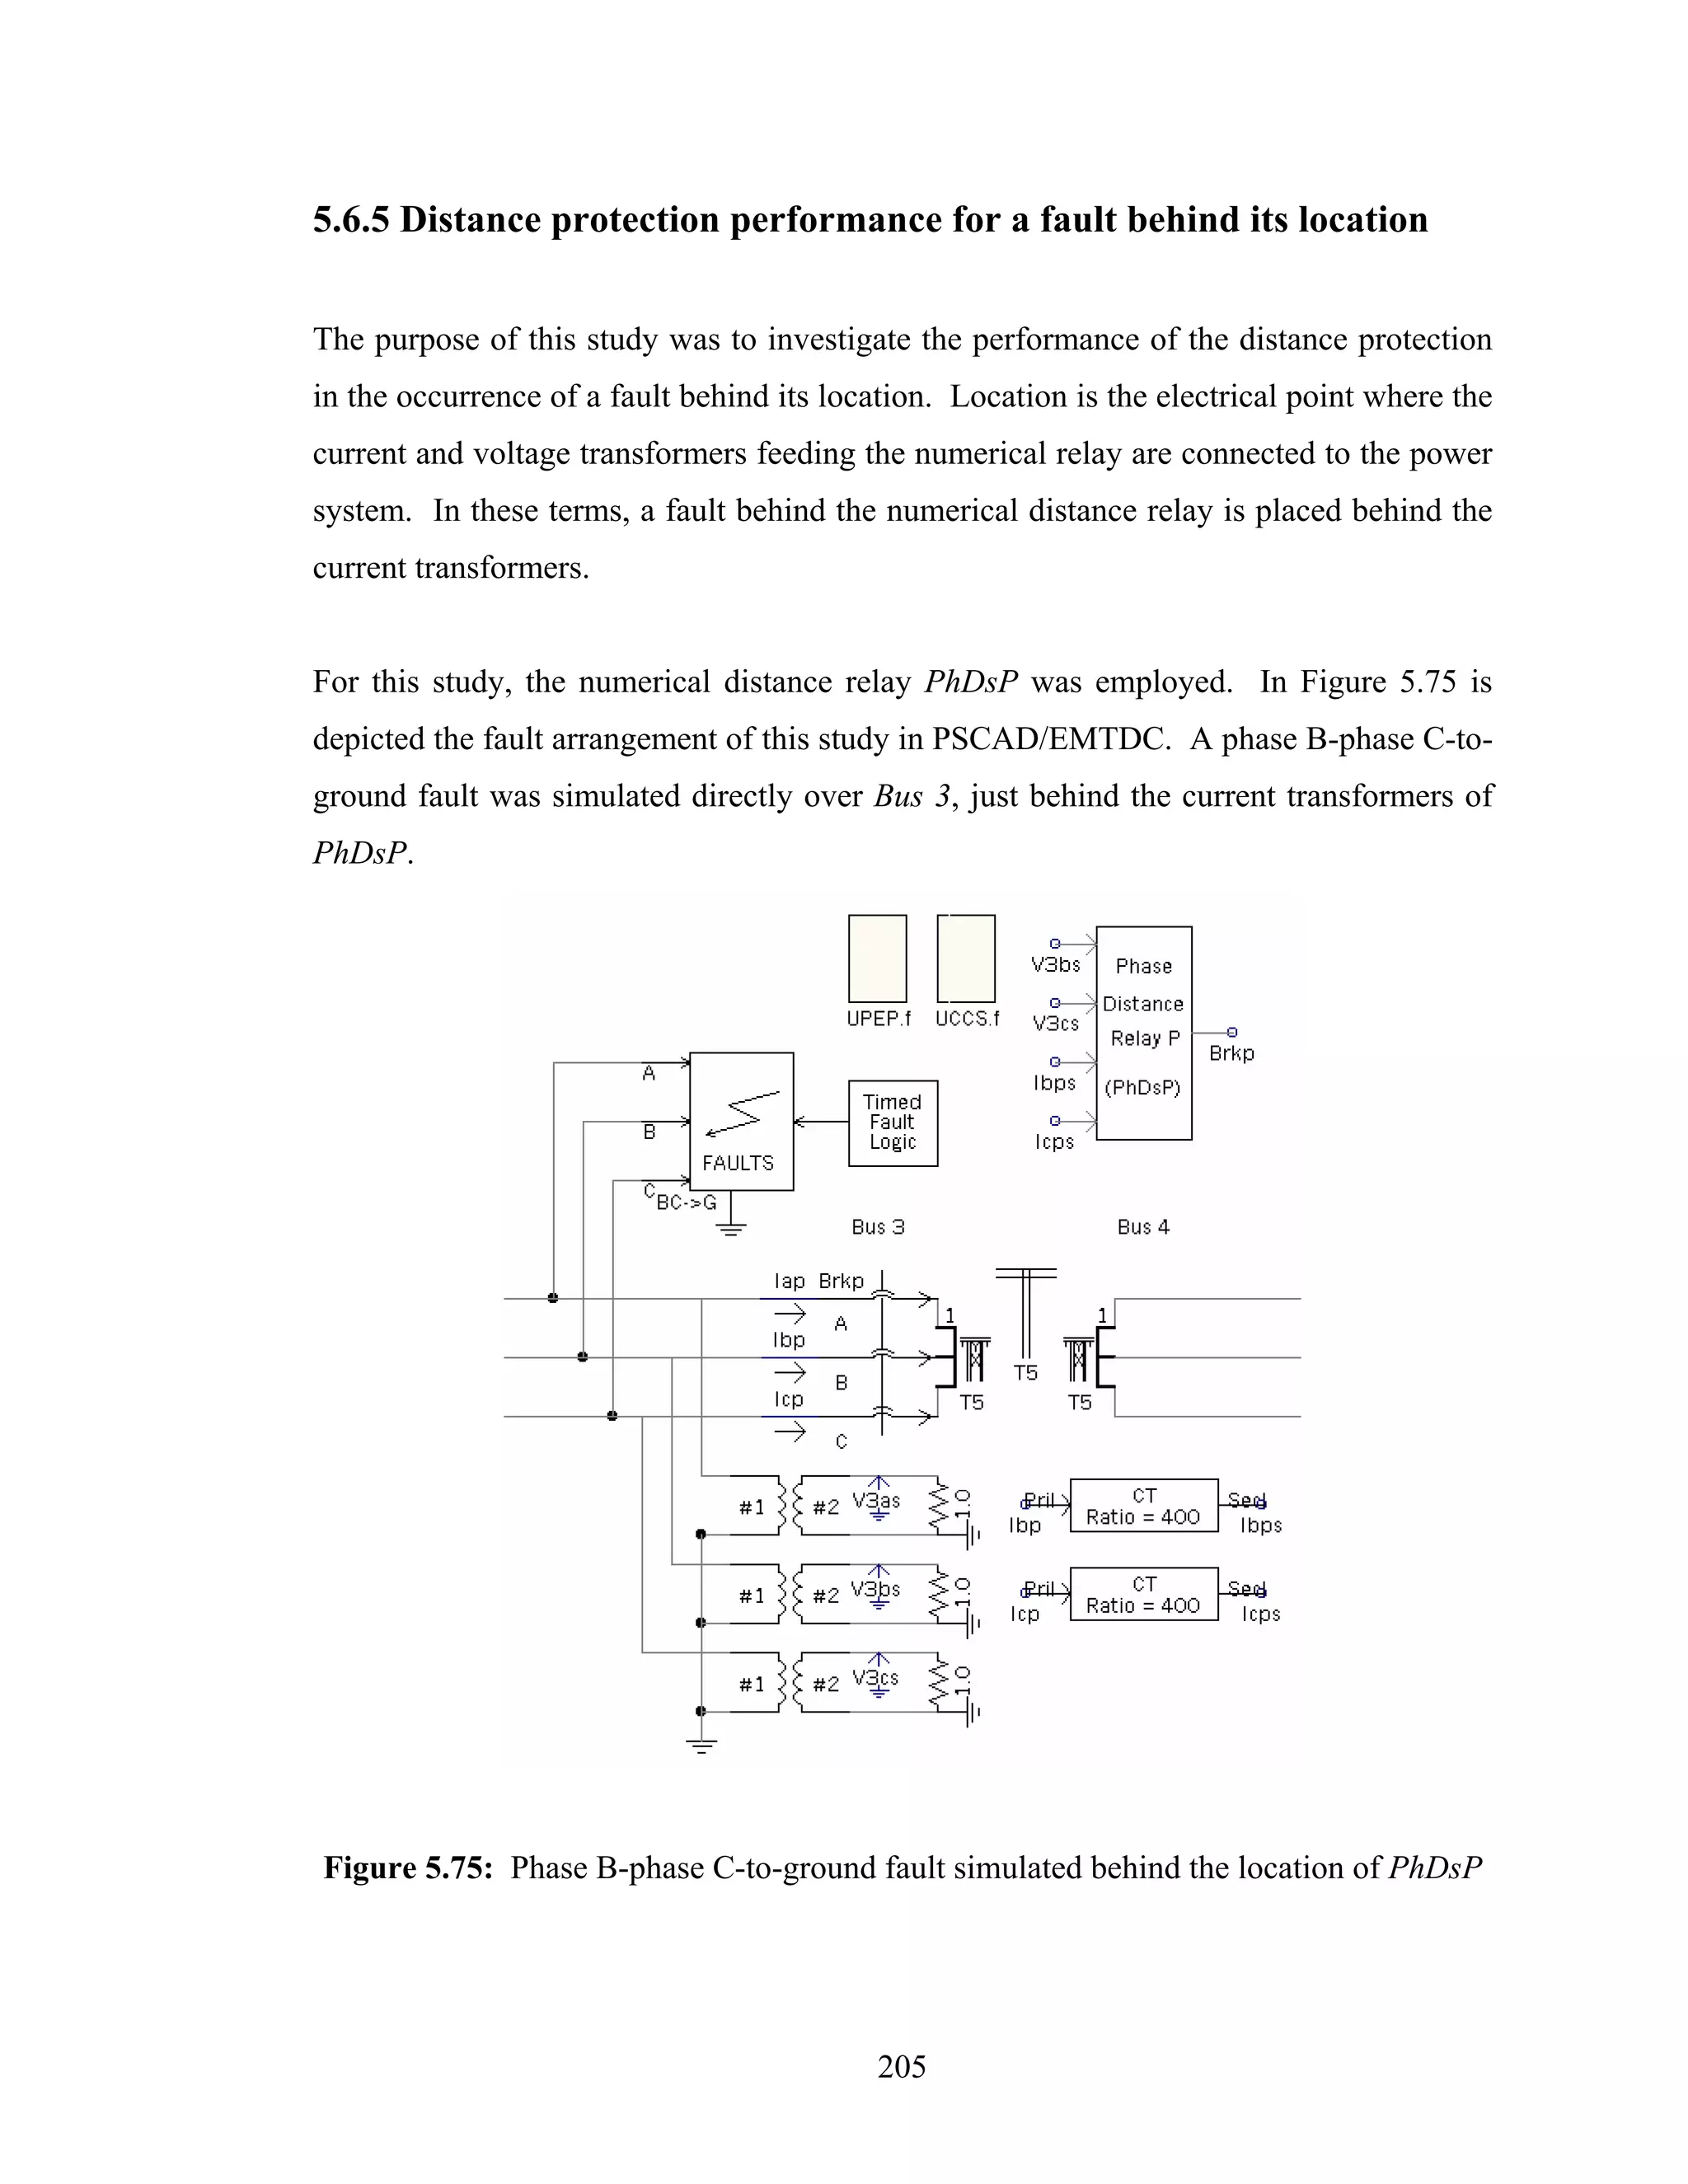
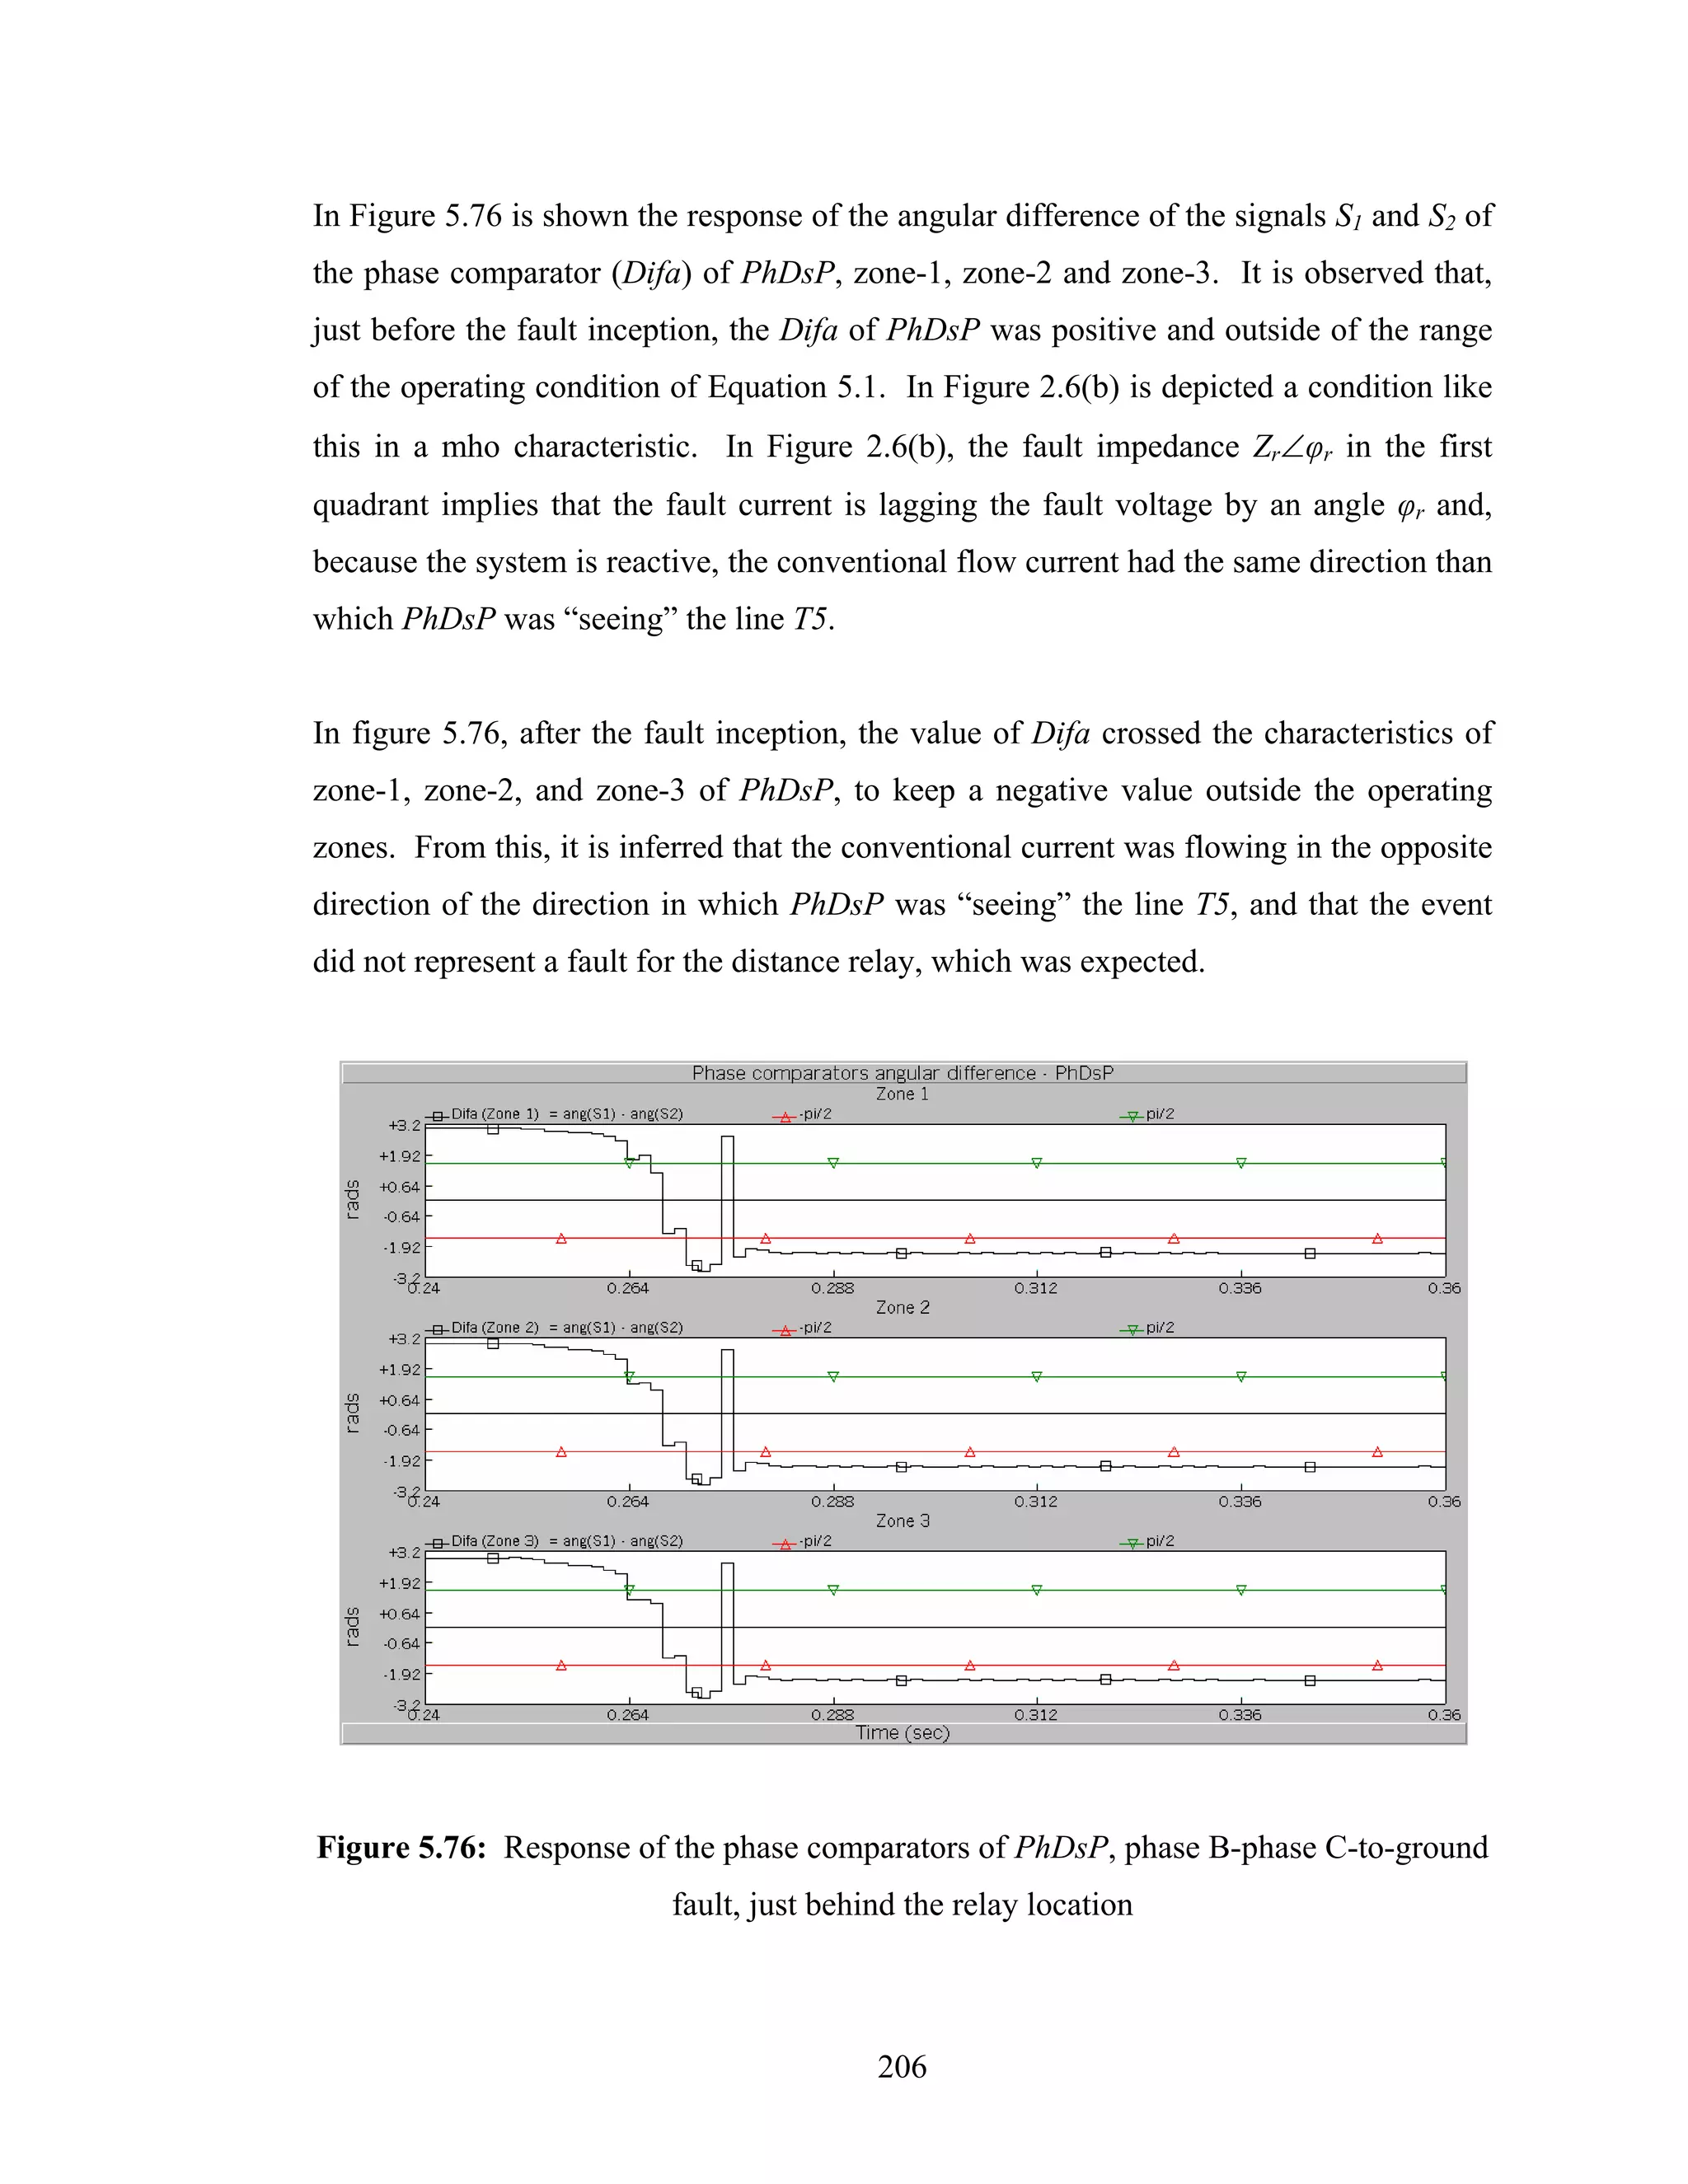
![5.6.6 Distance protection performance under current transformer
saturation
The purpose of this study was to observe the behavior of the numerical distance relay
model under current transformer saturation. The current transformers of the numerical
distance relay model PhDsP were used to simulate its saturation, and to observe the
effect that this event had in the performance of PhDsP. An analysis of these current
transformers was made to know theirs saturation characteristics.
The current transformers supplying PhDsP have a rate of 2000 amperes to 5 amperes.
The knee point of the excitation curve of the CT’s is over 400 volts in the secondary side
[52]. The knee point of the excitation curve divides the linear operation region and the
saturated operation of the CT. Therefore, driving the operation of the CT over 400 V in
the secondary circuit saturates the CT.
The voltage in the secondary side of the CT is proportional to the current flowing on the
secondary windings of the CT and to the burden connected to the secondary terminals of
the CT, as expressed in the following equation [50].
Es = I s Z B , (5.2)
where,
Es is the secondary current of the CT
Is is the secondary excitation current of CT
ZB is the impedance burden connected to the secondary of the CT
The maximum fault current experienced by PhDsP is 17 kA in the primary circuit.
Therefore, value of the maximum fault current in the secondary of the CT is:
207](https://image.slidesharecdn.com/phdthesissandroaquiles060724-121017023005-phpapp01/75/Thesis-for-Power-System-protection-in-Brief-242-2048.jpg)
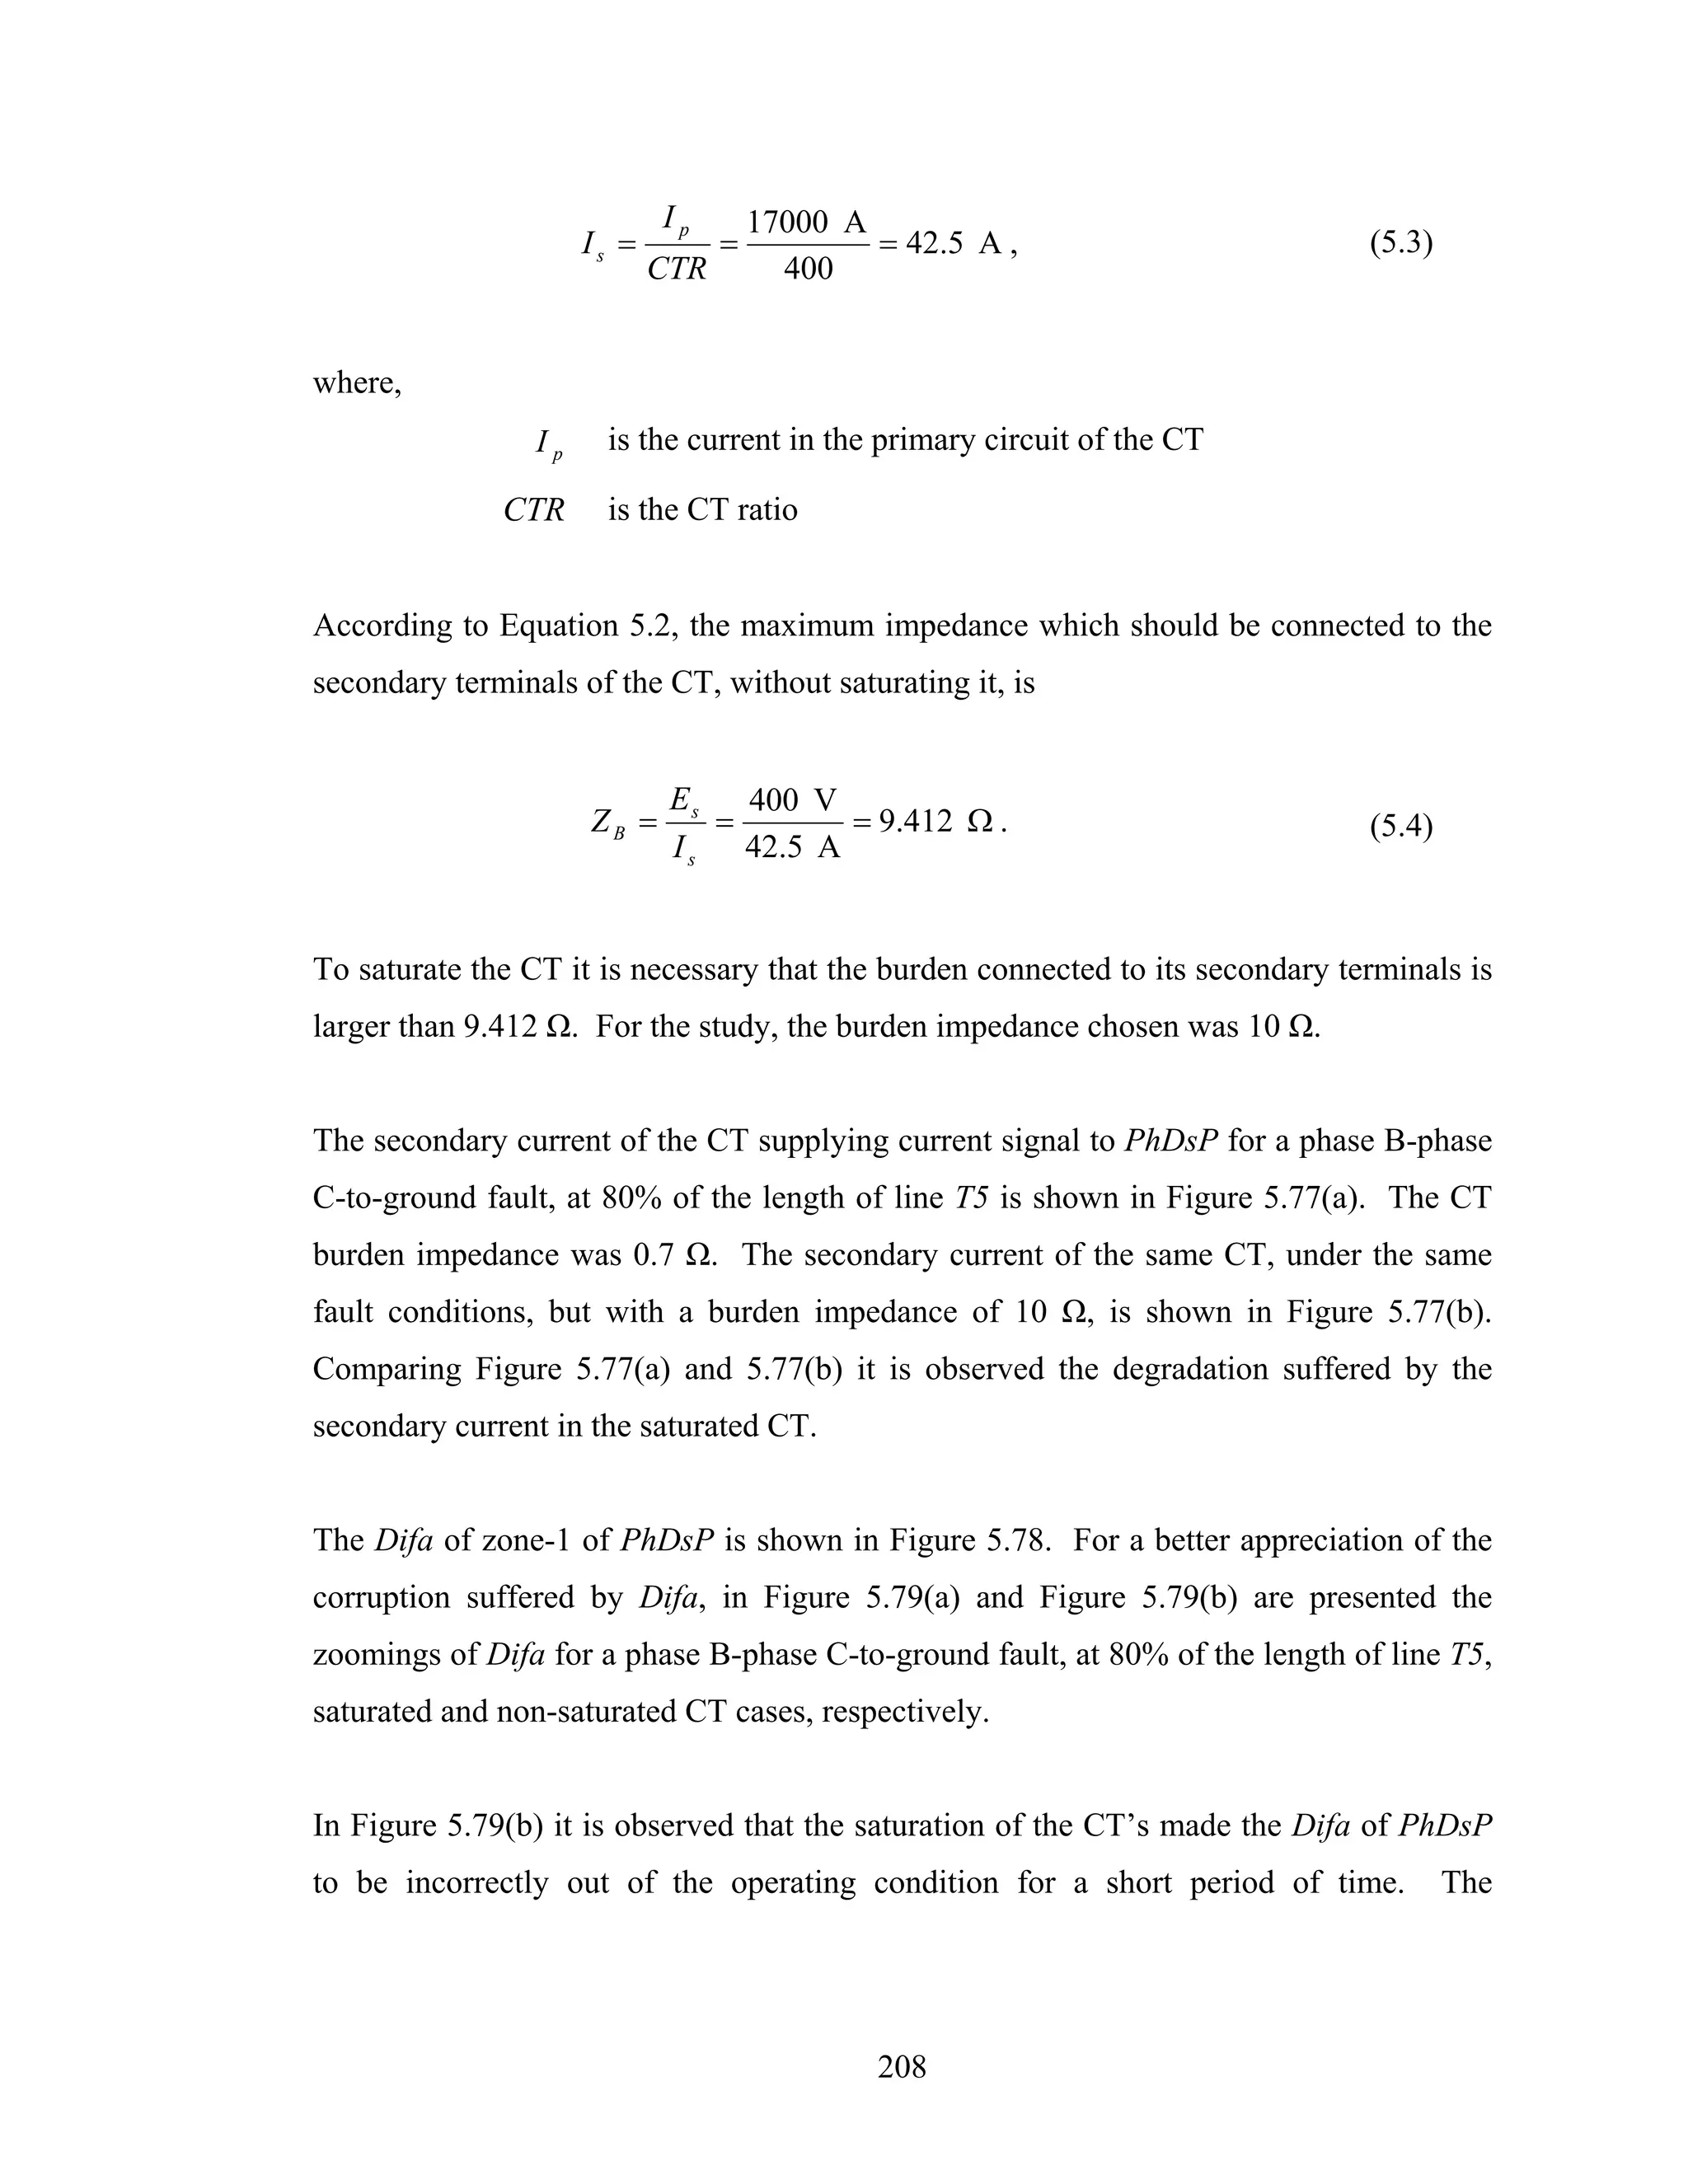
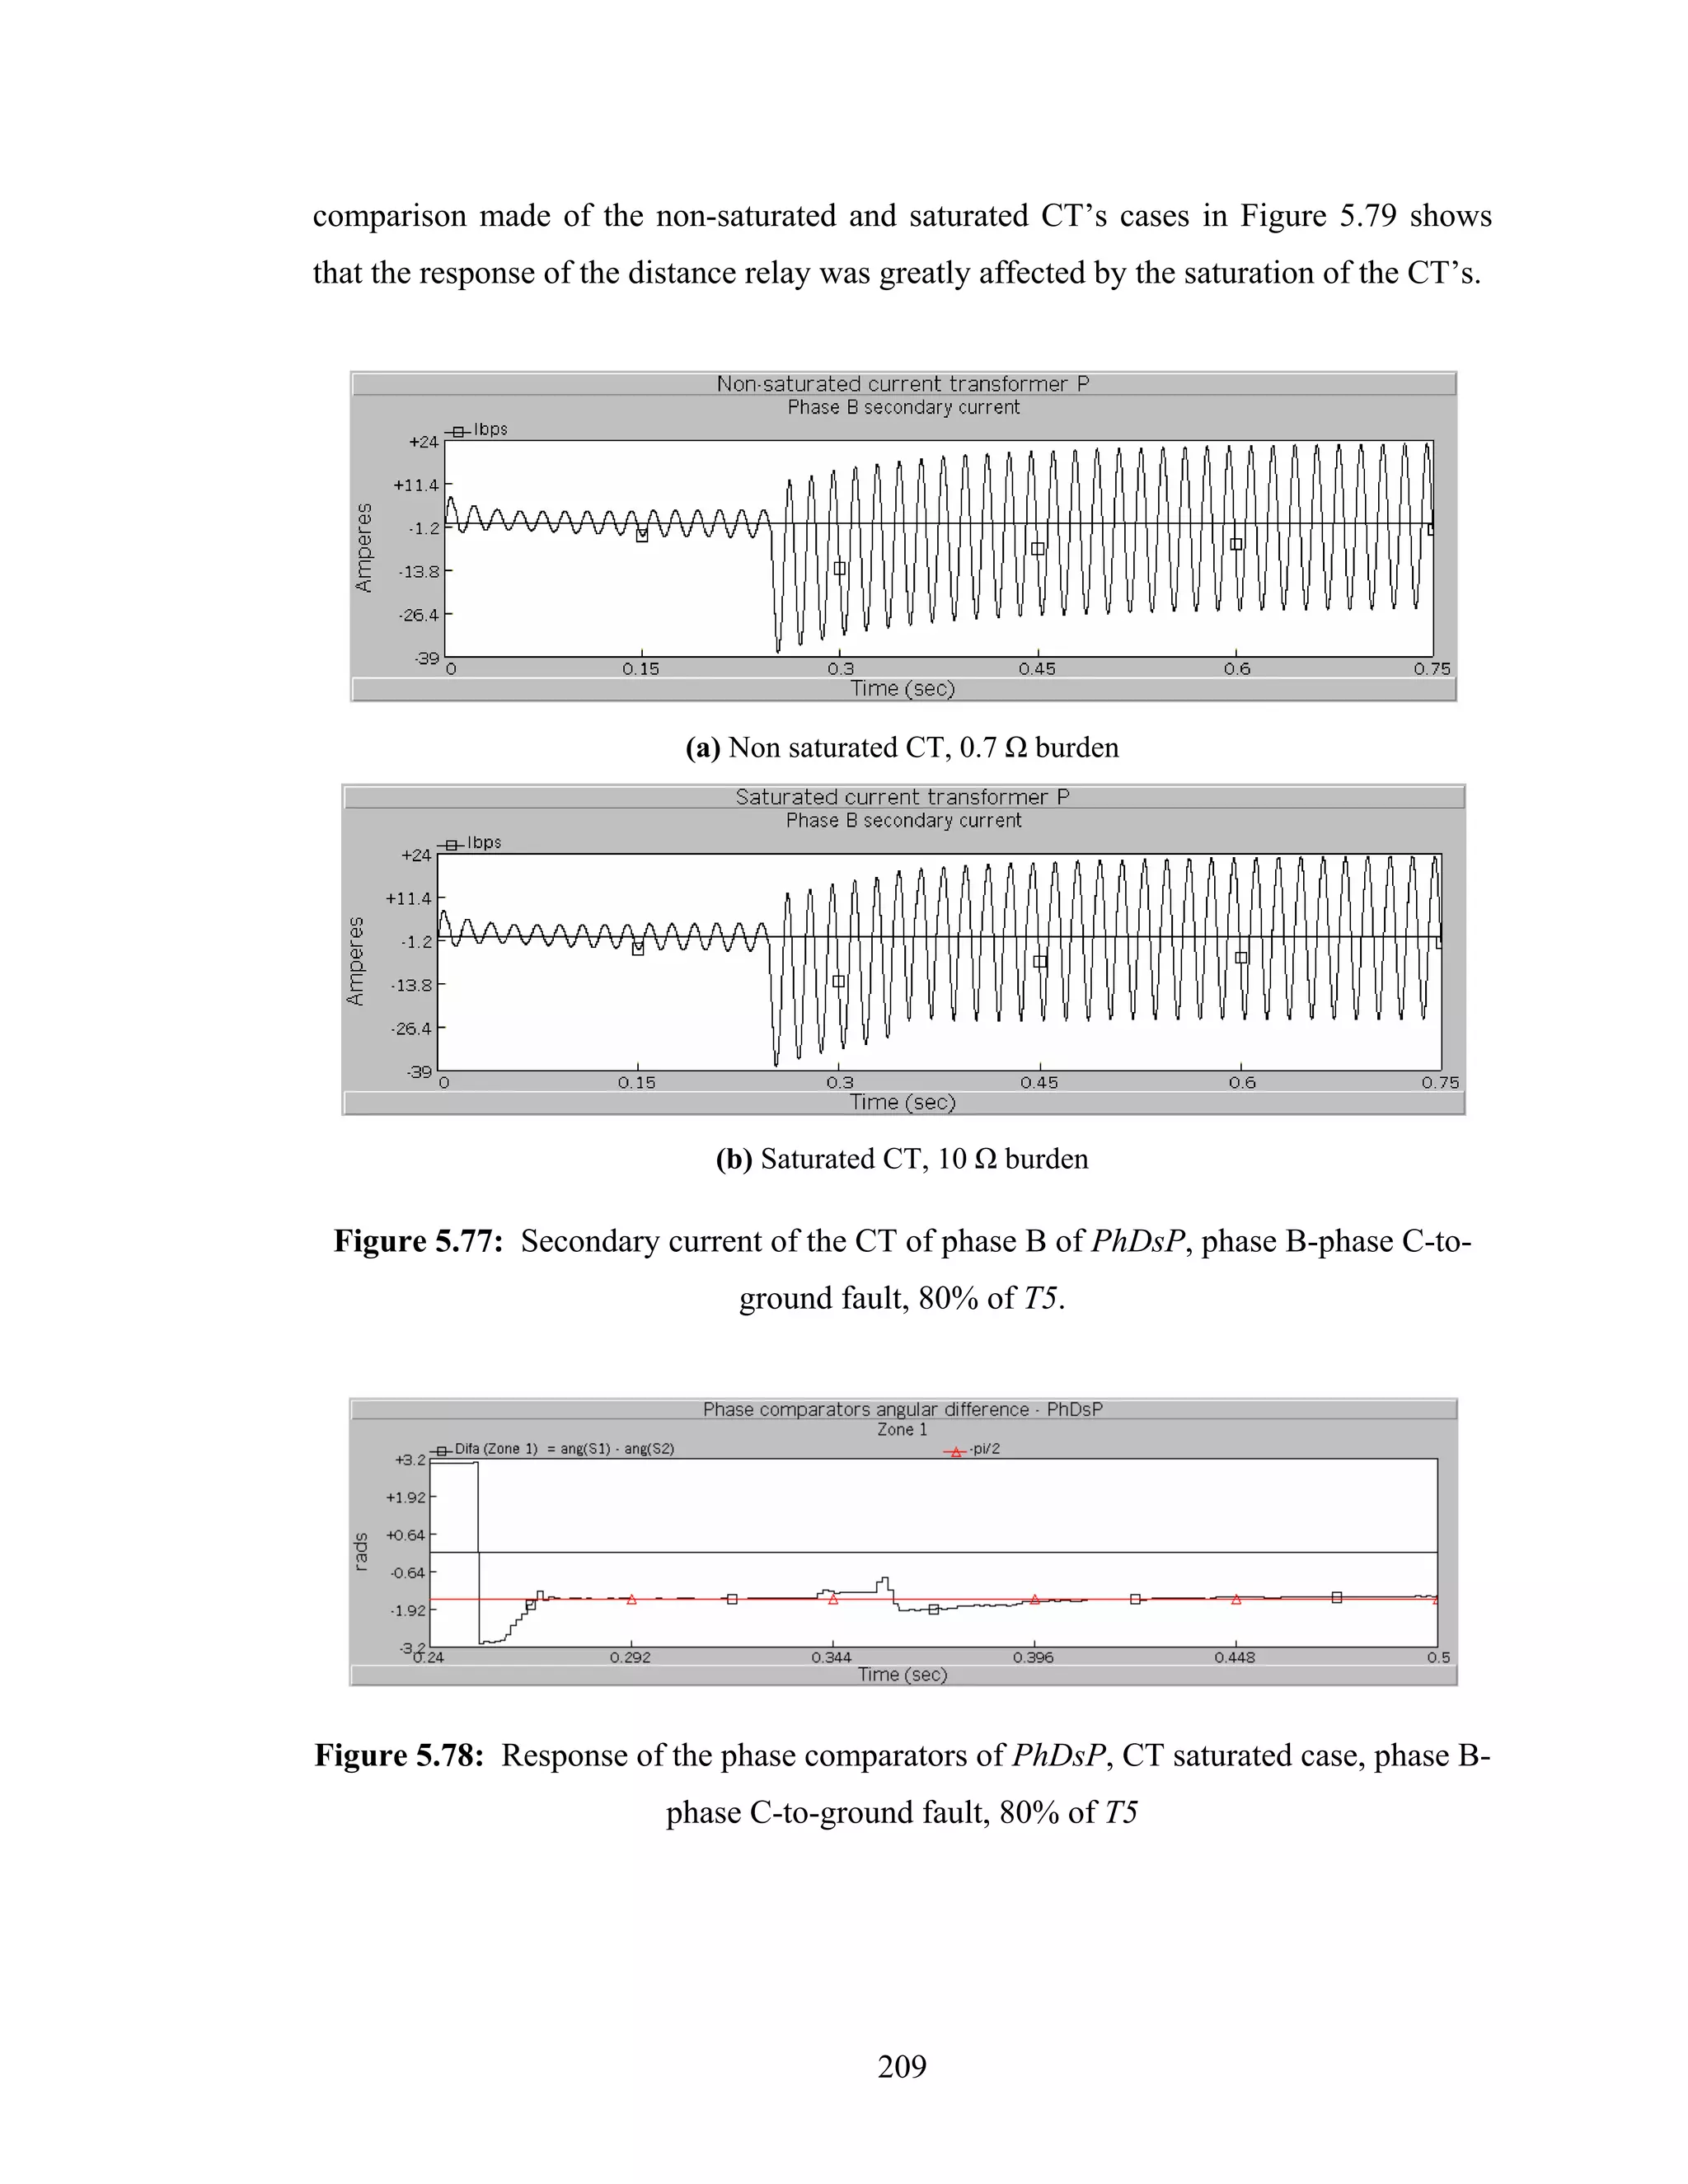
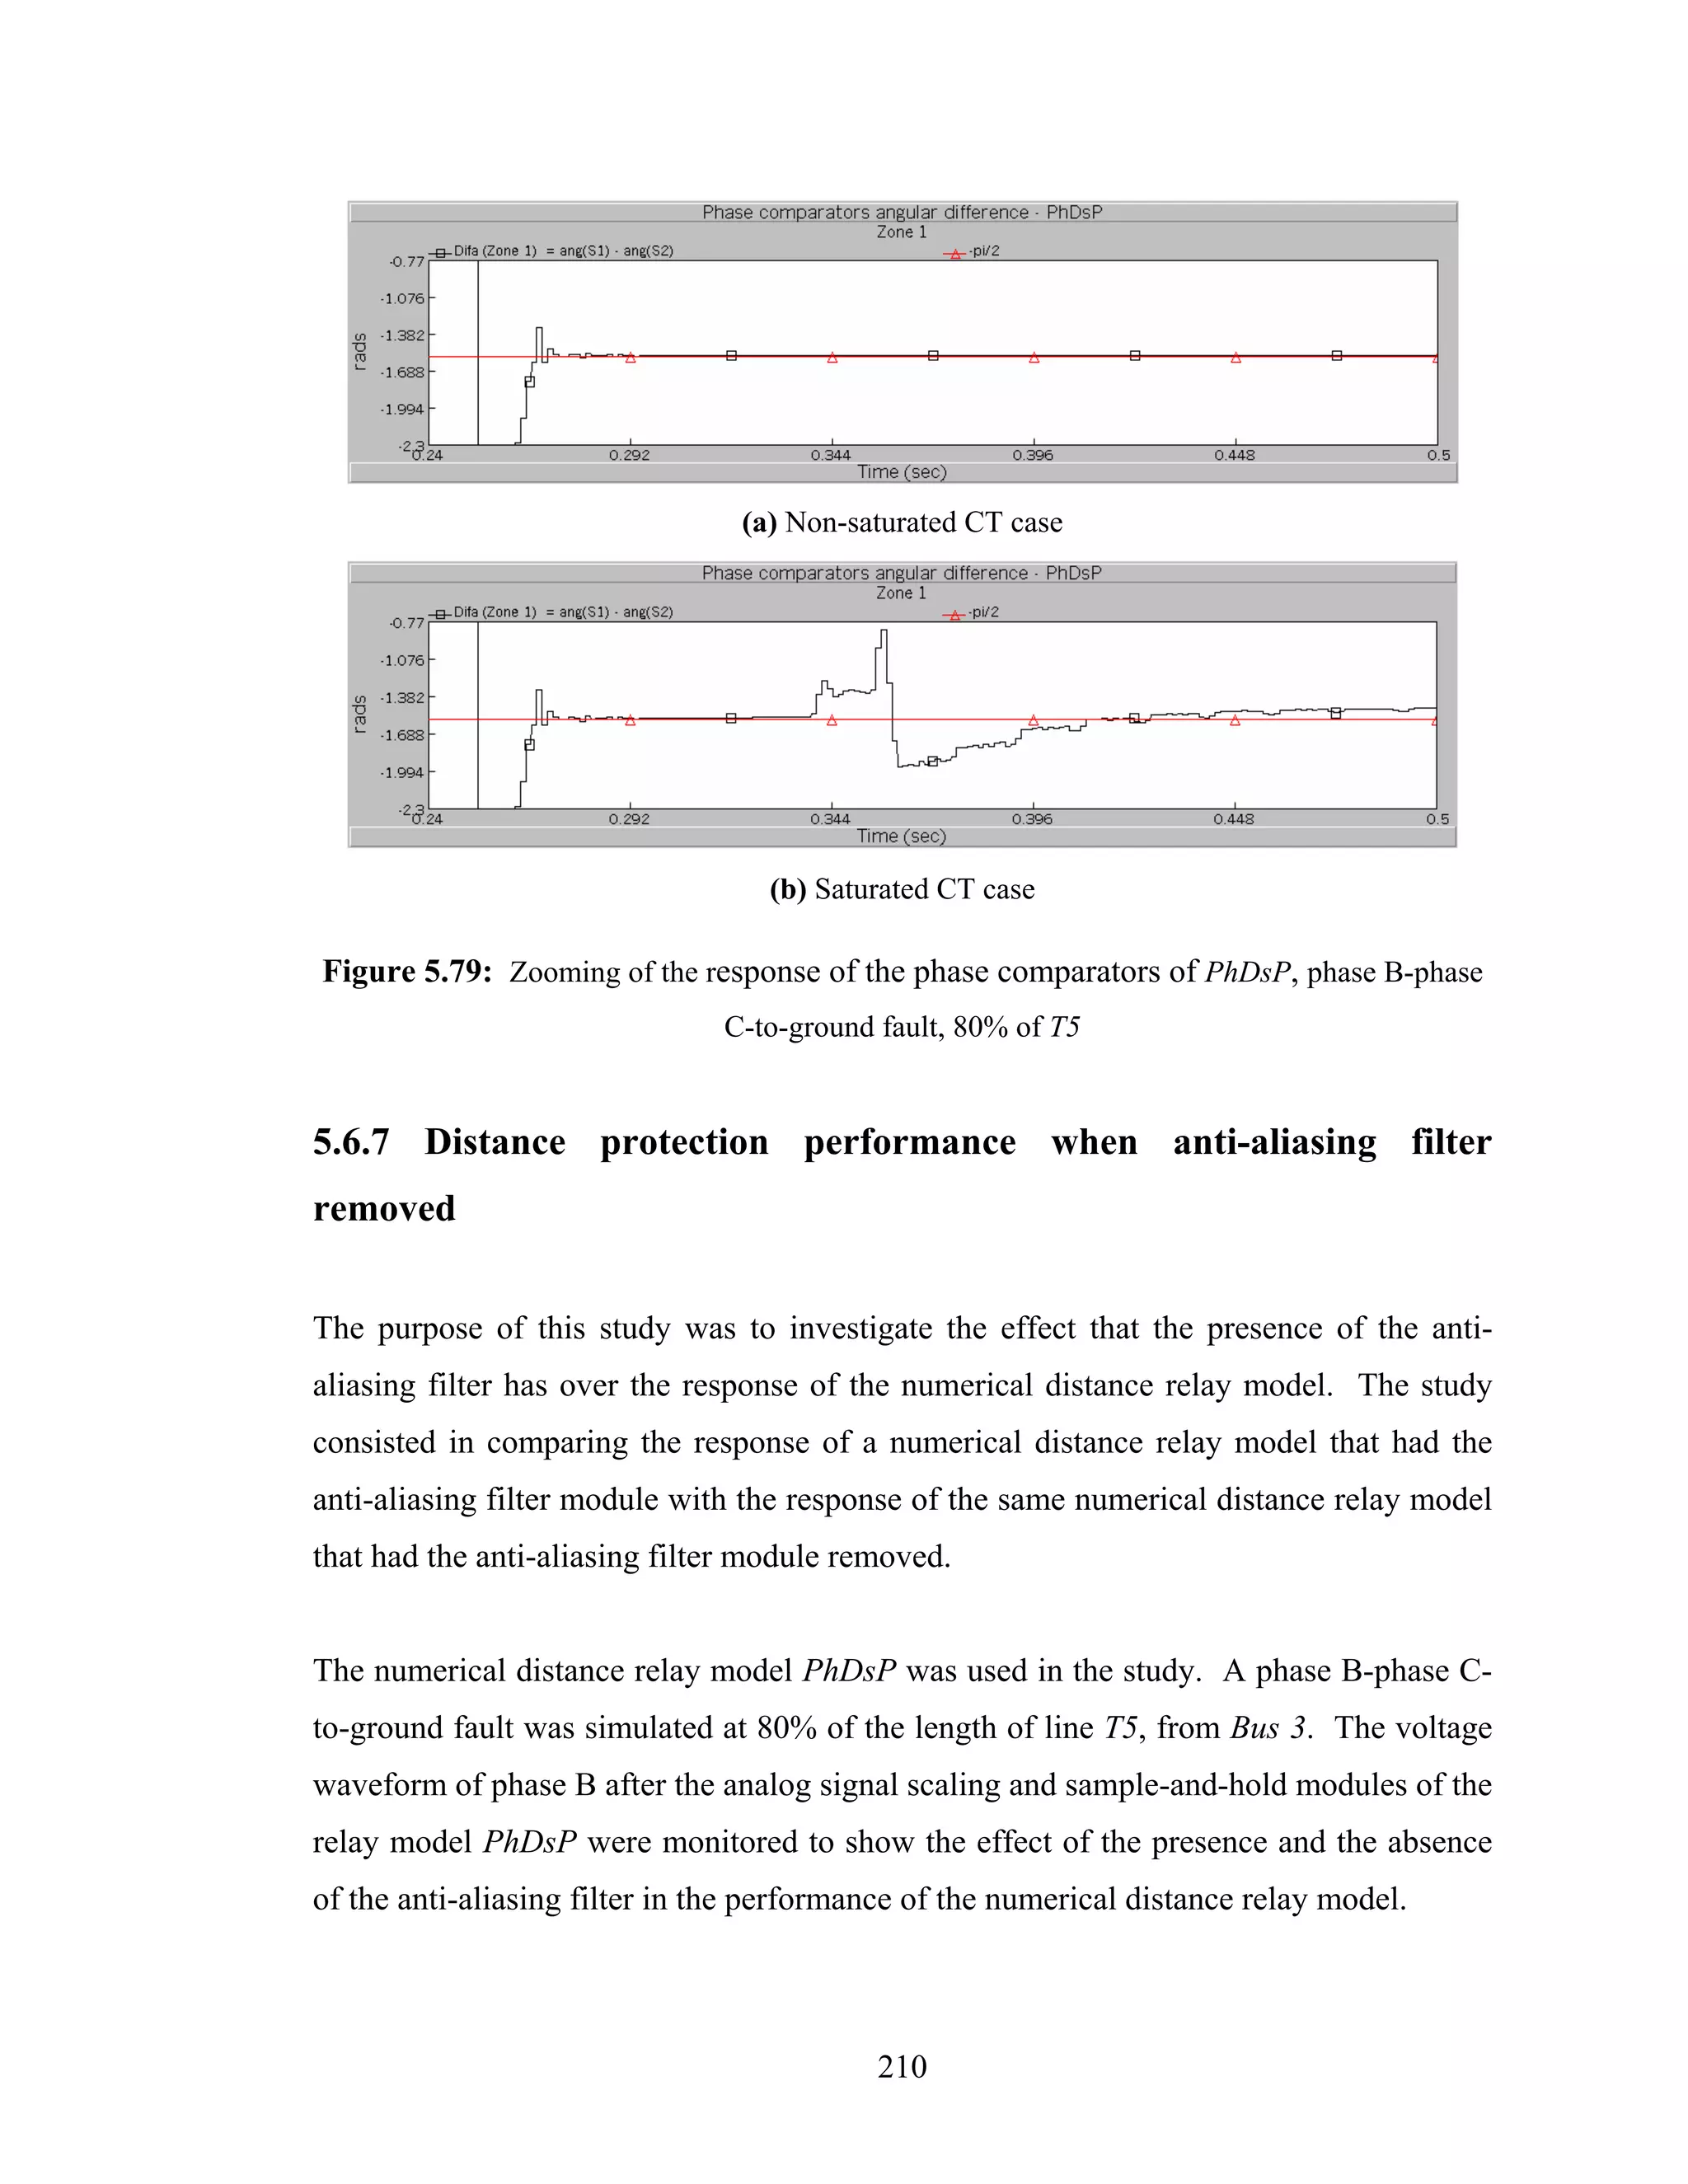
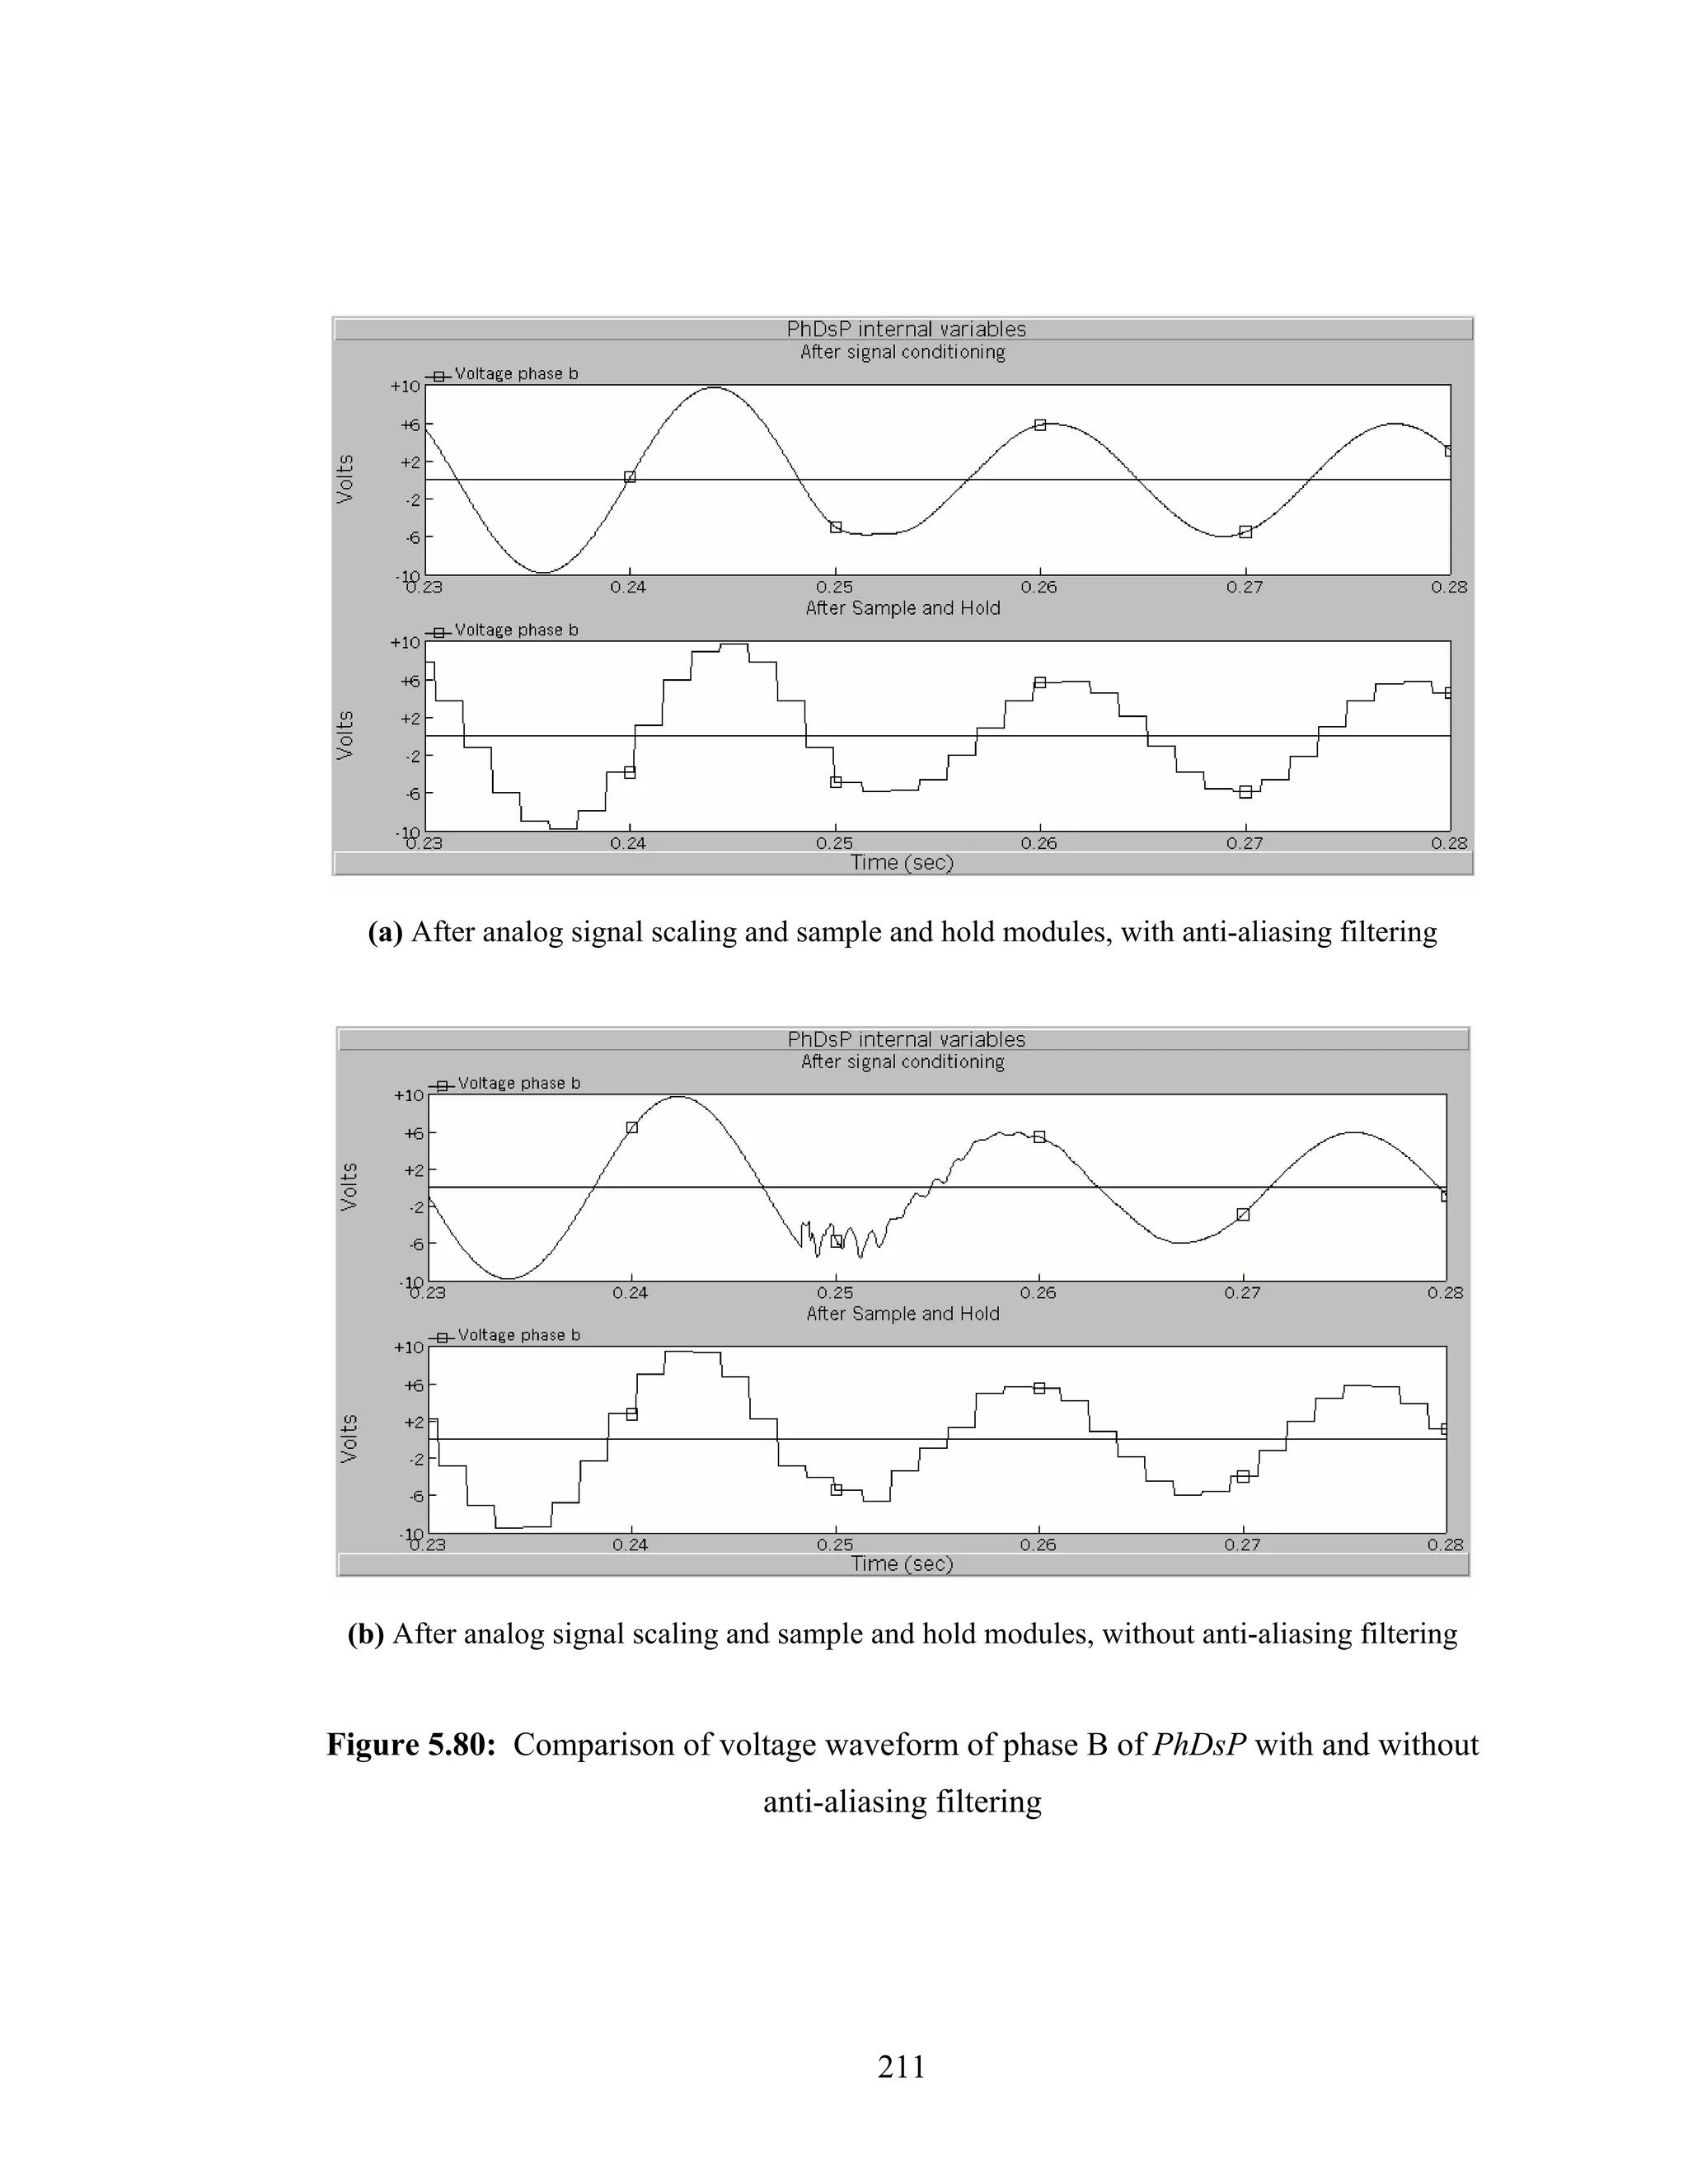
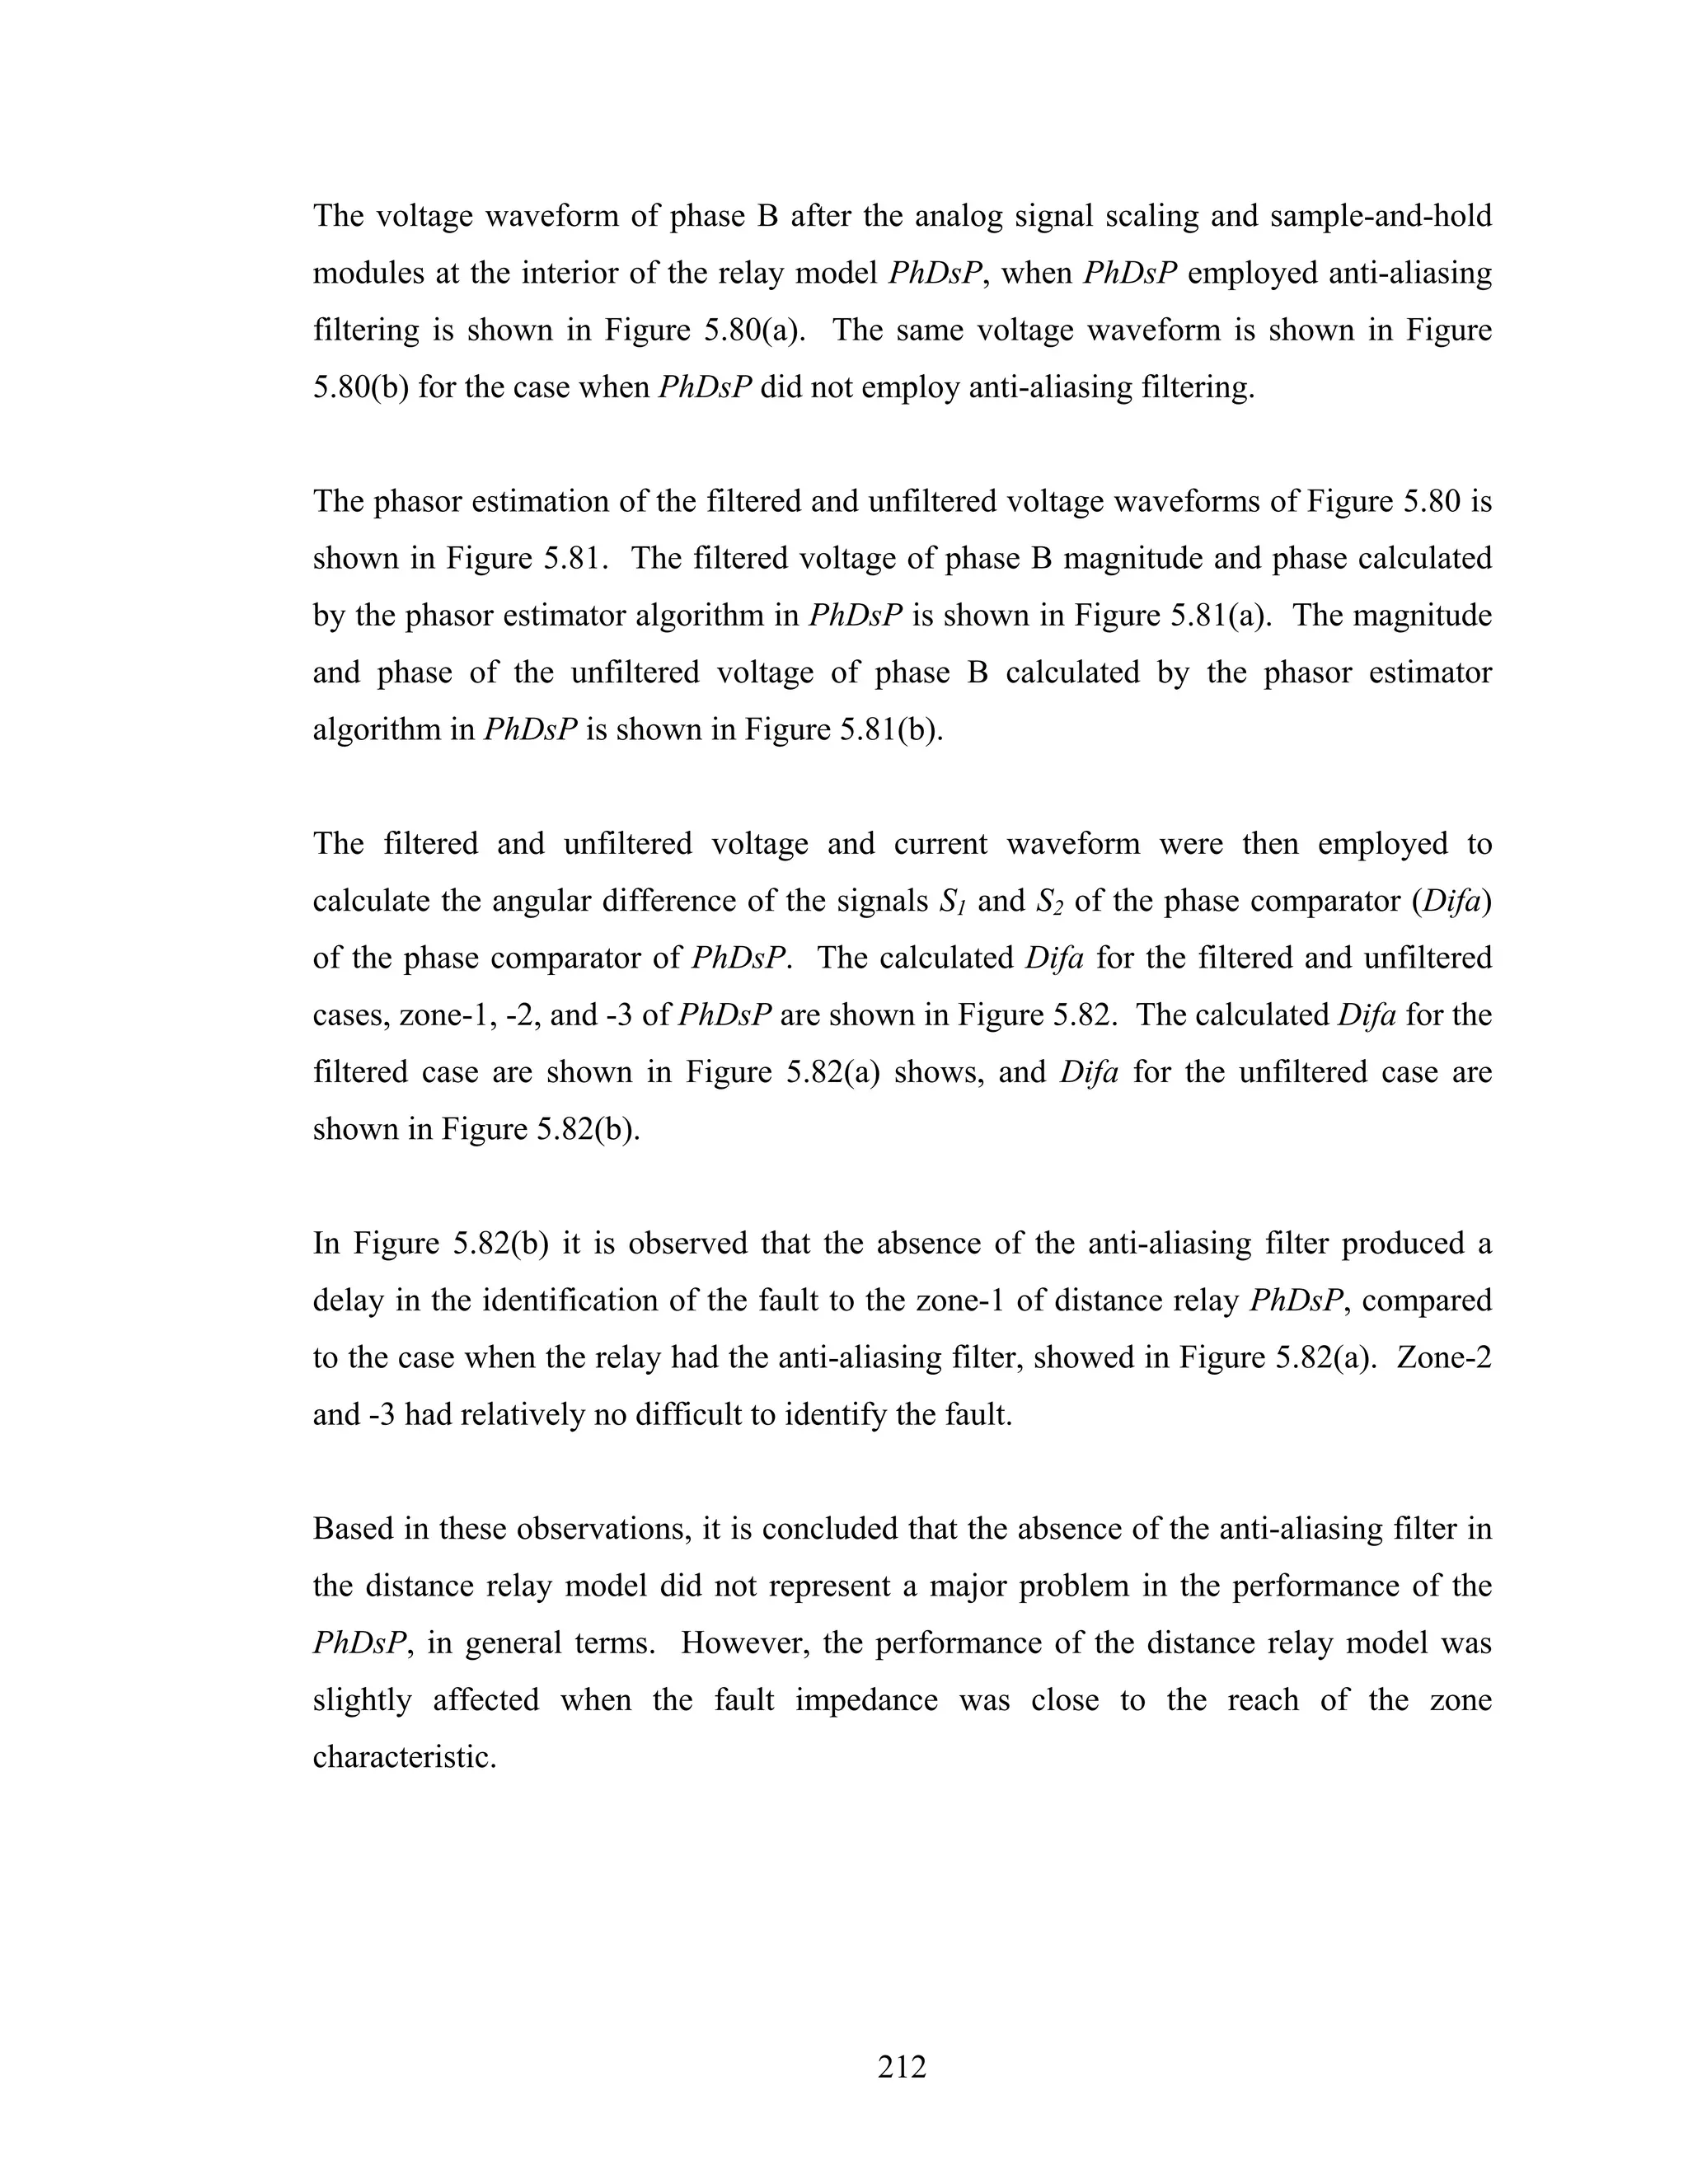
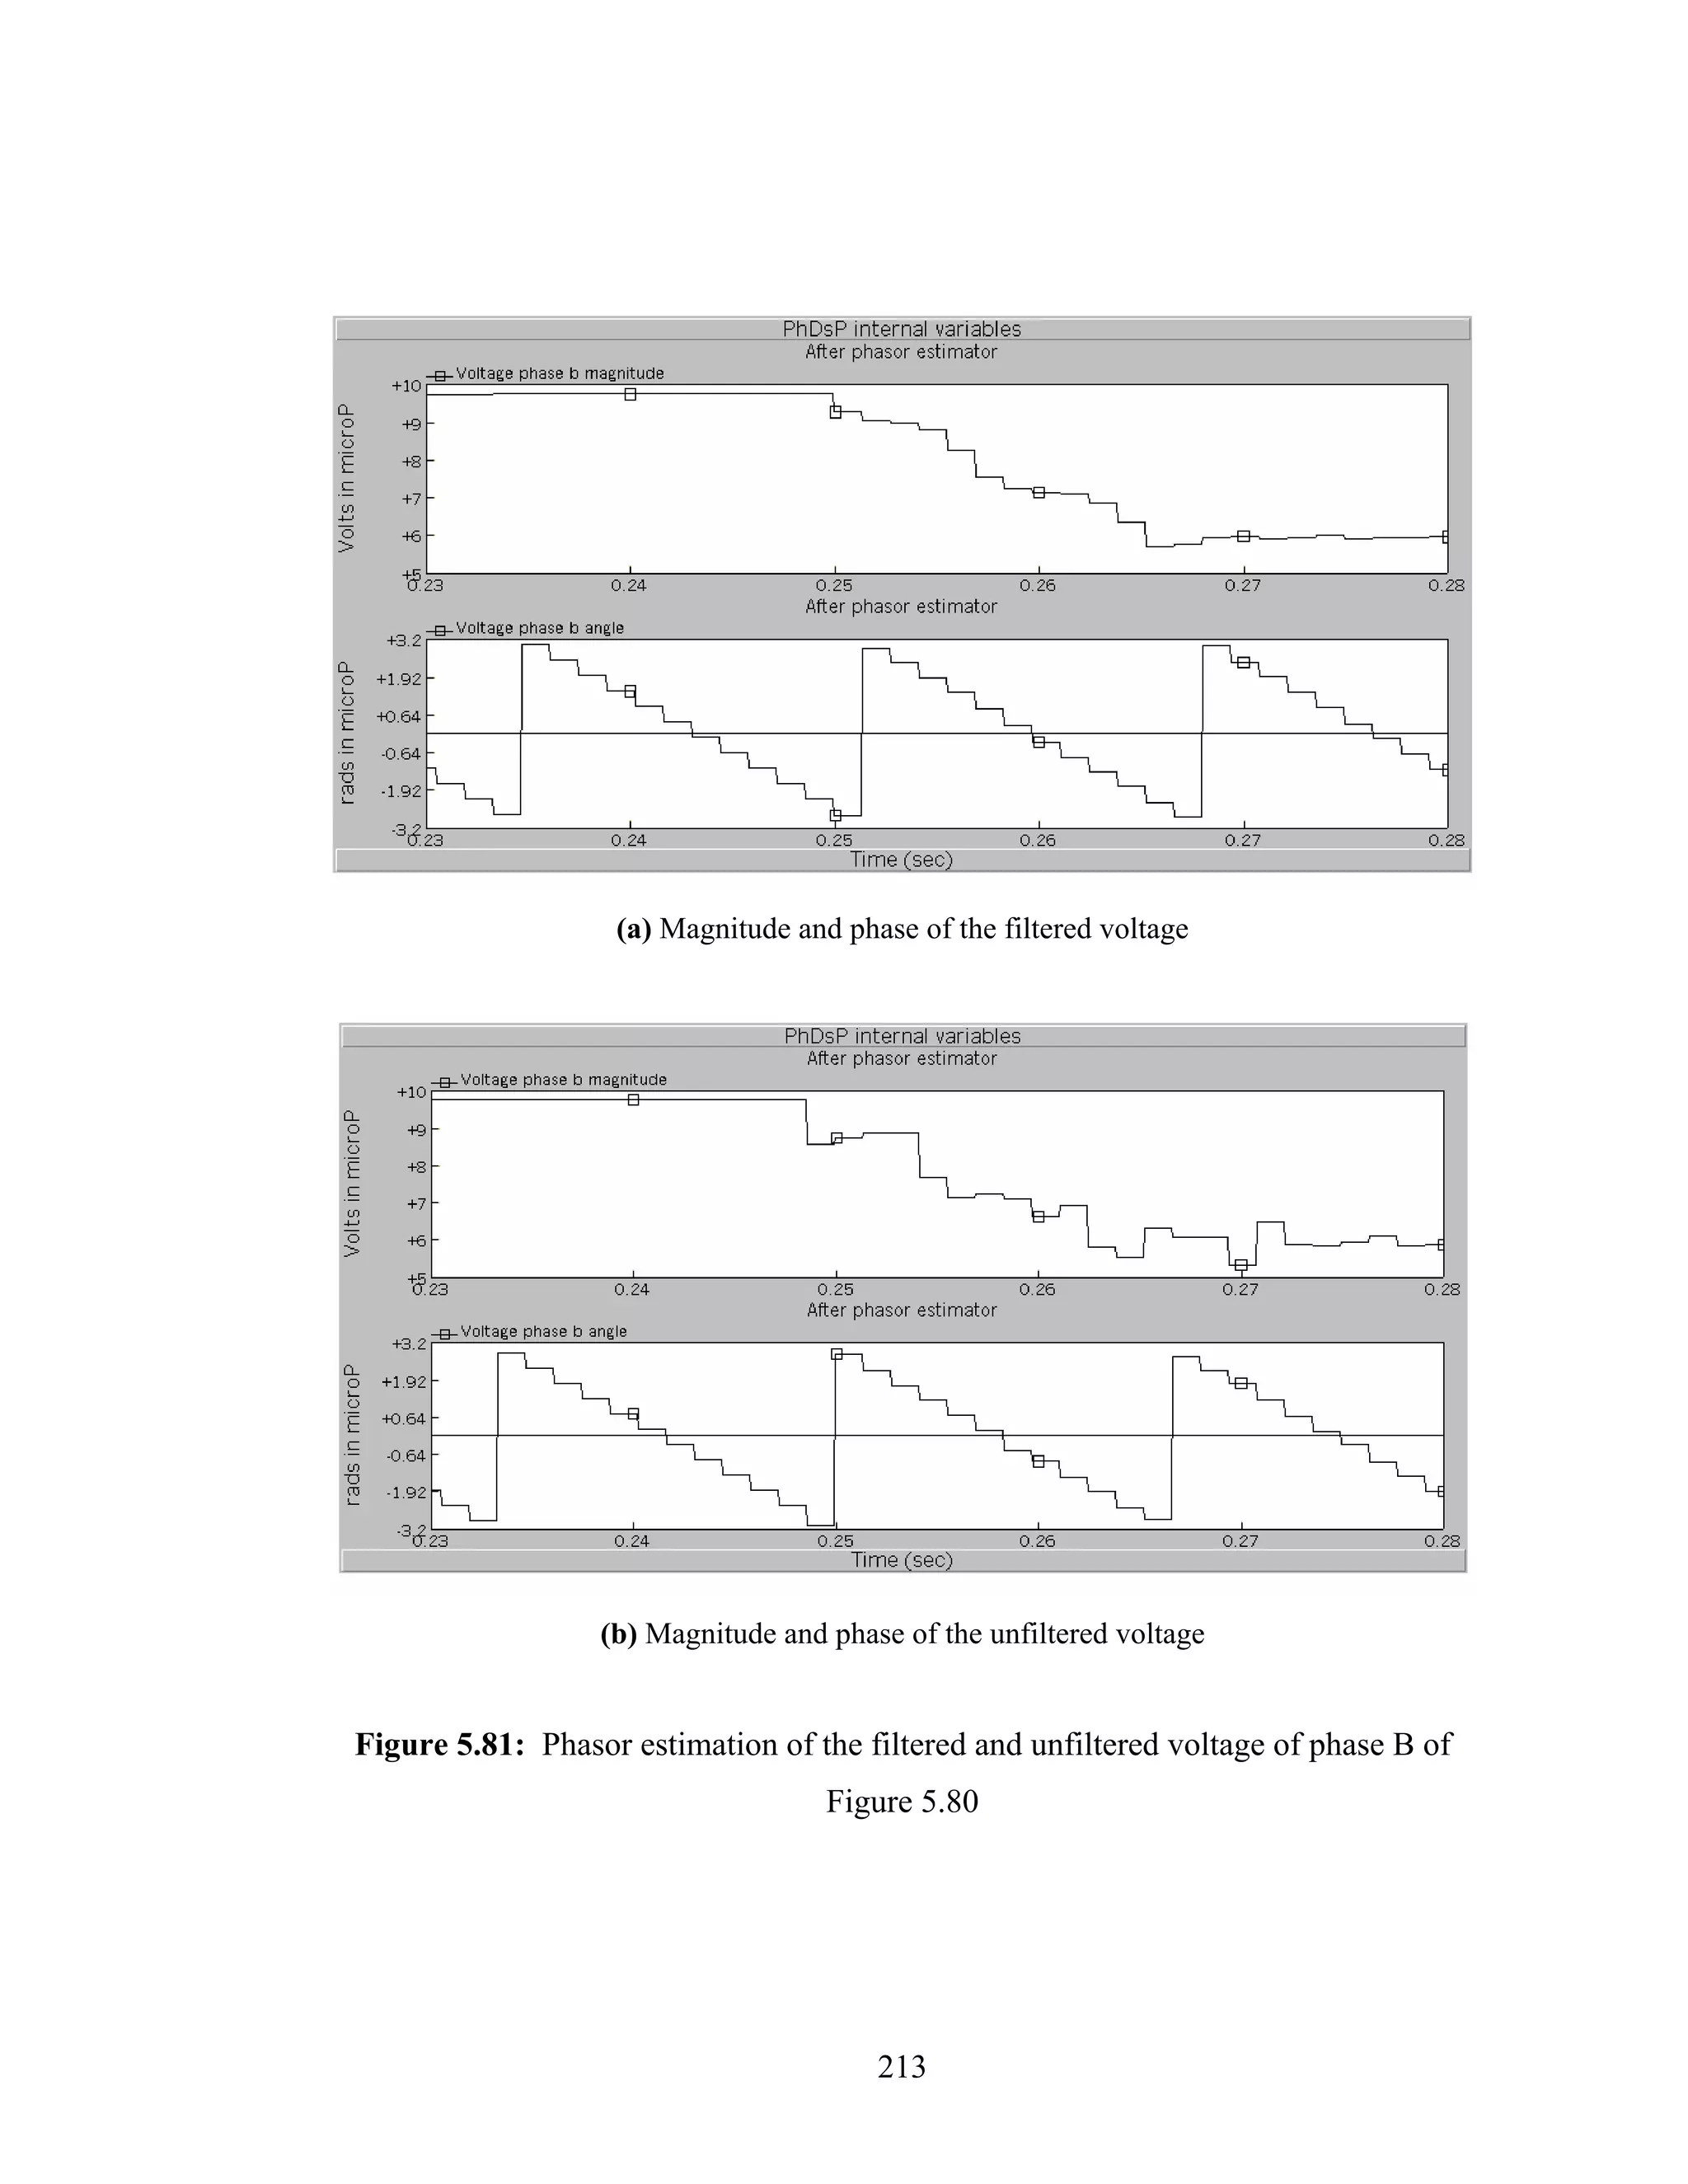
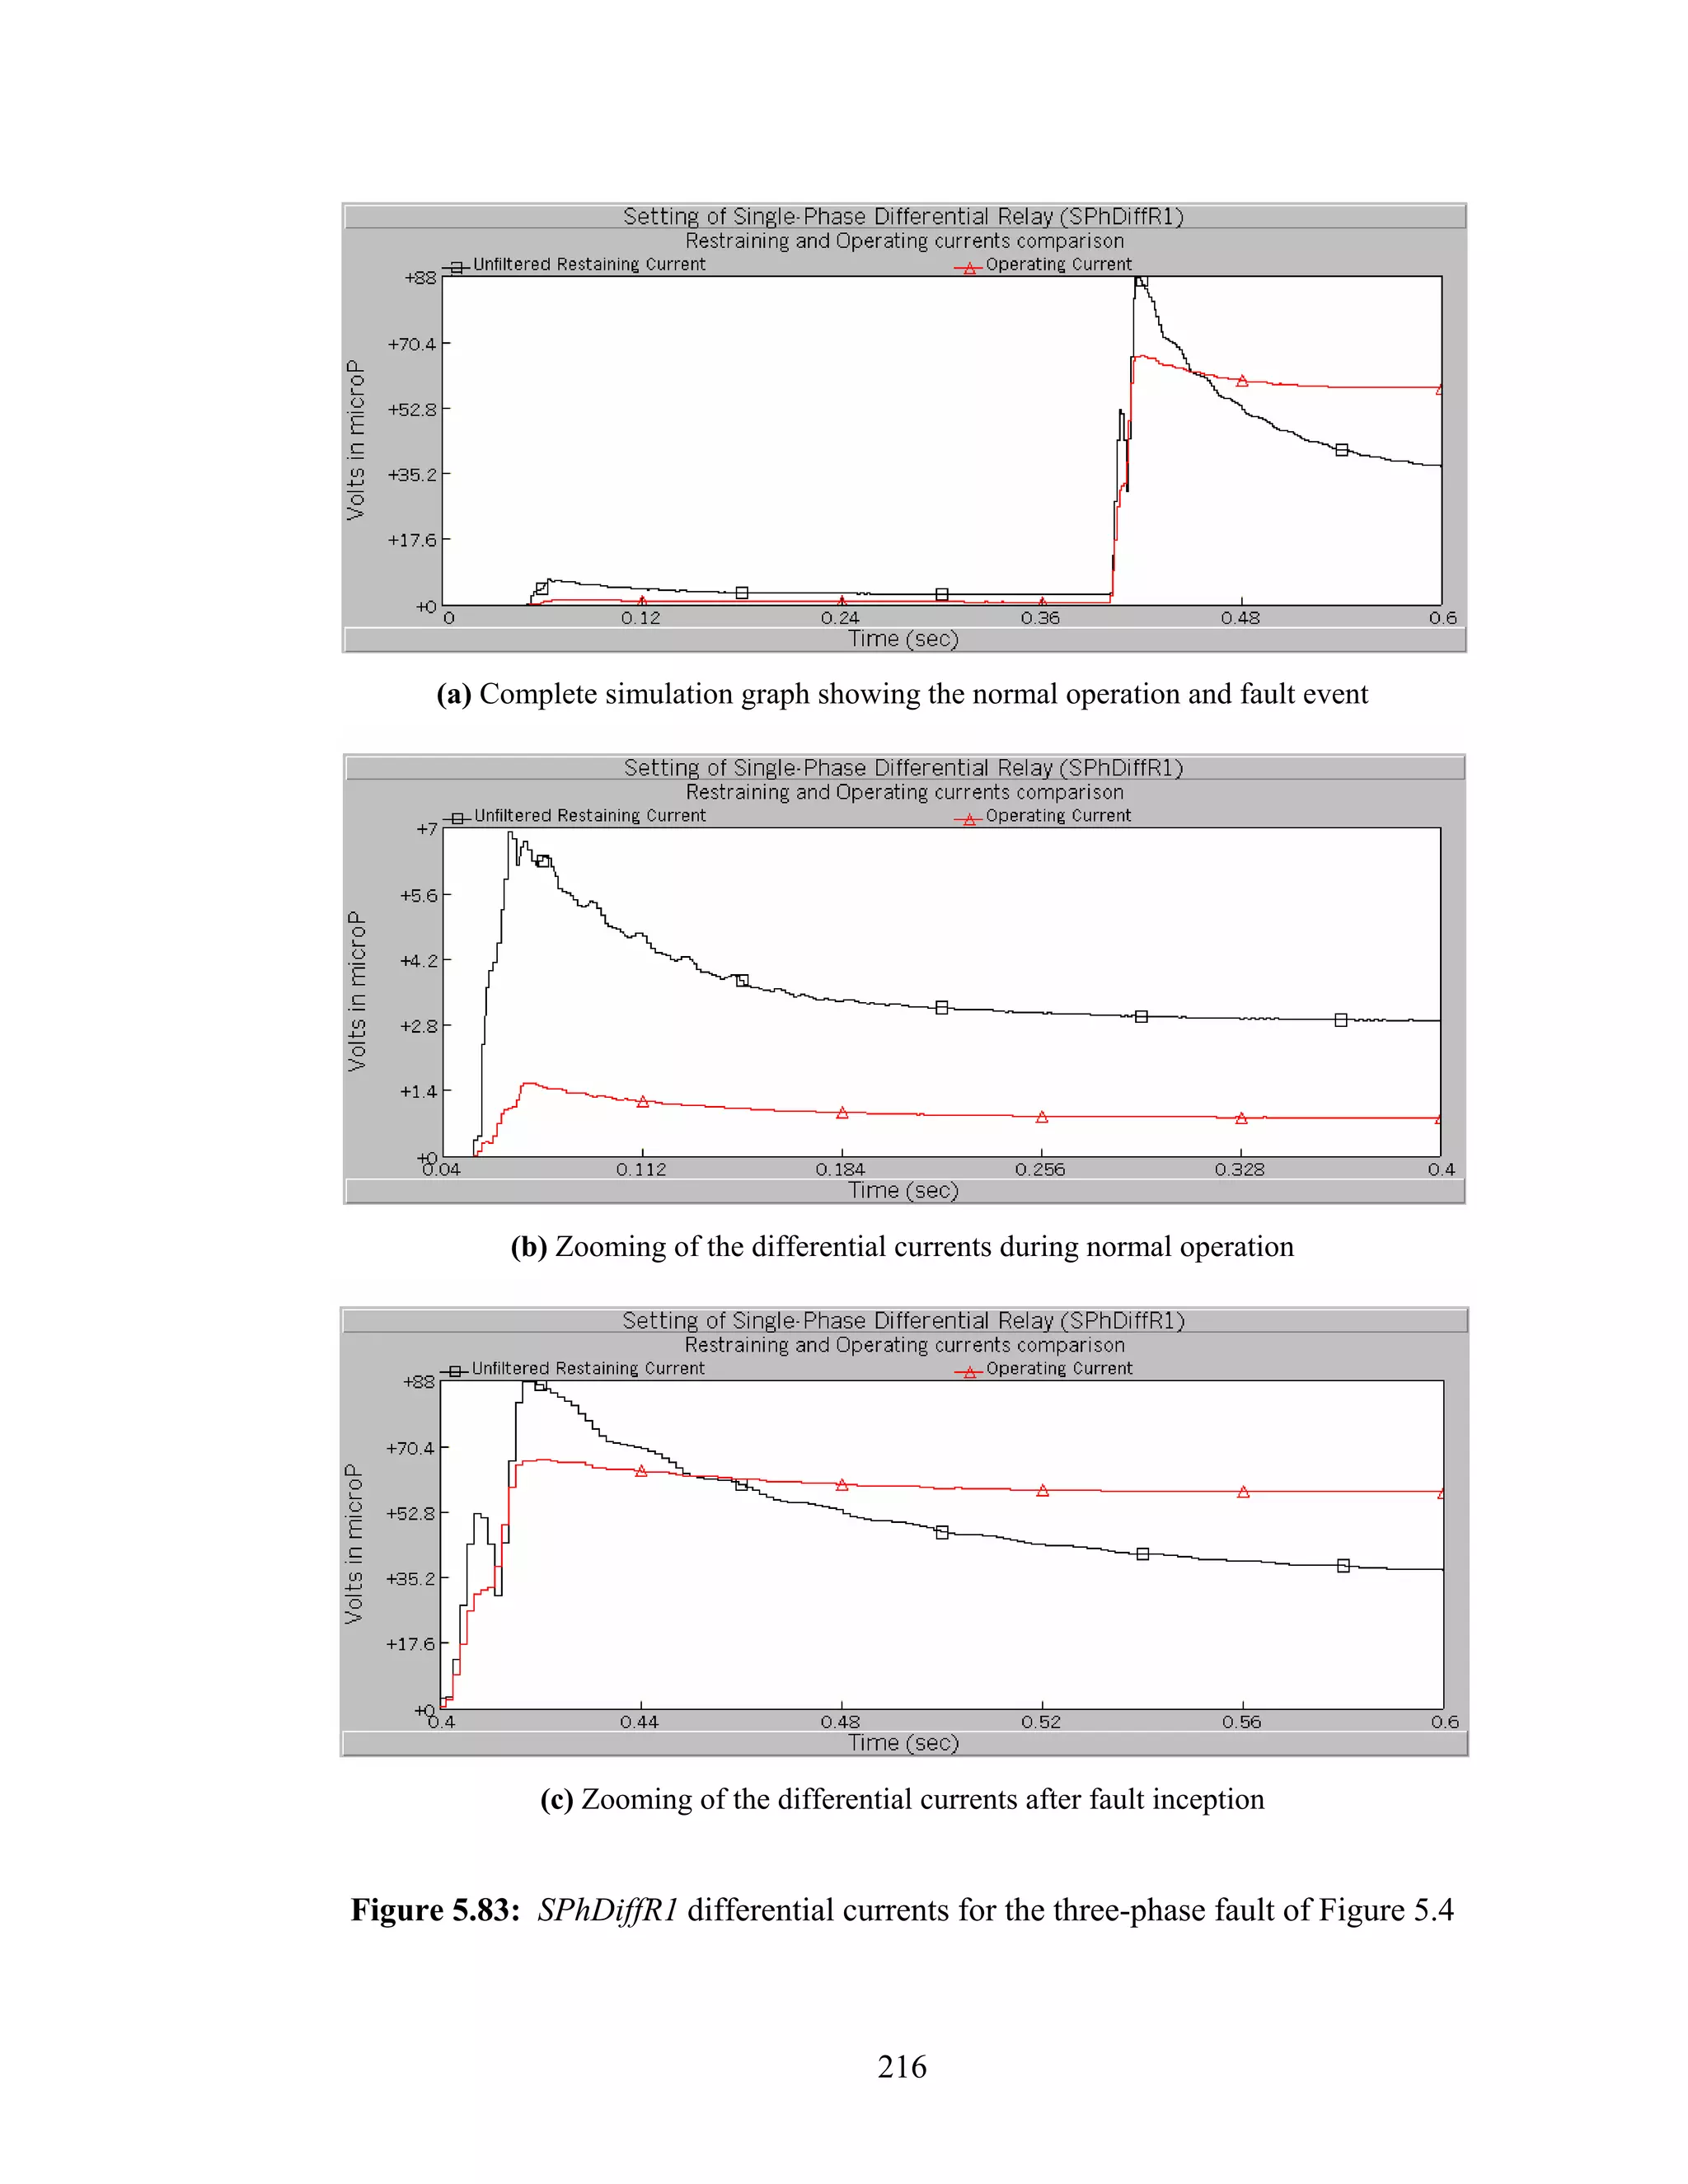
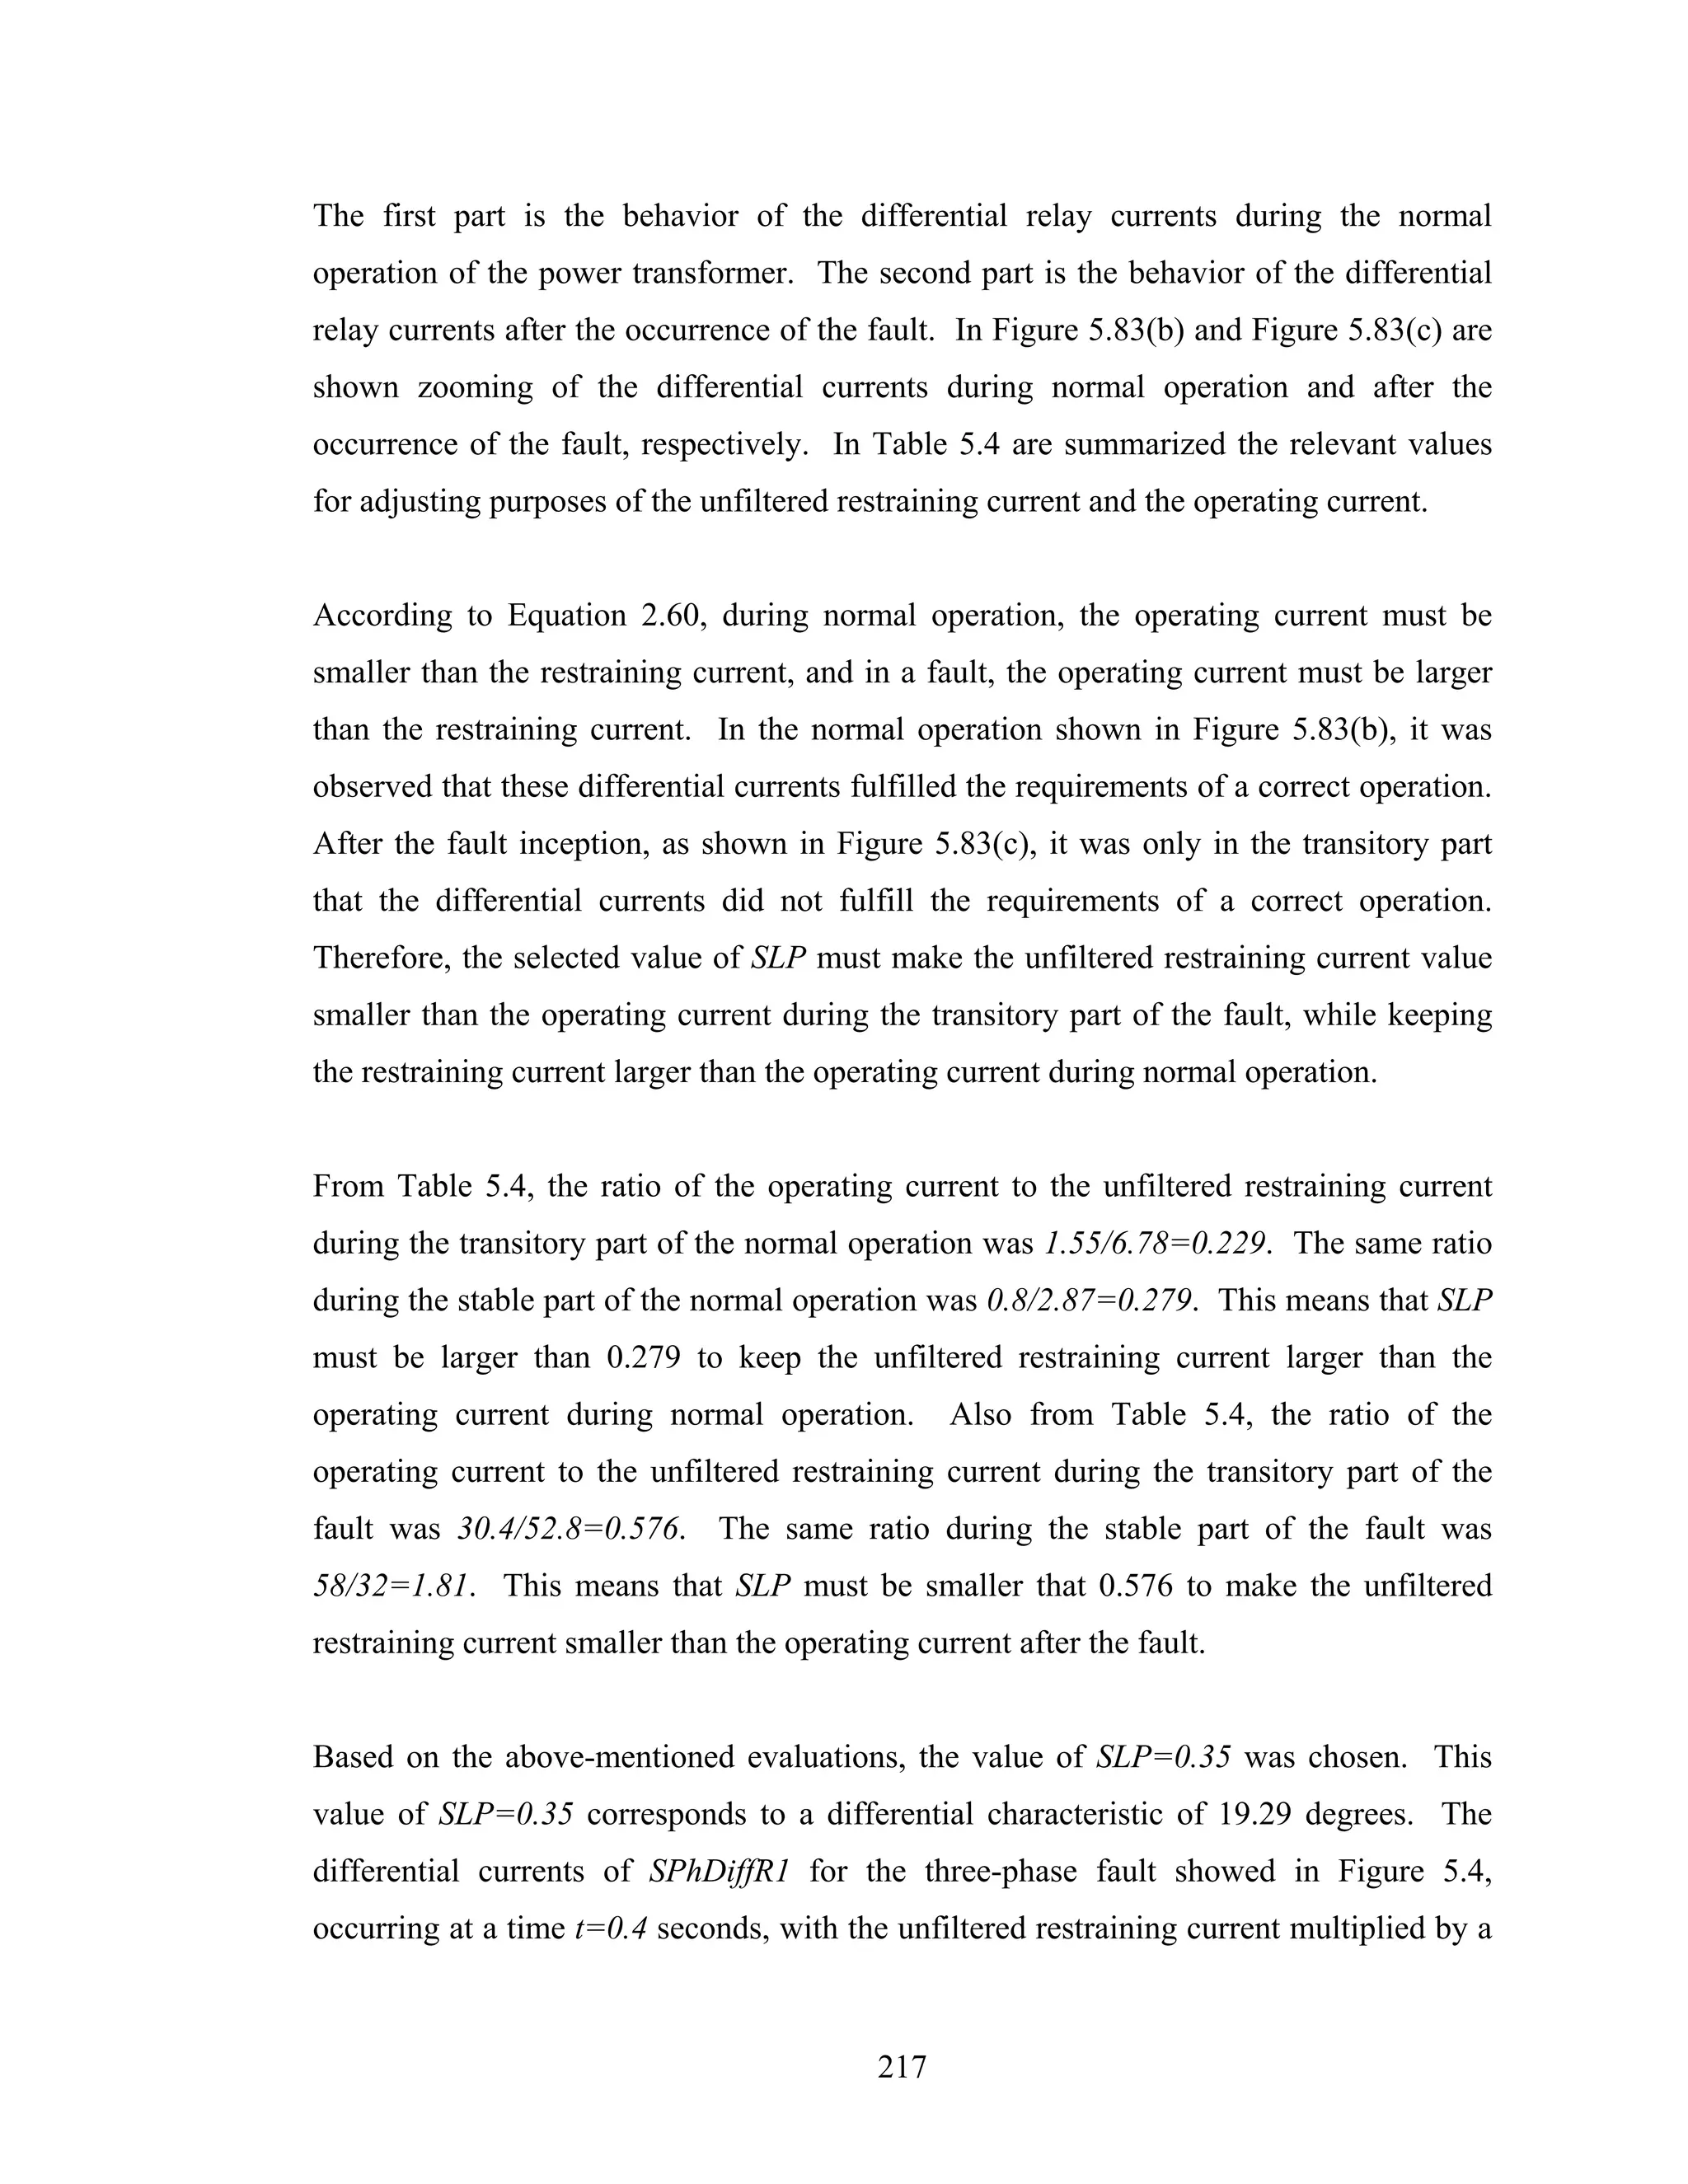
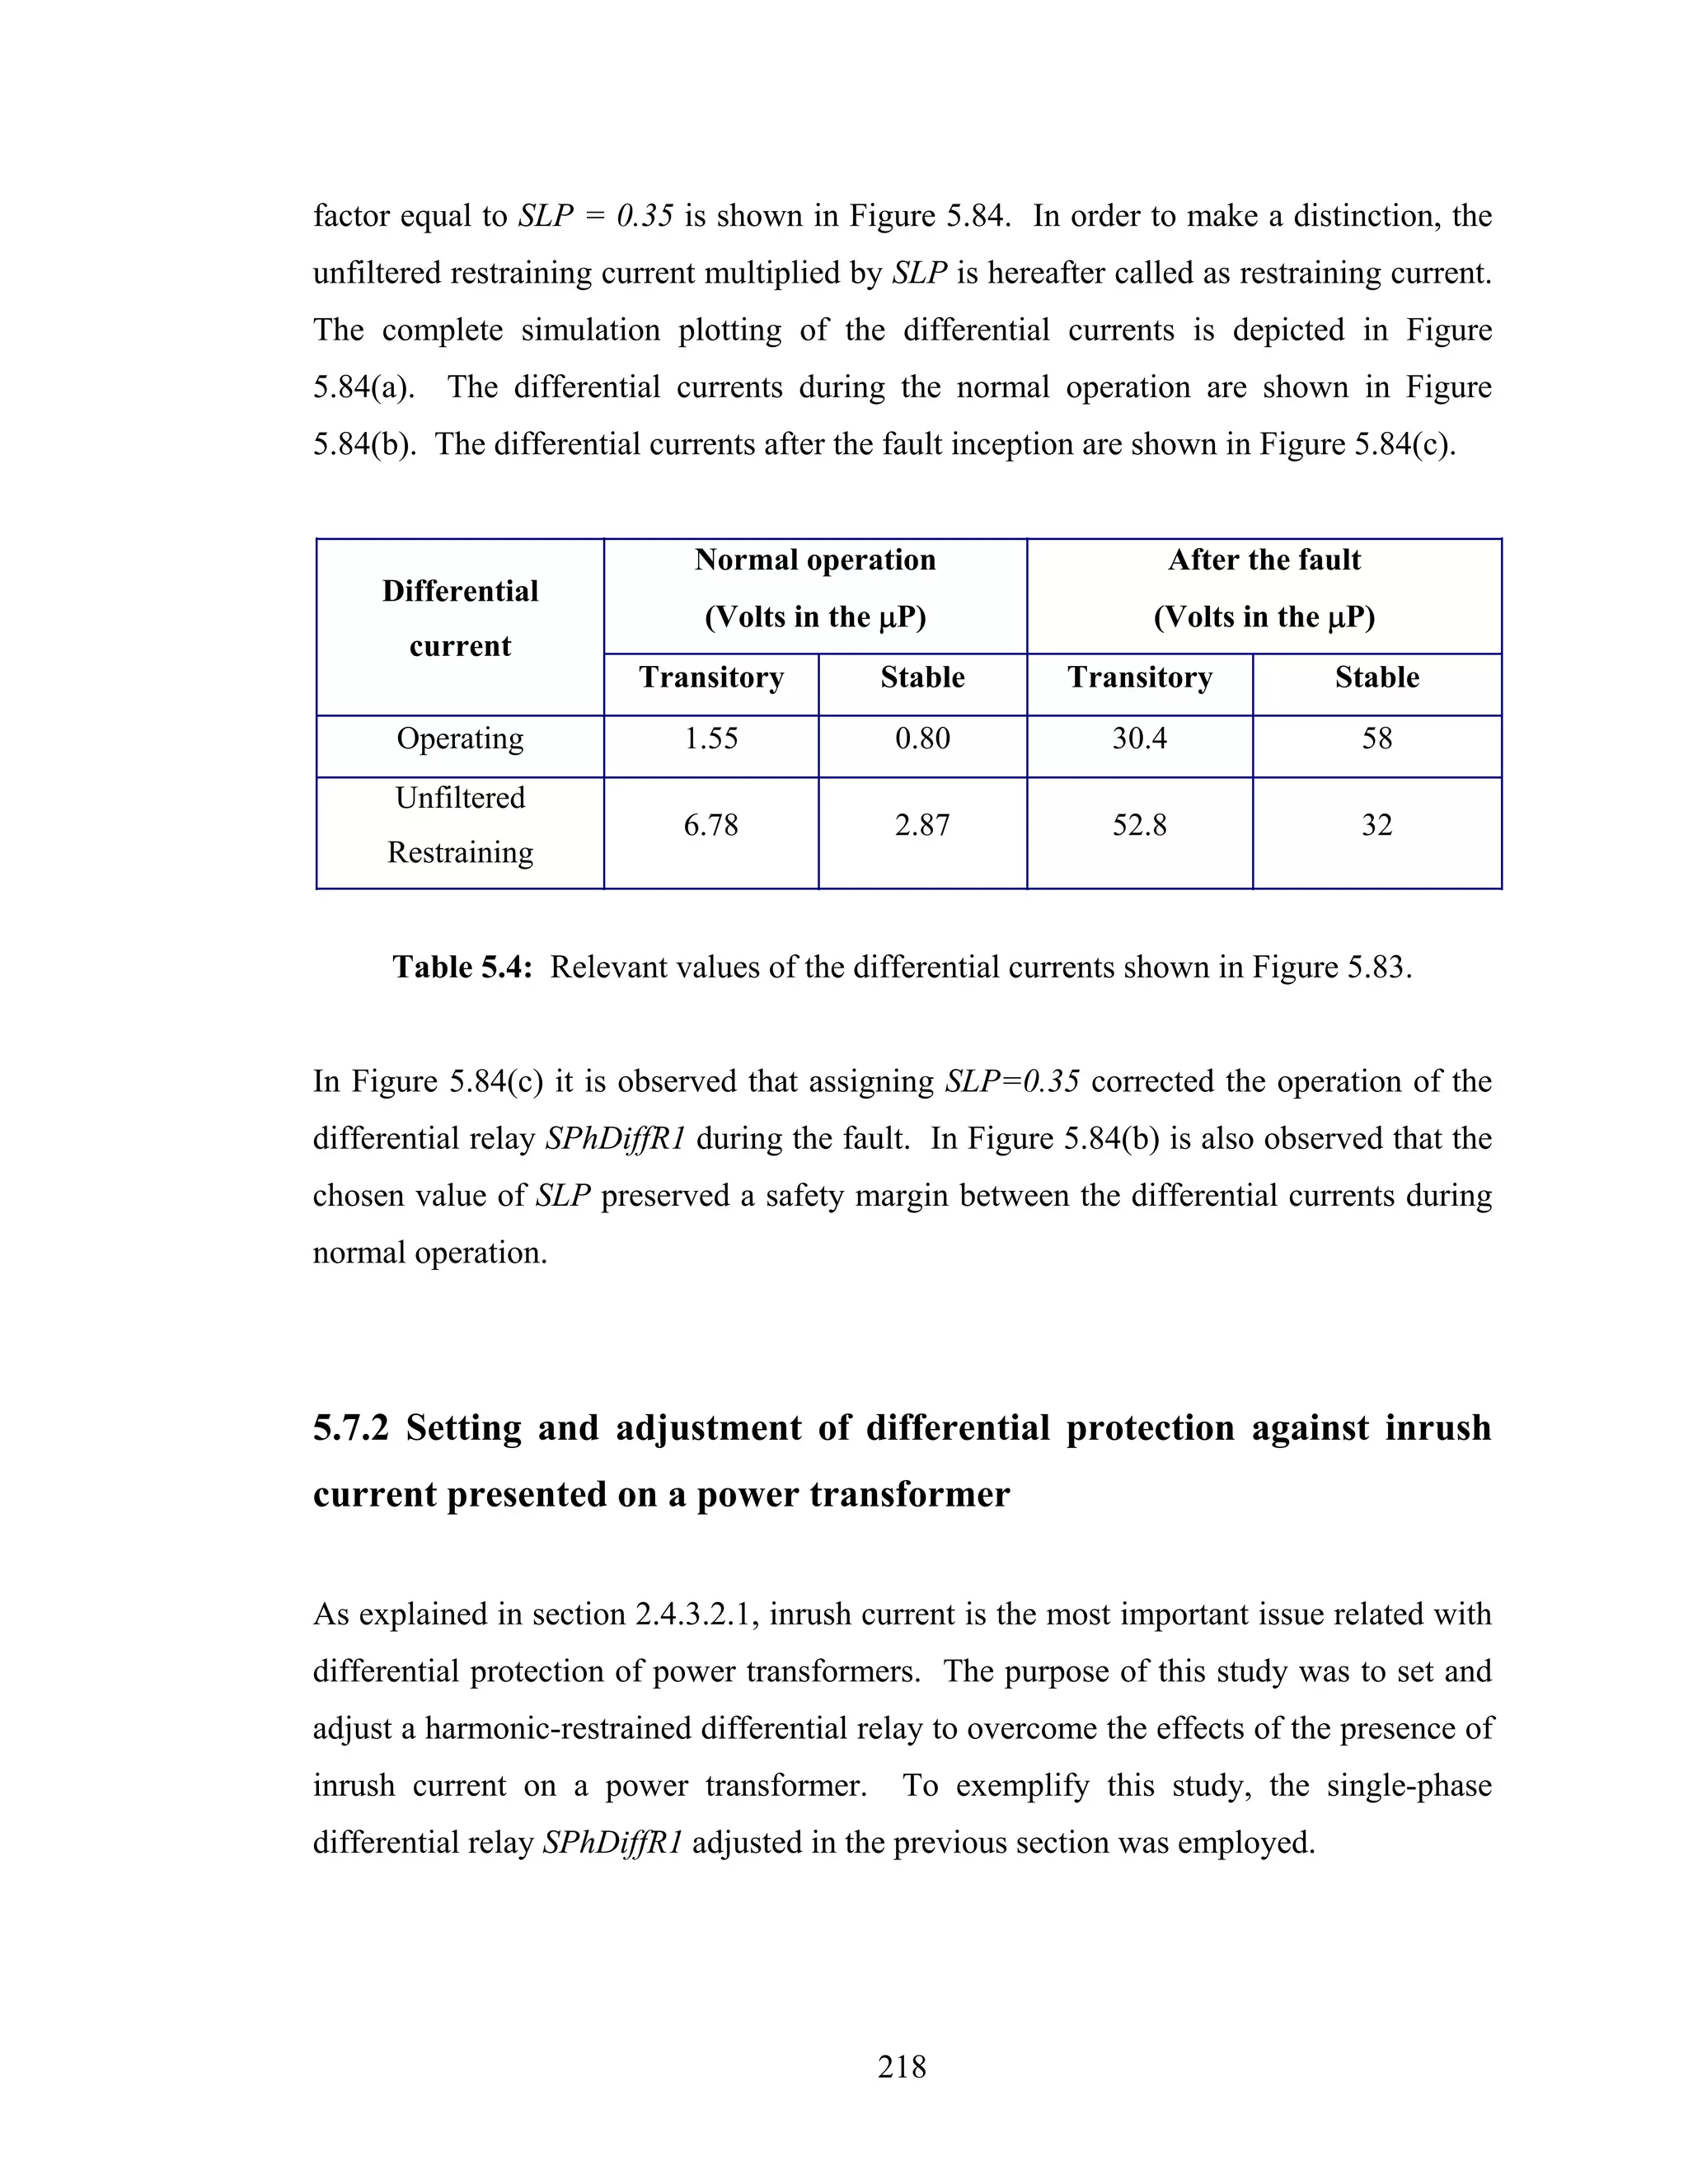
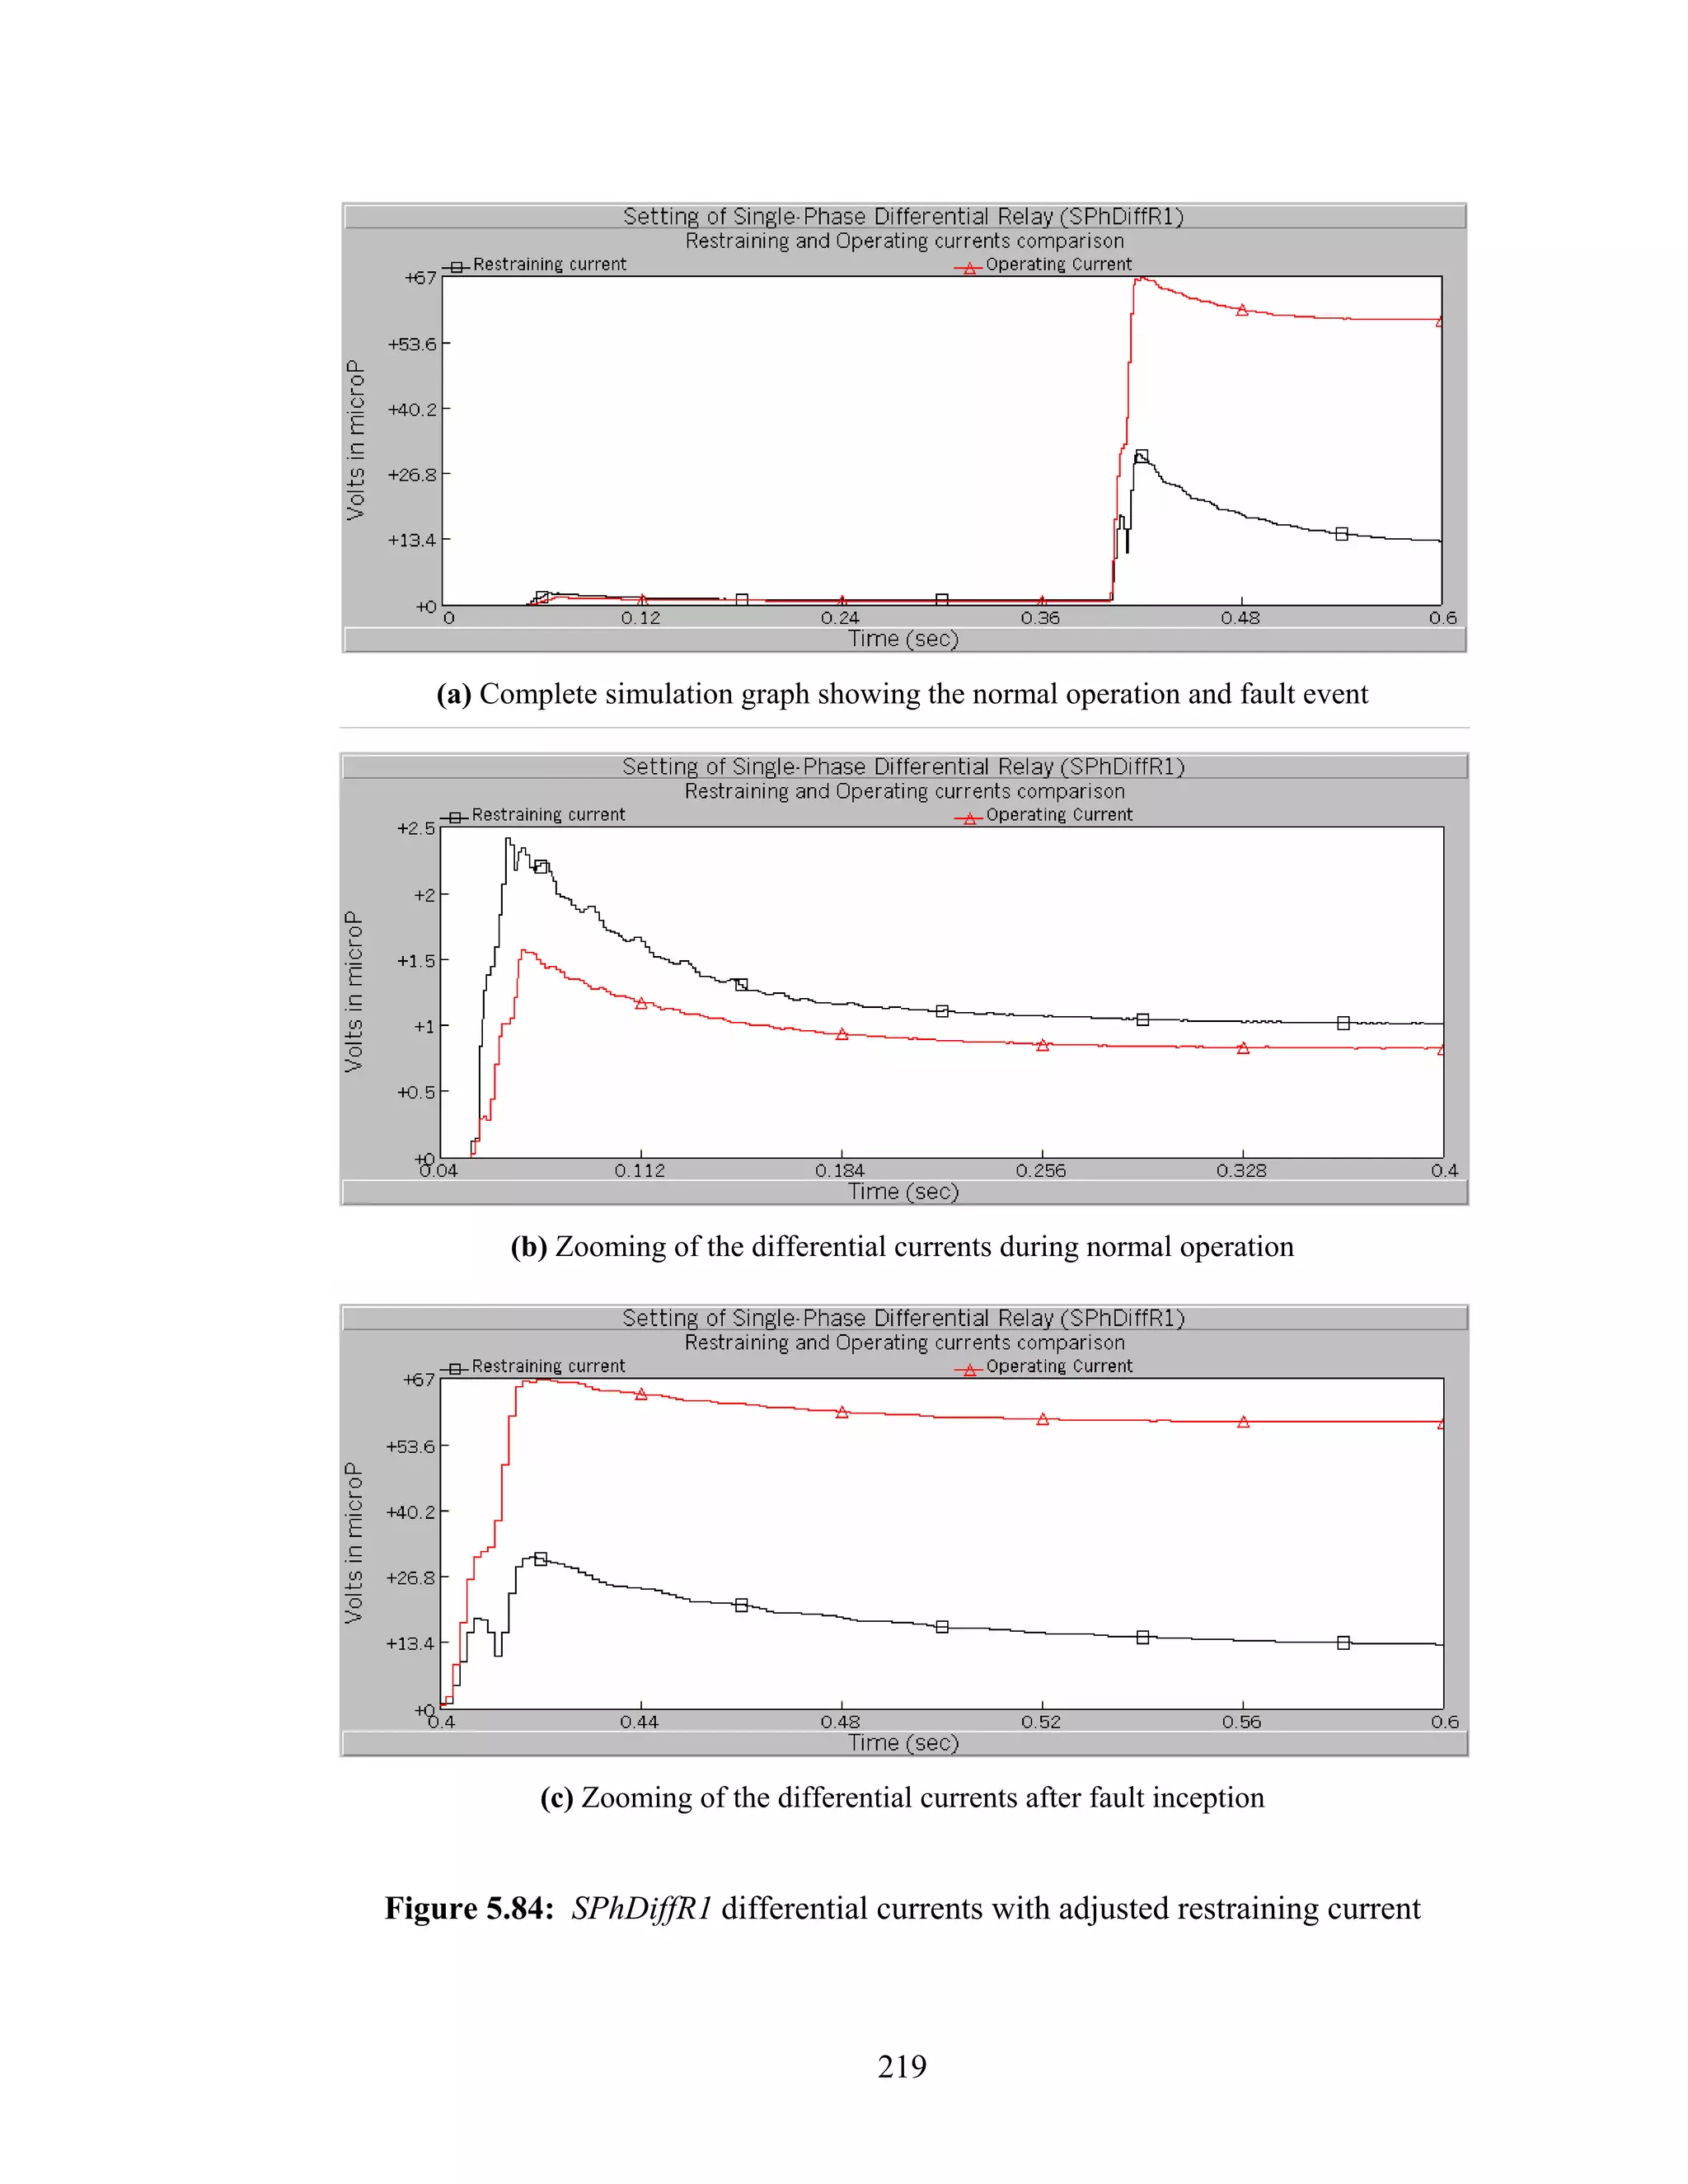
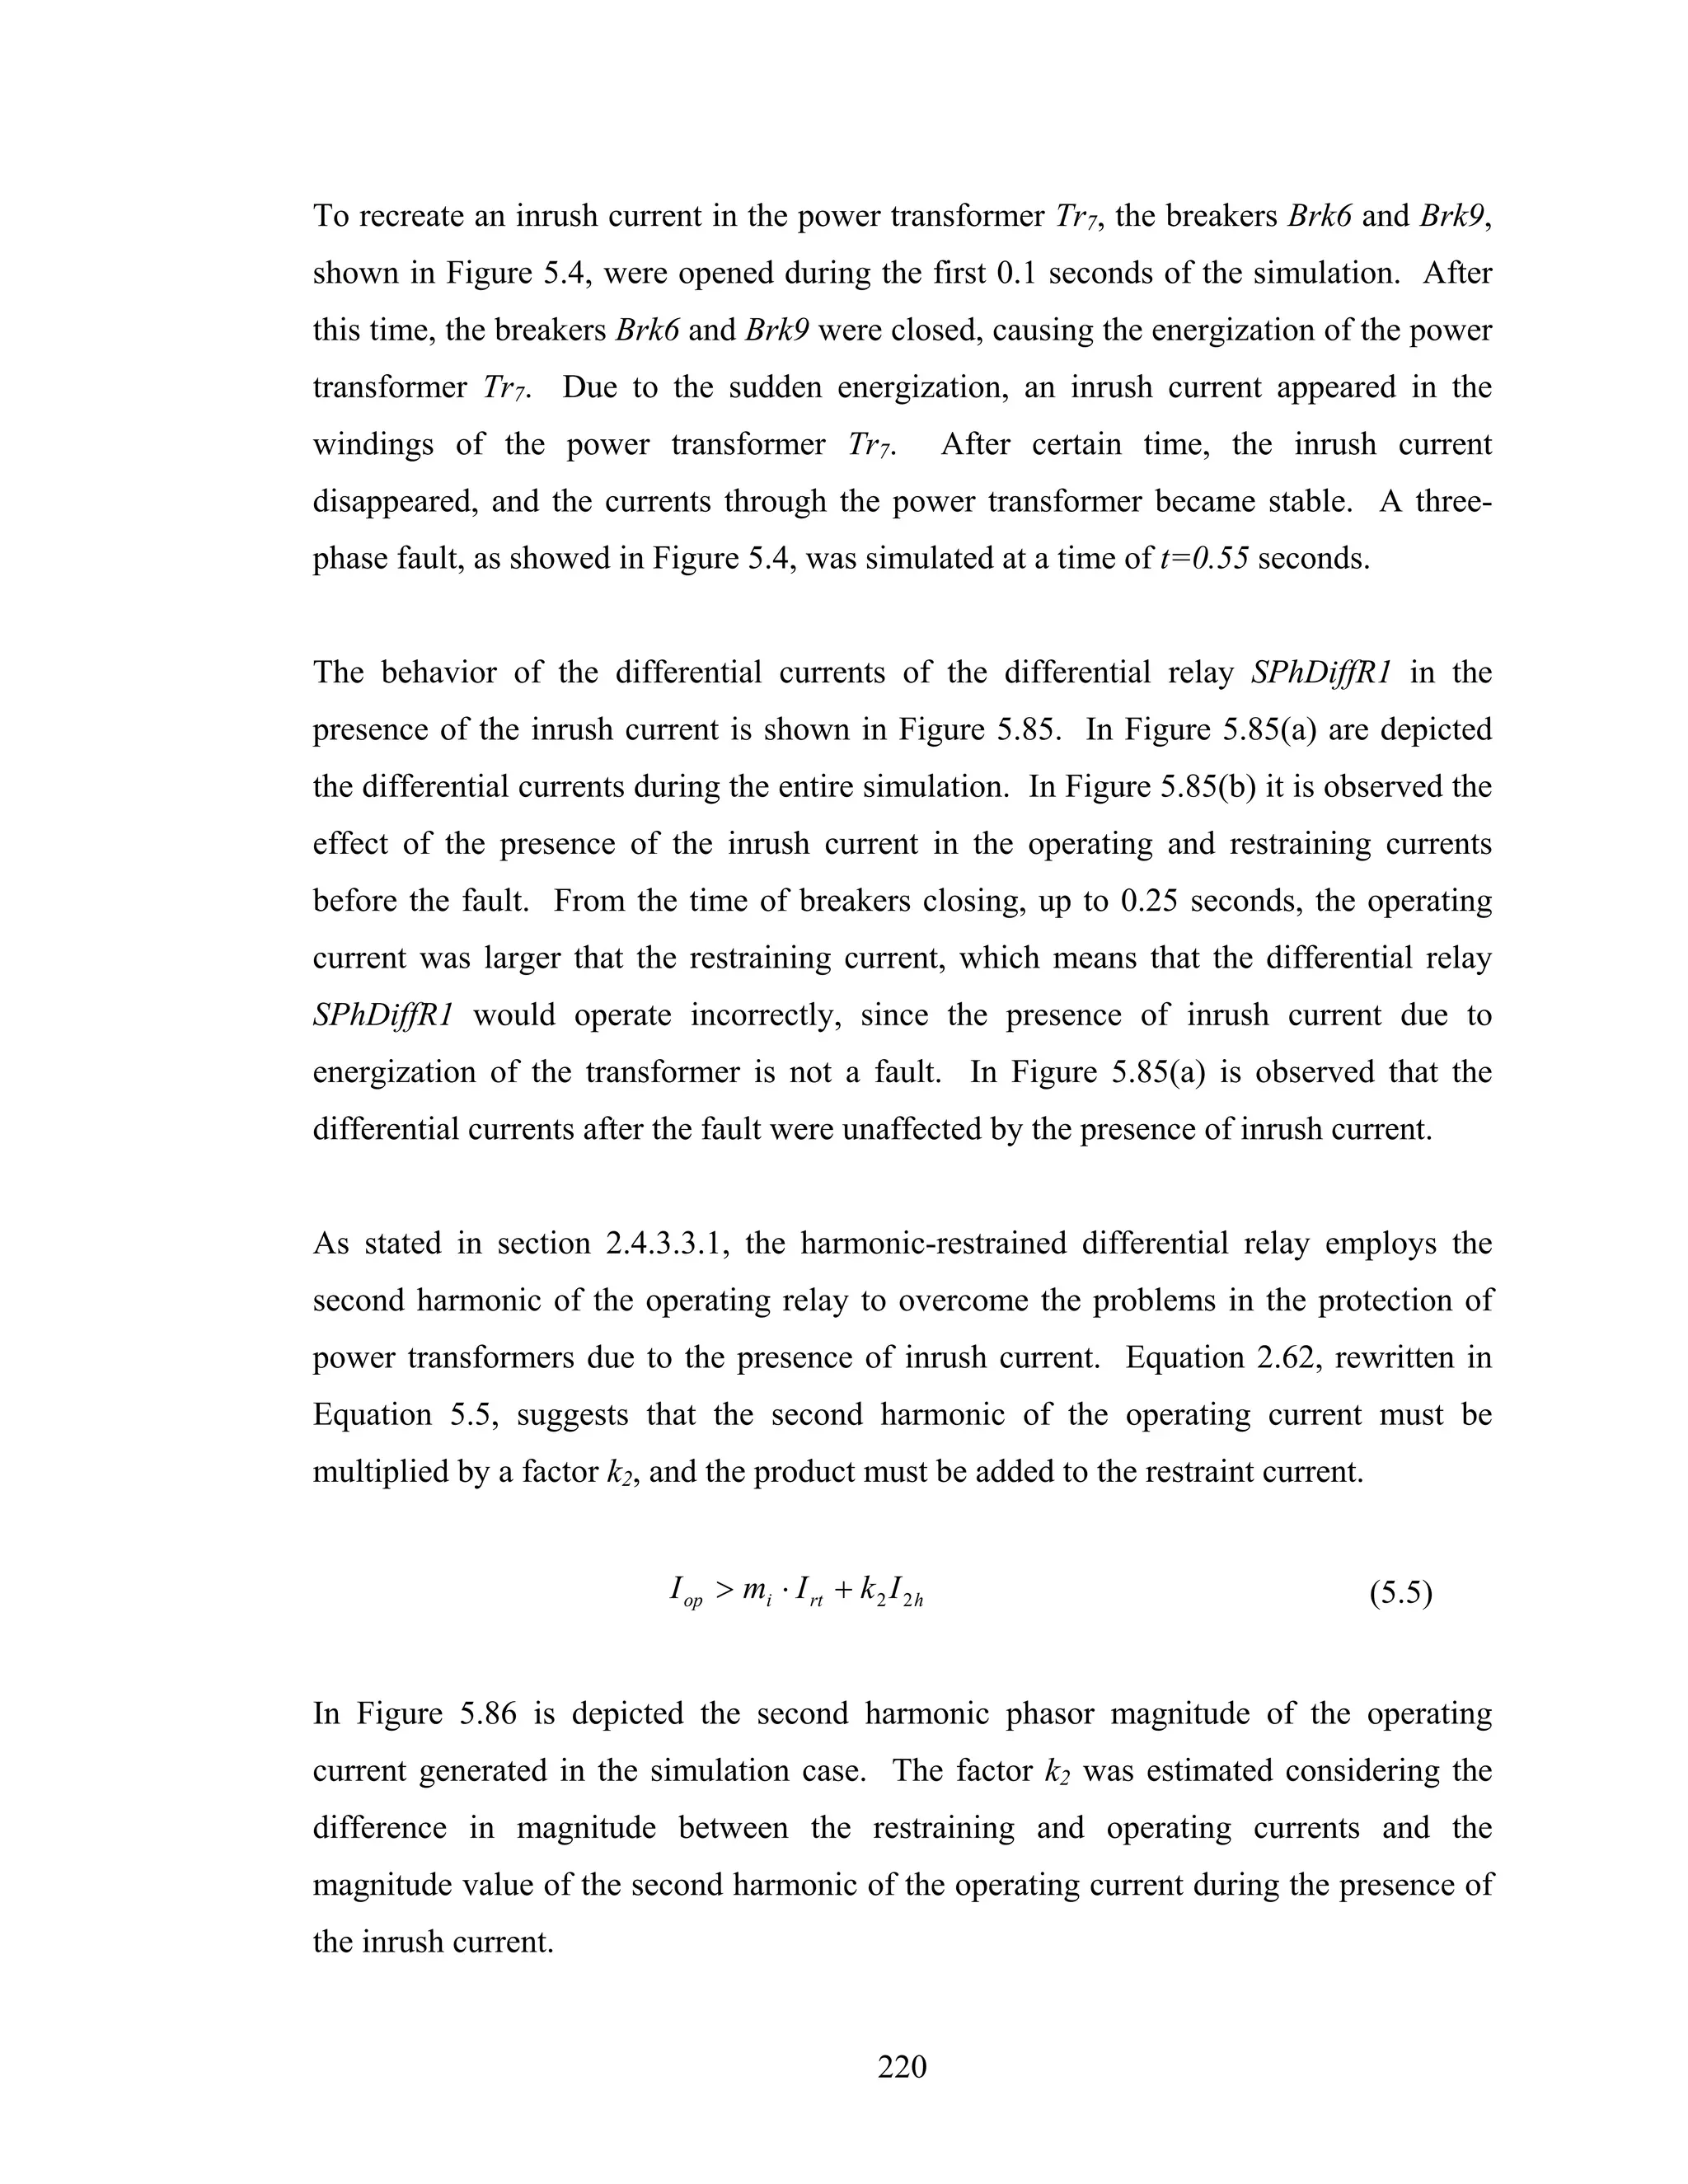
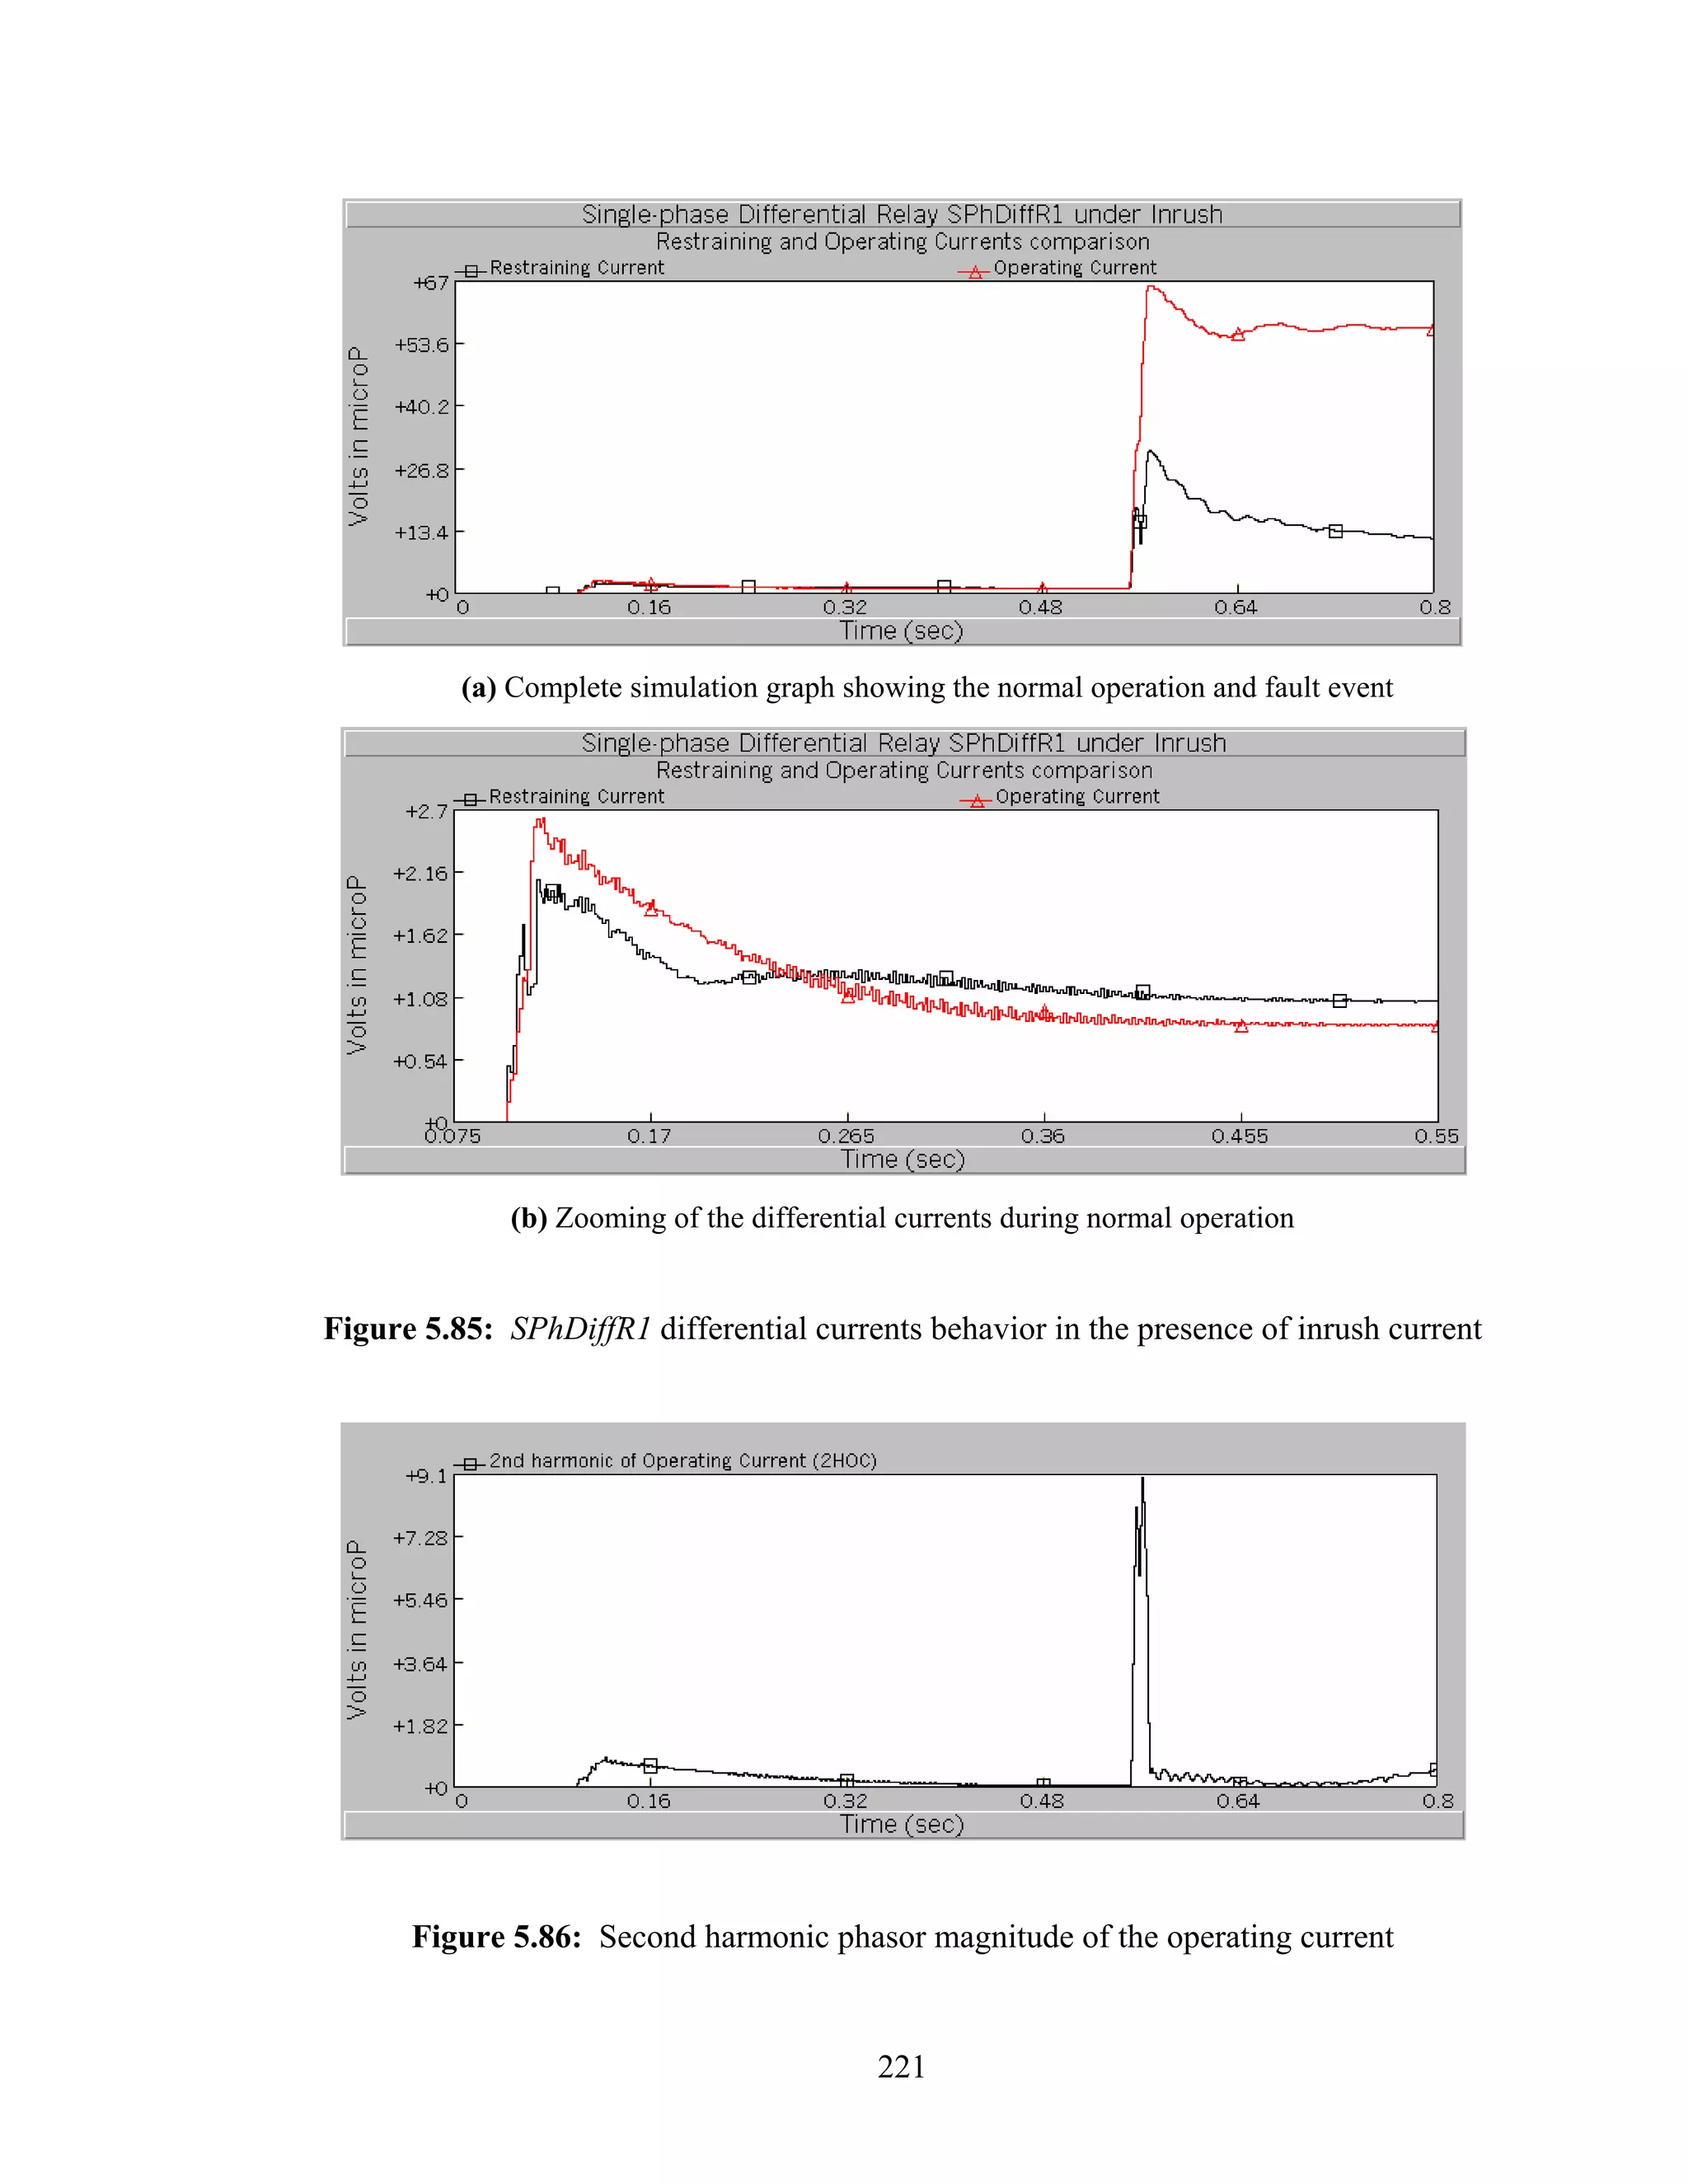
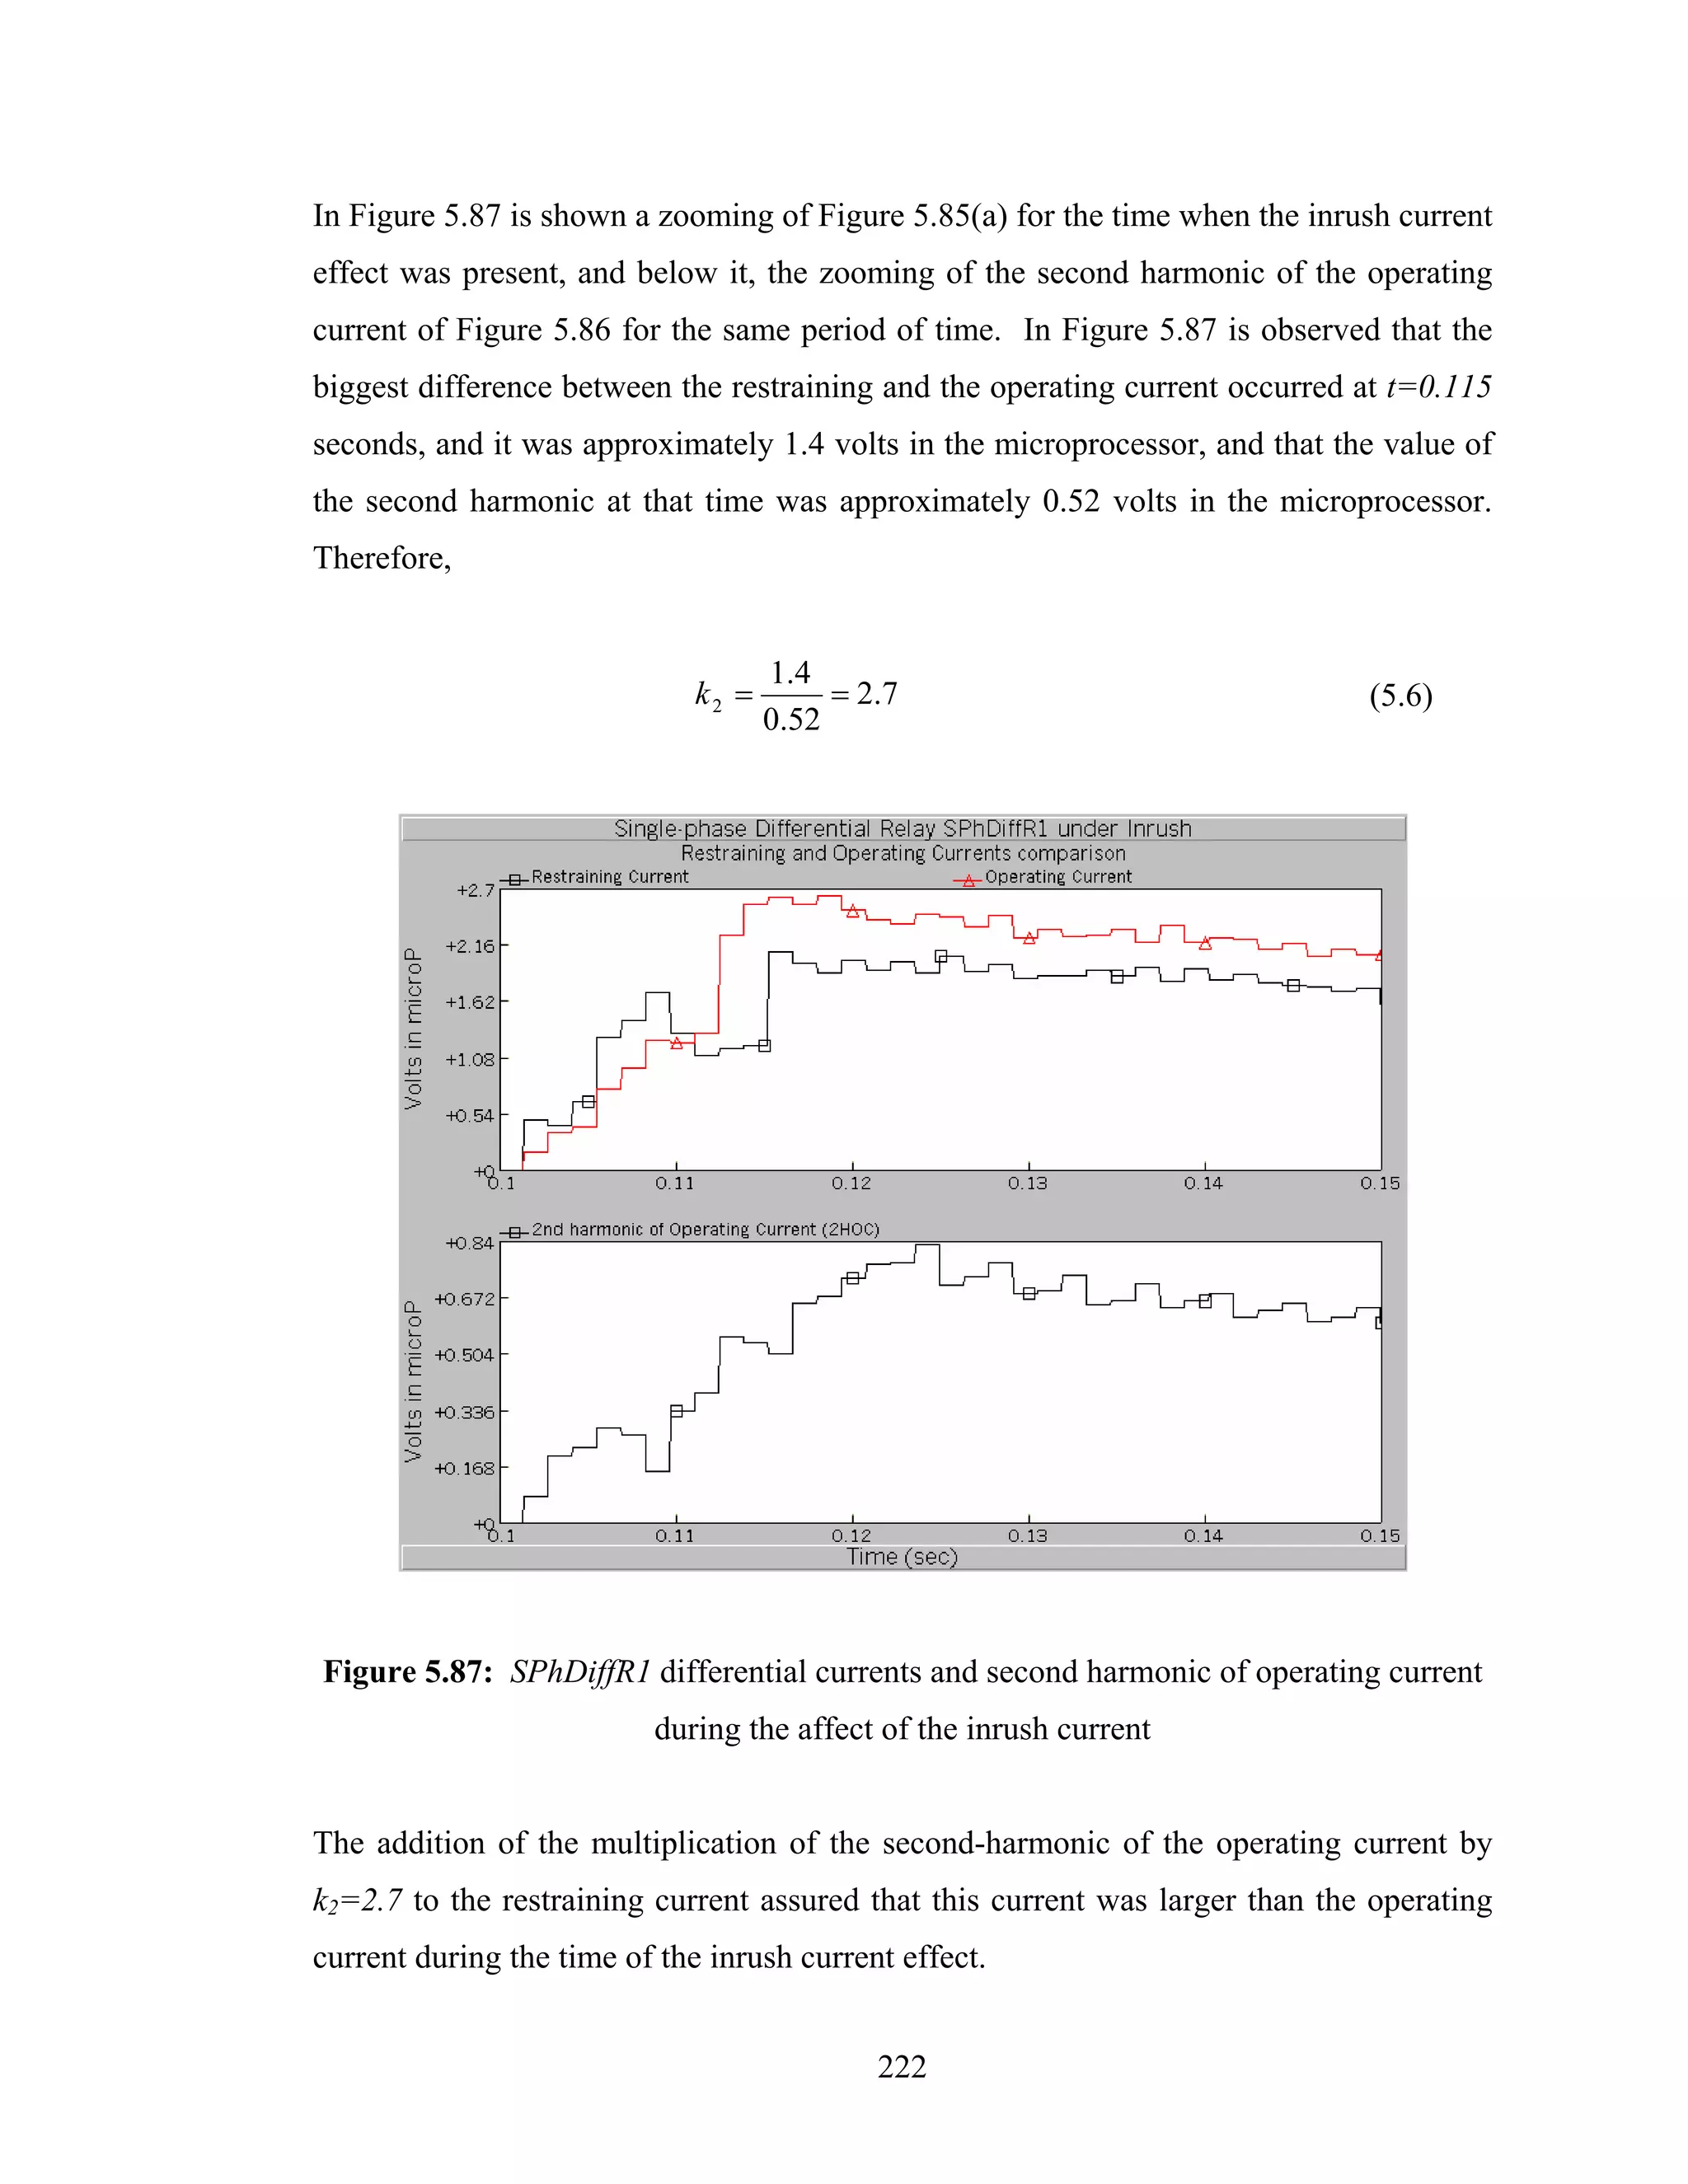
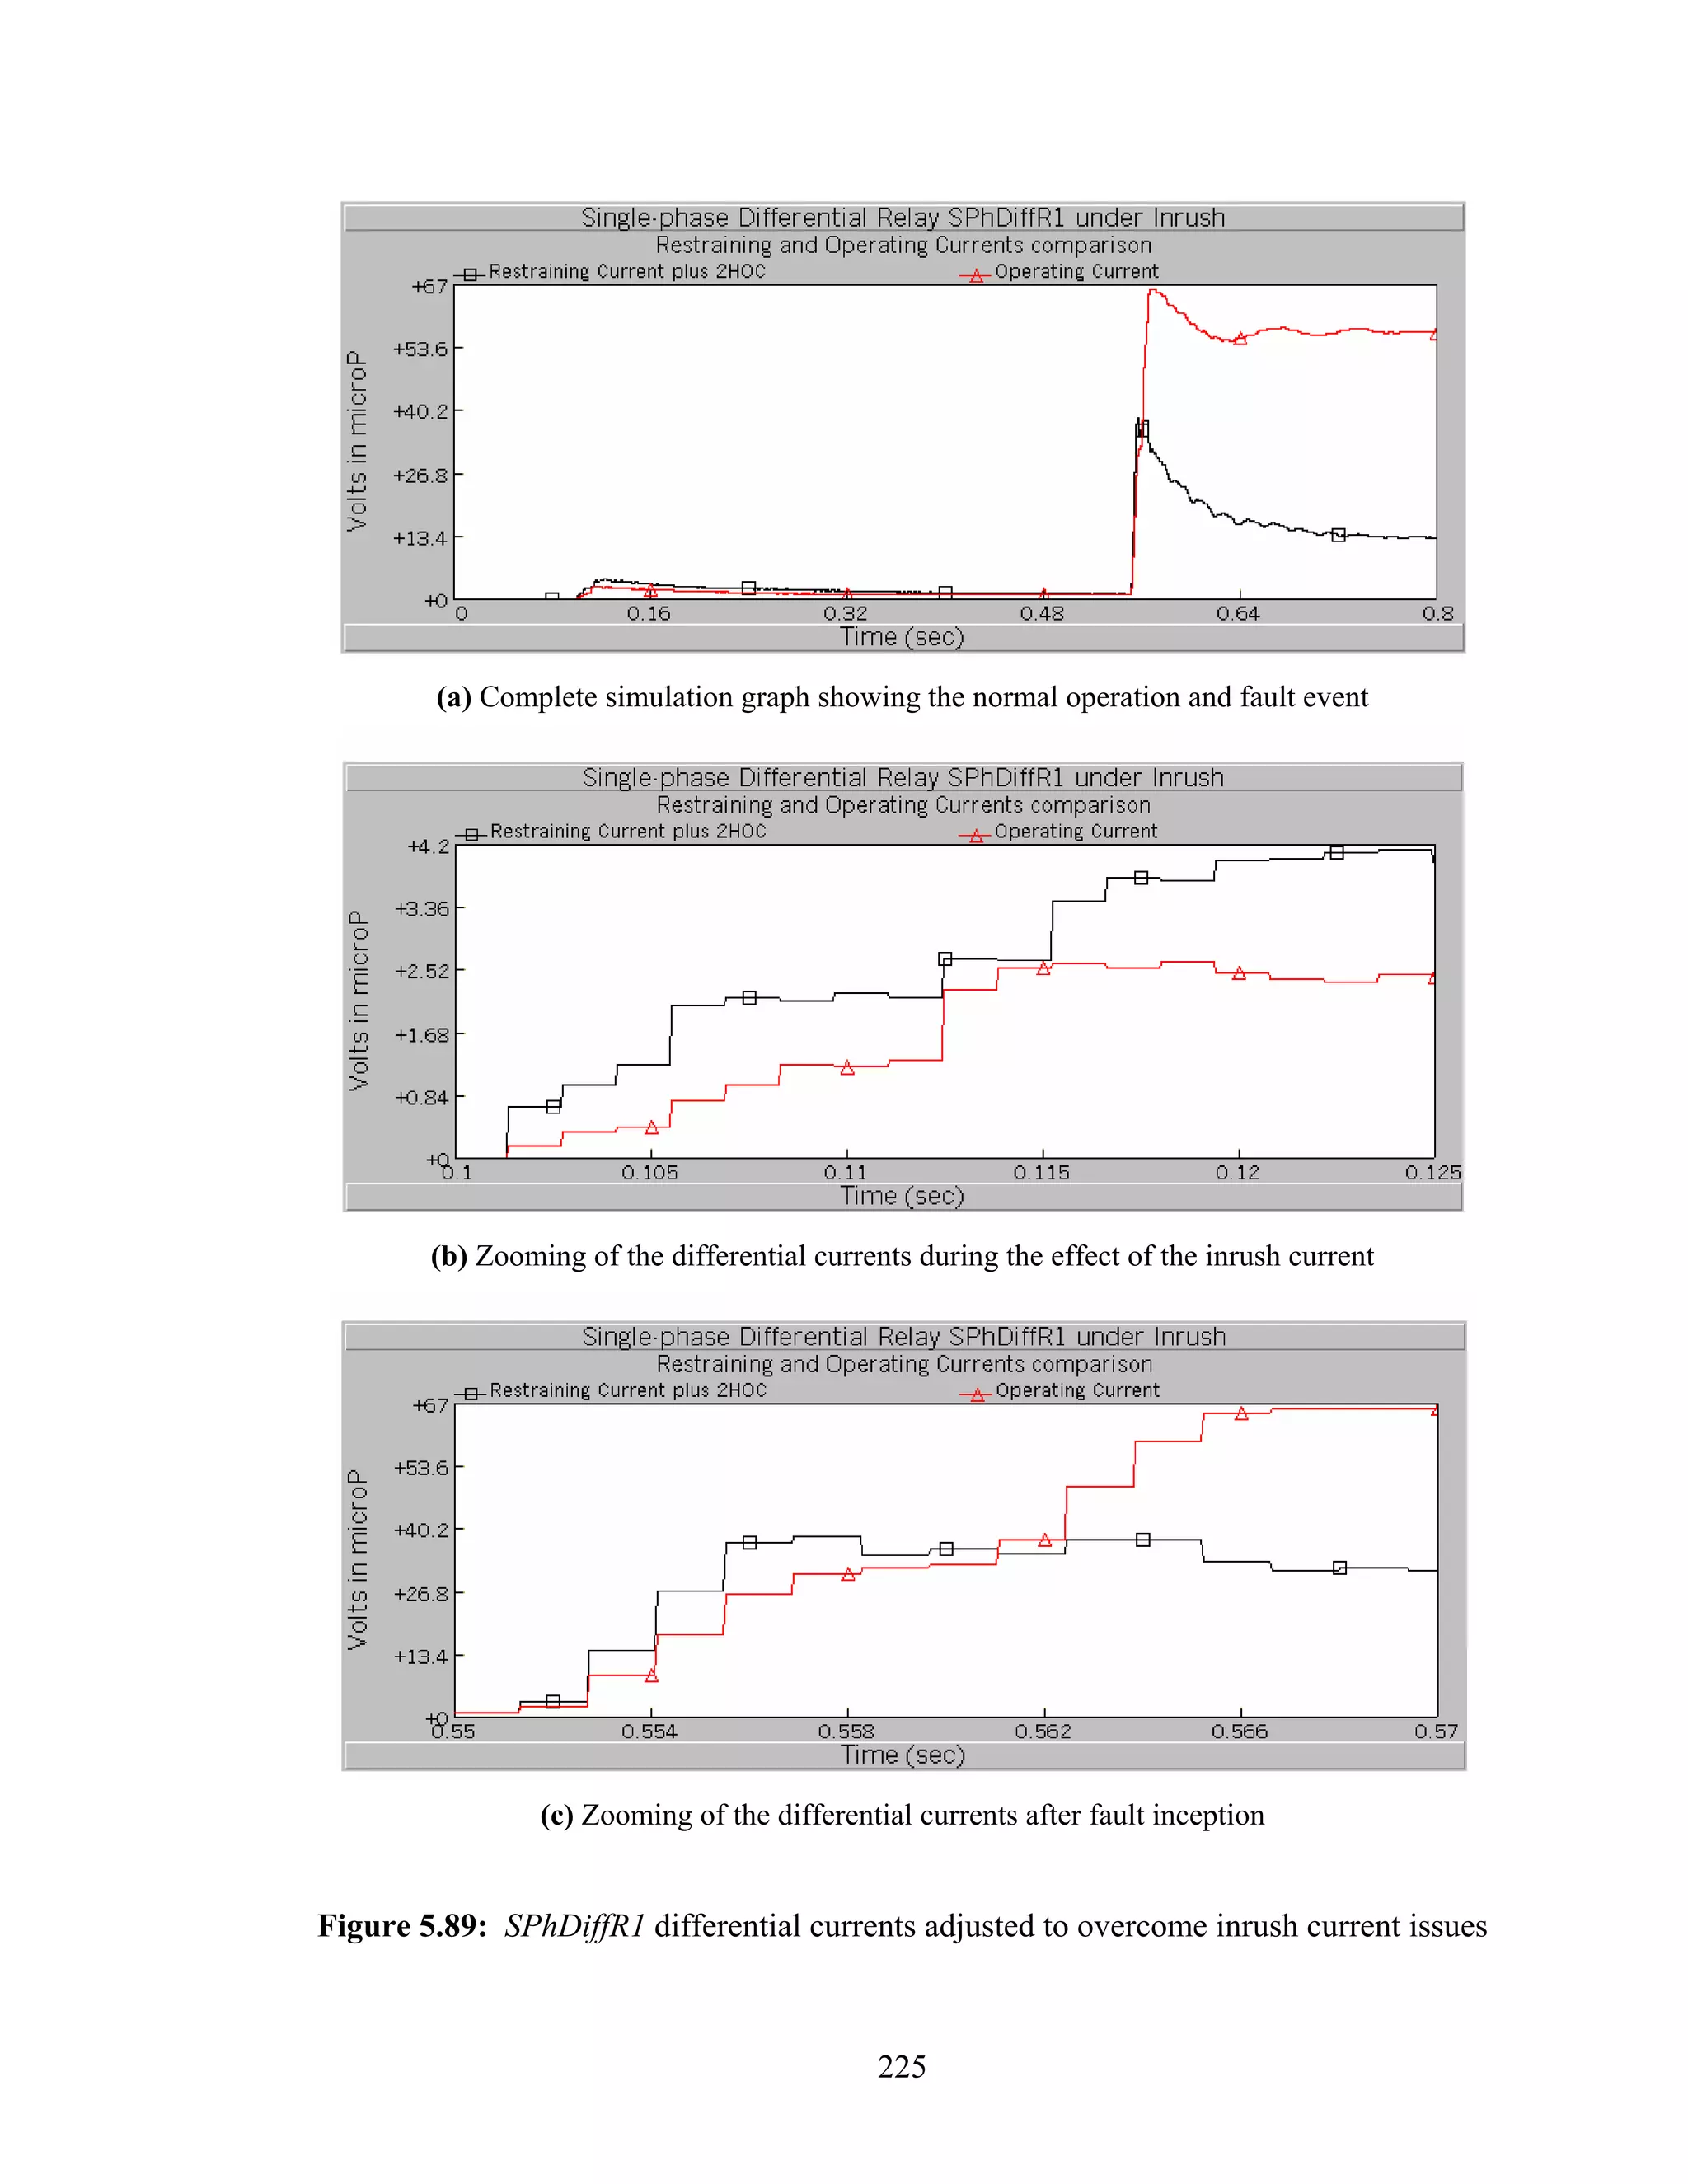
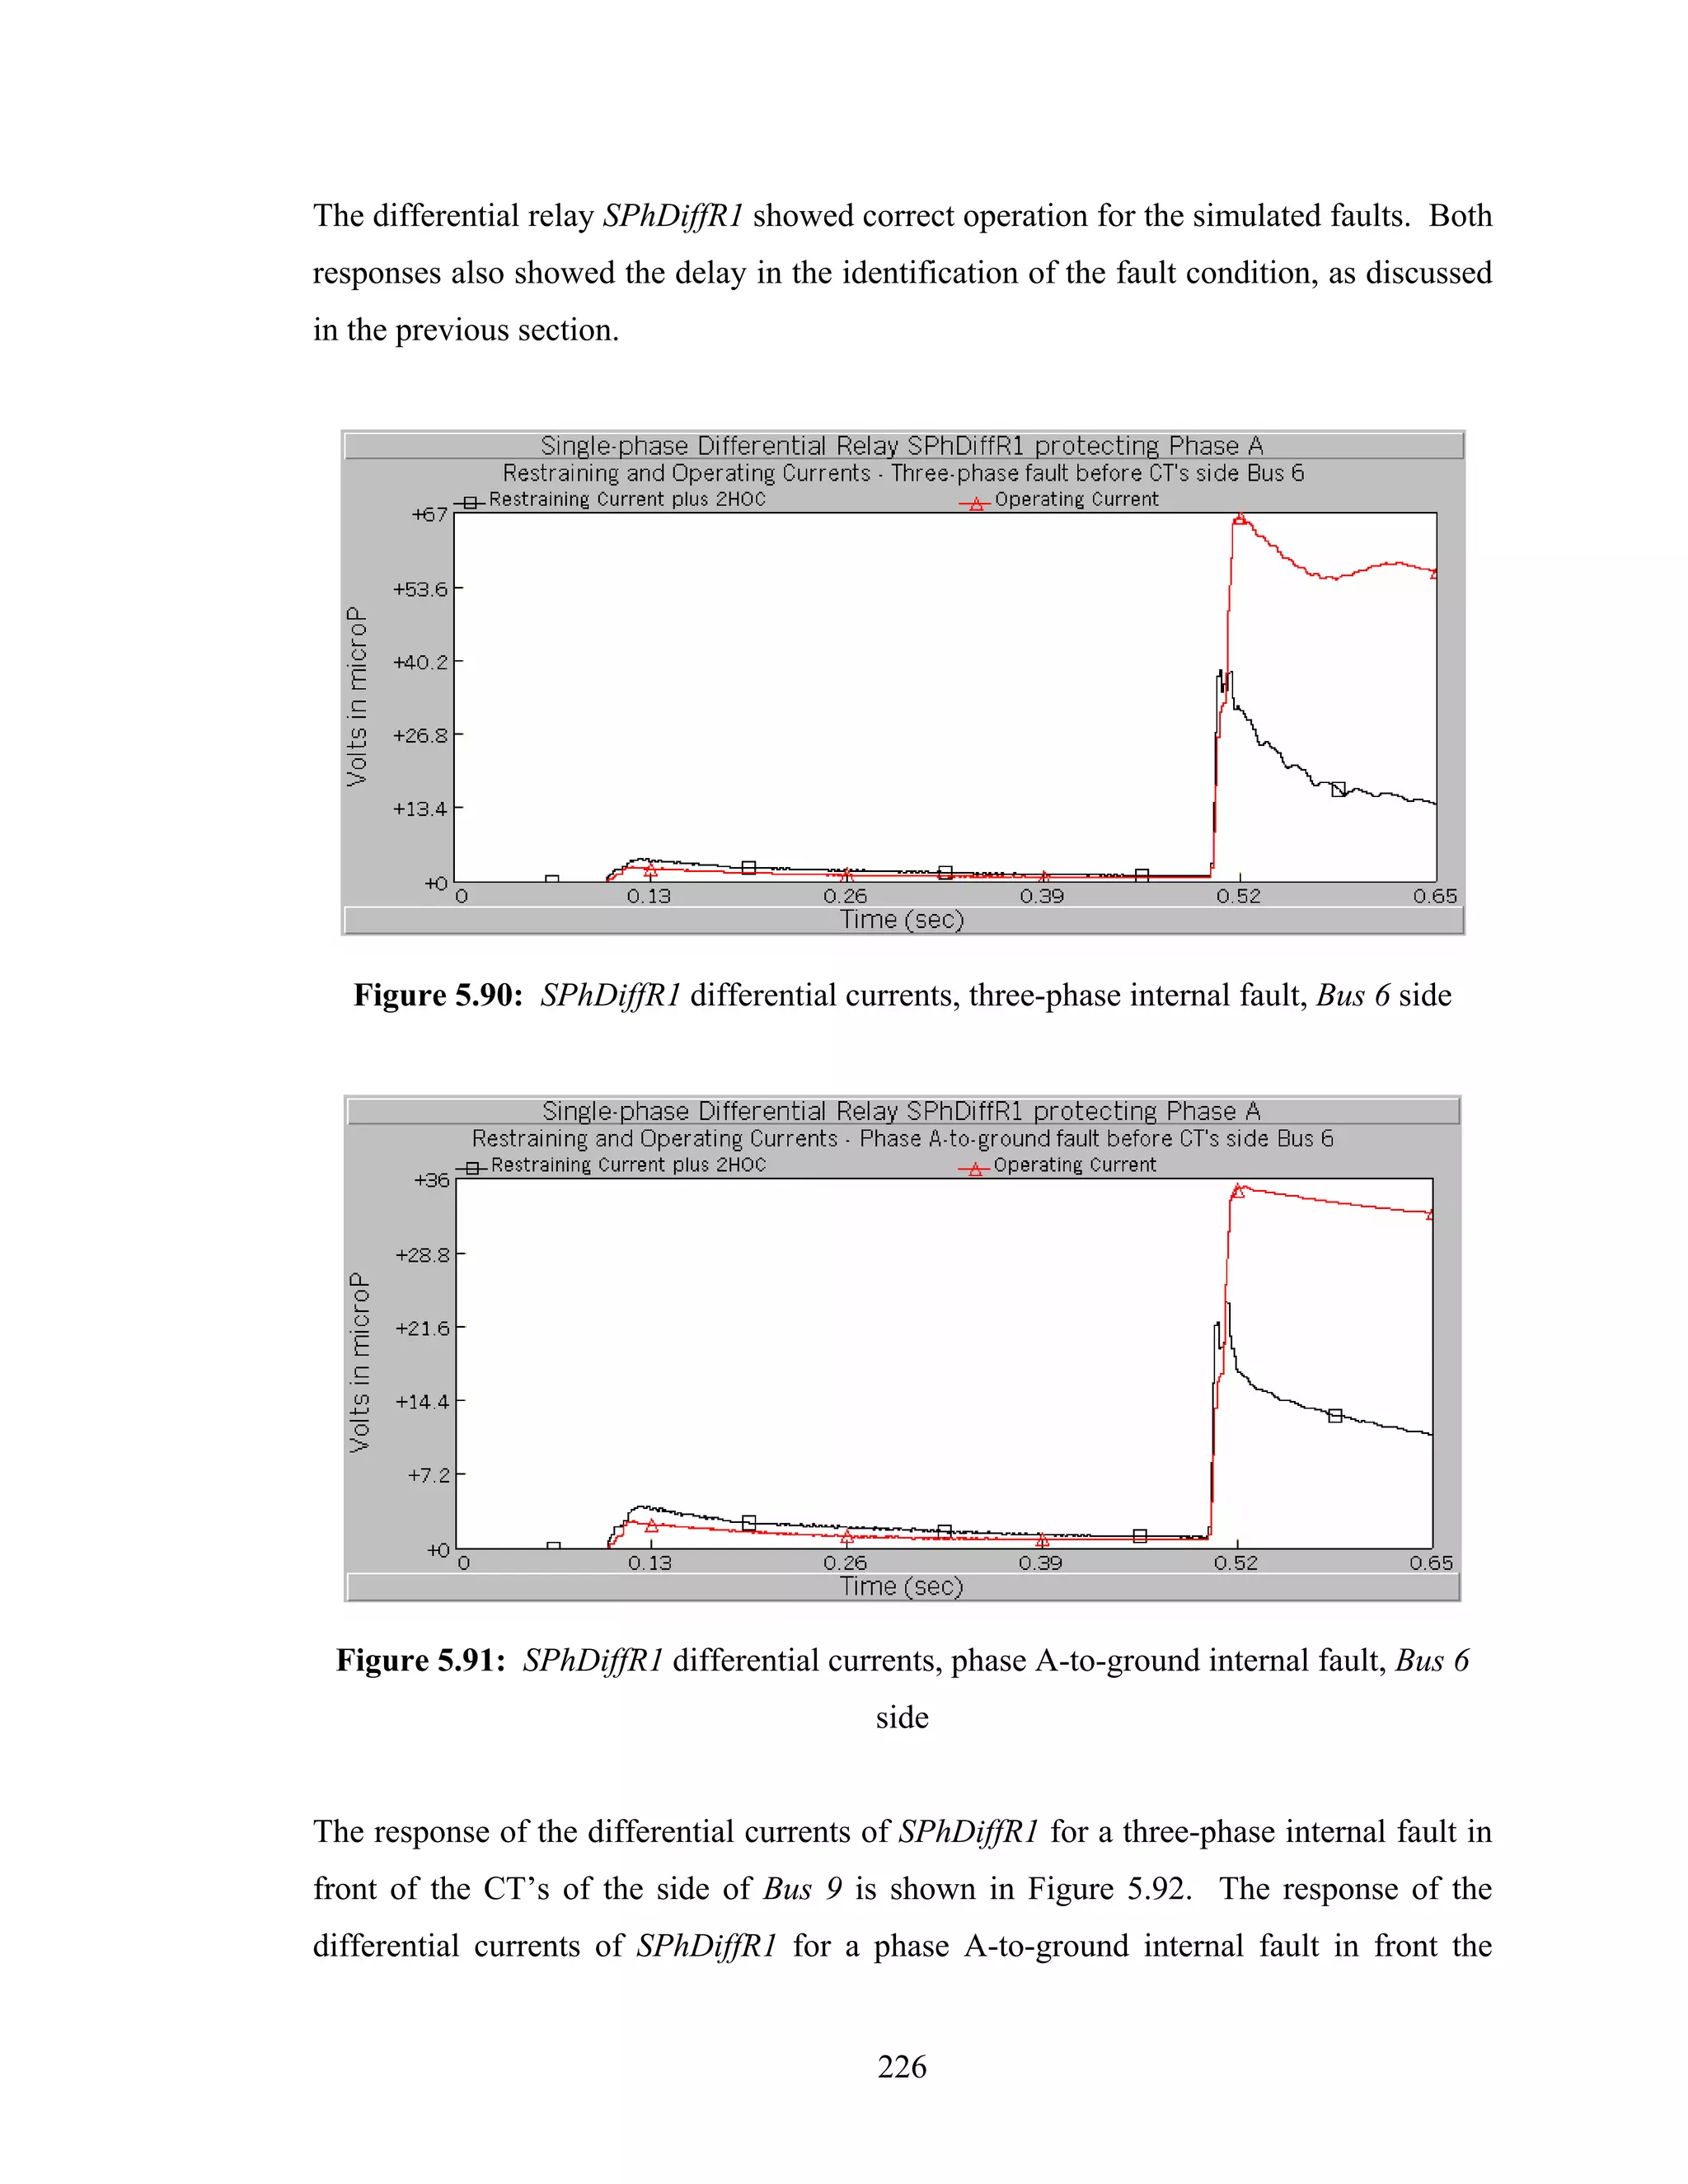
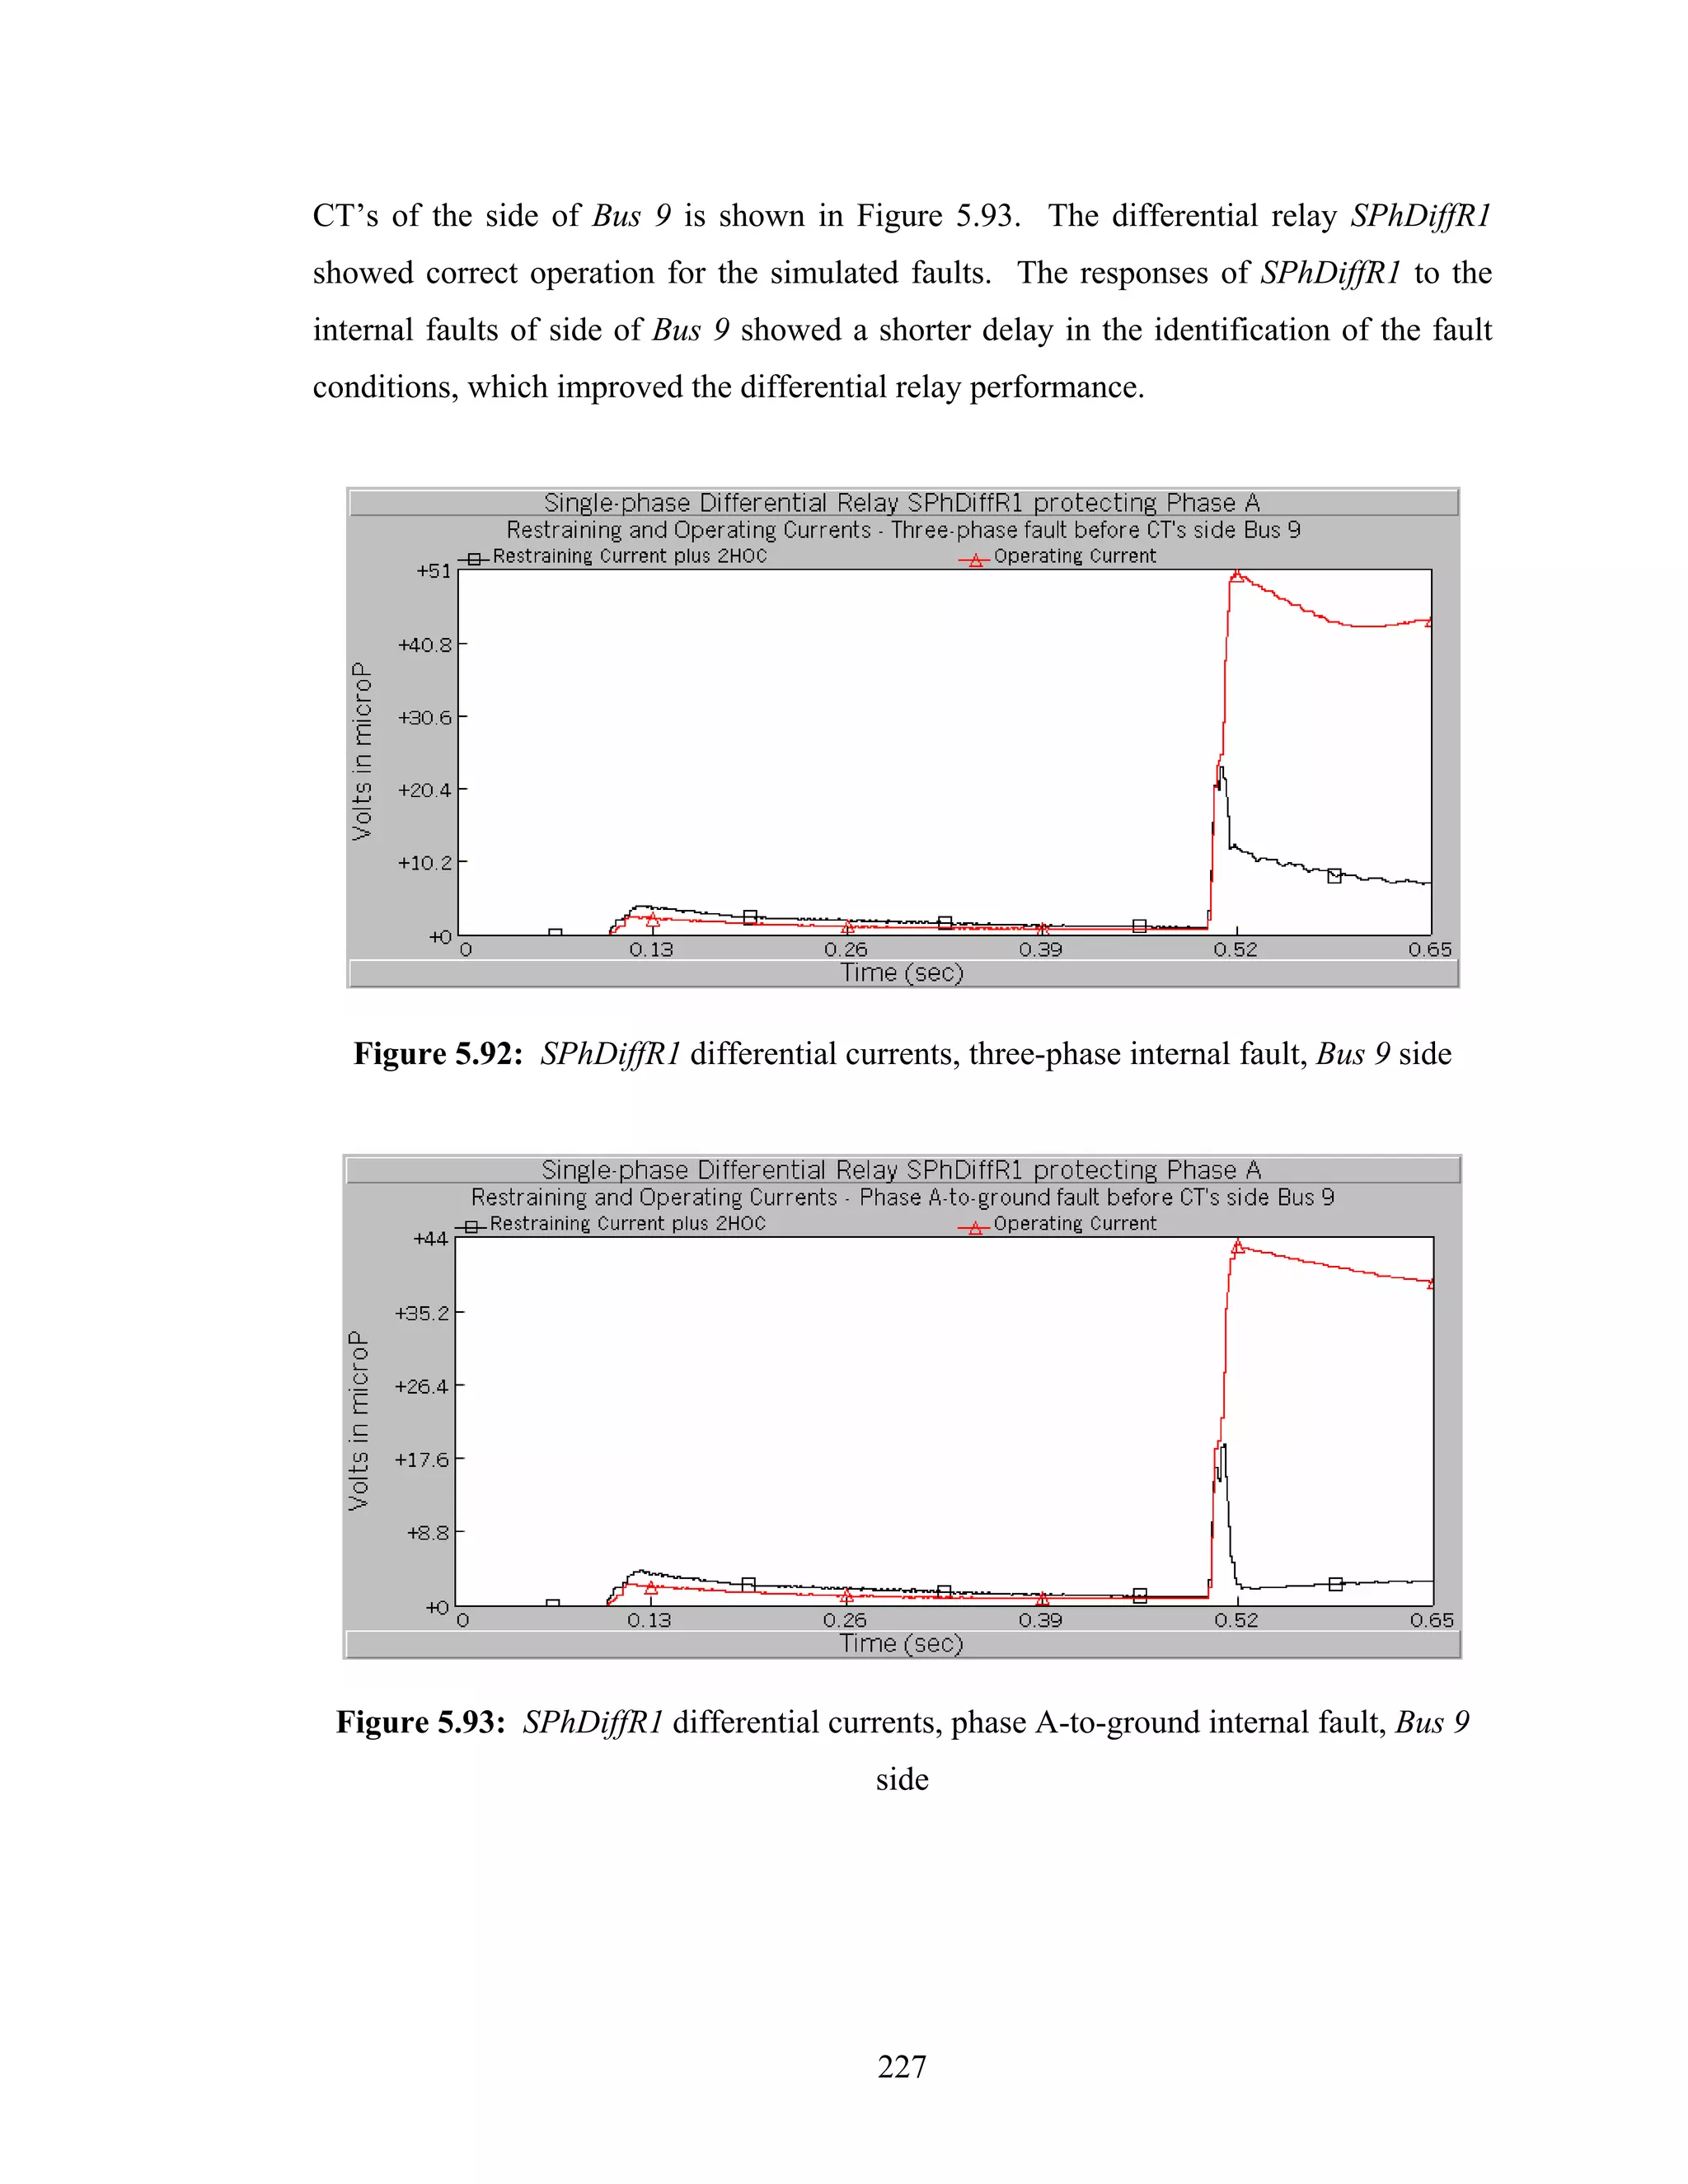
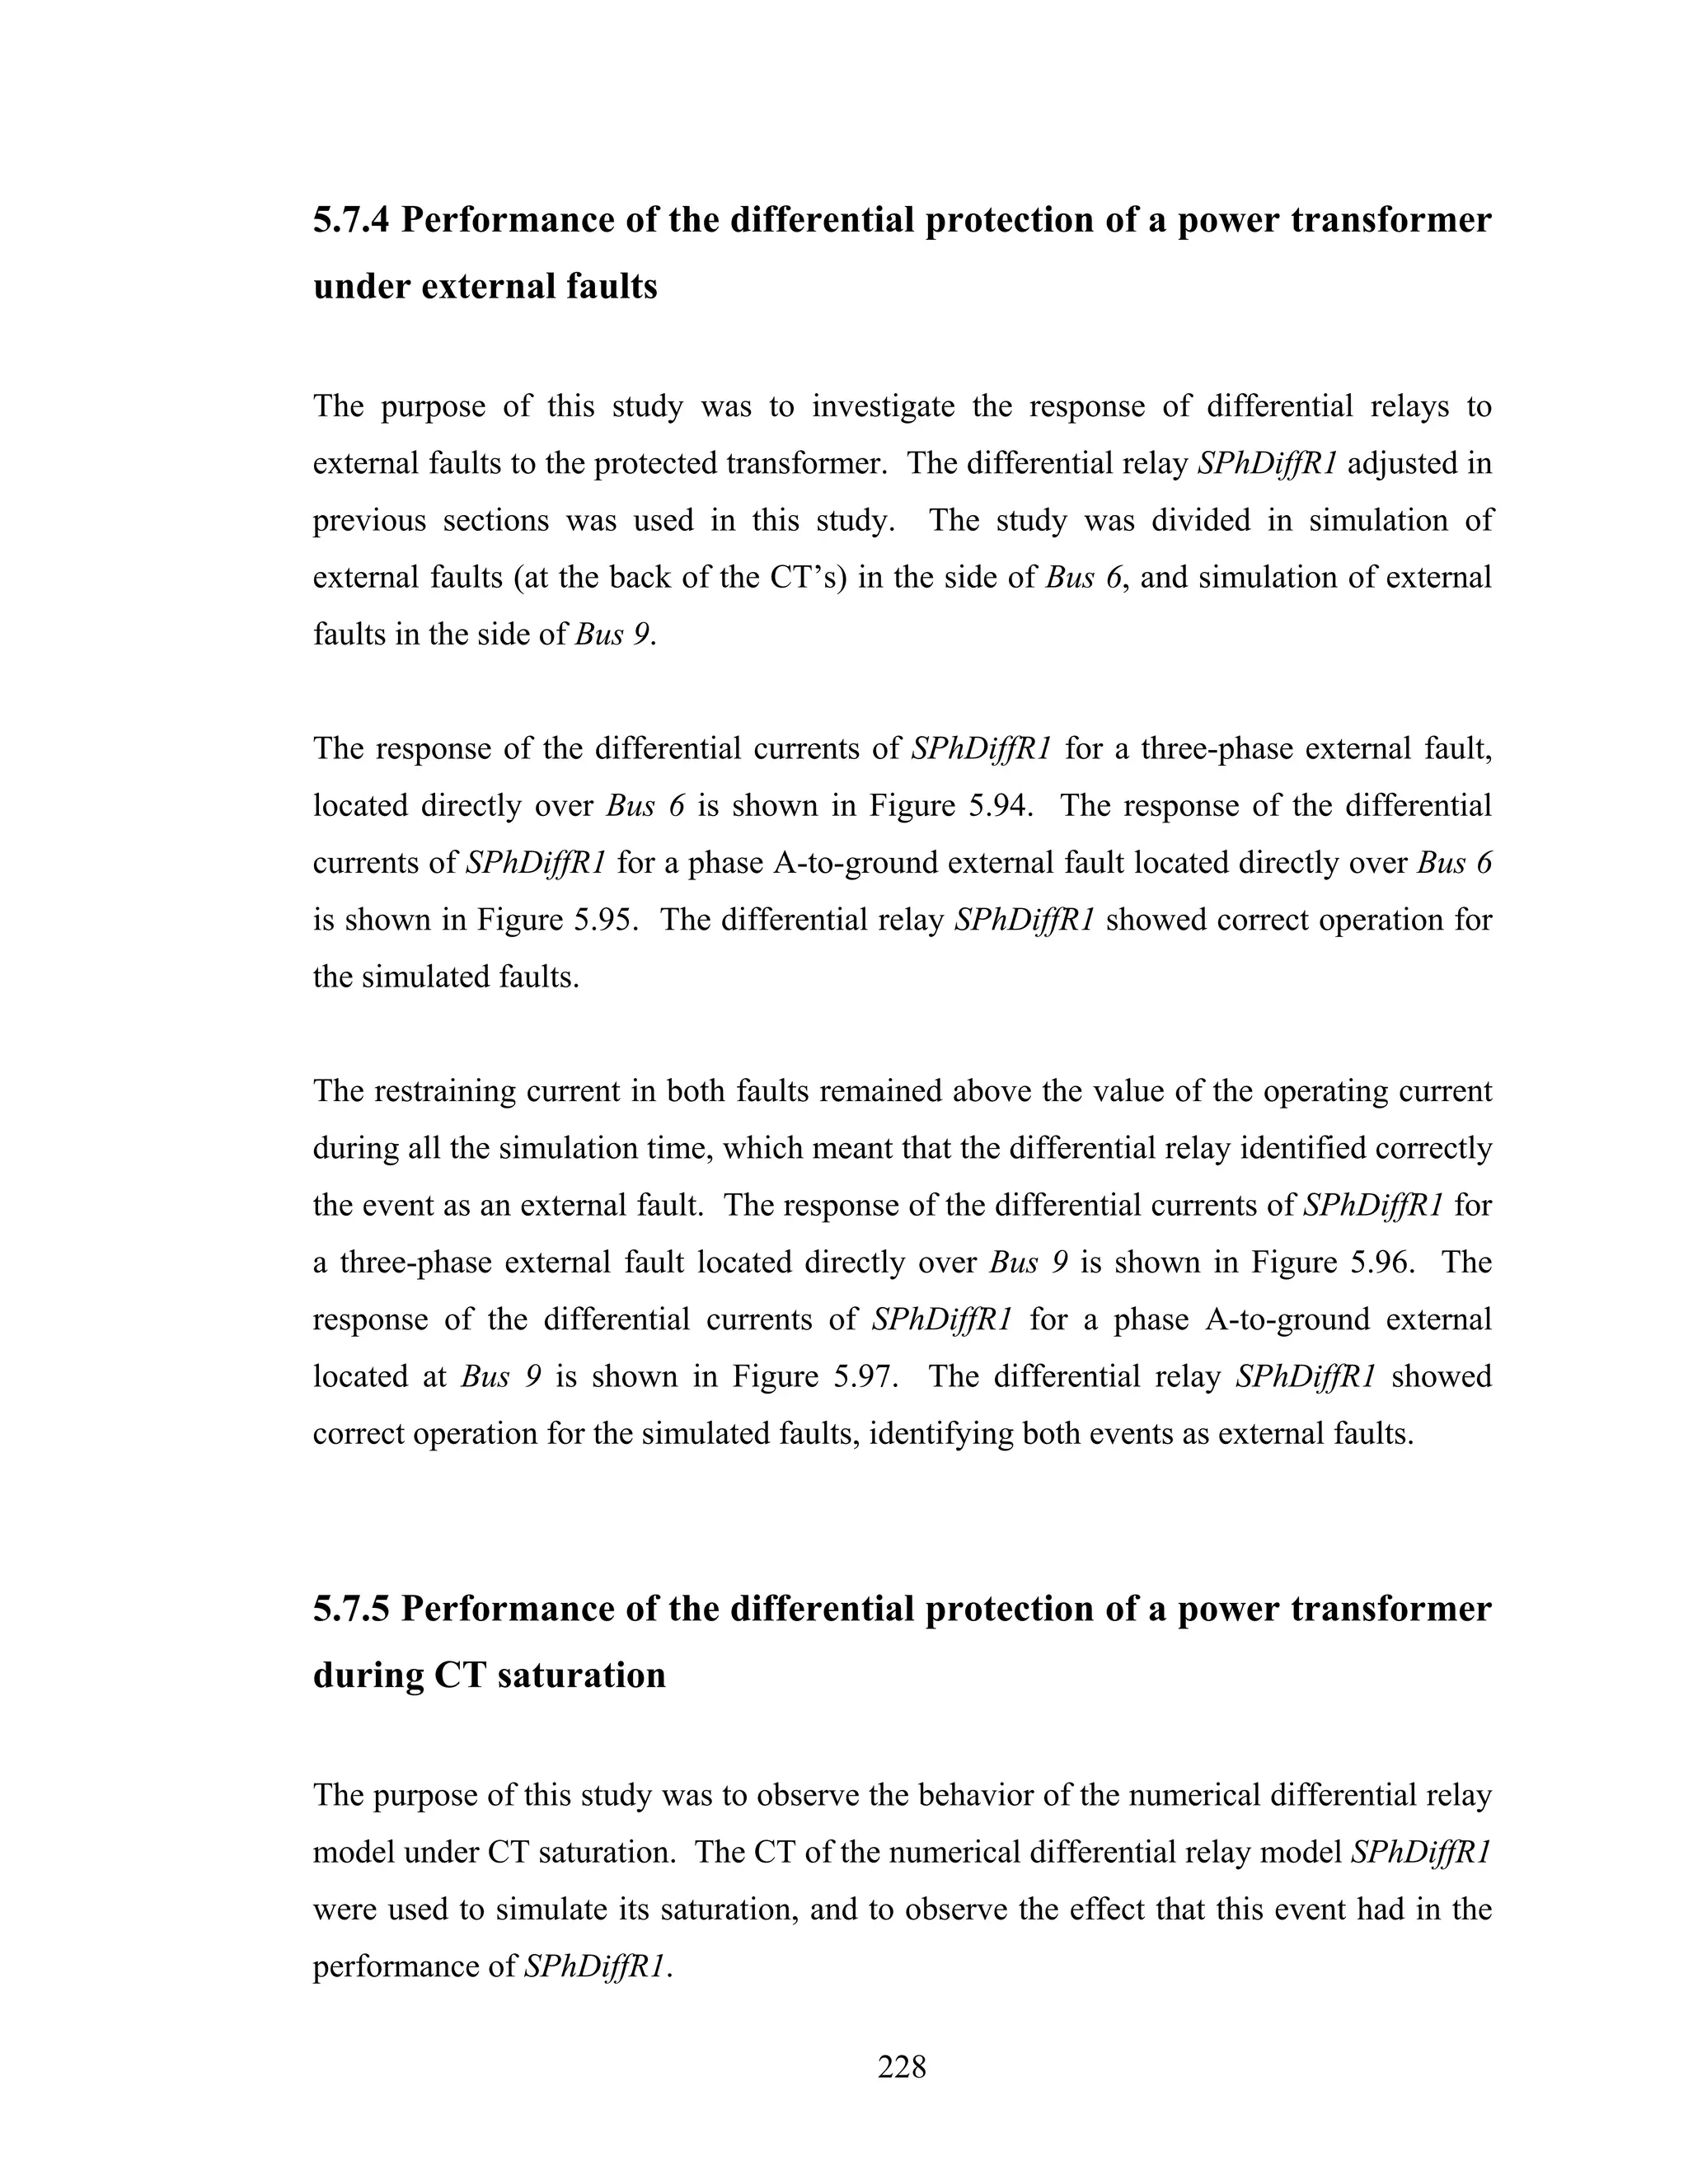
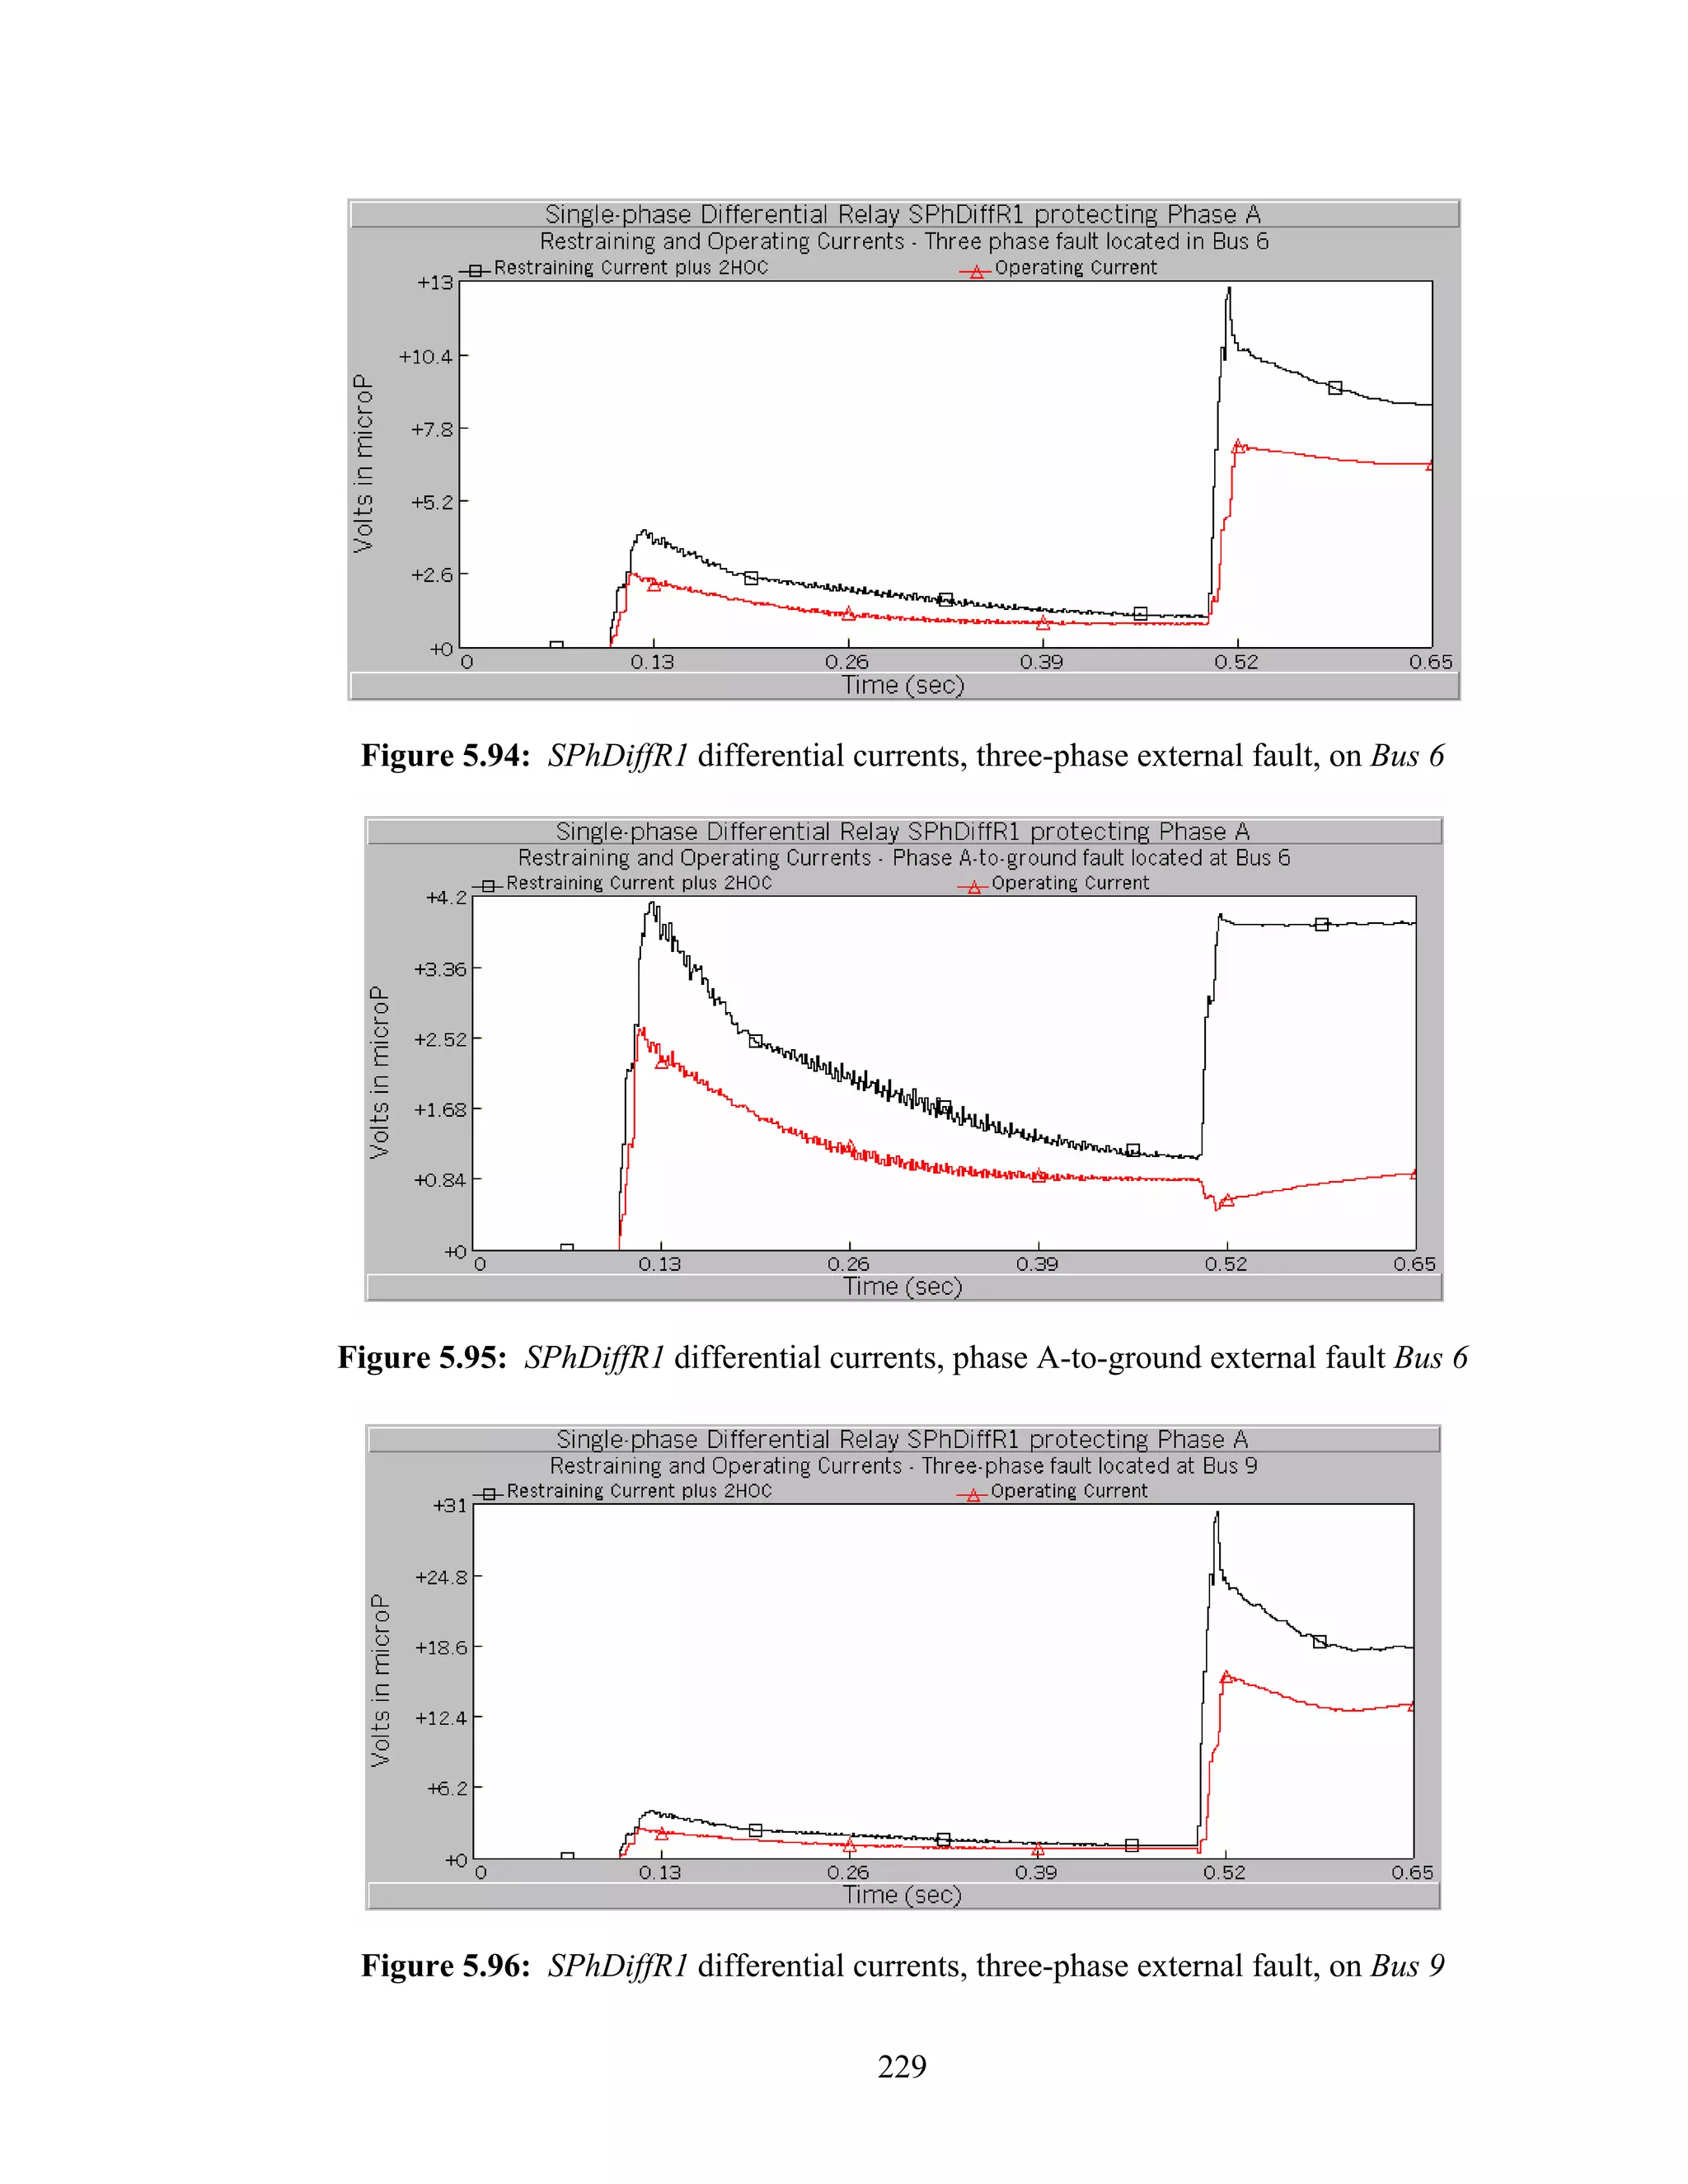
![Figure 5.97: SPhDiffR1 differential currents, phase A-to-ground external fault Bus 9
An analysis of the CT’s was done to determine their saturation characteristics. In Figure
5.4 are shown the CT’s I6 and I9 of SPhDiffR1 with transforming ratios 1750 A/5 A and
1200 A/5 A, respectively. The knee points of the excitation curves of these CT’s are
350 and 240 volts in the secondary side, respectively [52]. The CT’s will saturate when
the secondary circuits voltages of the CT’s are larger than 350 and 240 V, respectively.
A method to increase the secondary circuit voltages is incrementing the burden. The
maximum fault currents in the primary circuit of the CT’s I6 and I9 were 100 kA and 26
kA, respectively. The maximum fault currents in the secondary terminals of the CT’s I6
and I9 are determined by the following expressions, respectively [50].
Ip 100000 A
Is = = = 285.7 A , (5.7)
CTR 350
Ip 26000 A
Is = = = 108.3 A , (5.8)
CTR 240
According to Equation 5.2, the maximum allowed impedance burden that can be
connected to the secondary terminals of the CT’s I6 and I9 without saturating their cores
were established by the following expressions, respectively.
230](https://image.slidesharecdn.com/phdthesissandroaquiles060724-121017023005-phpapp01/75/Thesis-for-Power-System-protection-in-Brief-265-2048.jpg)
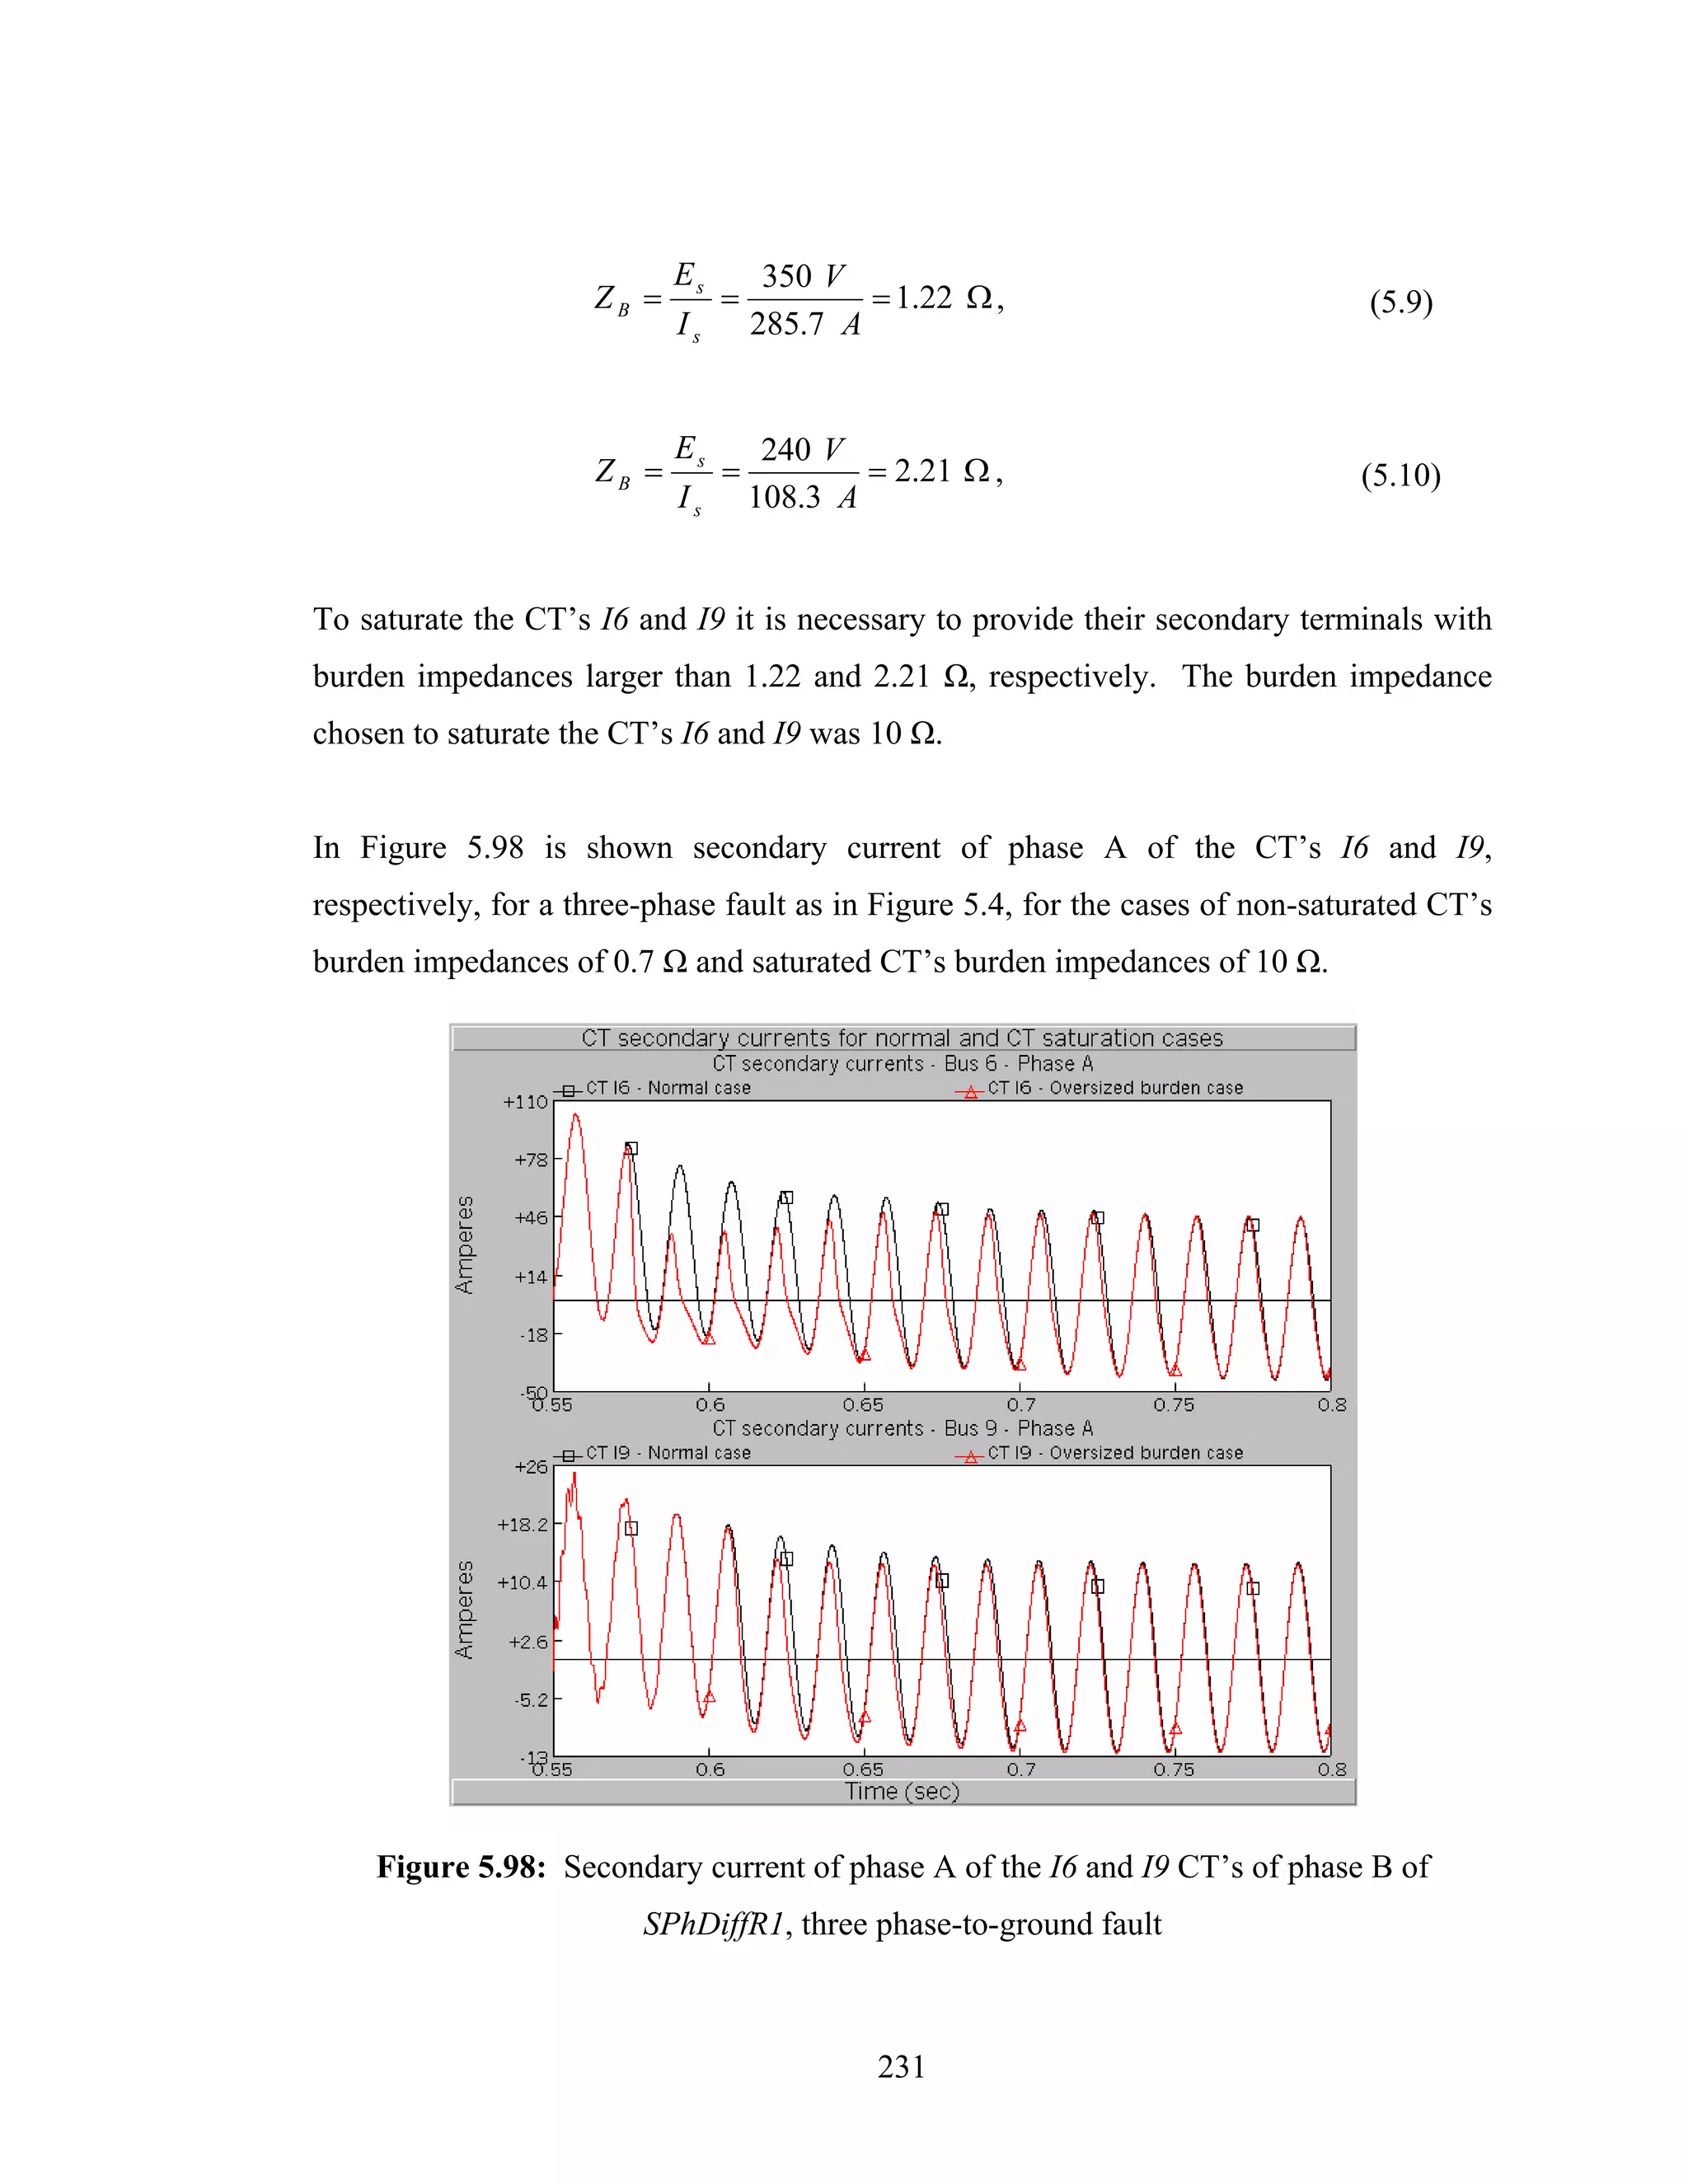
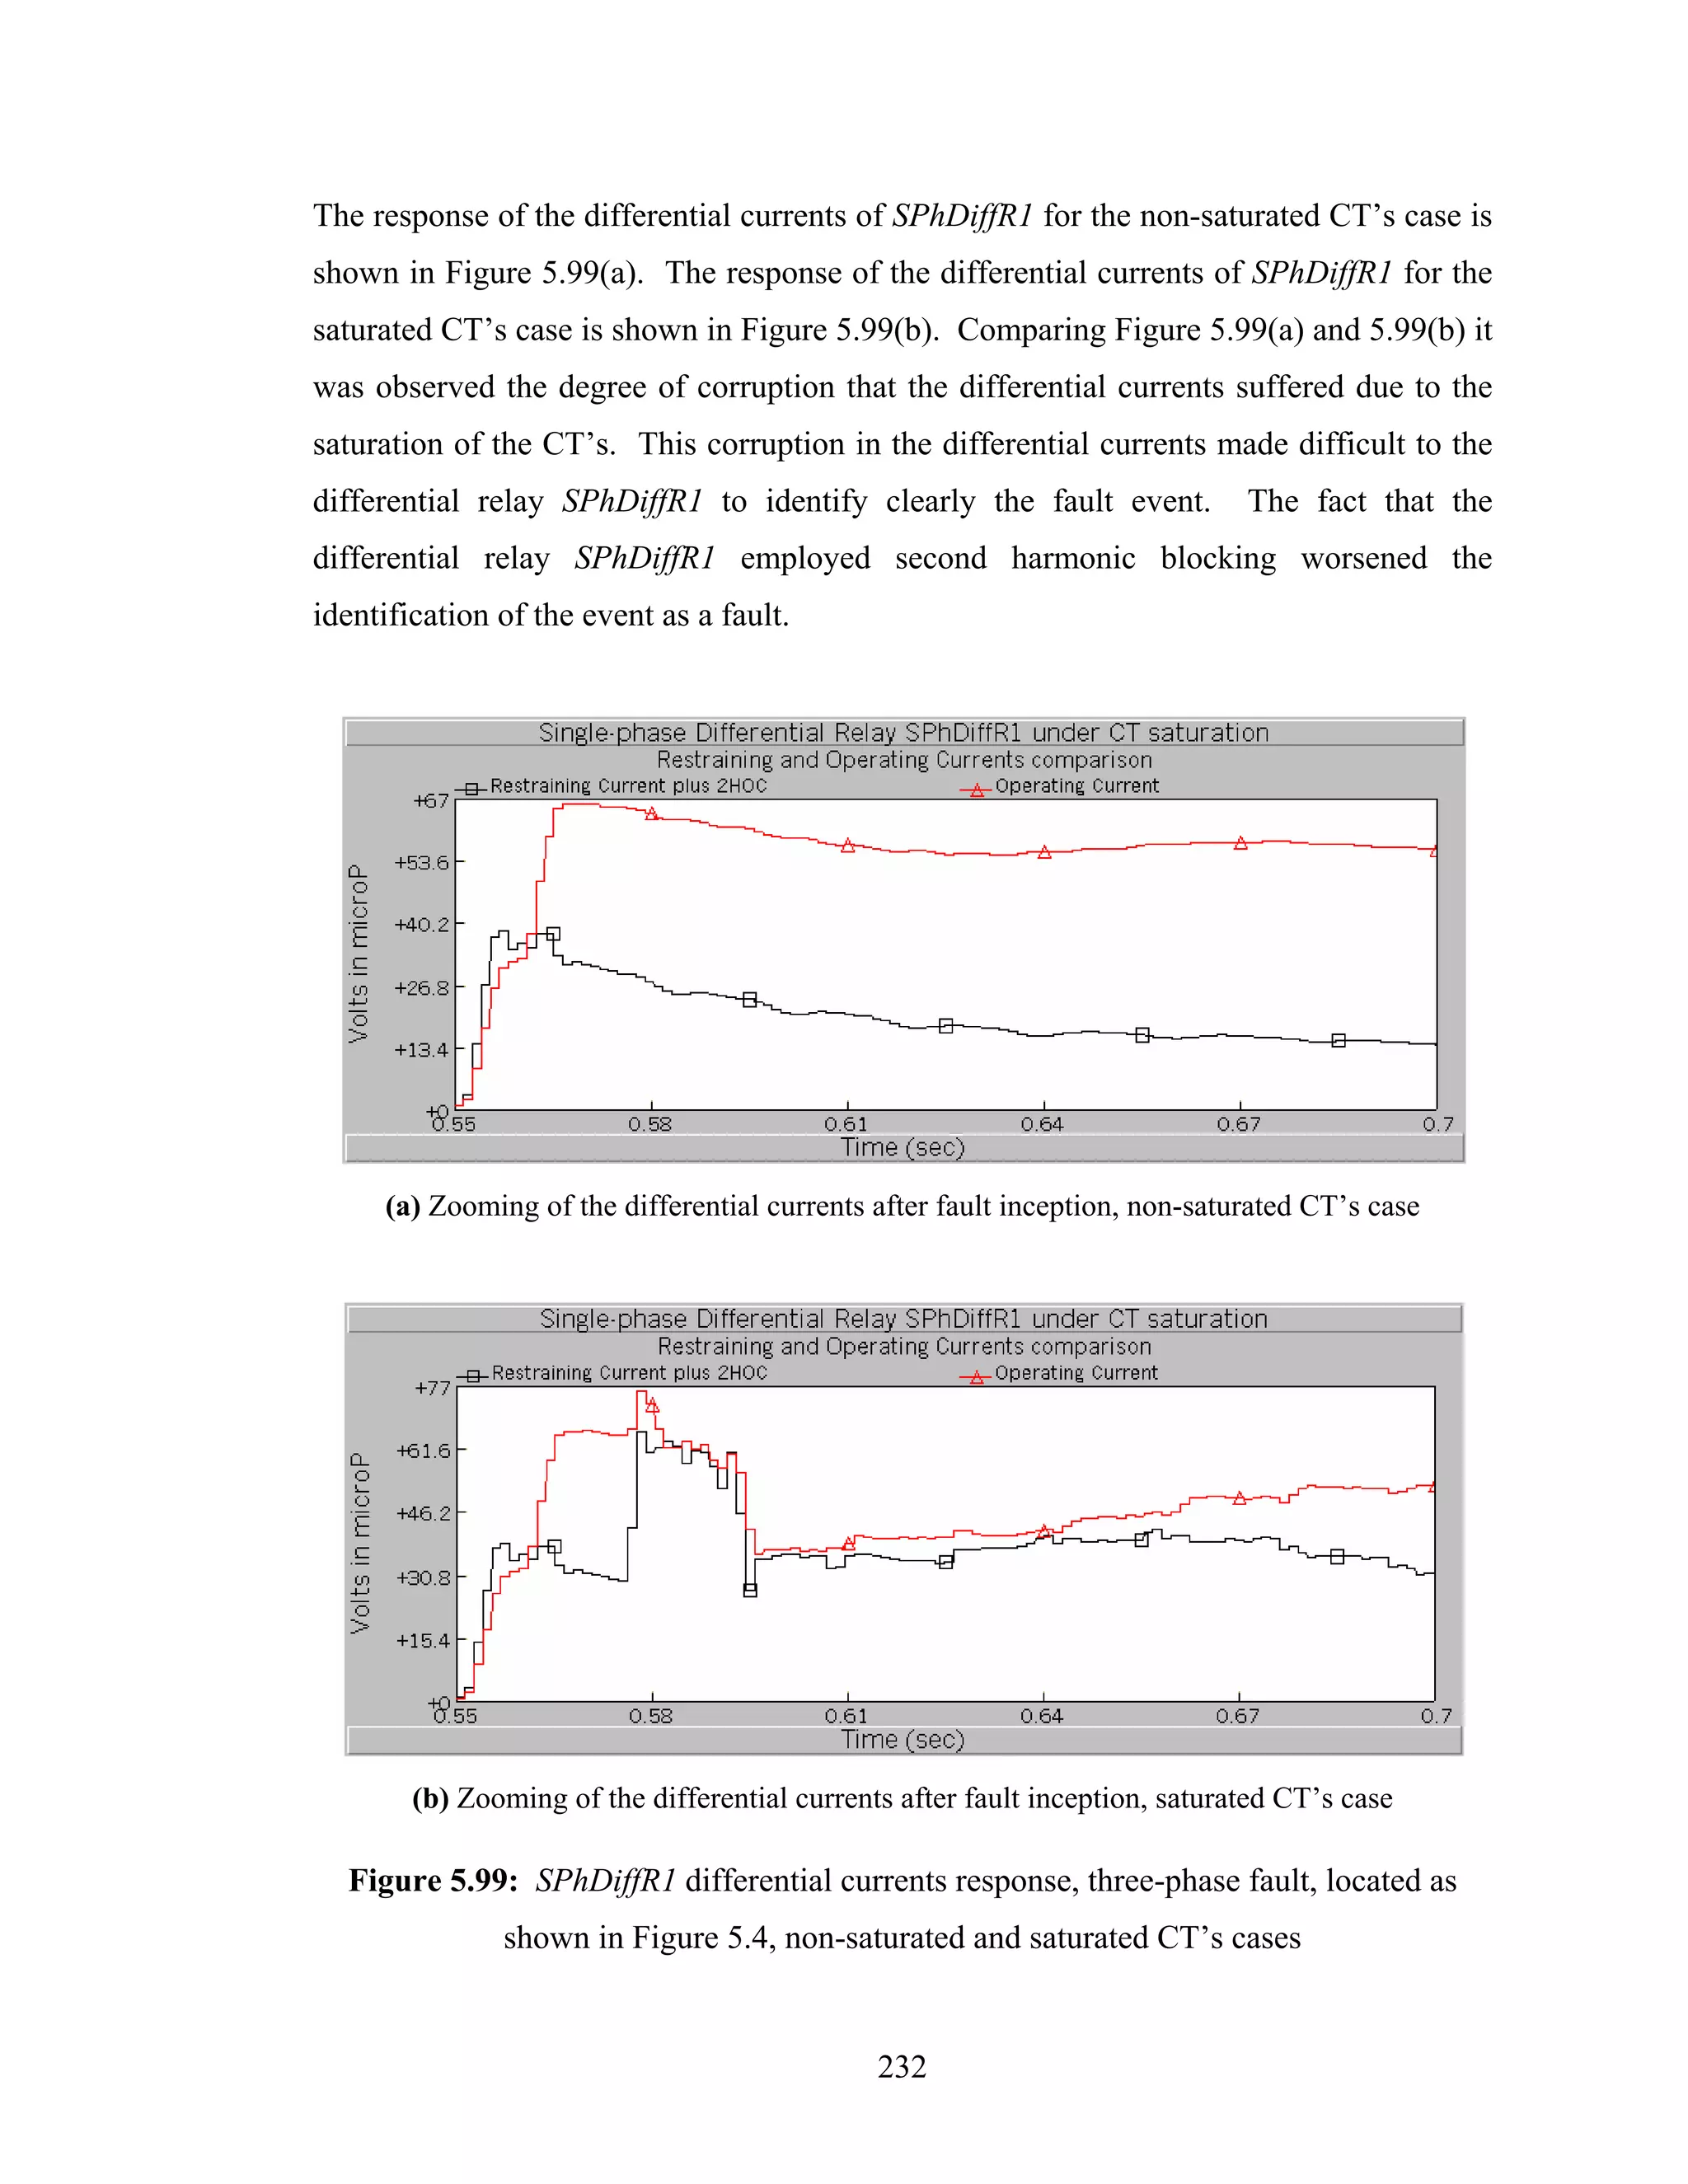
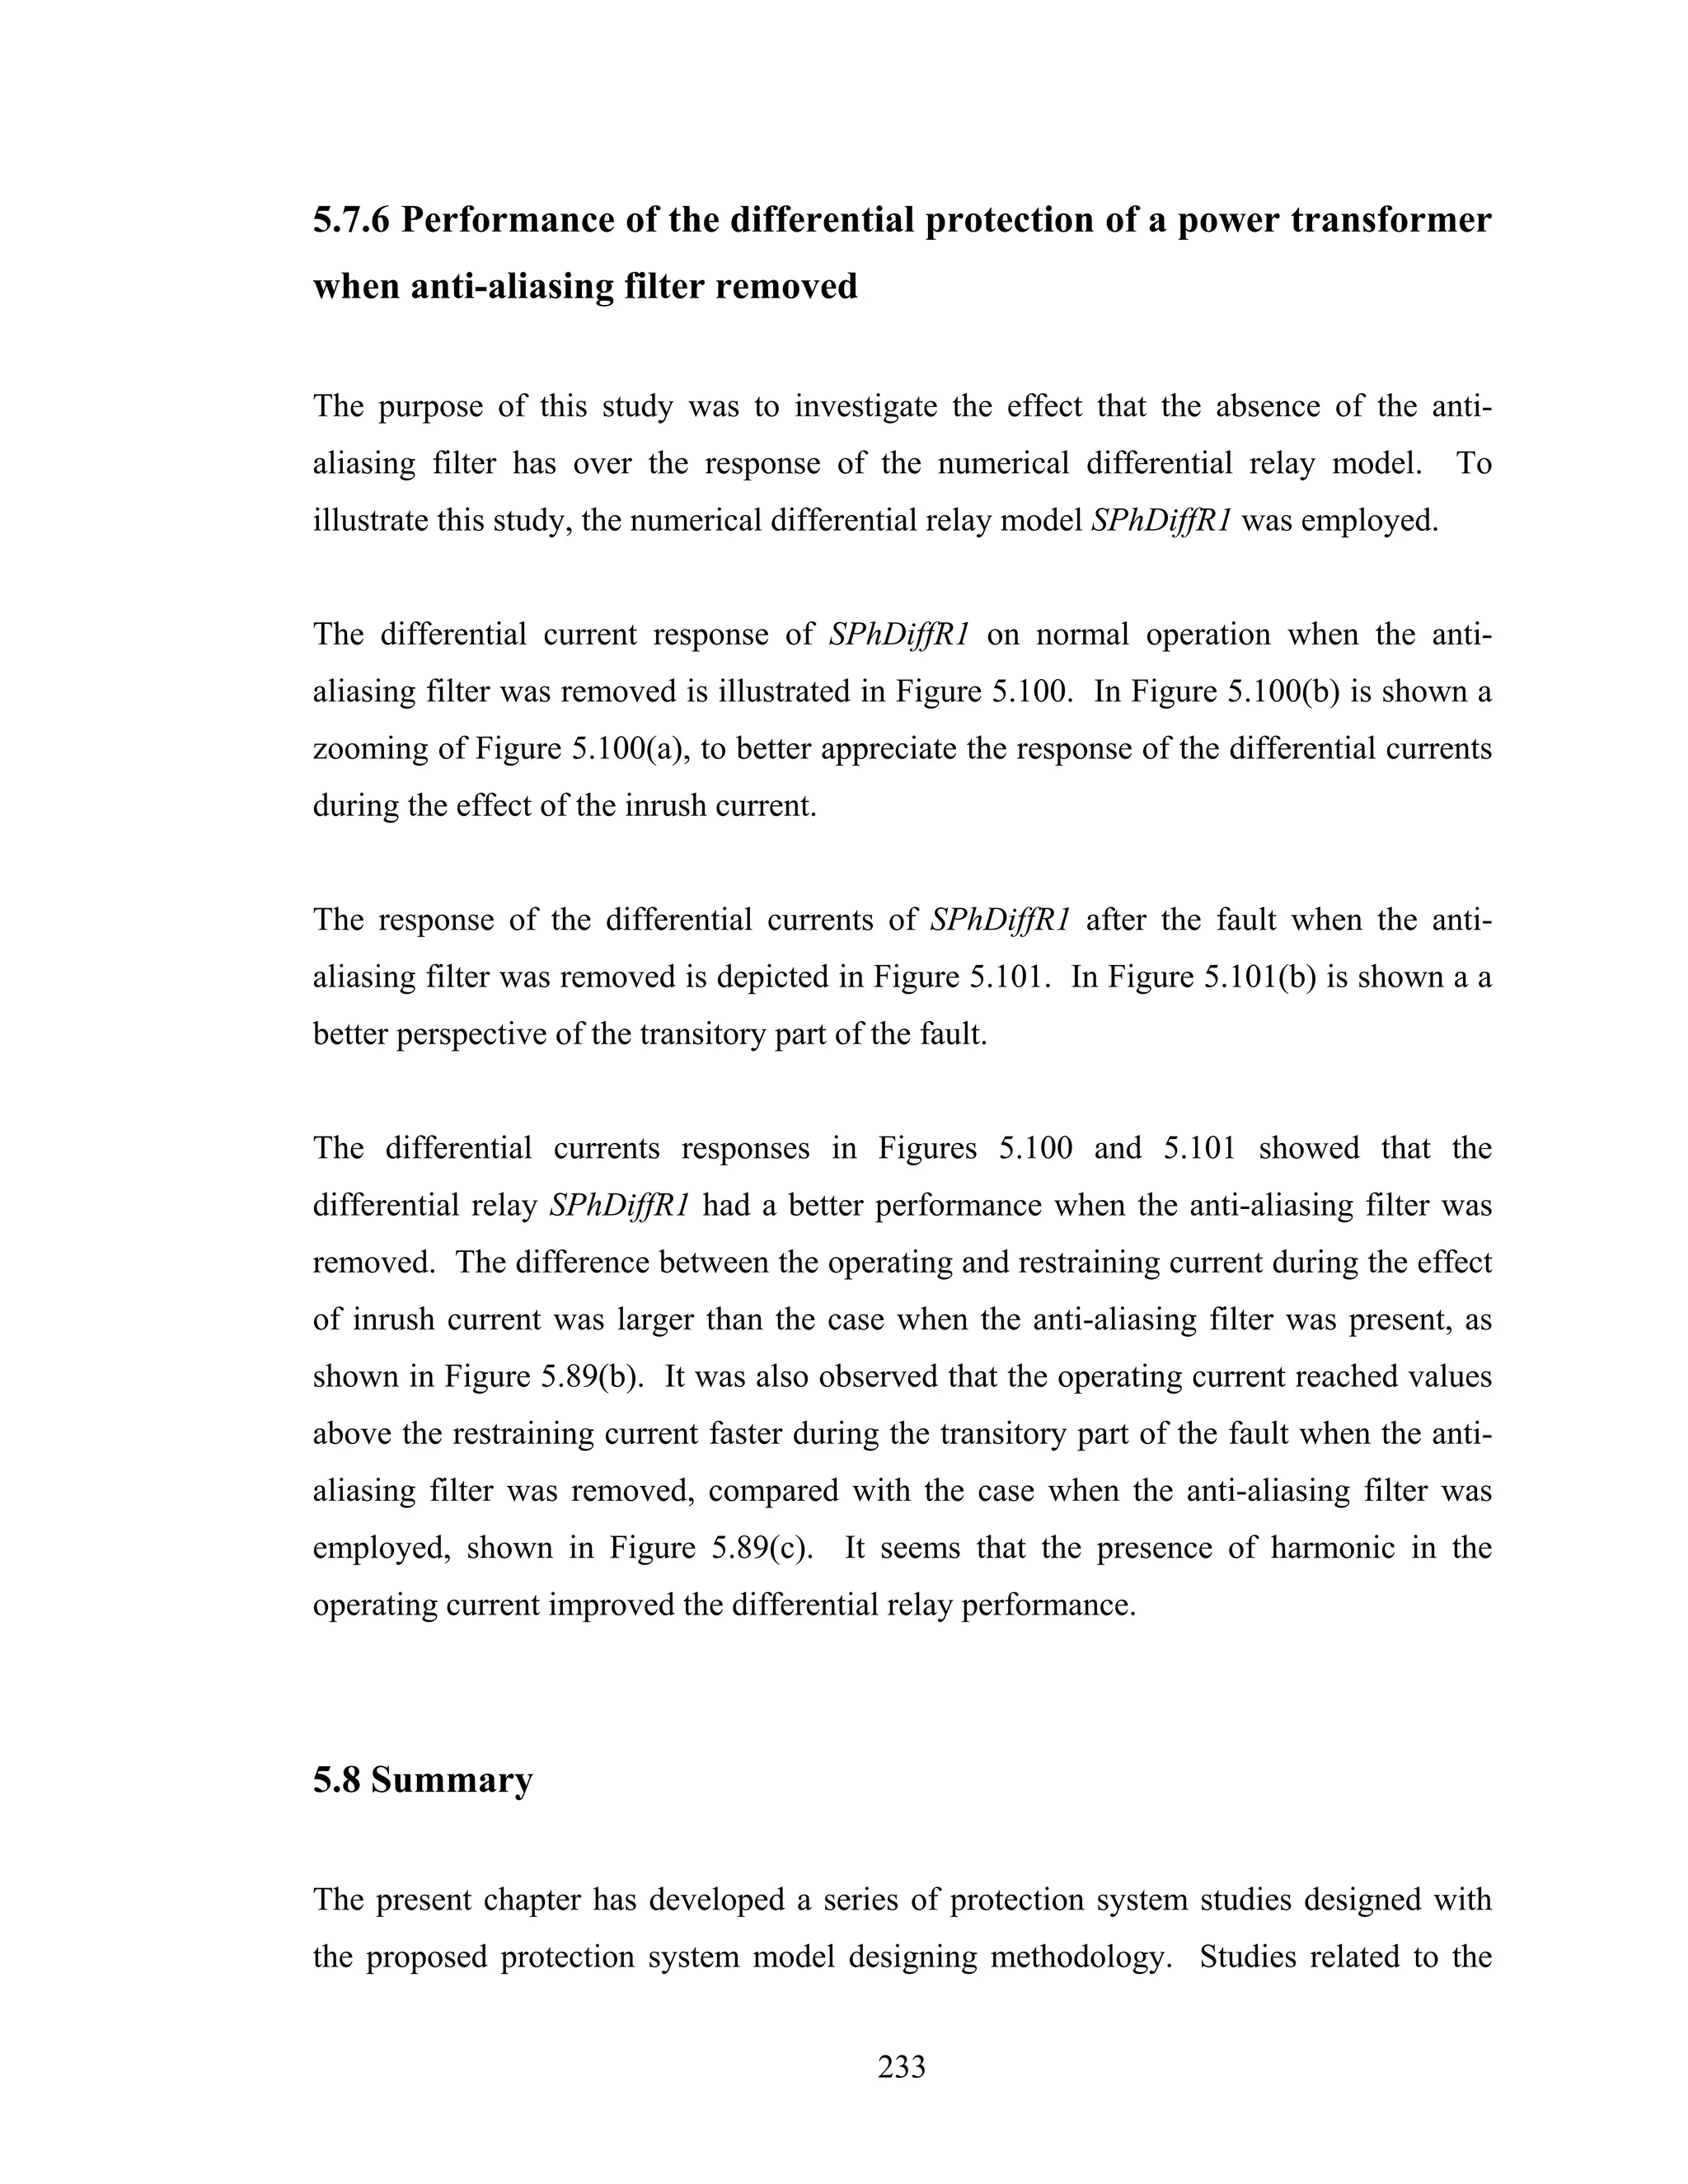
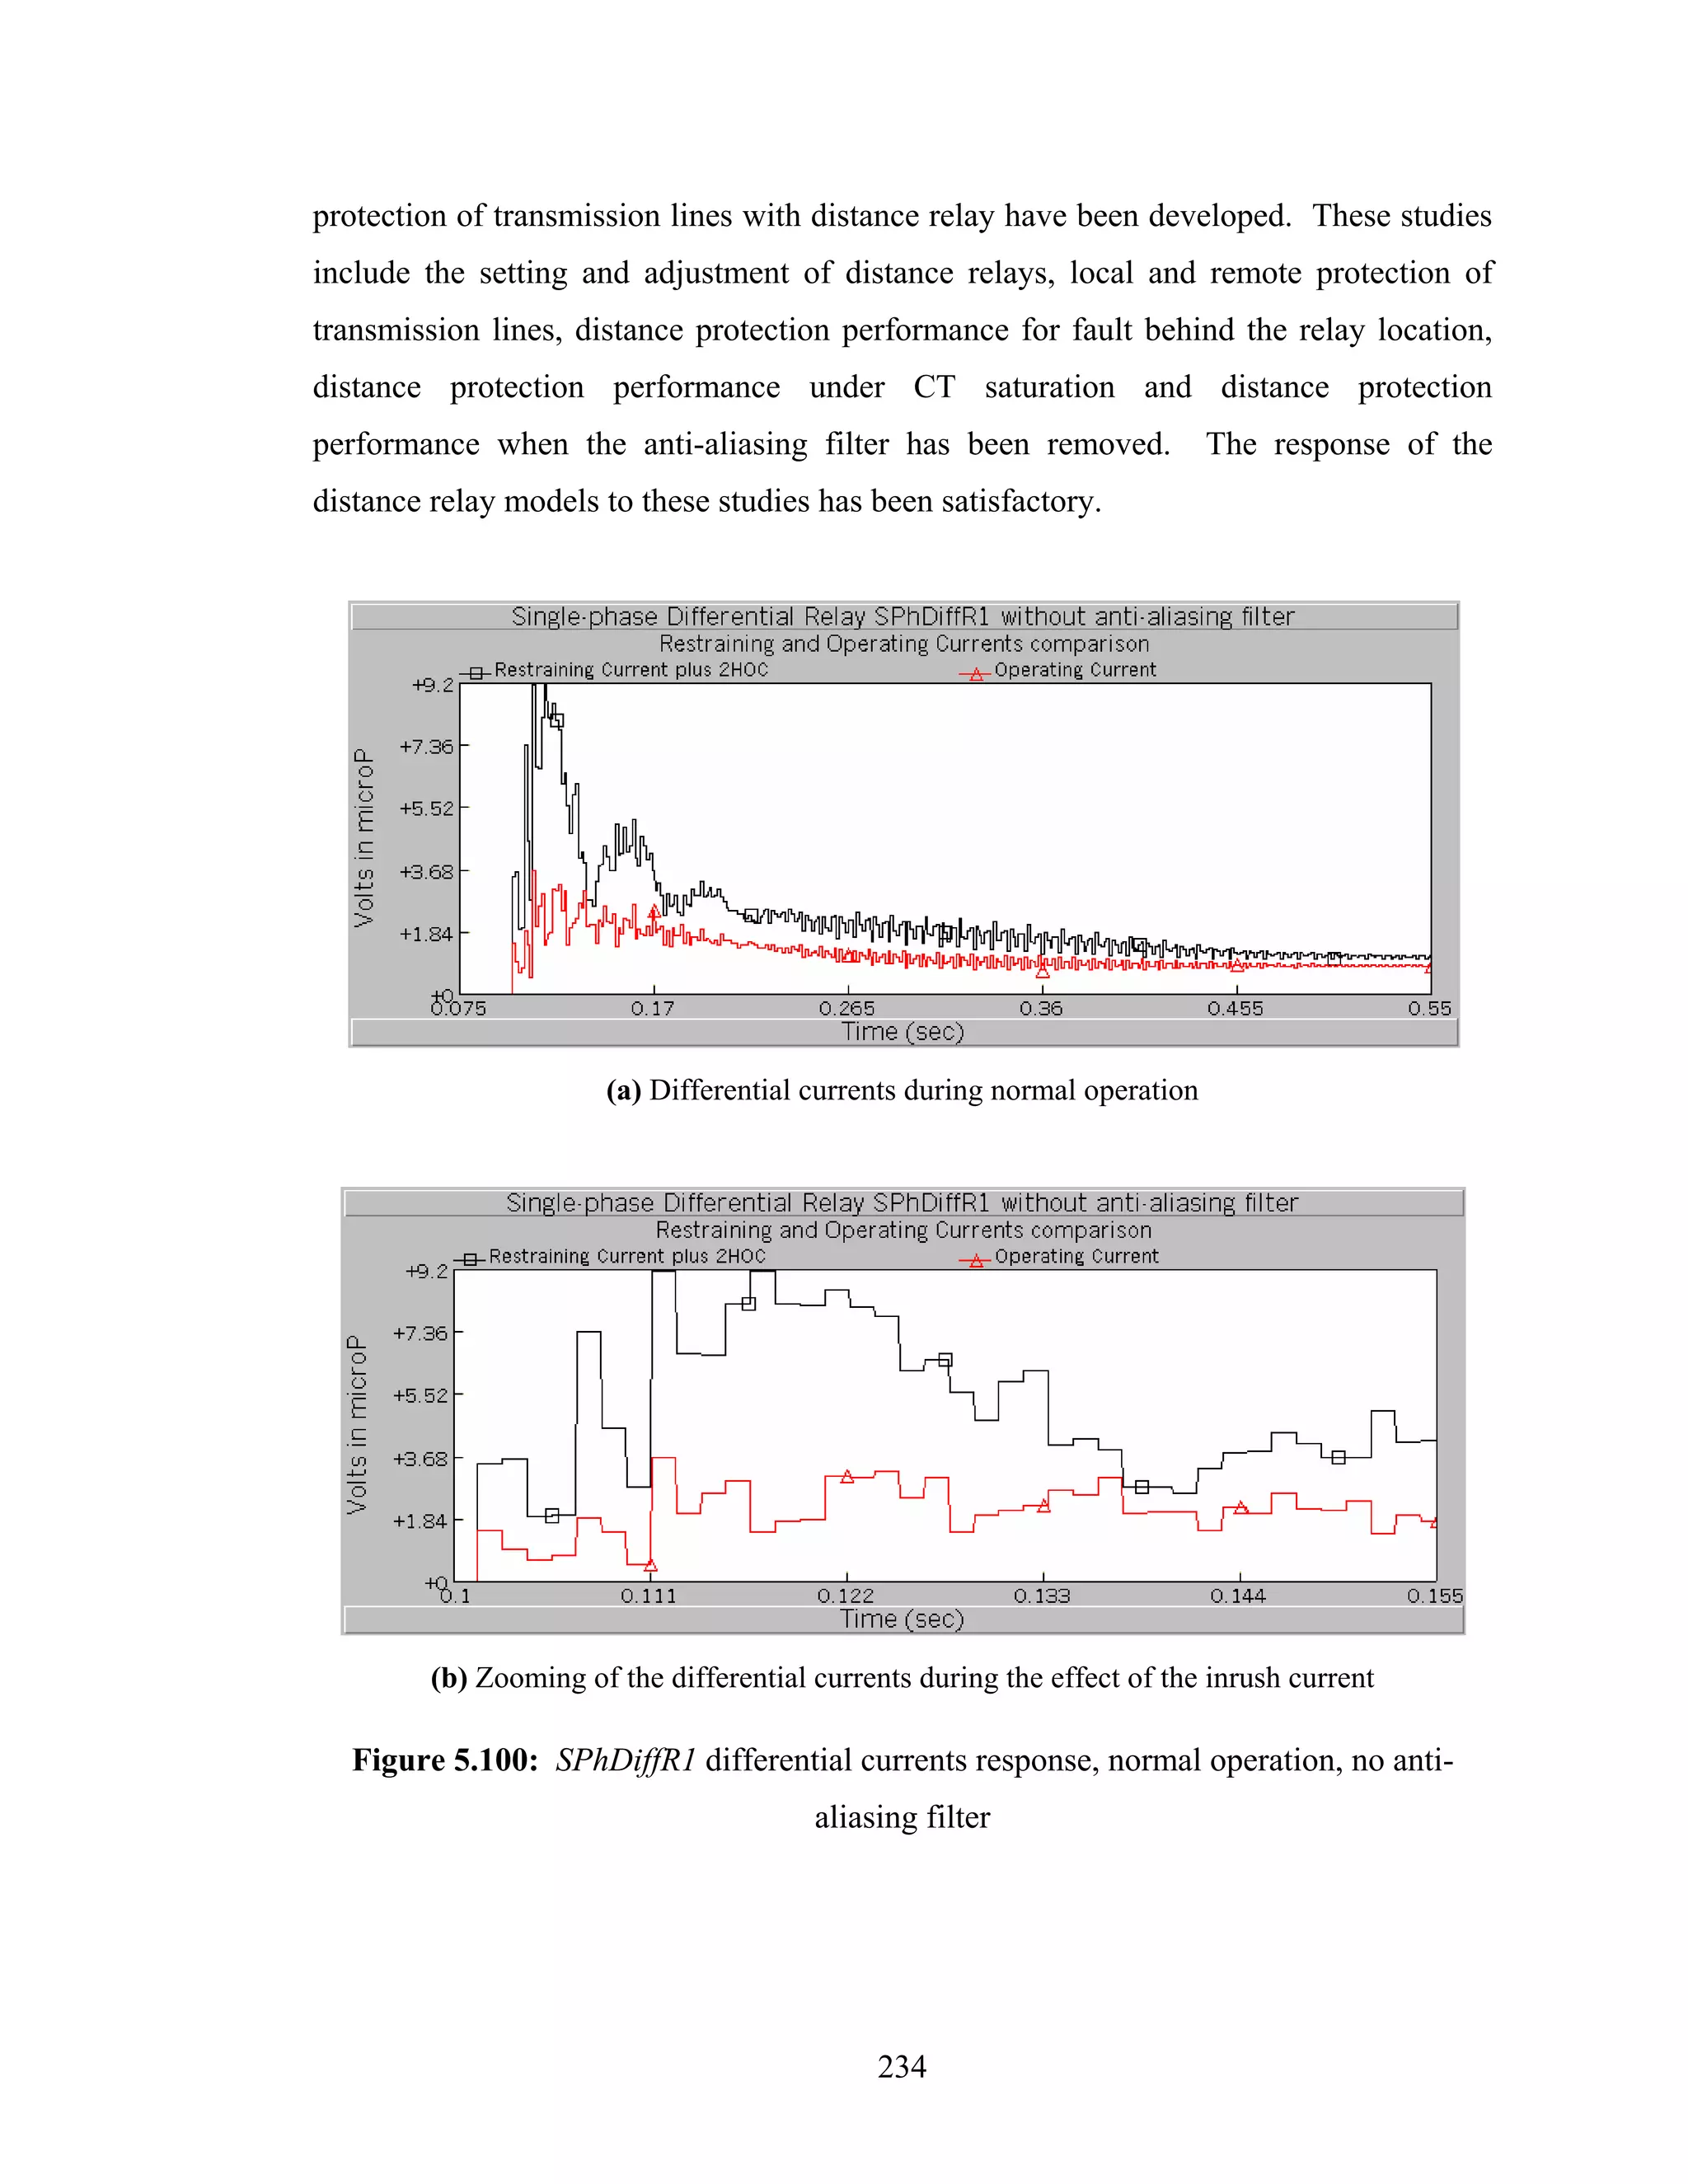
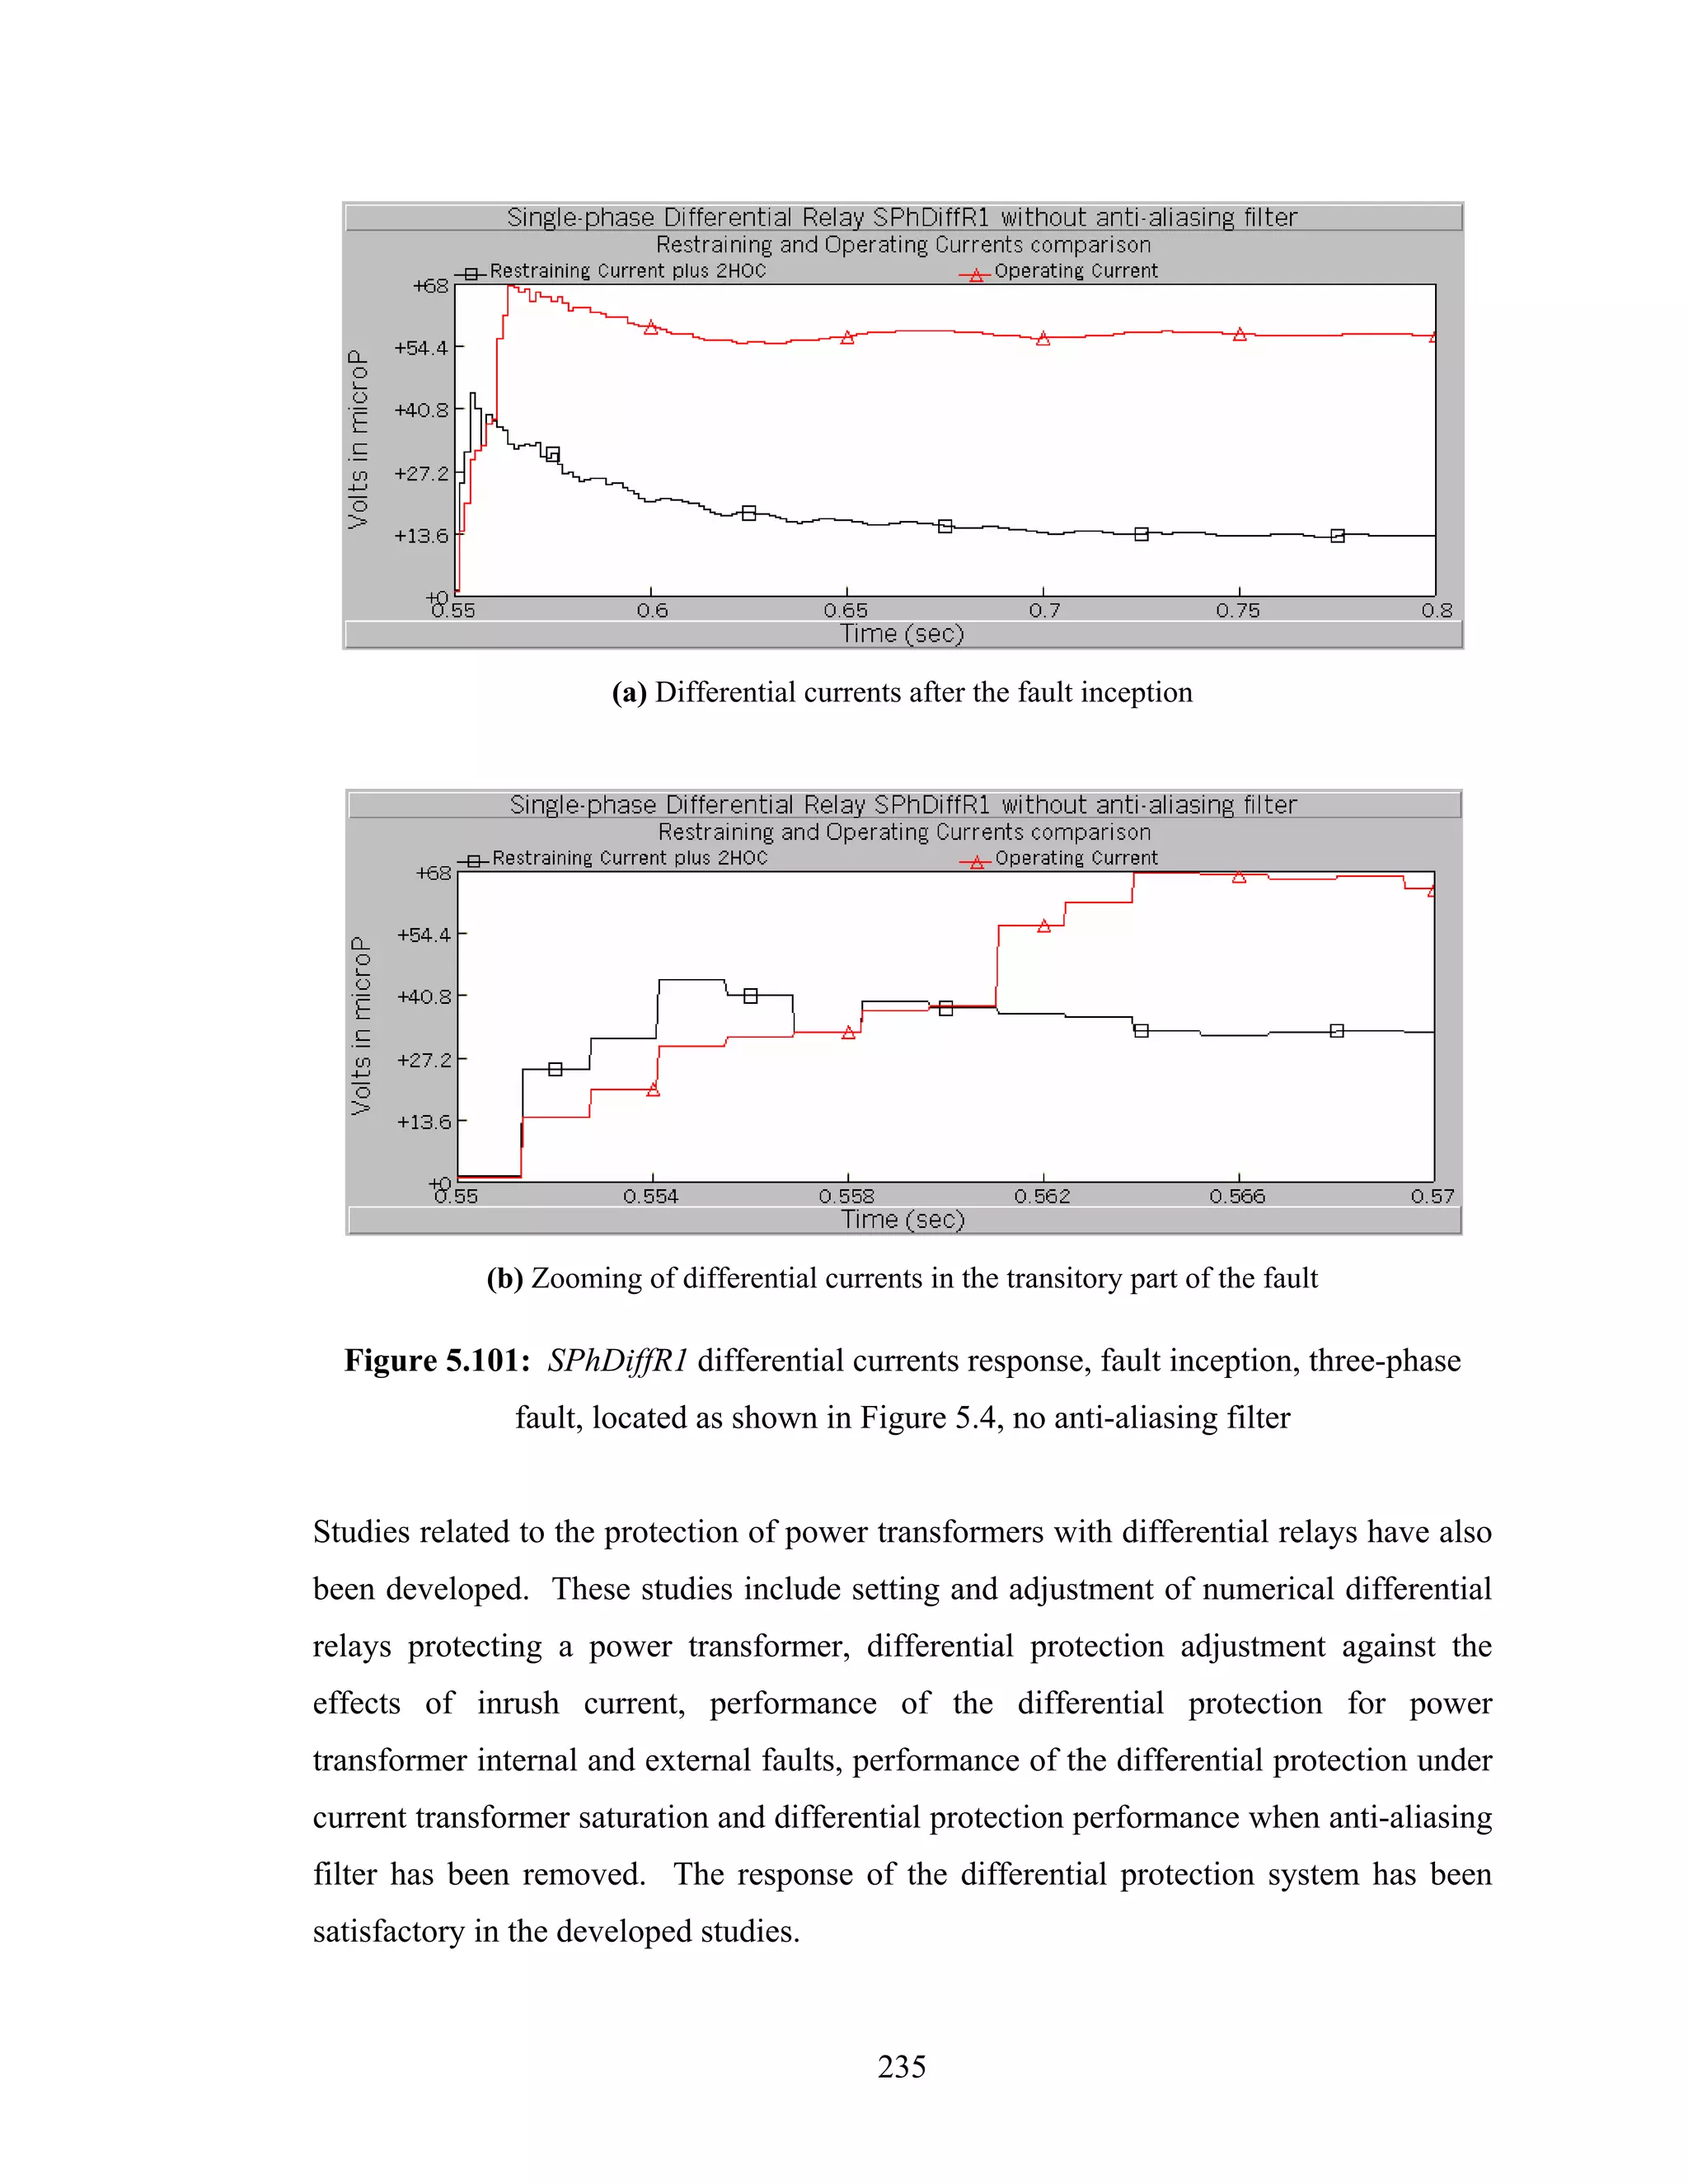
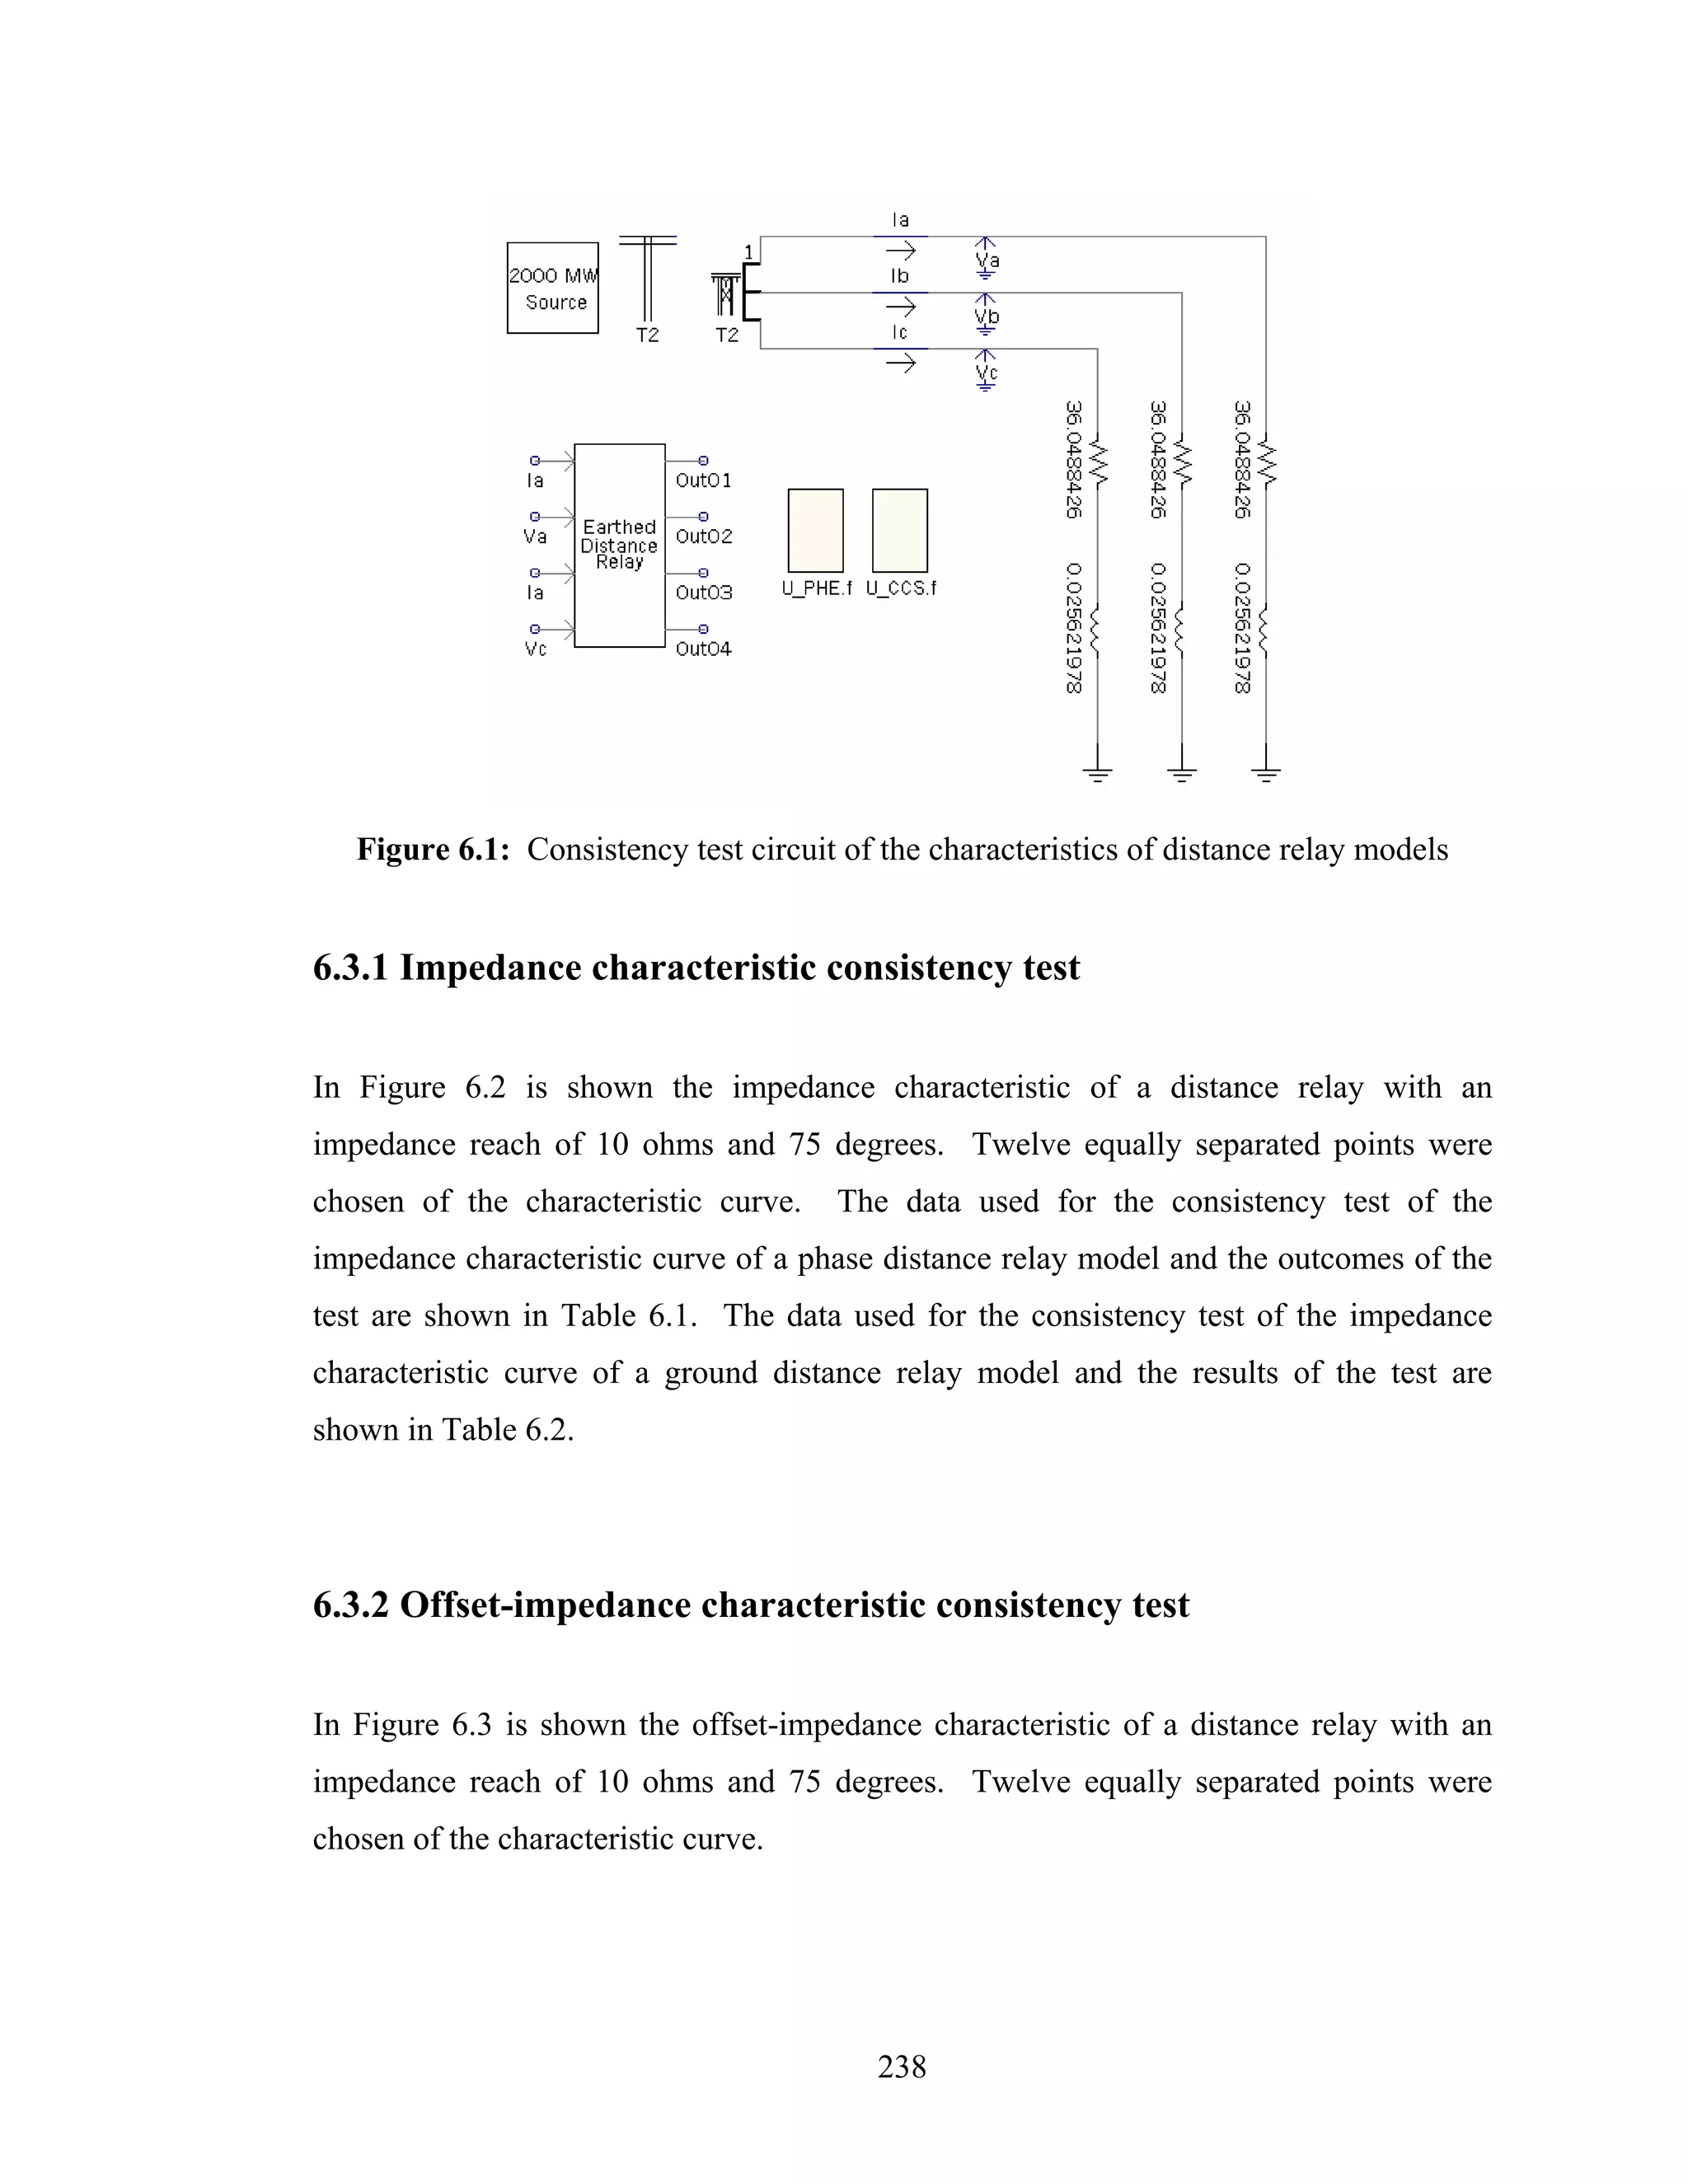
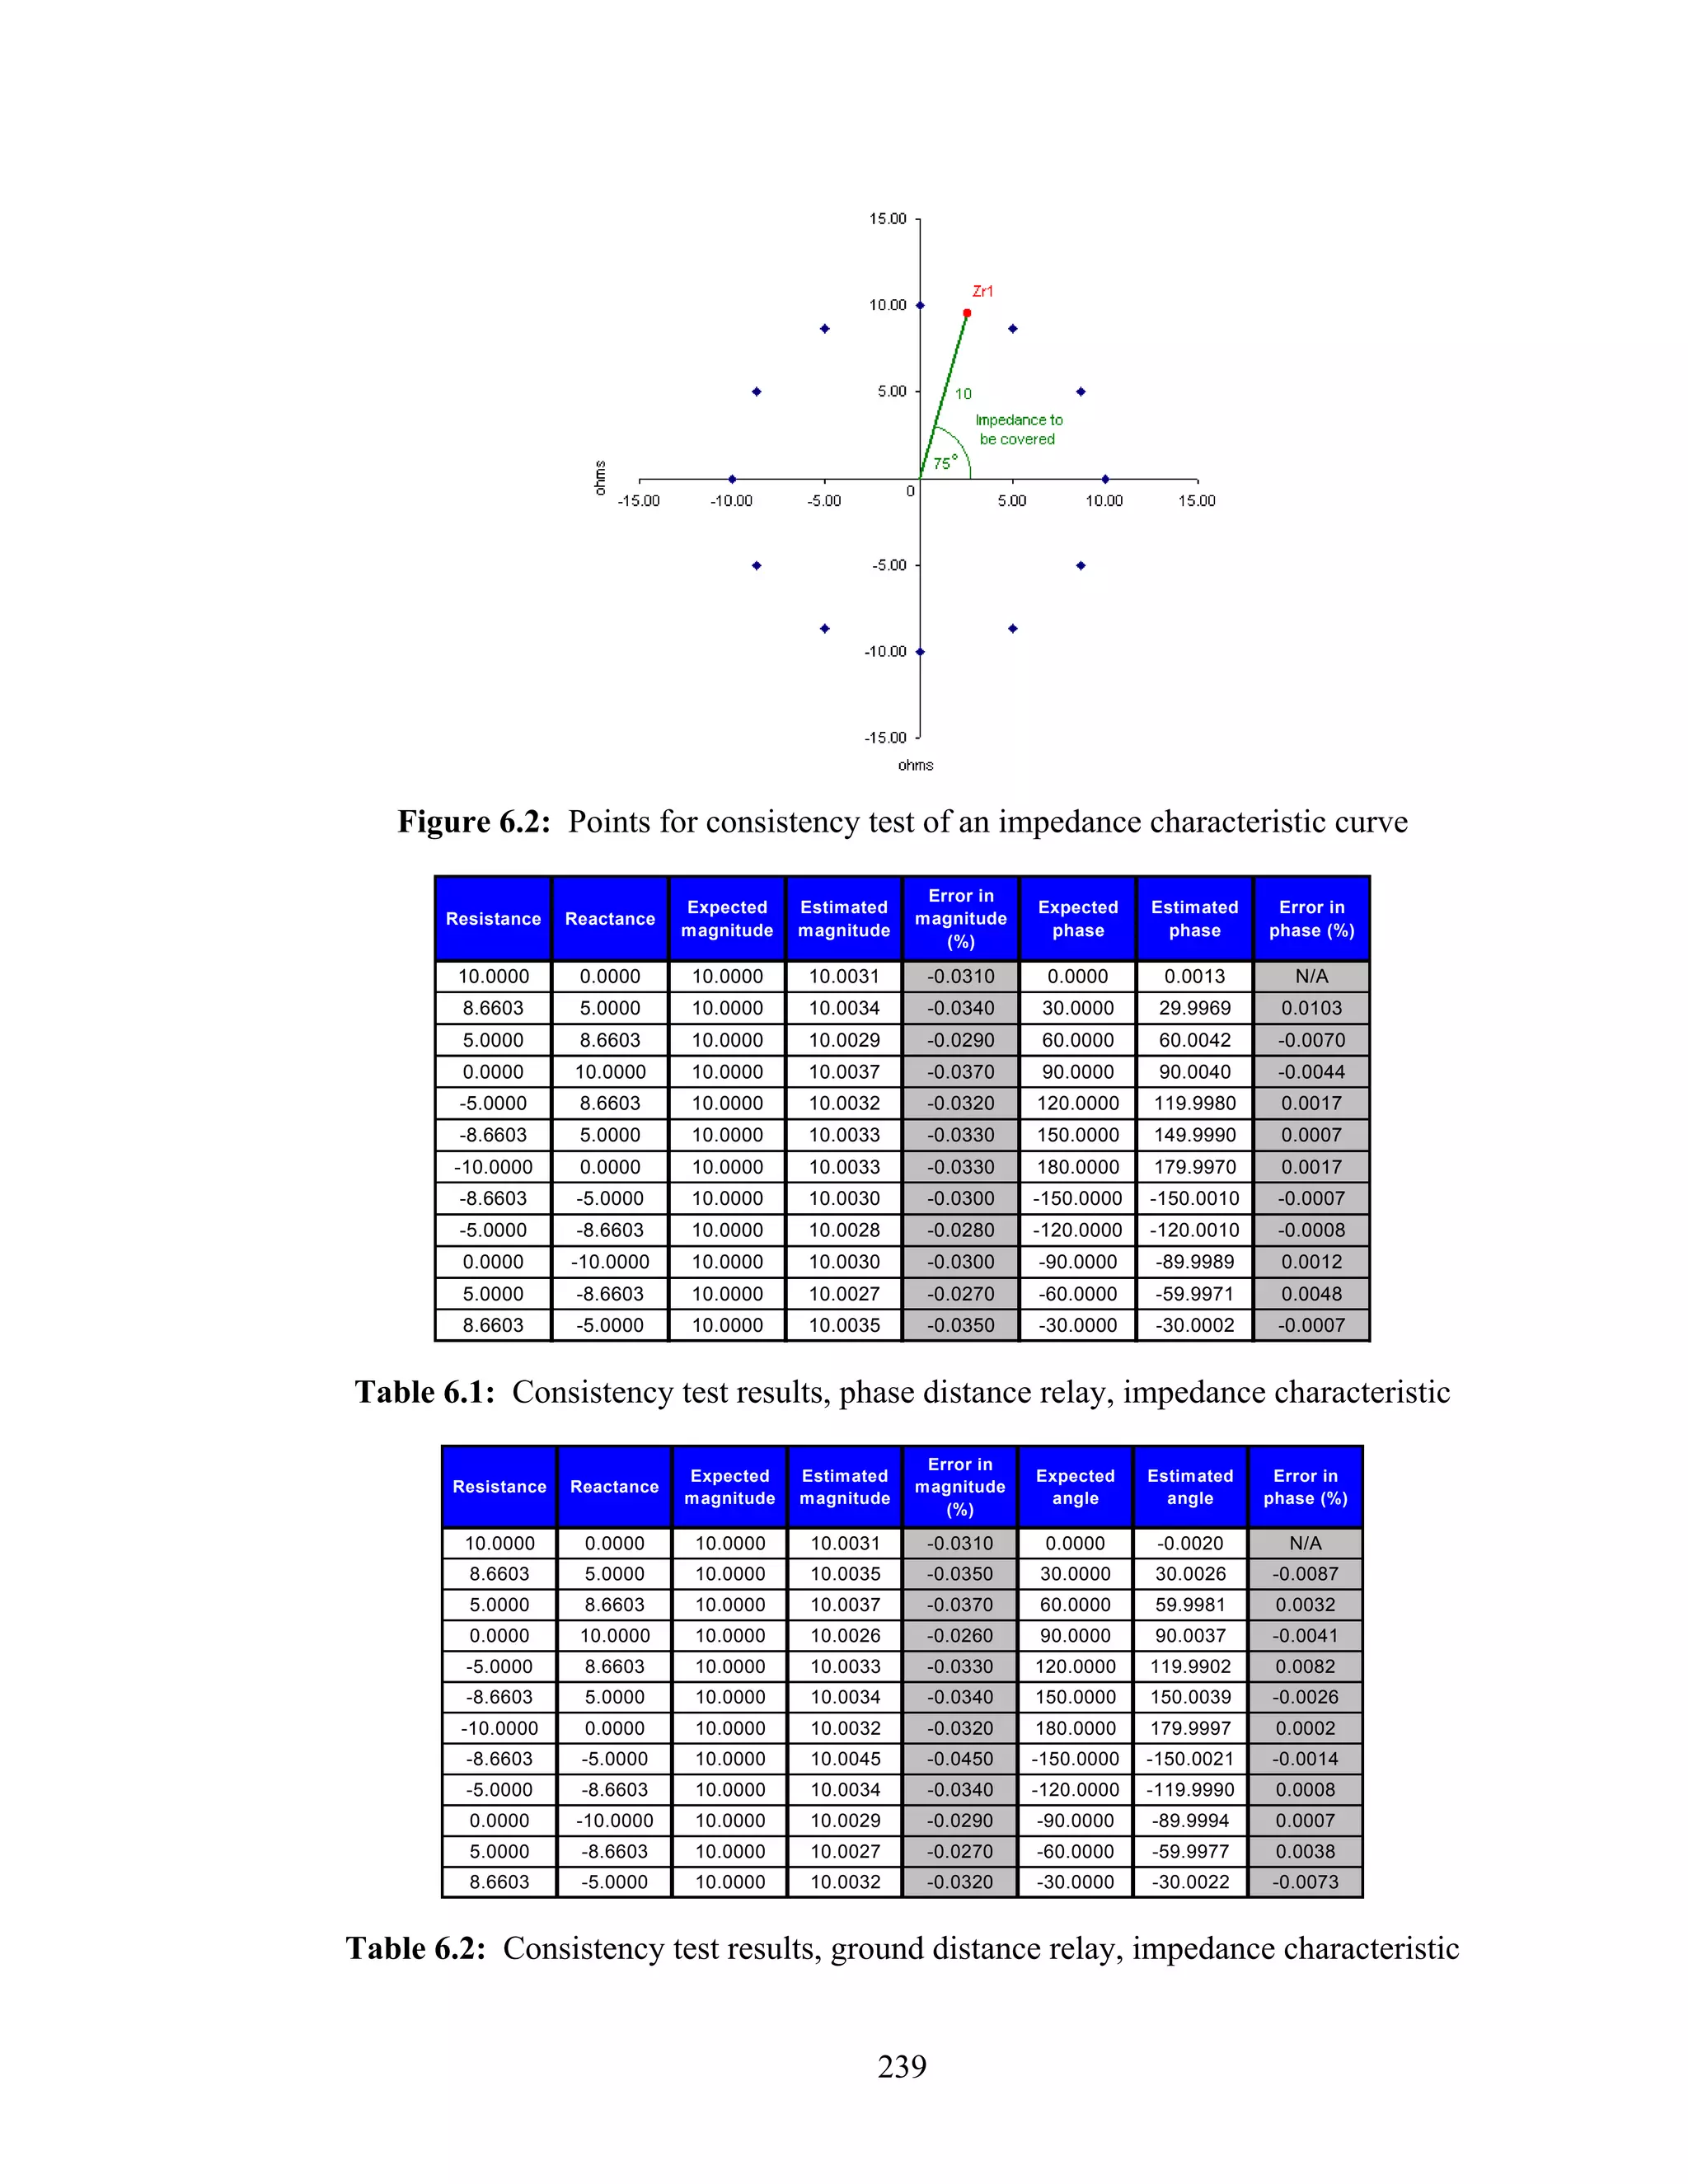
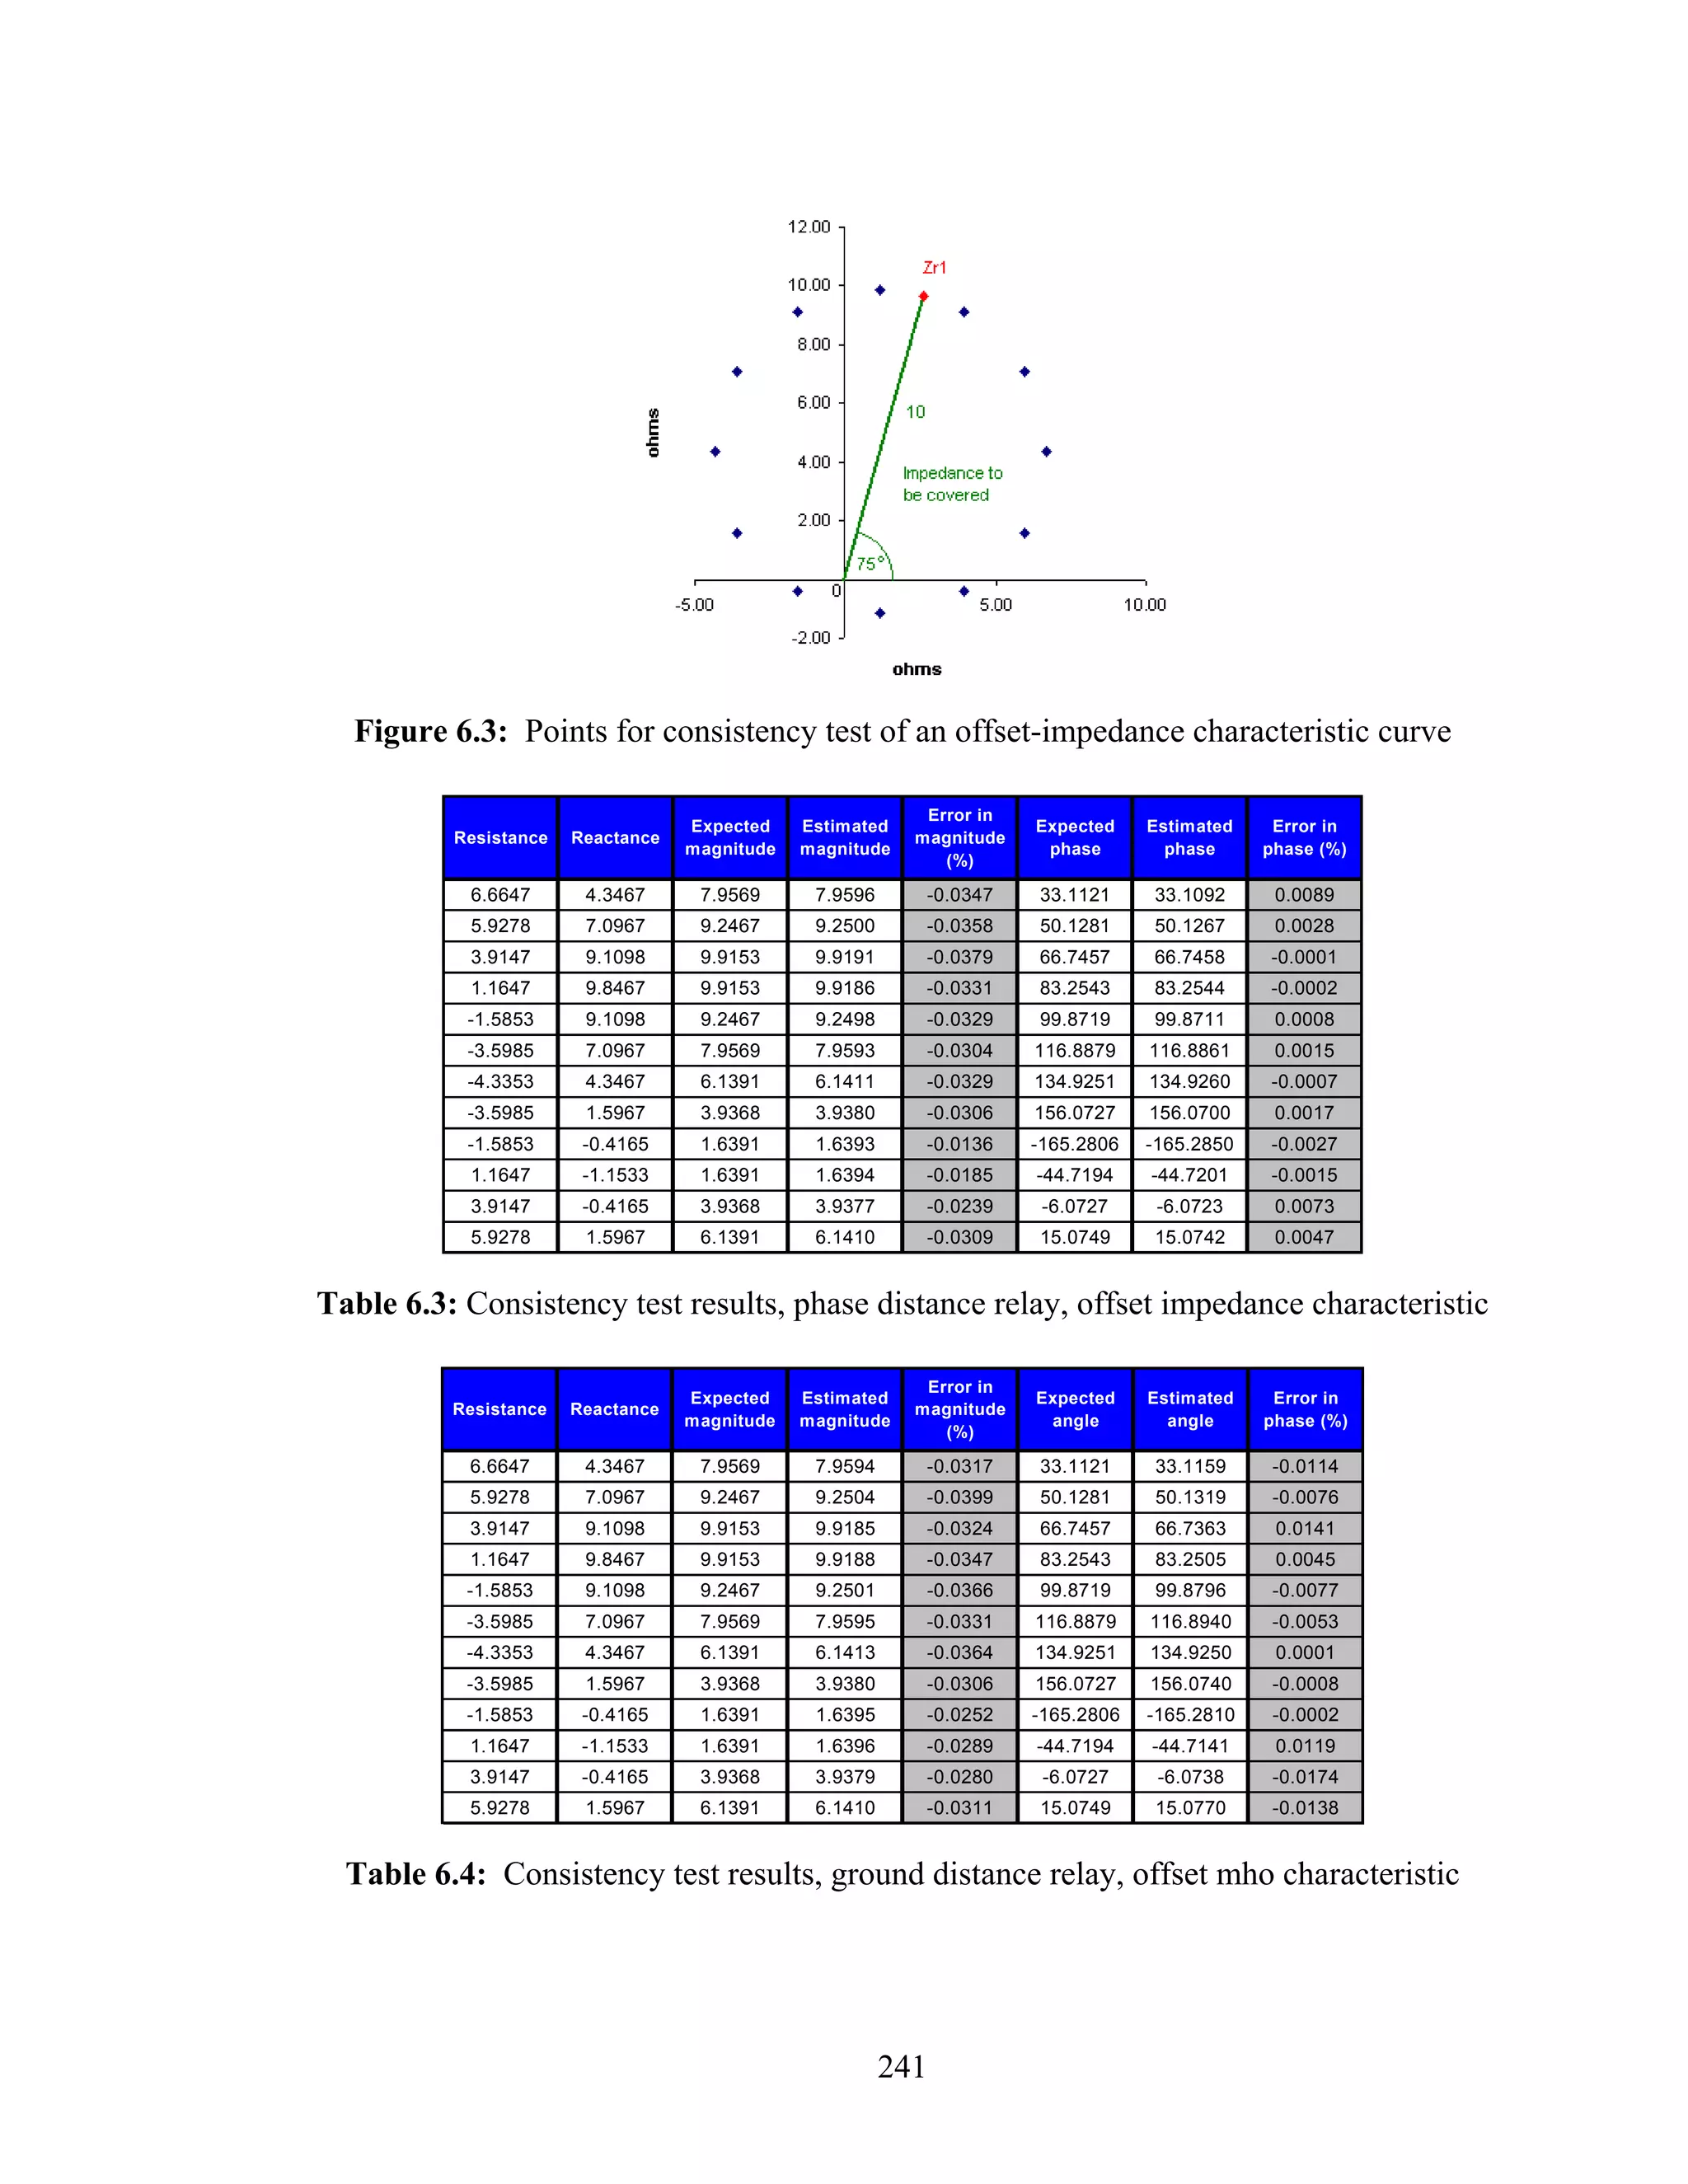
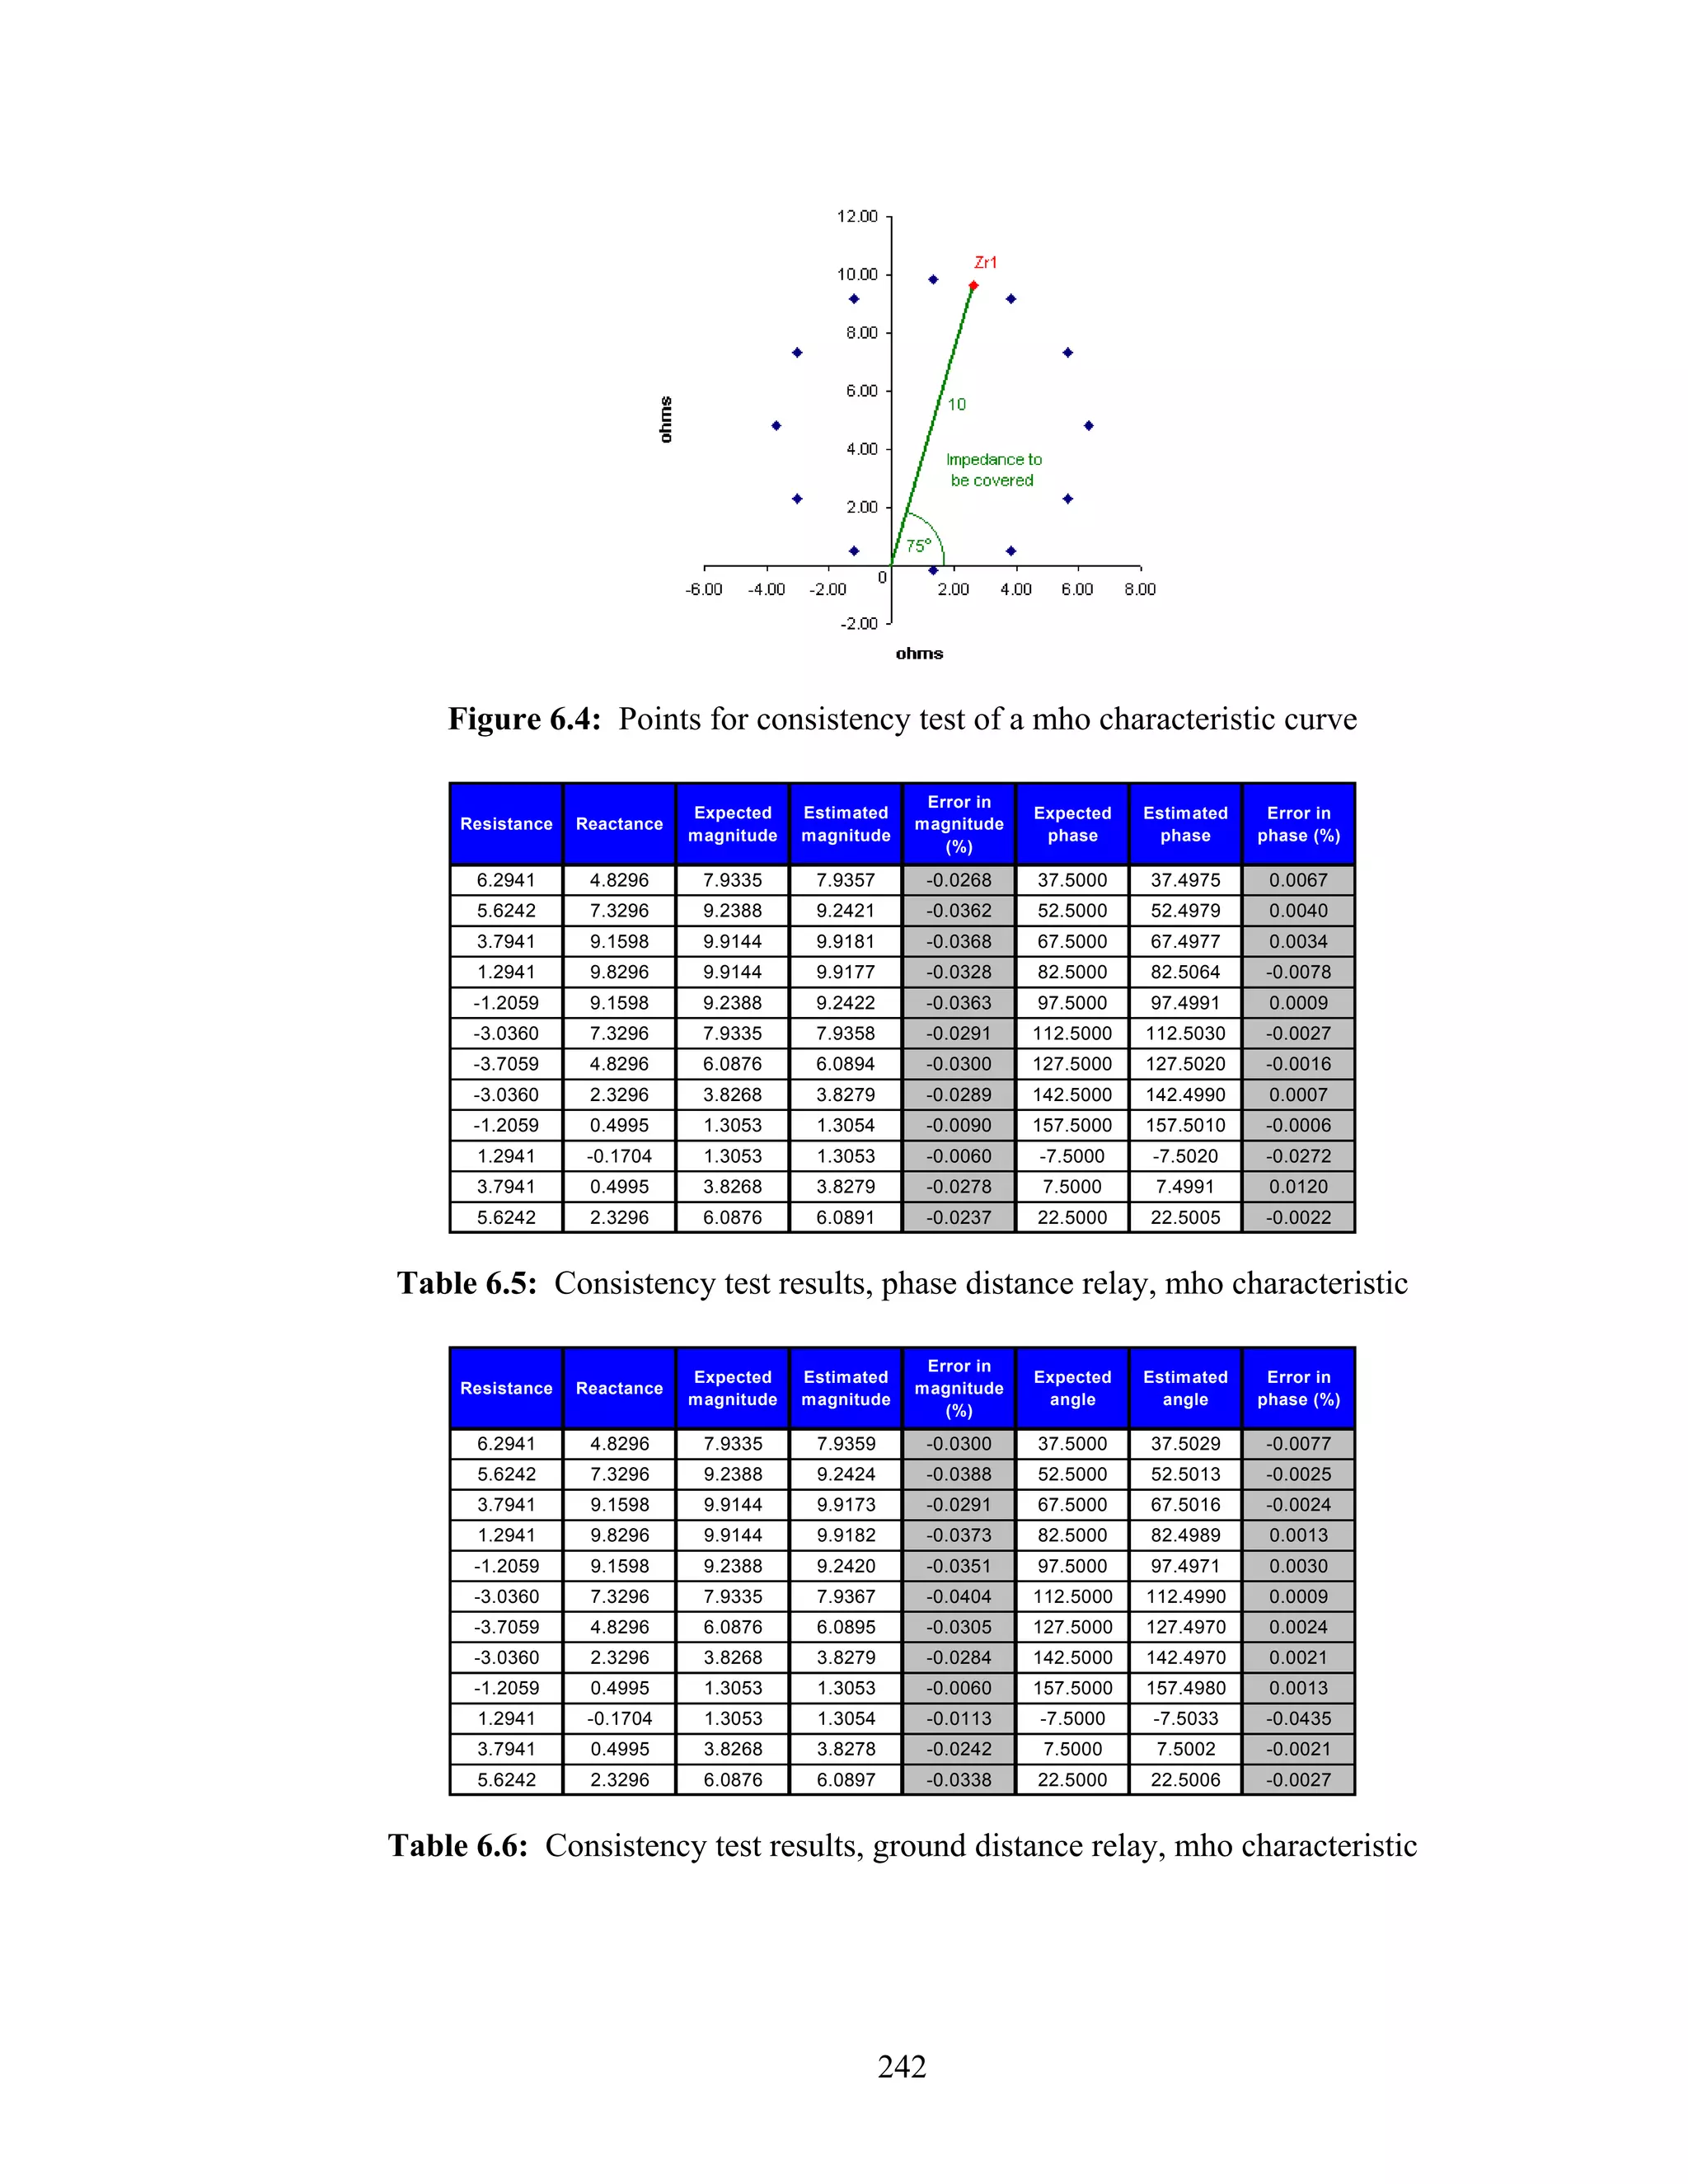
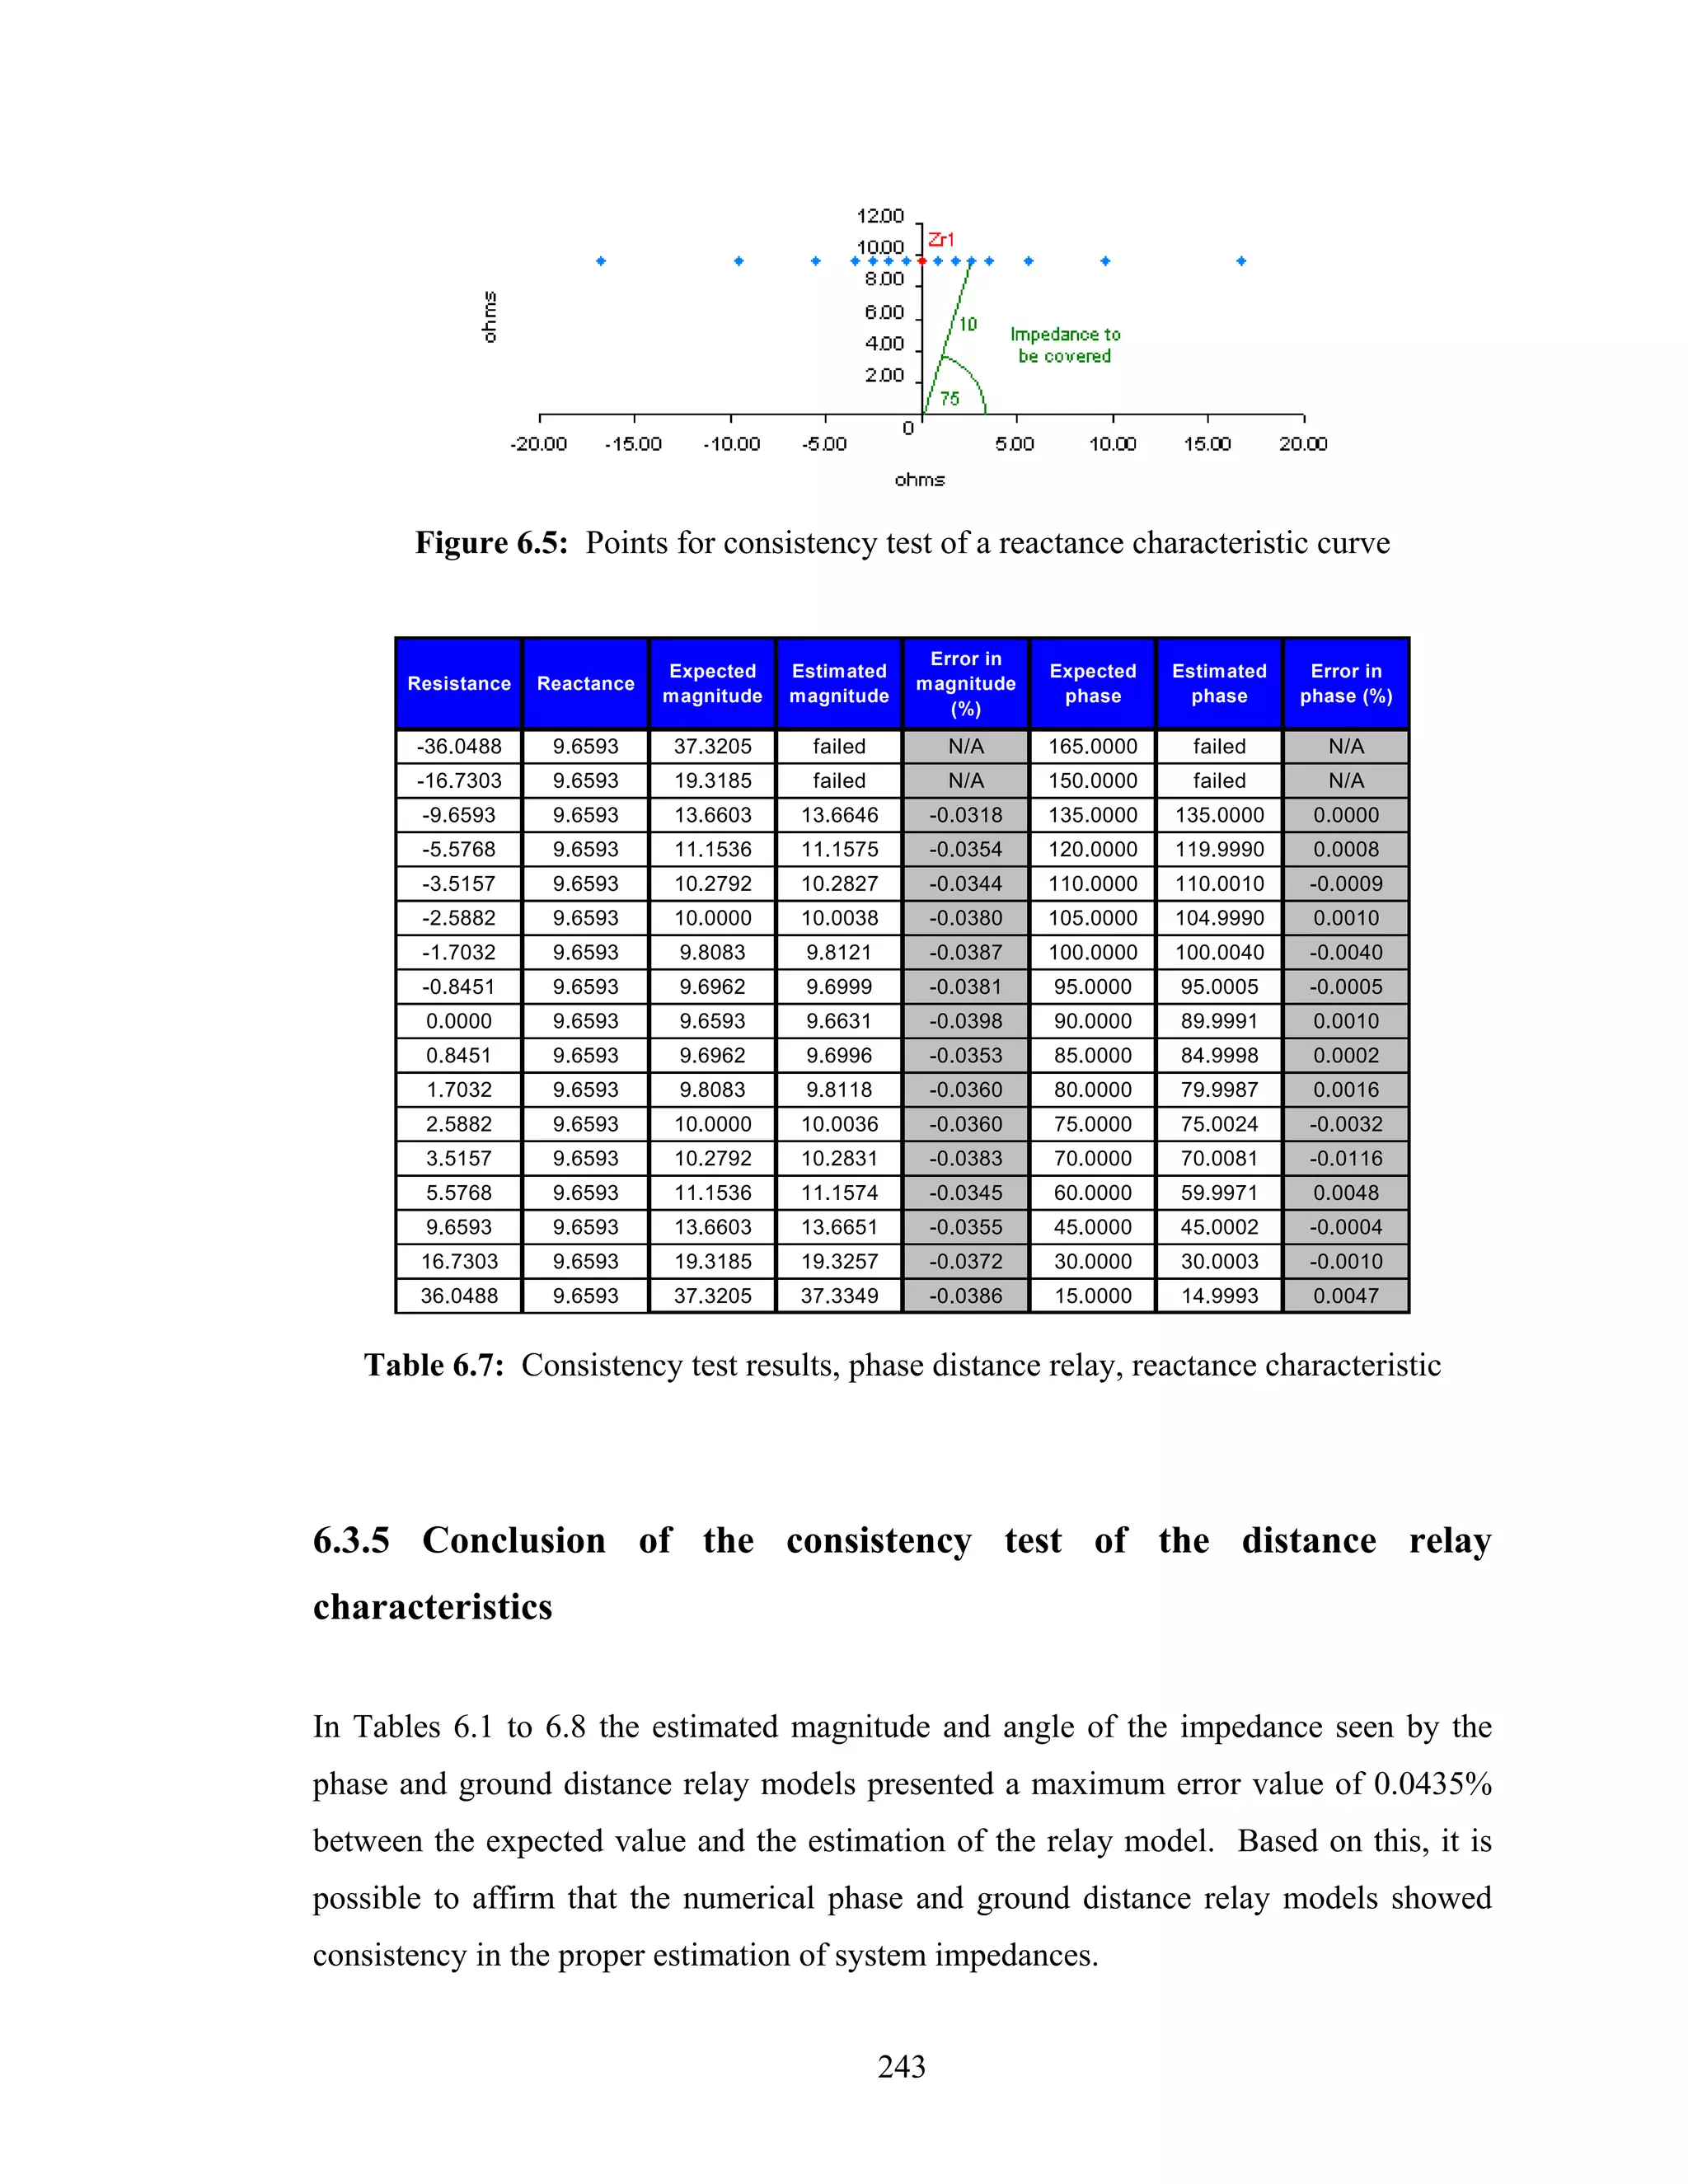
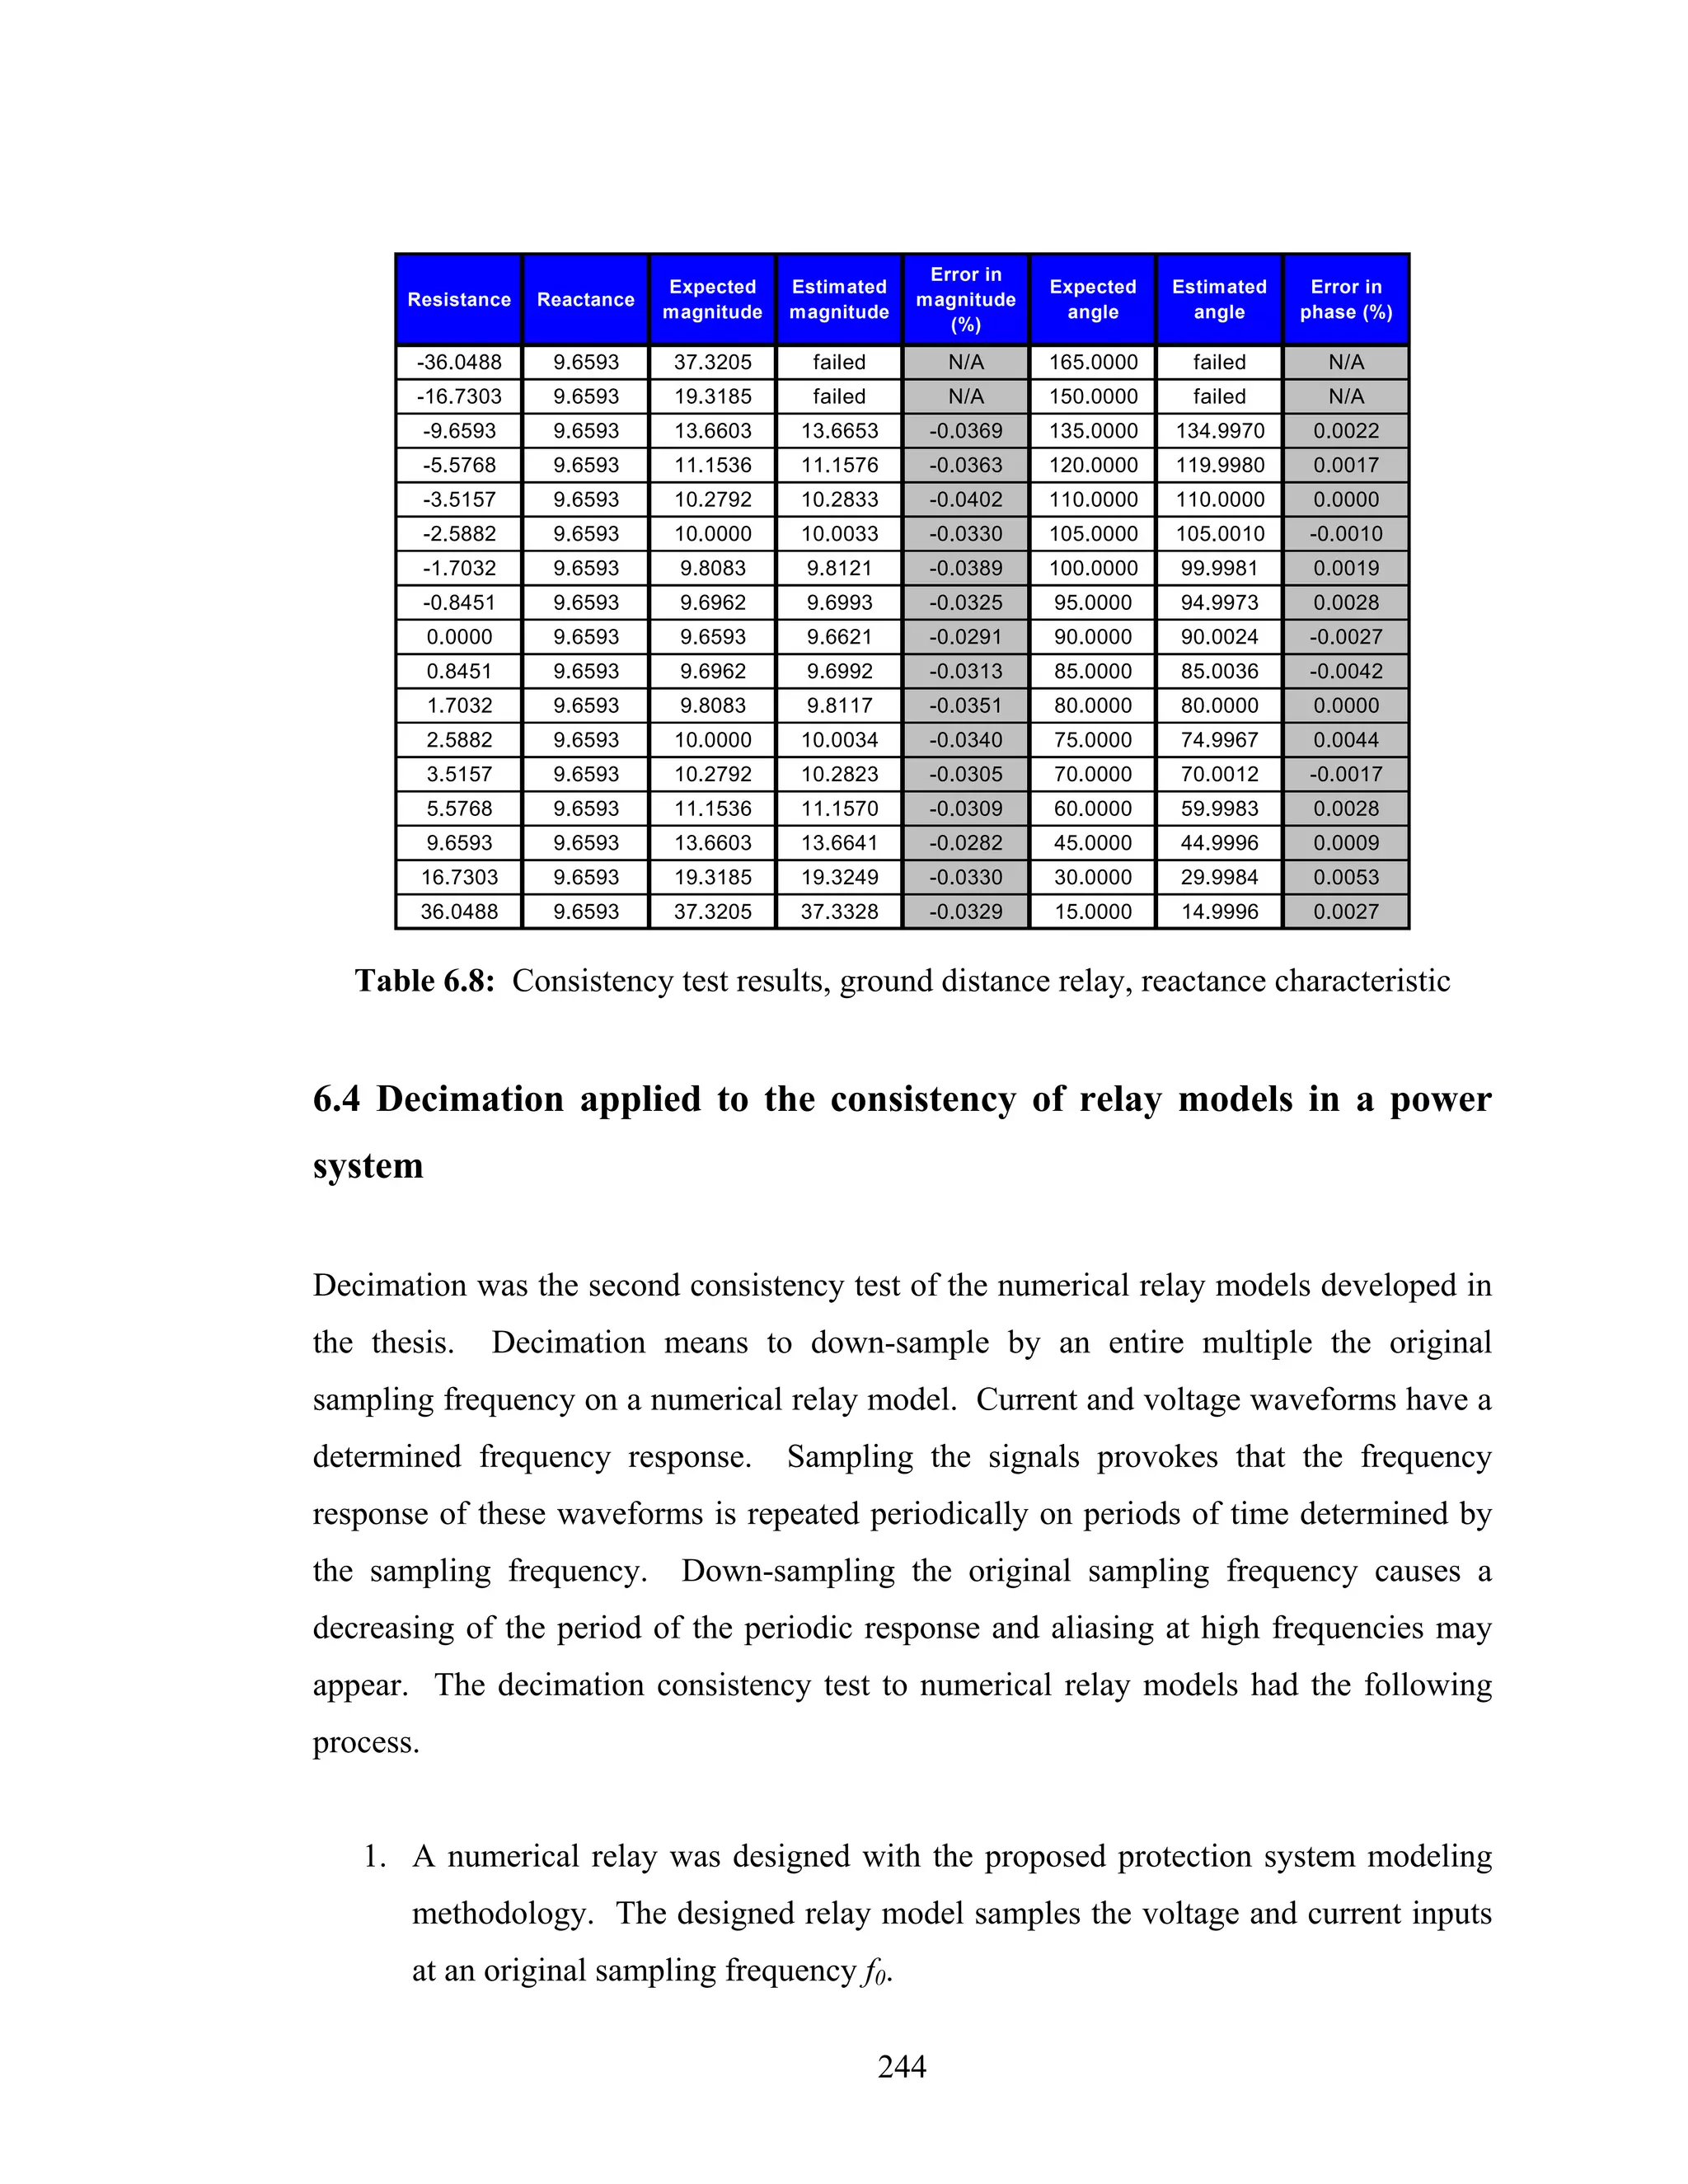
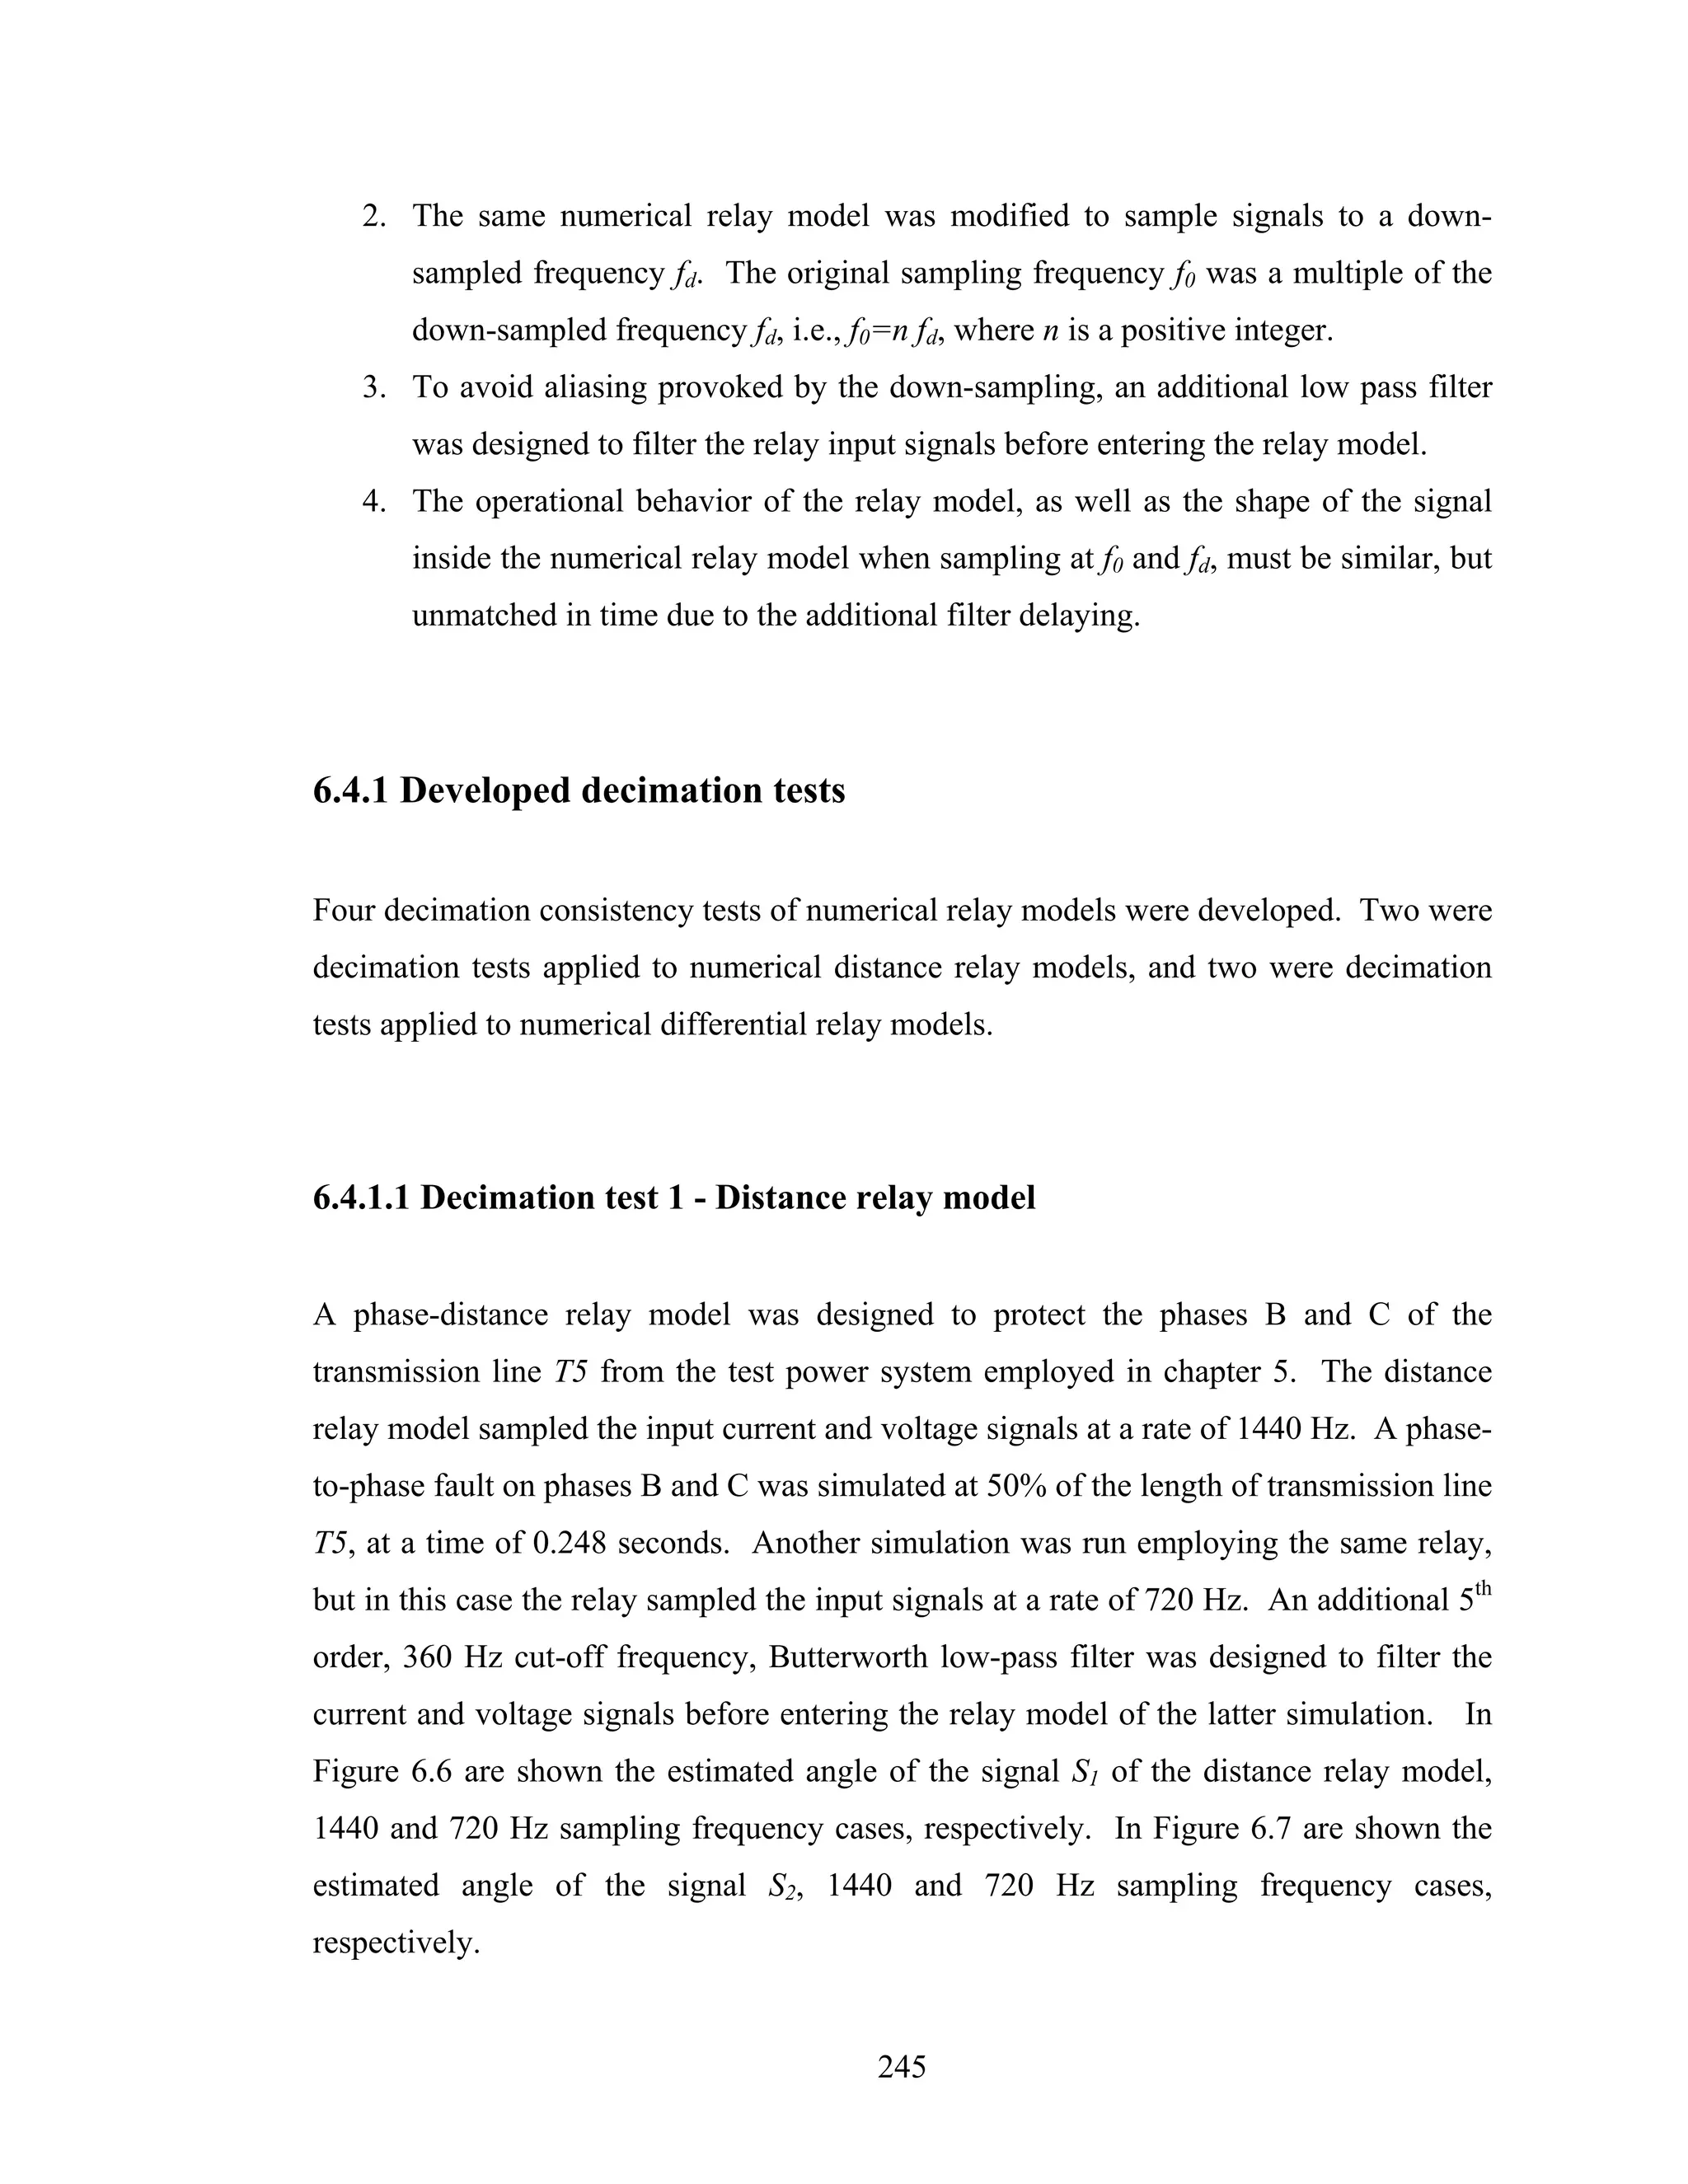
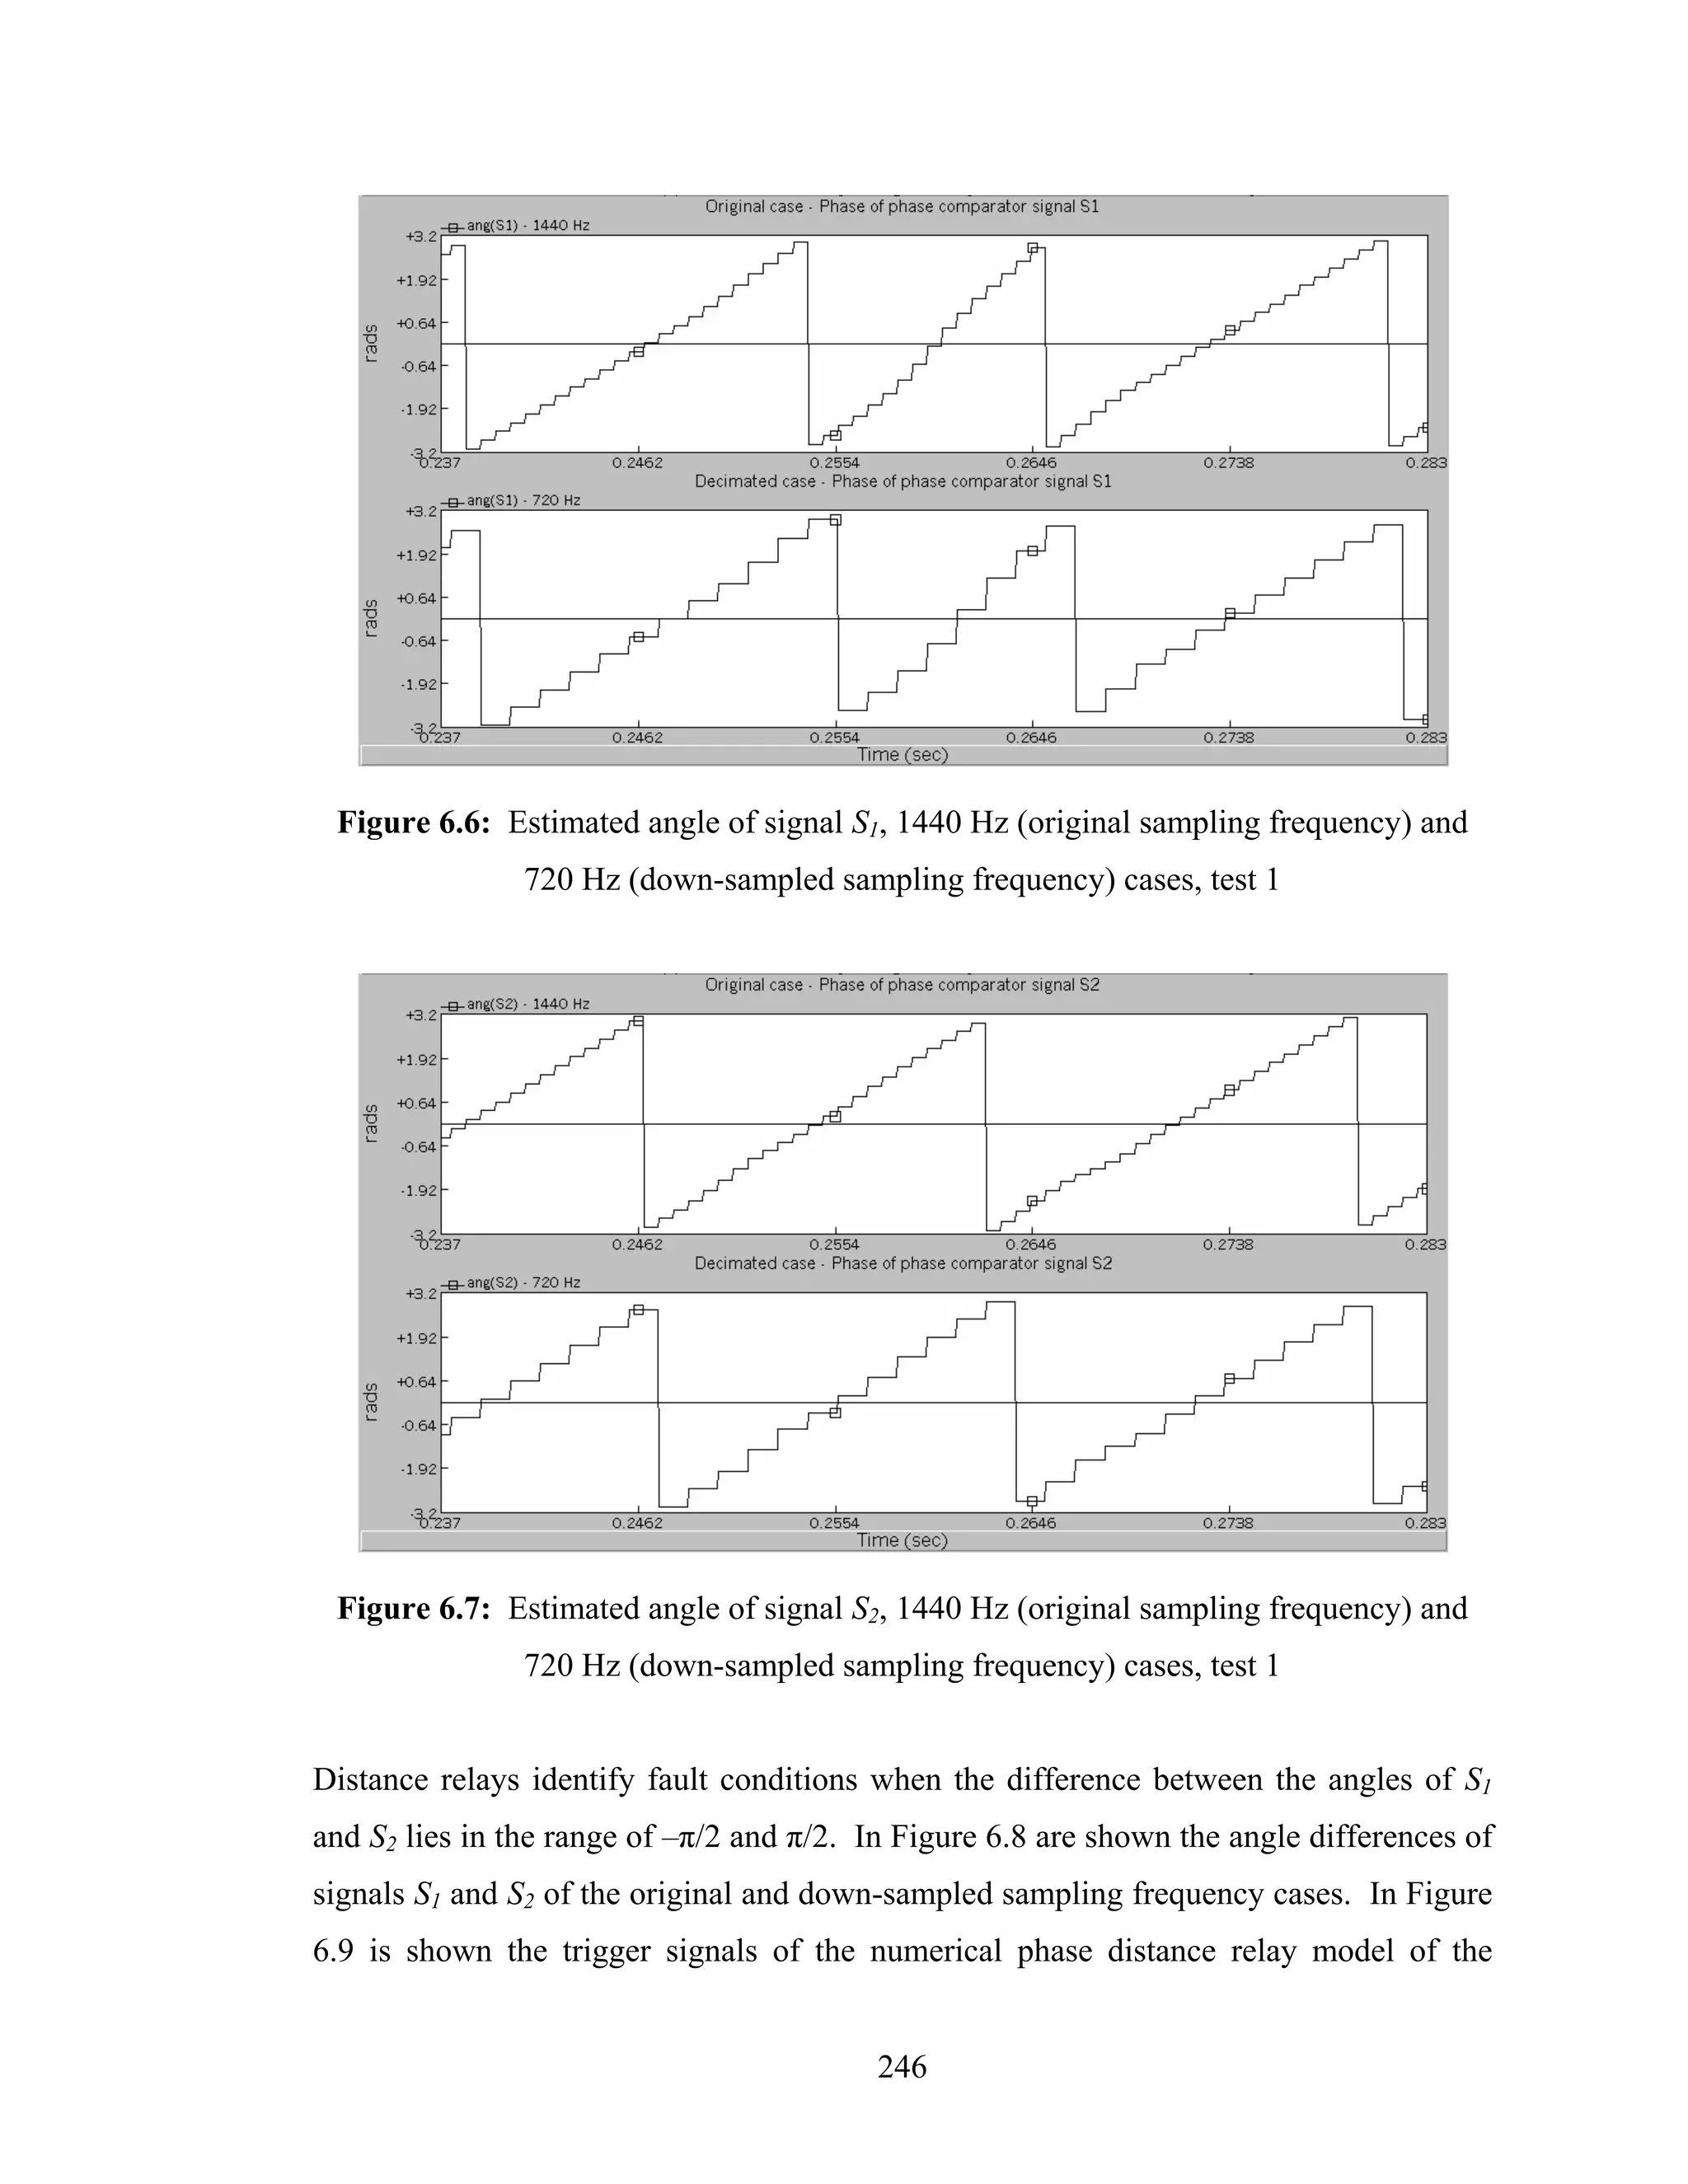
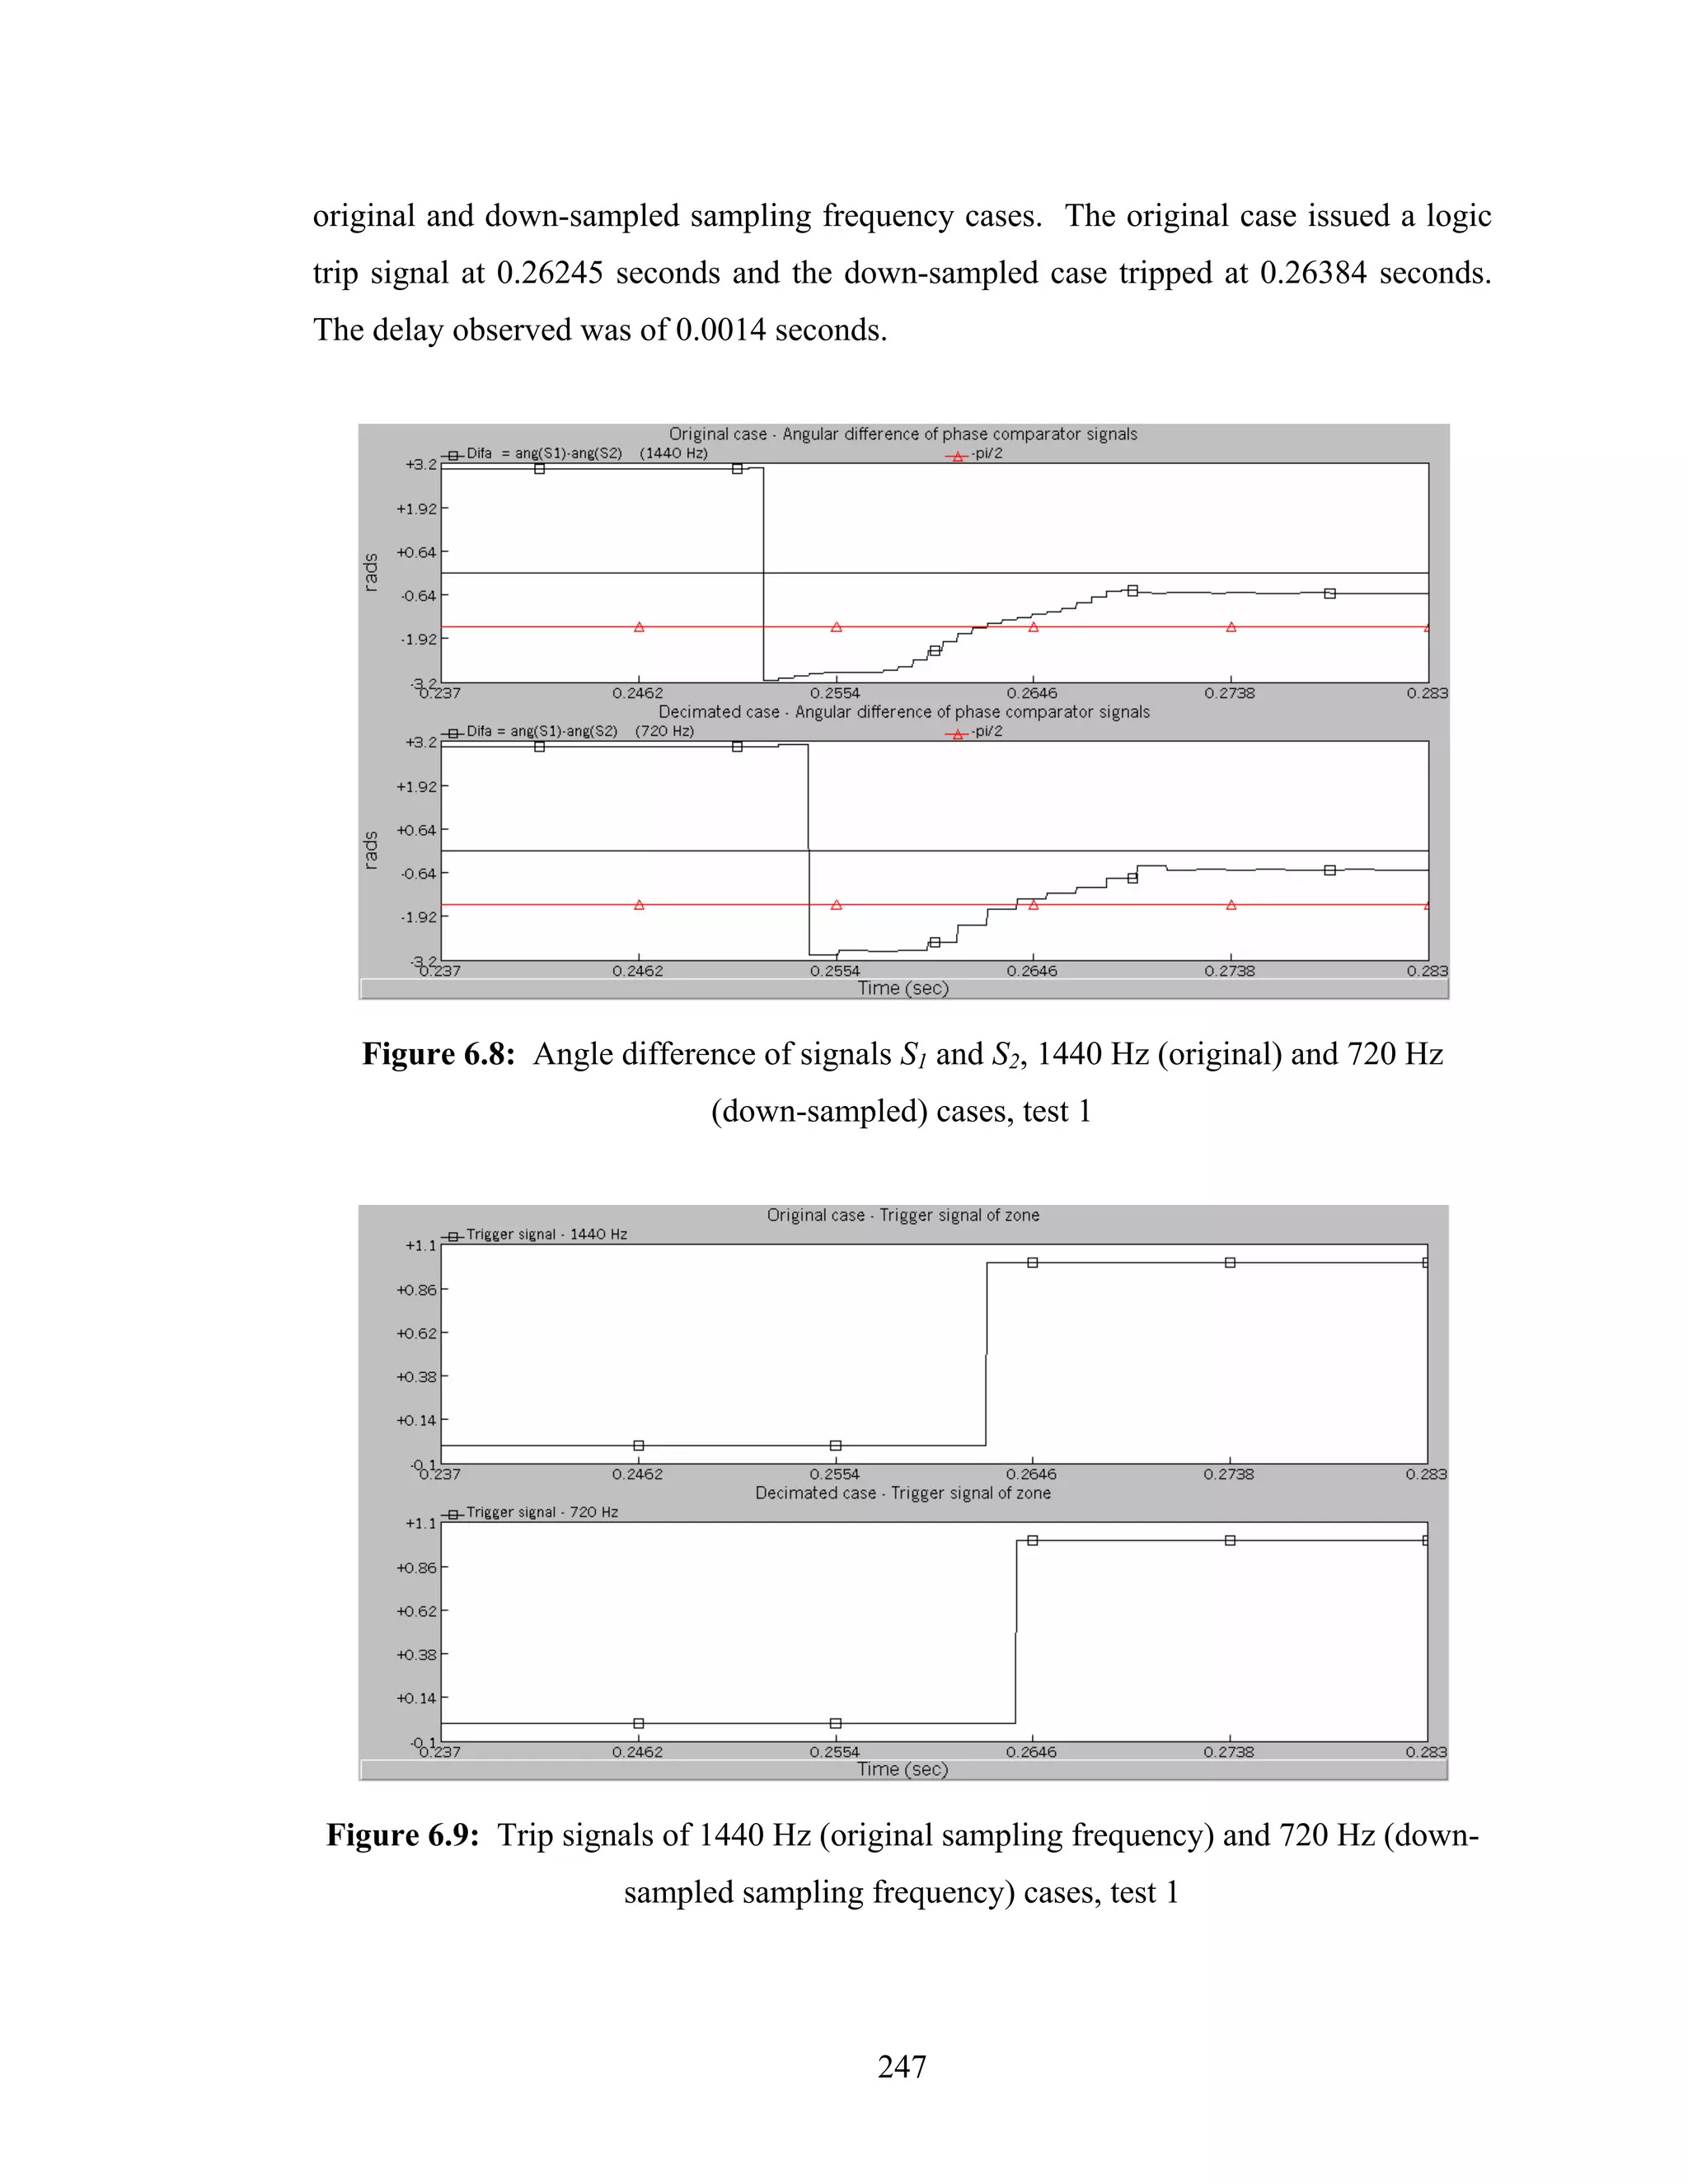
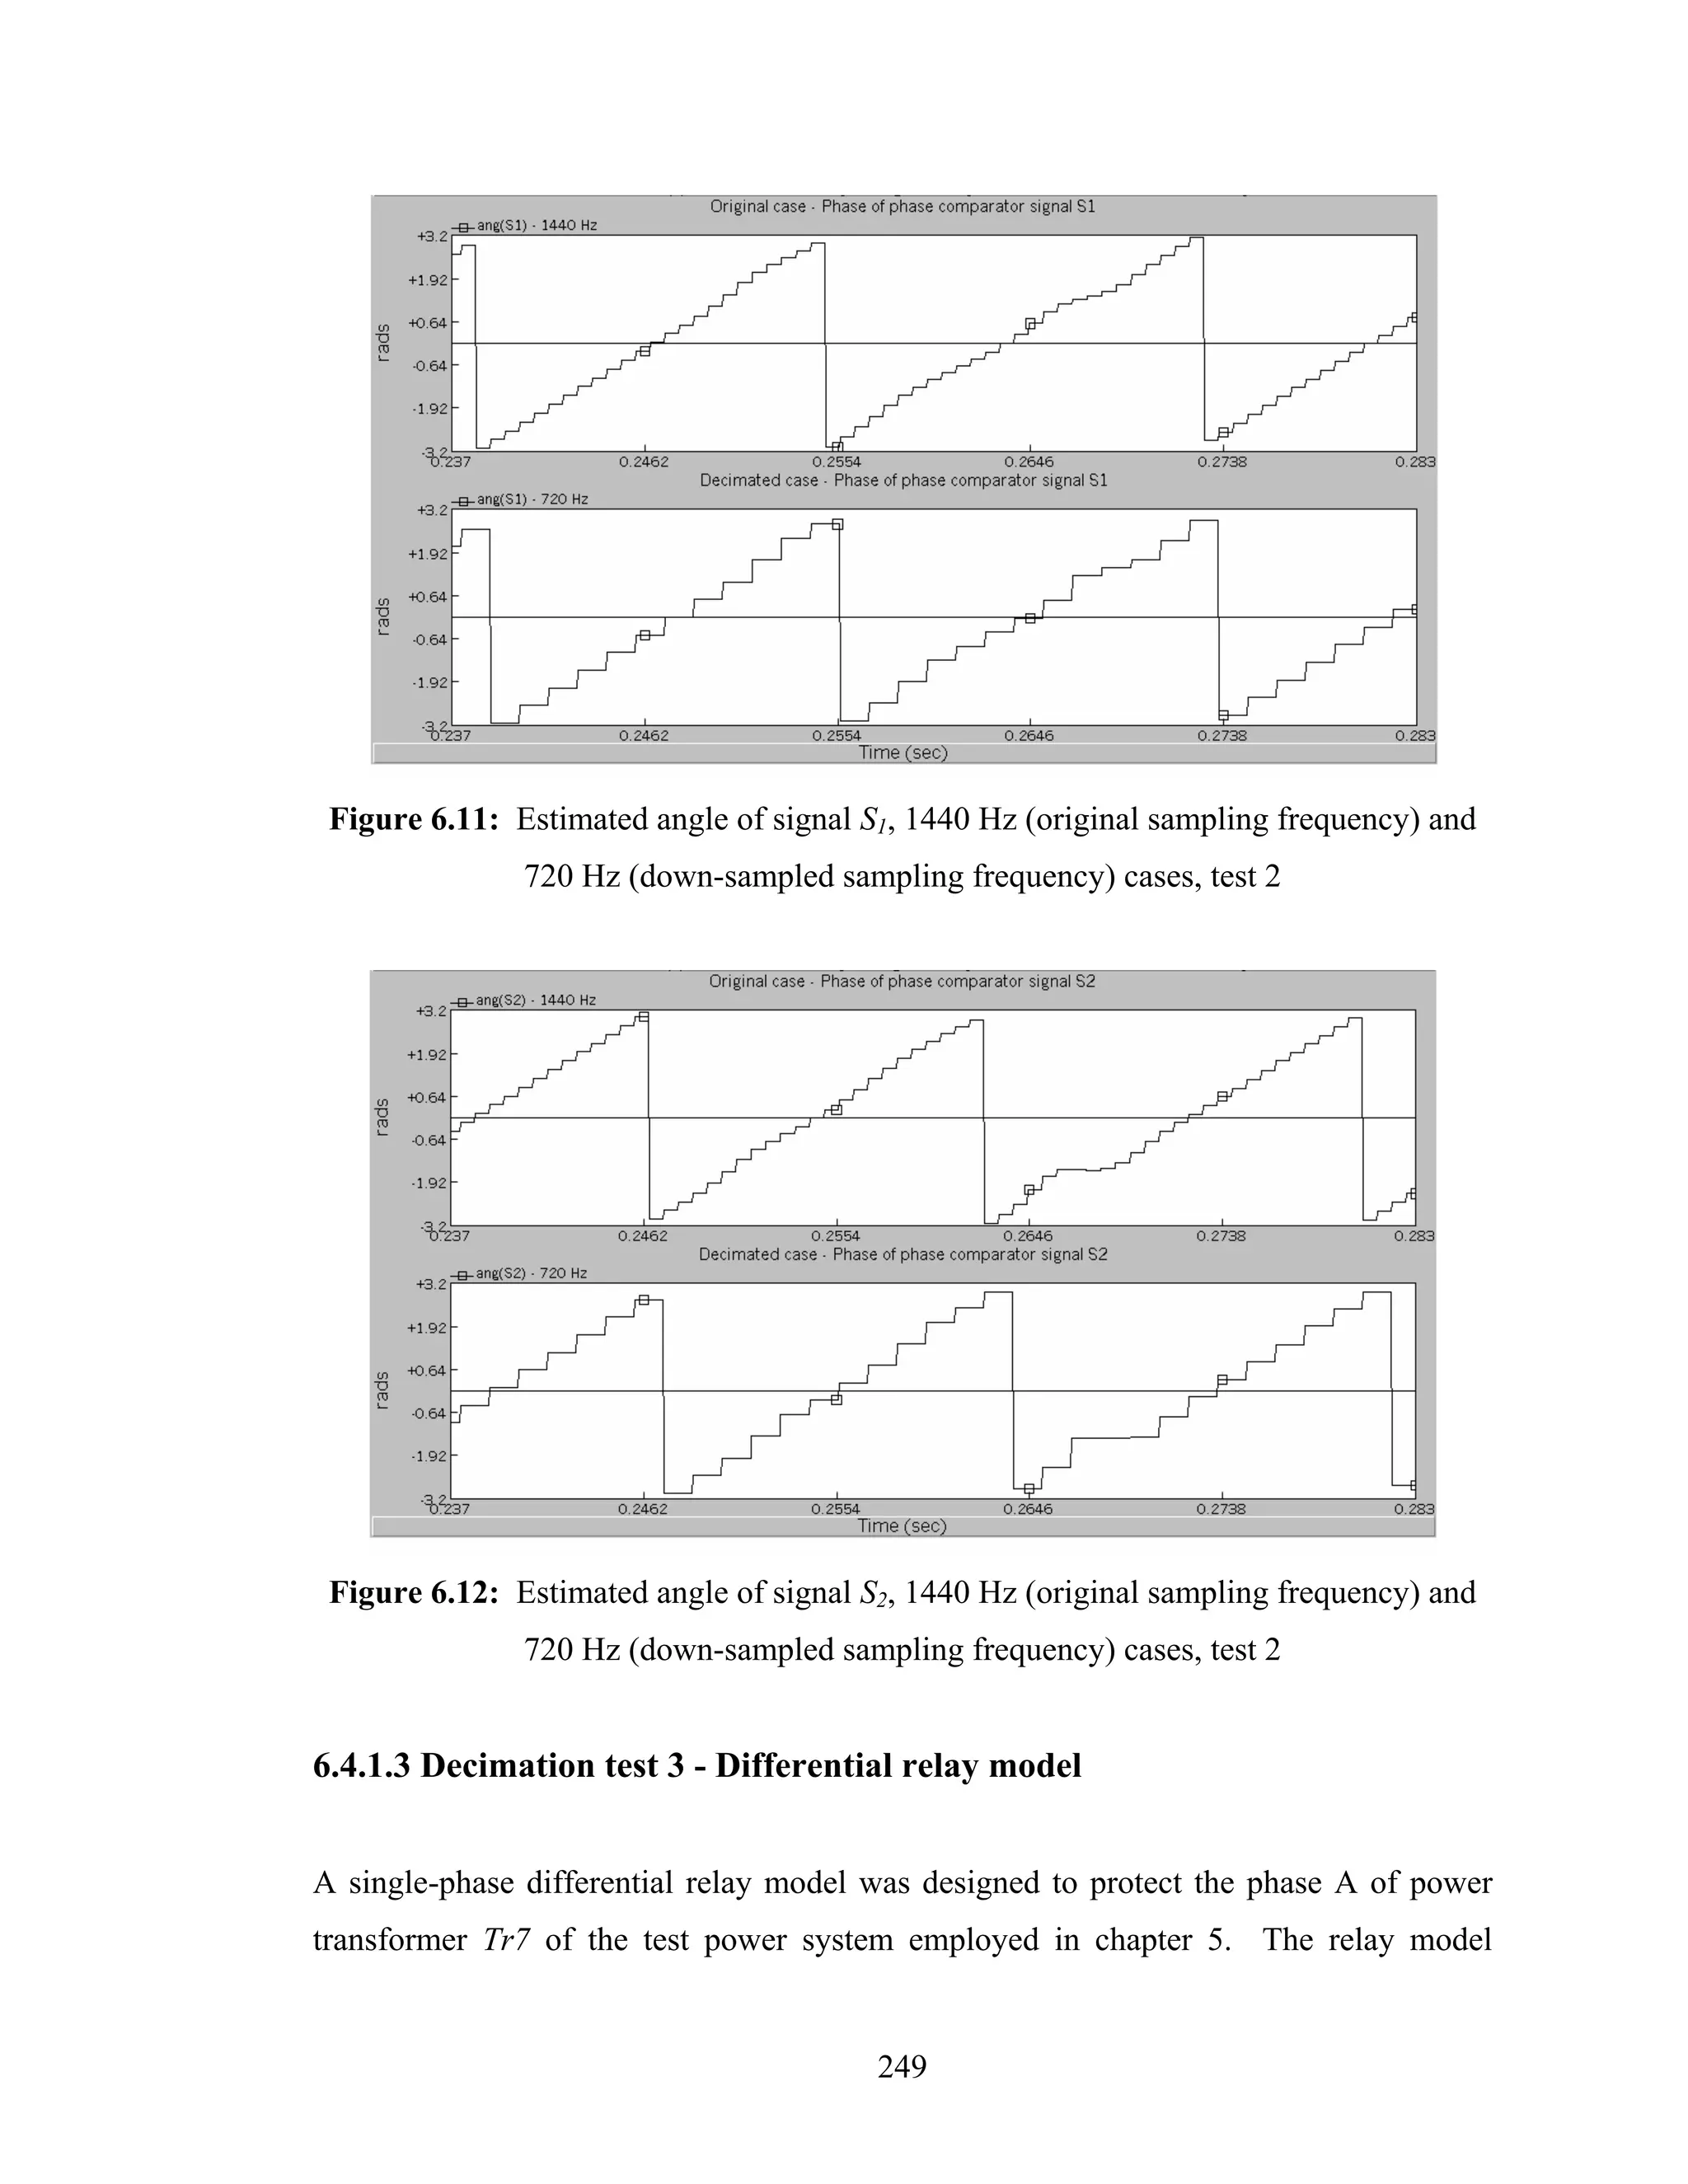
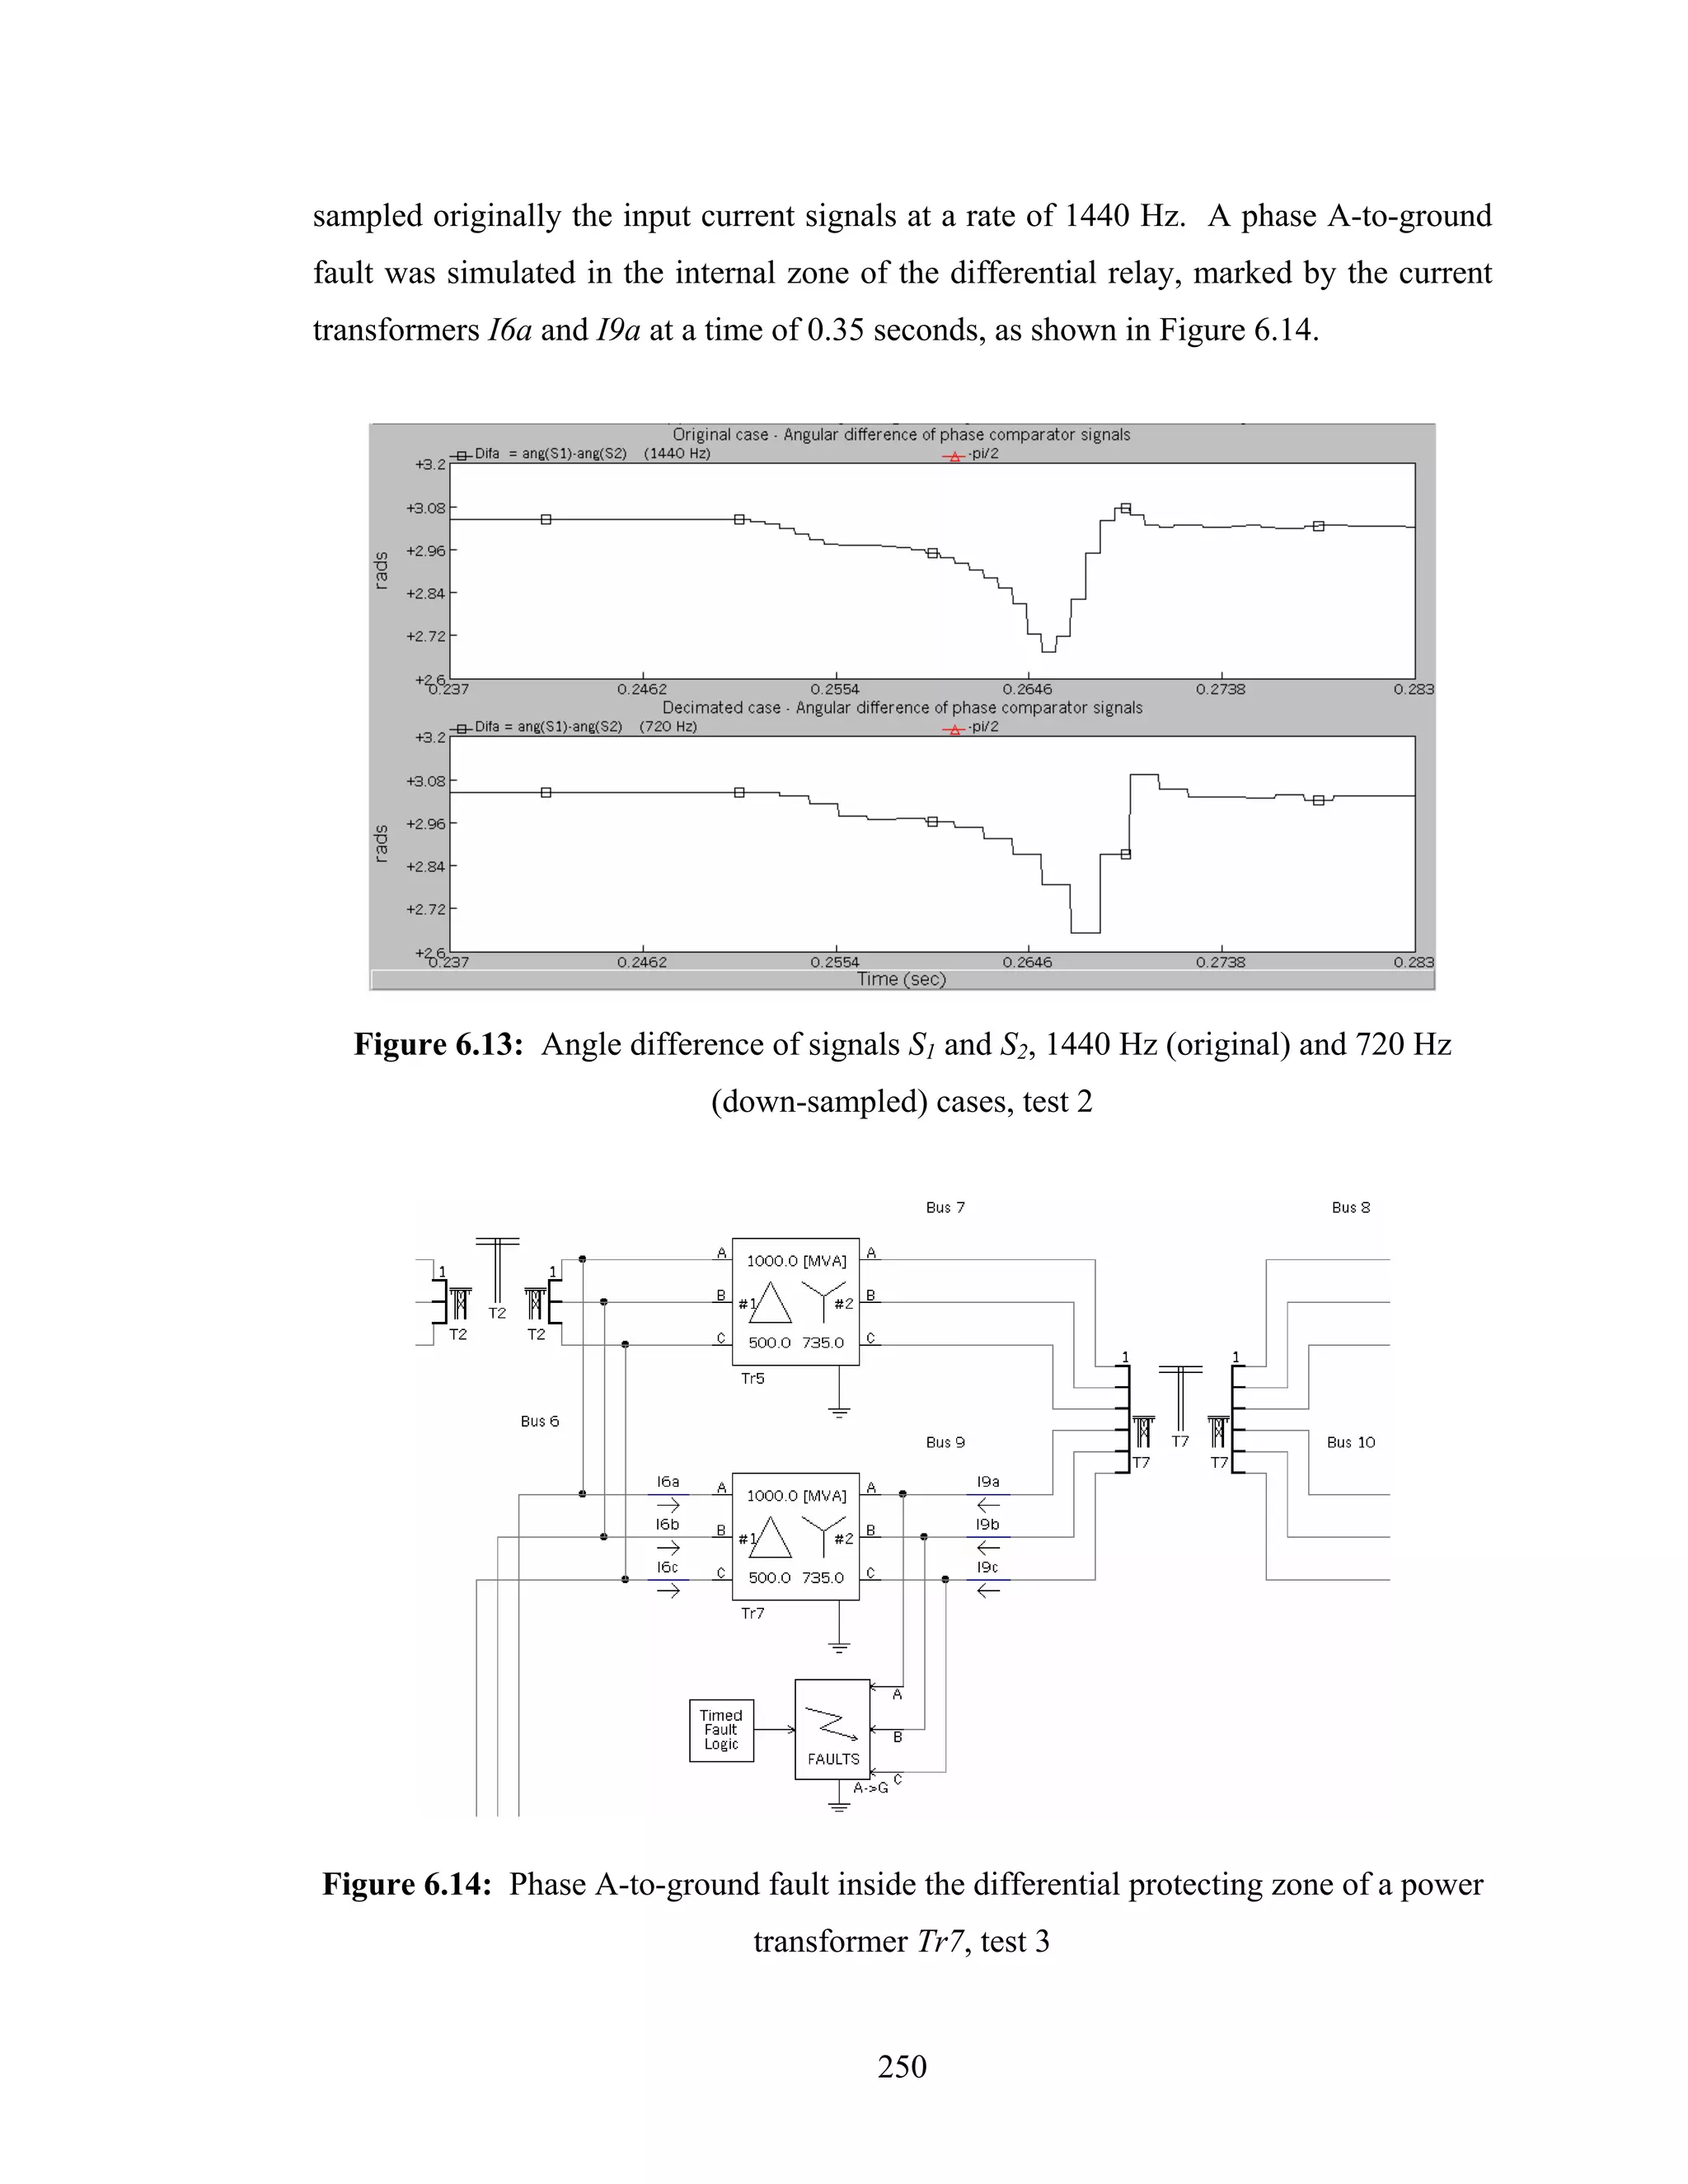
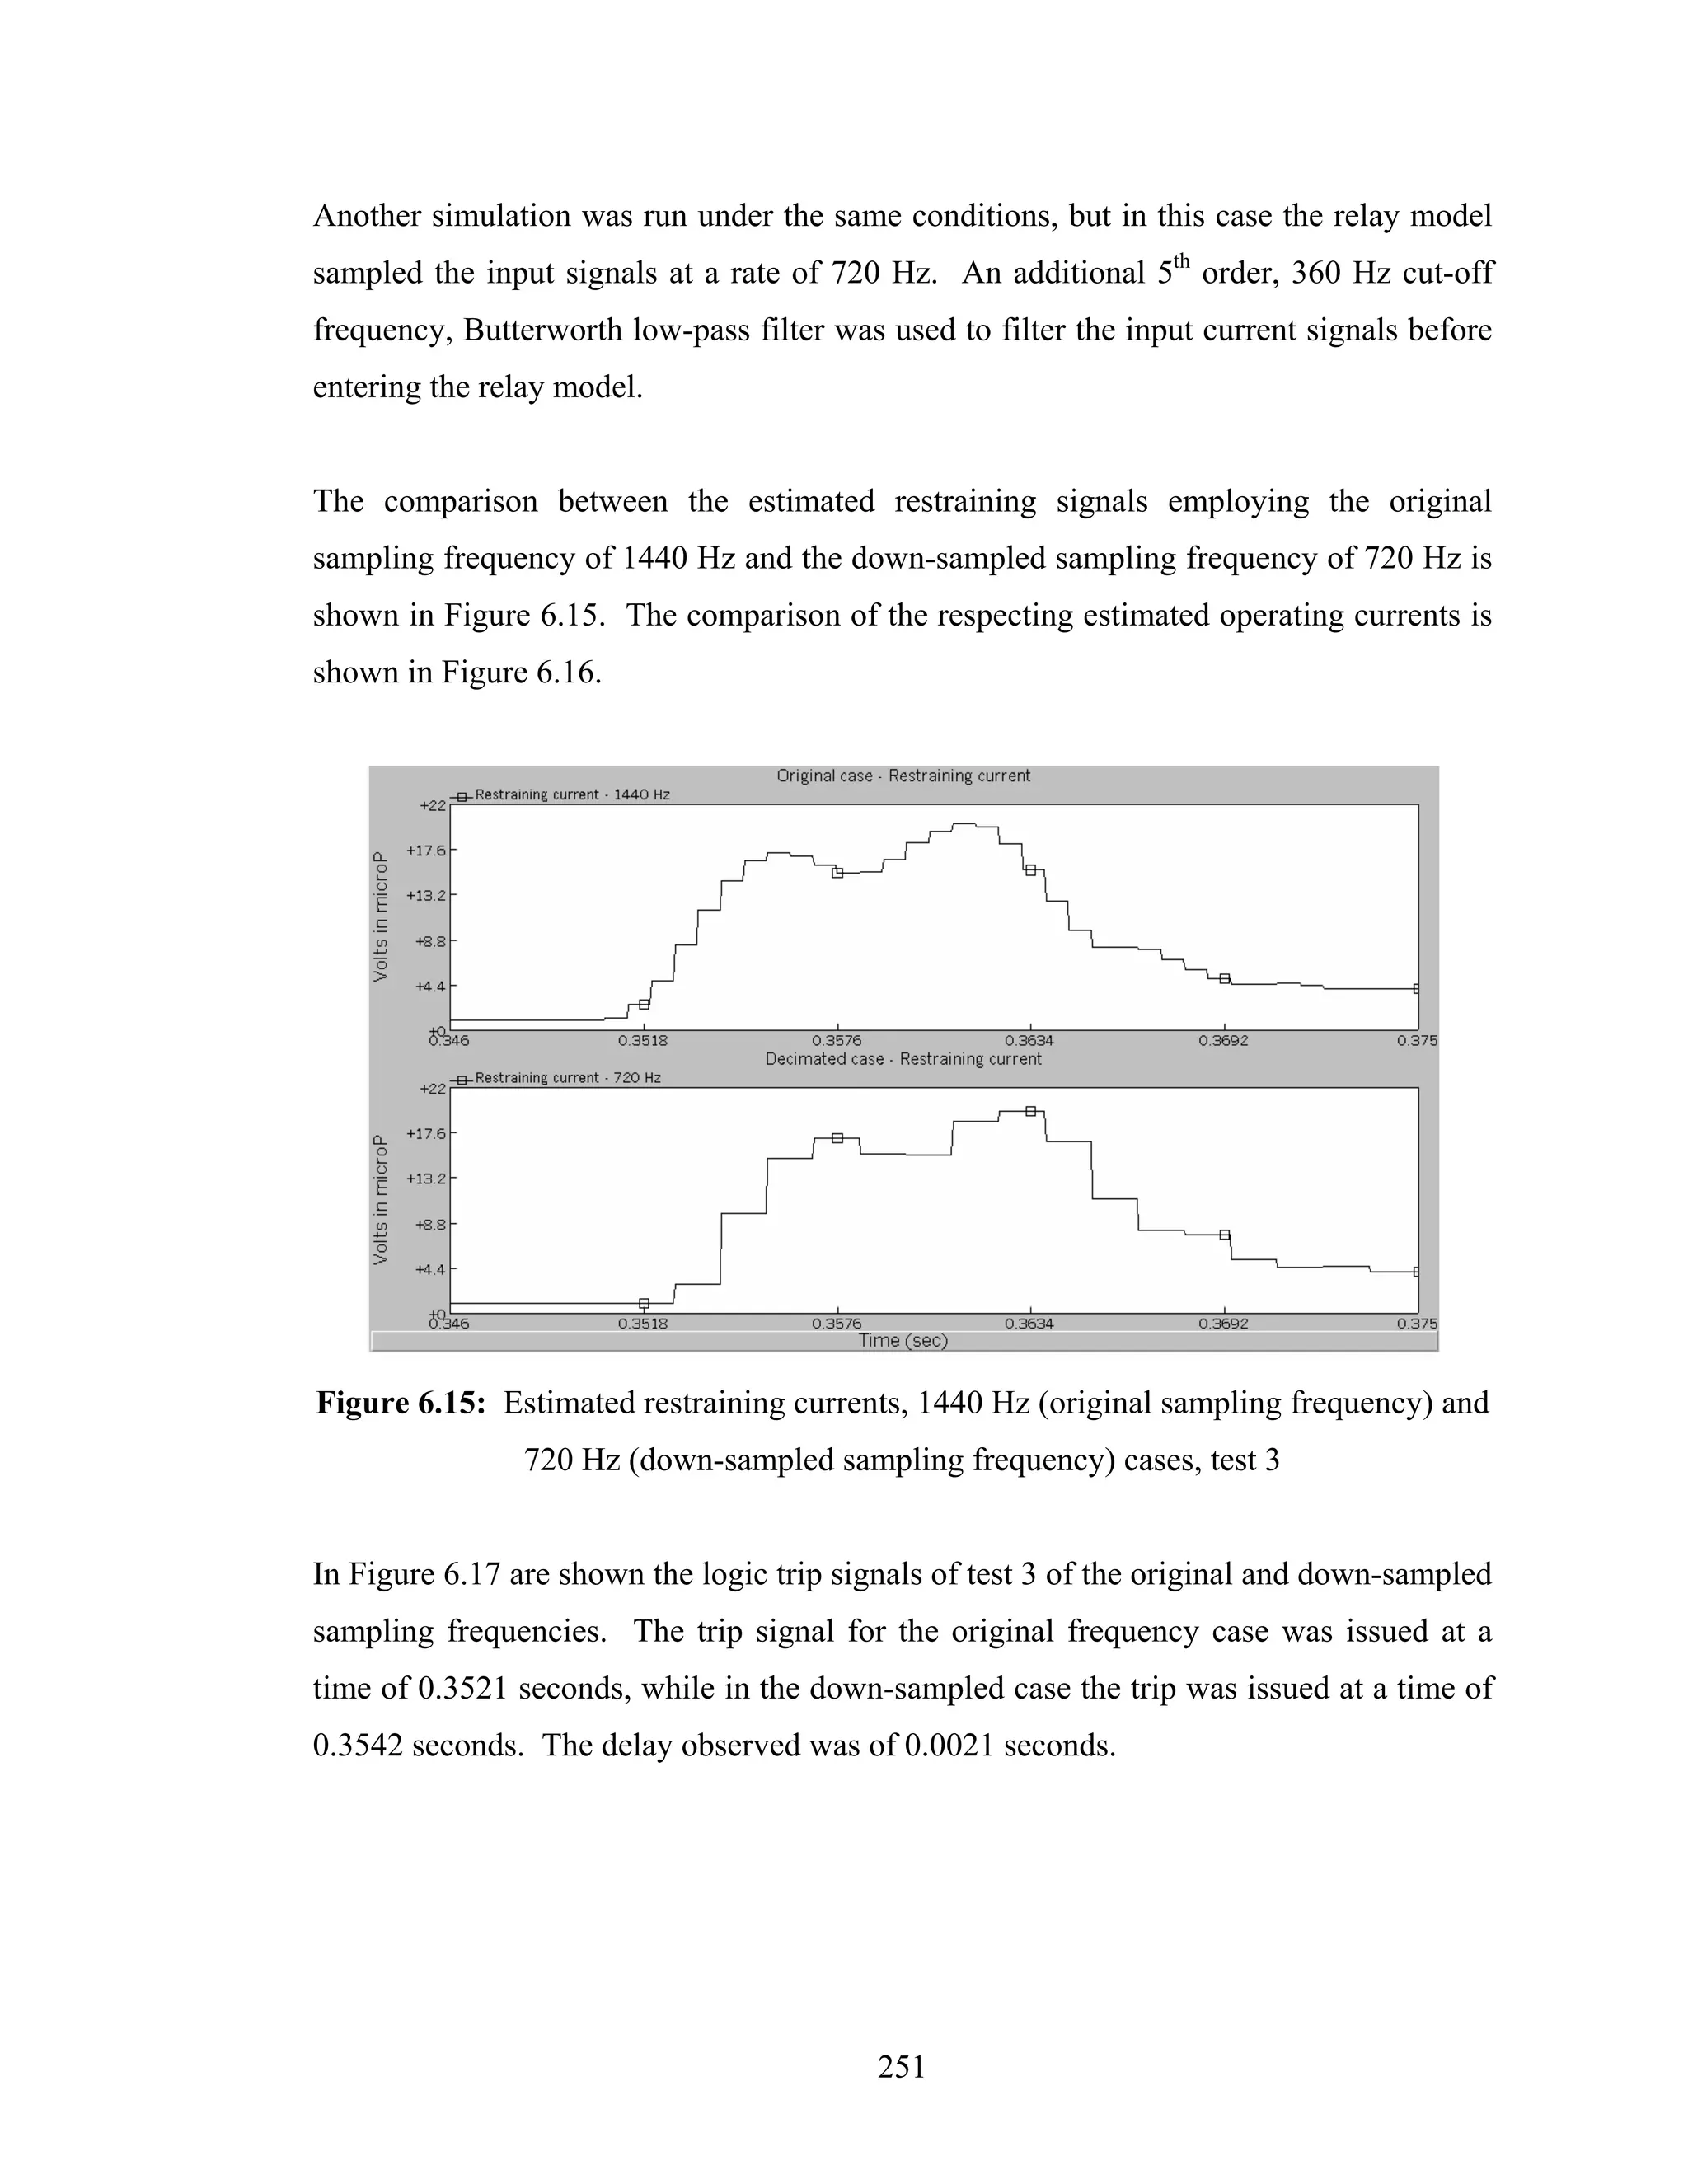
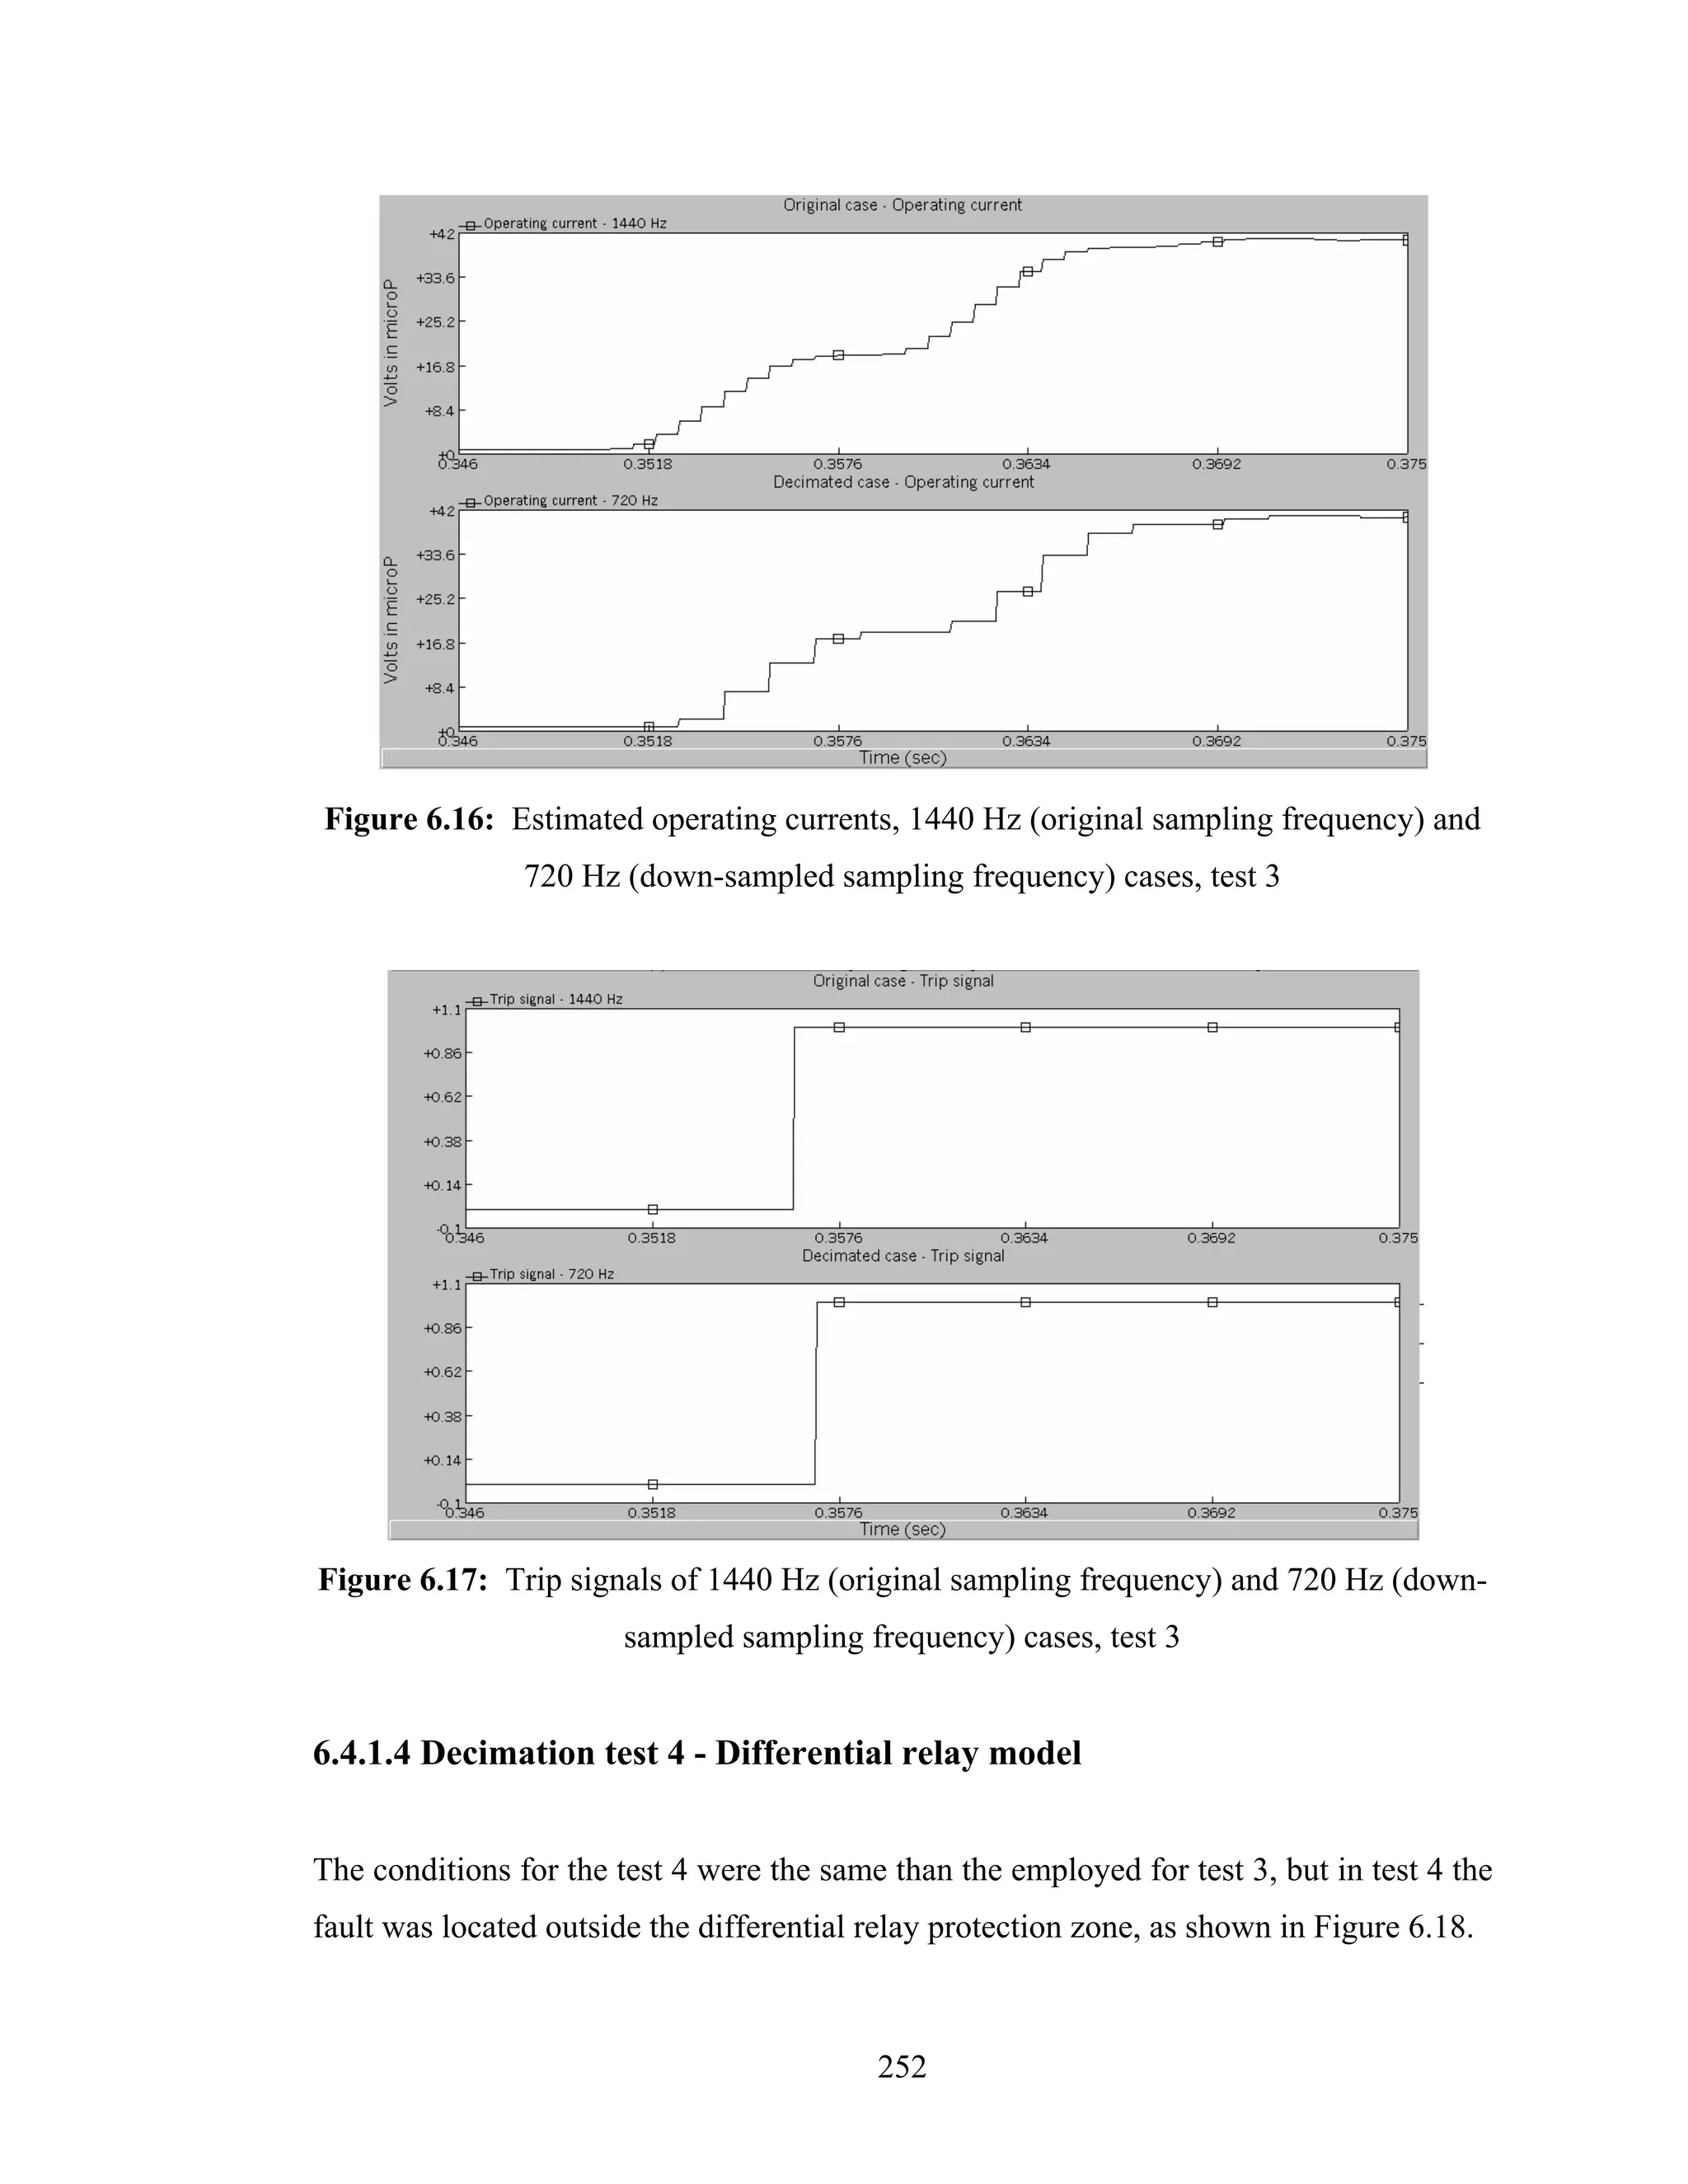
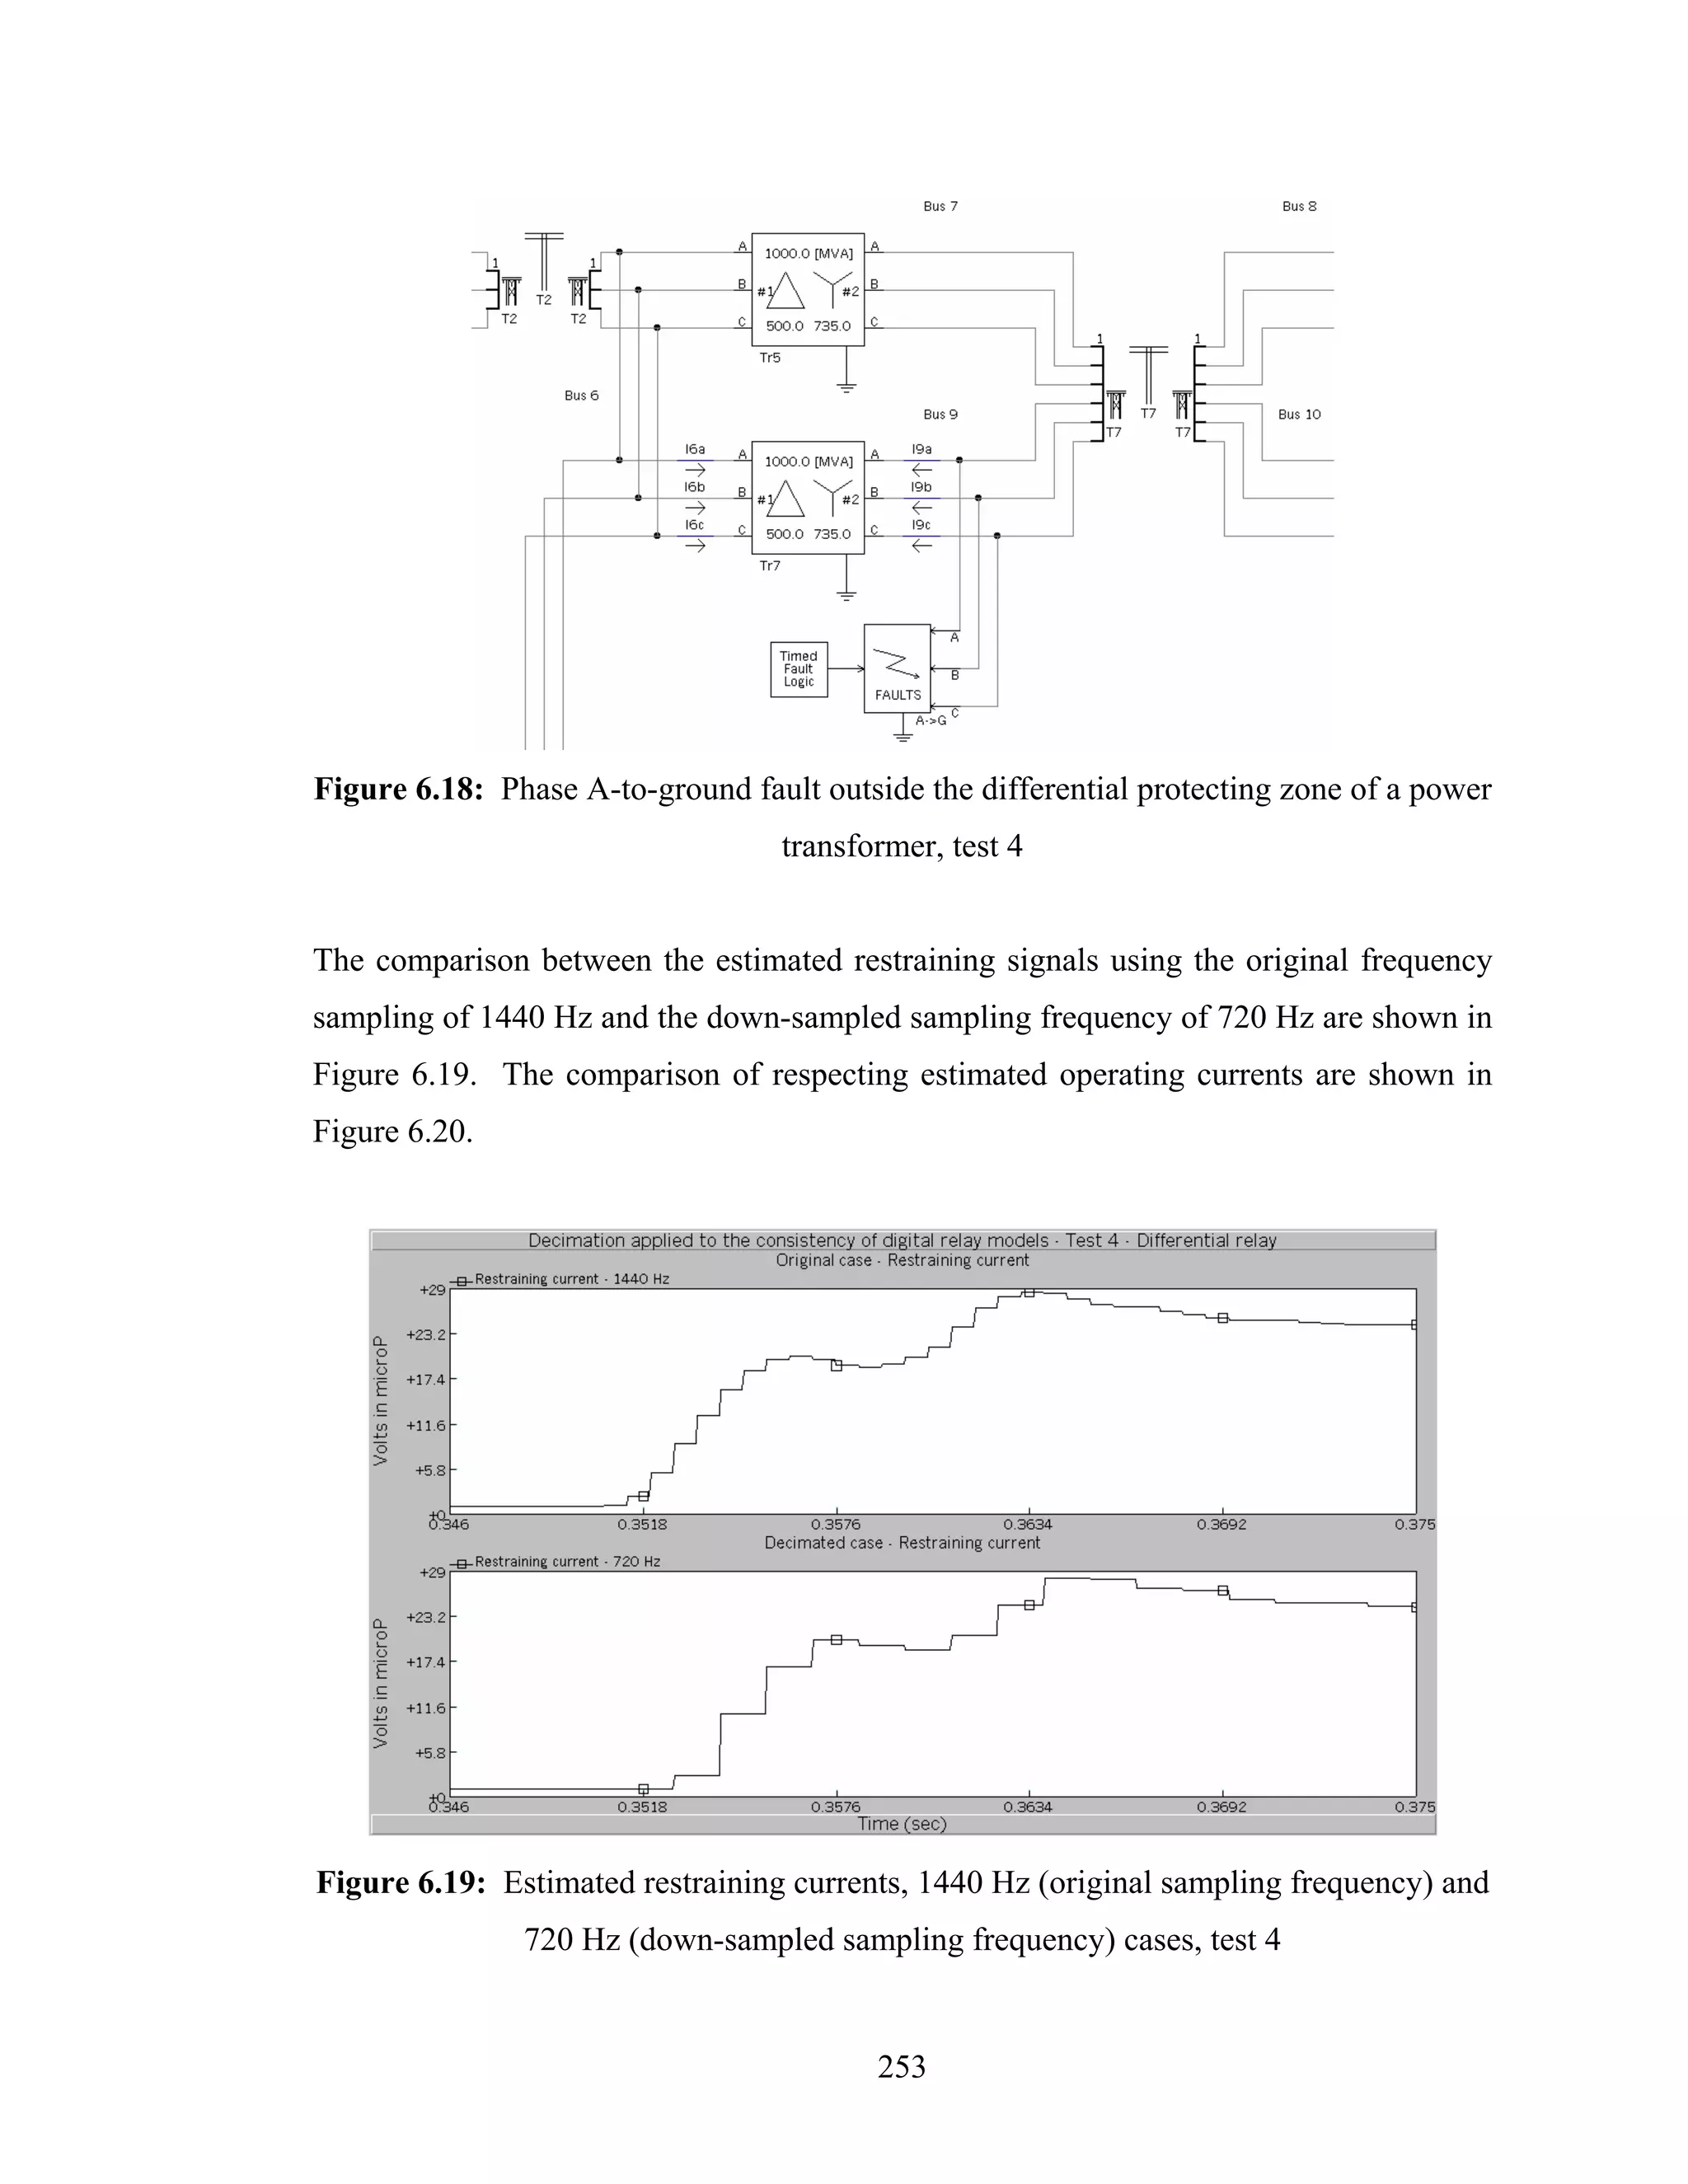
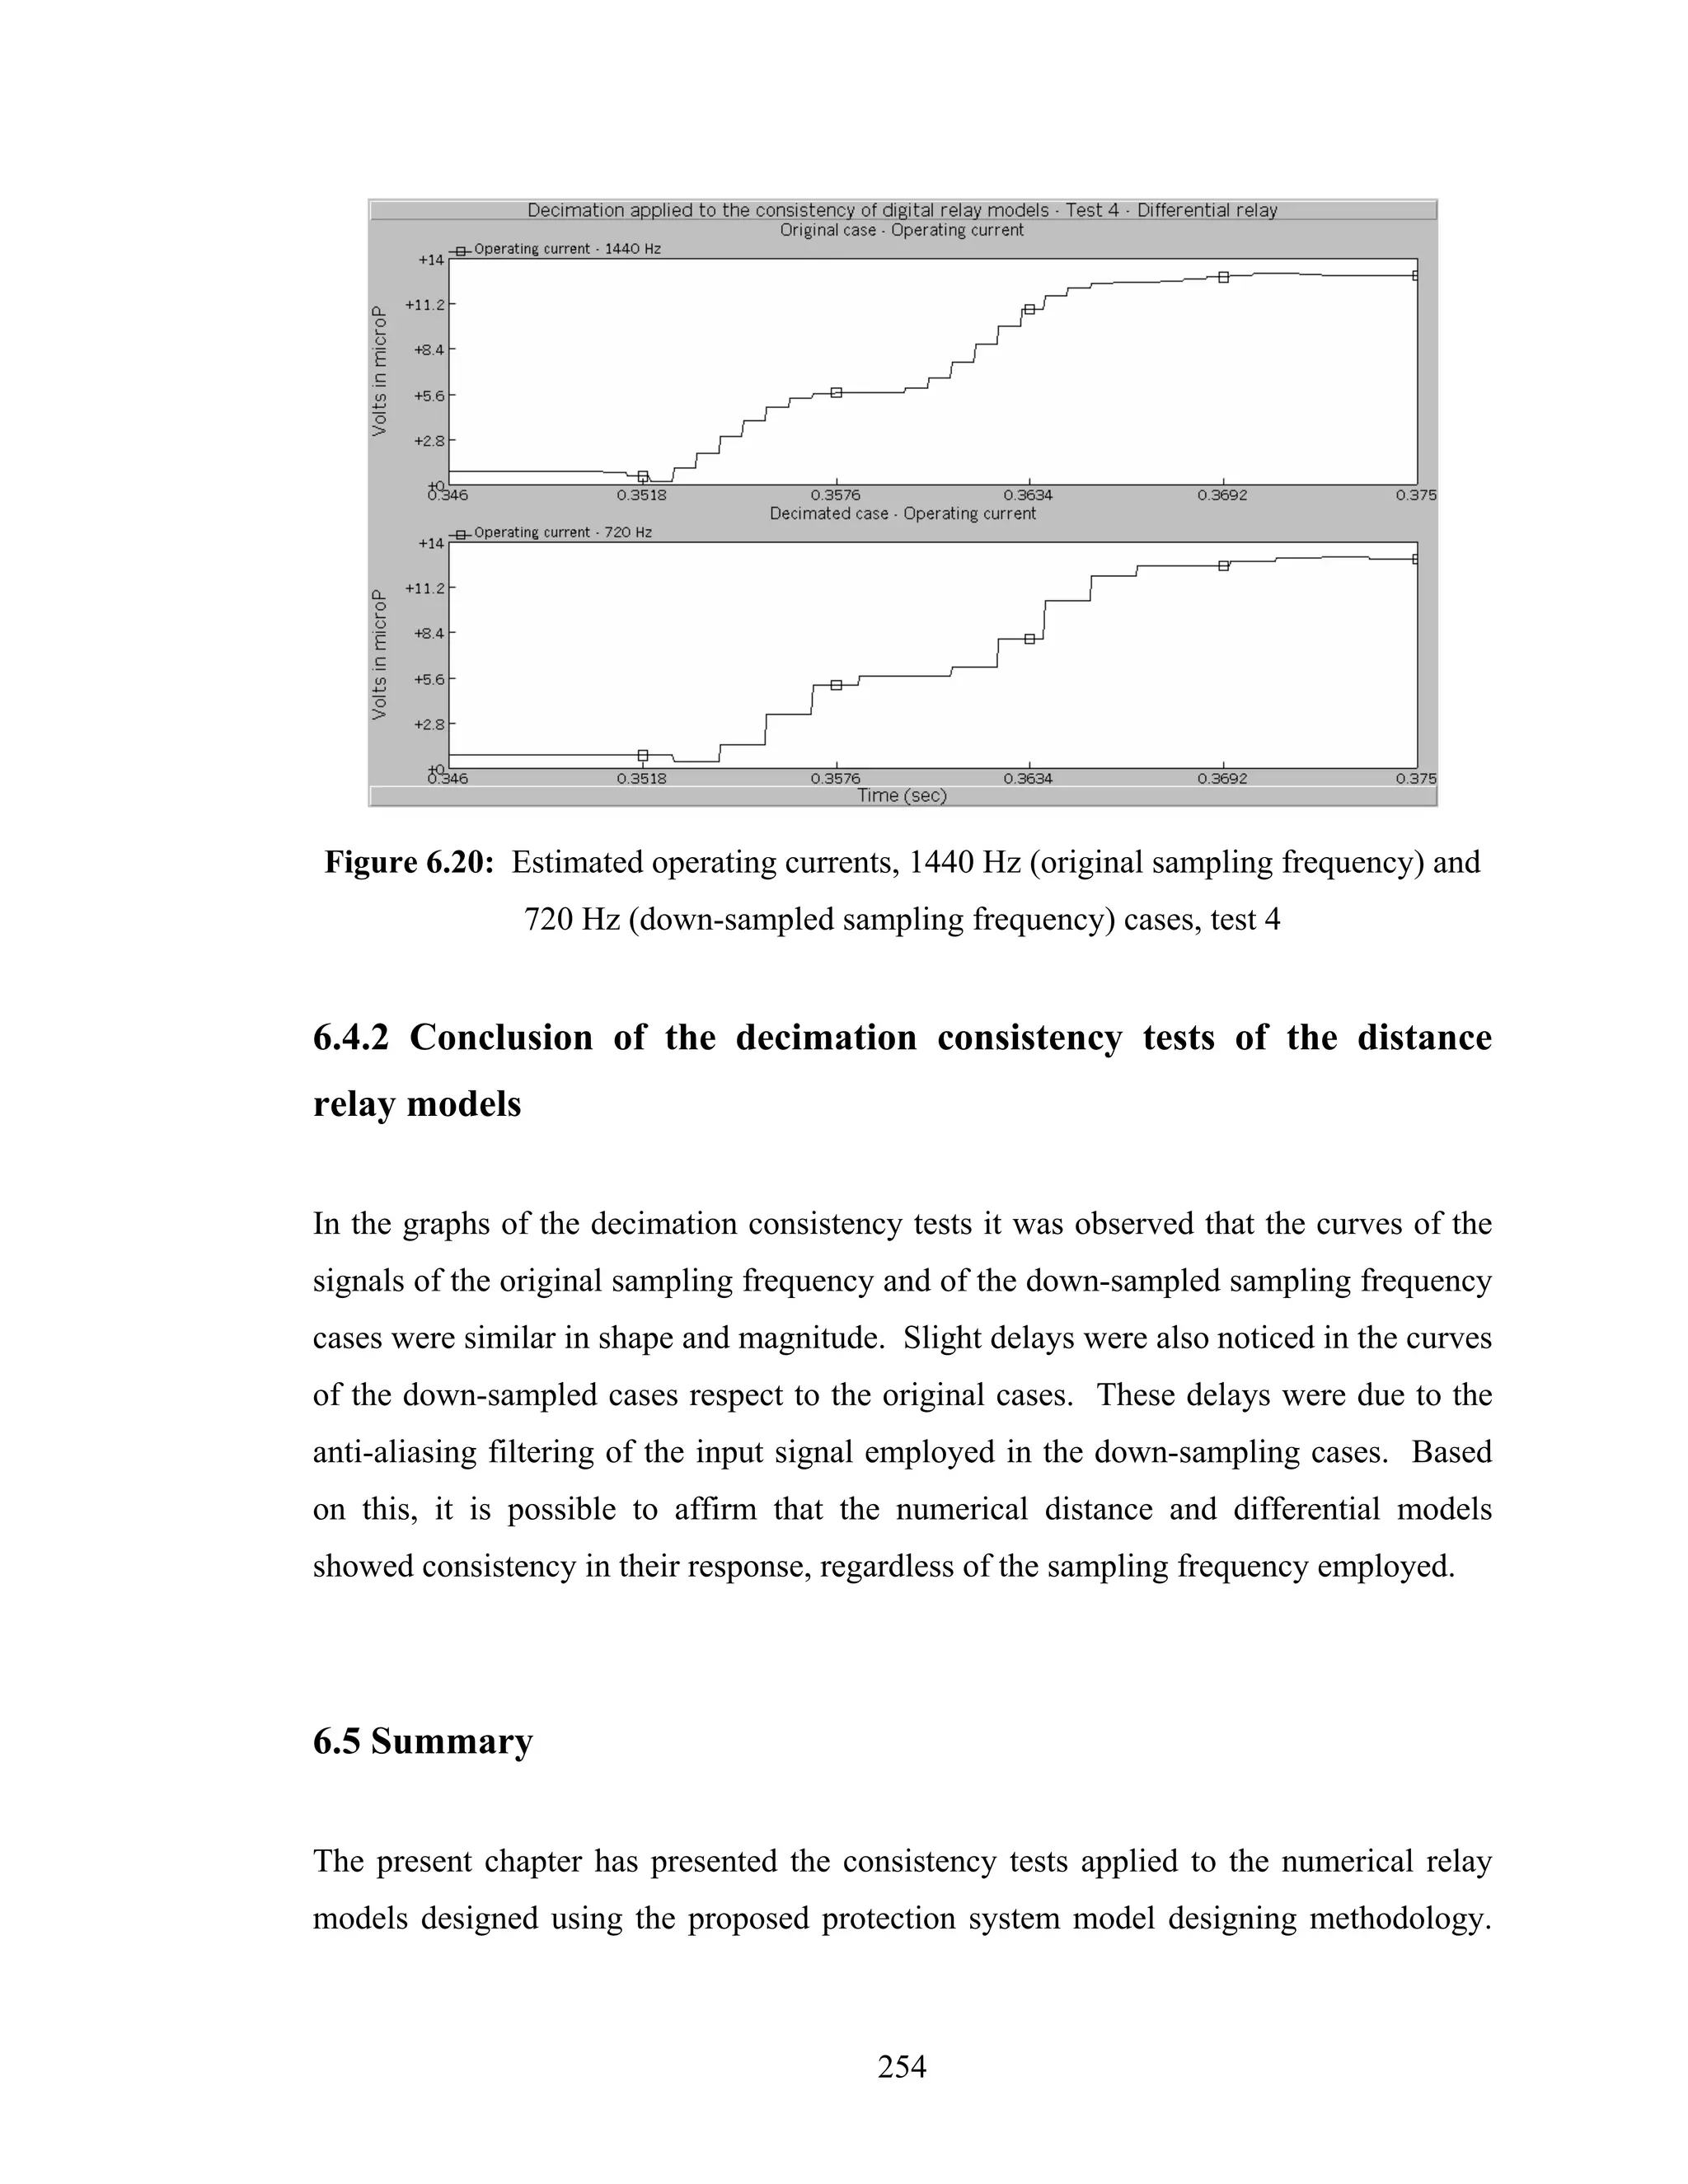
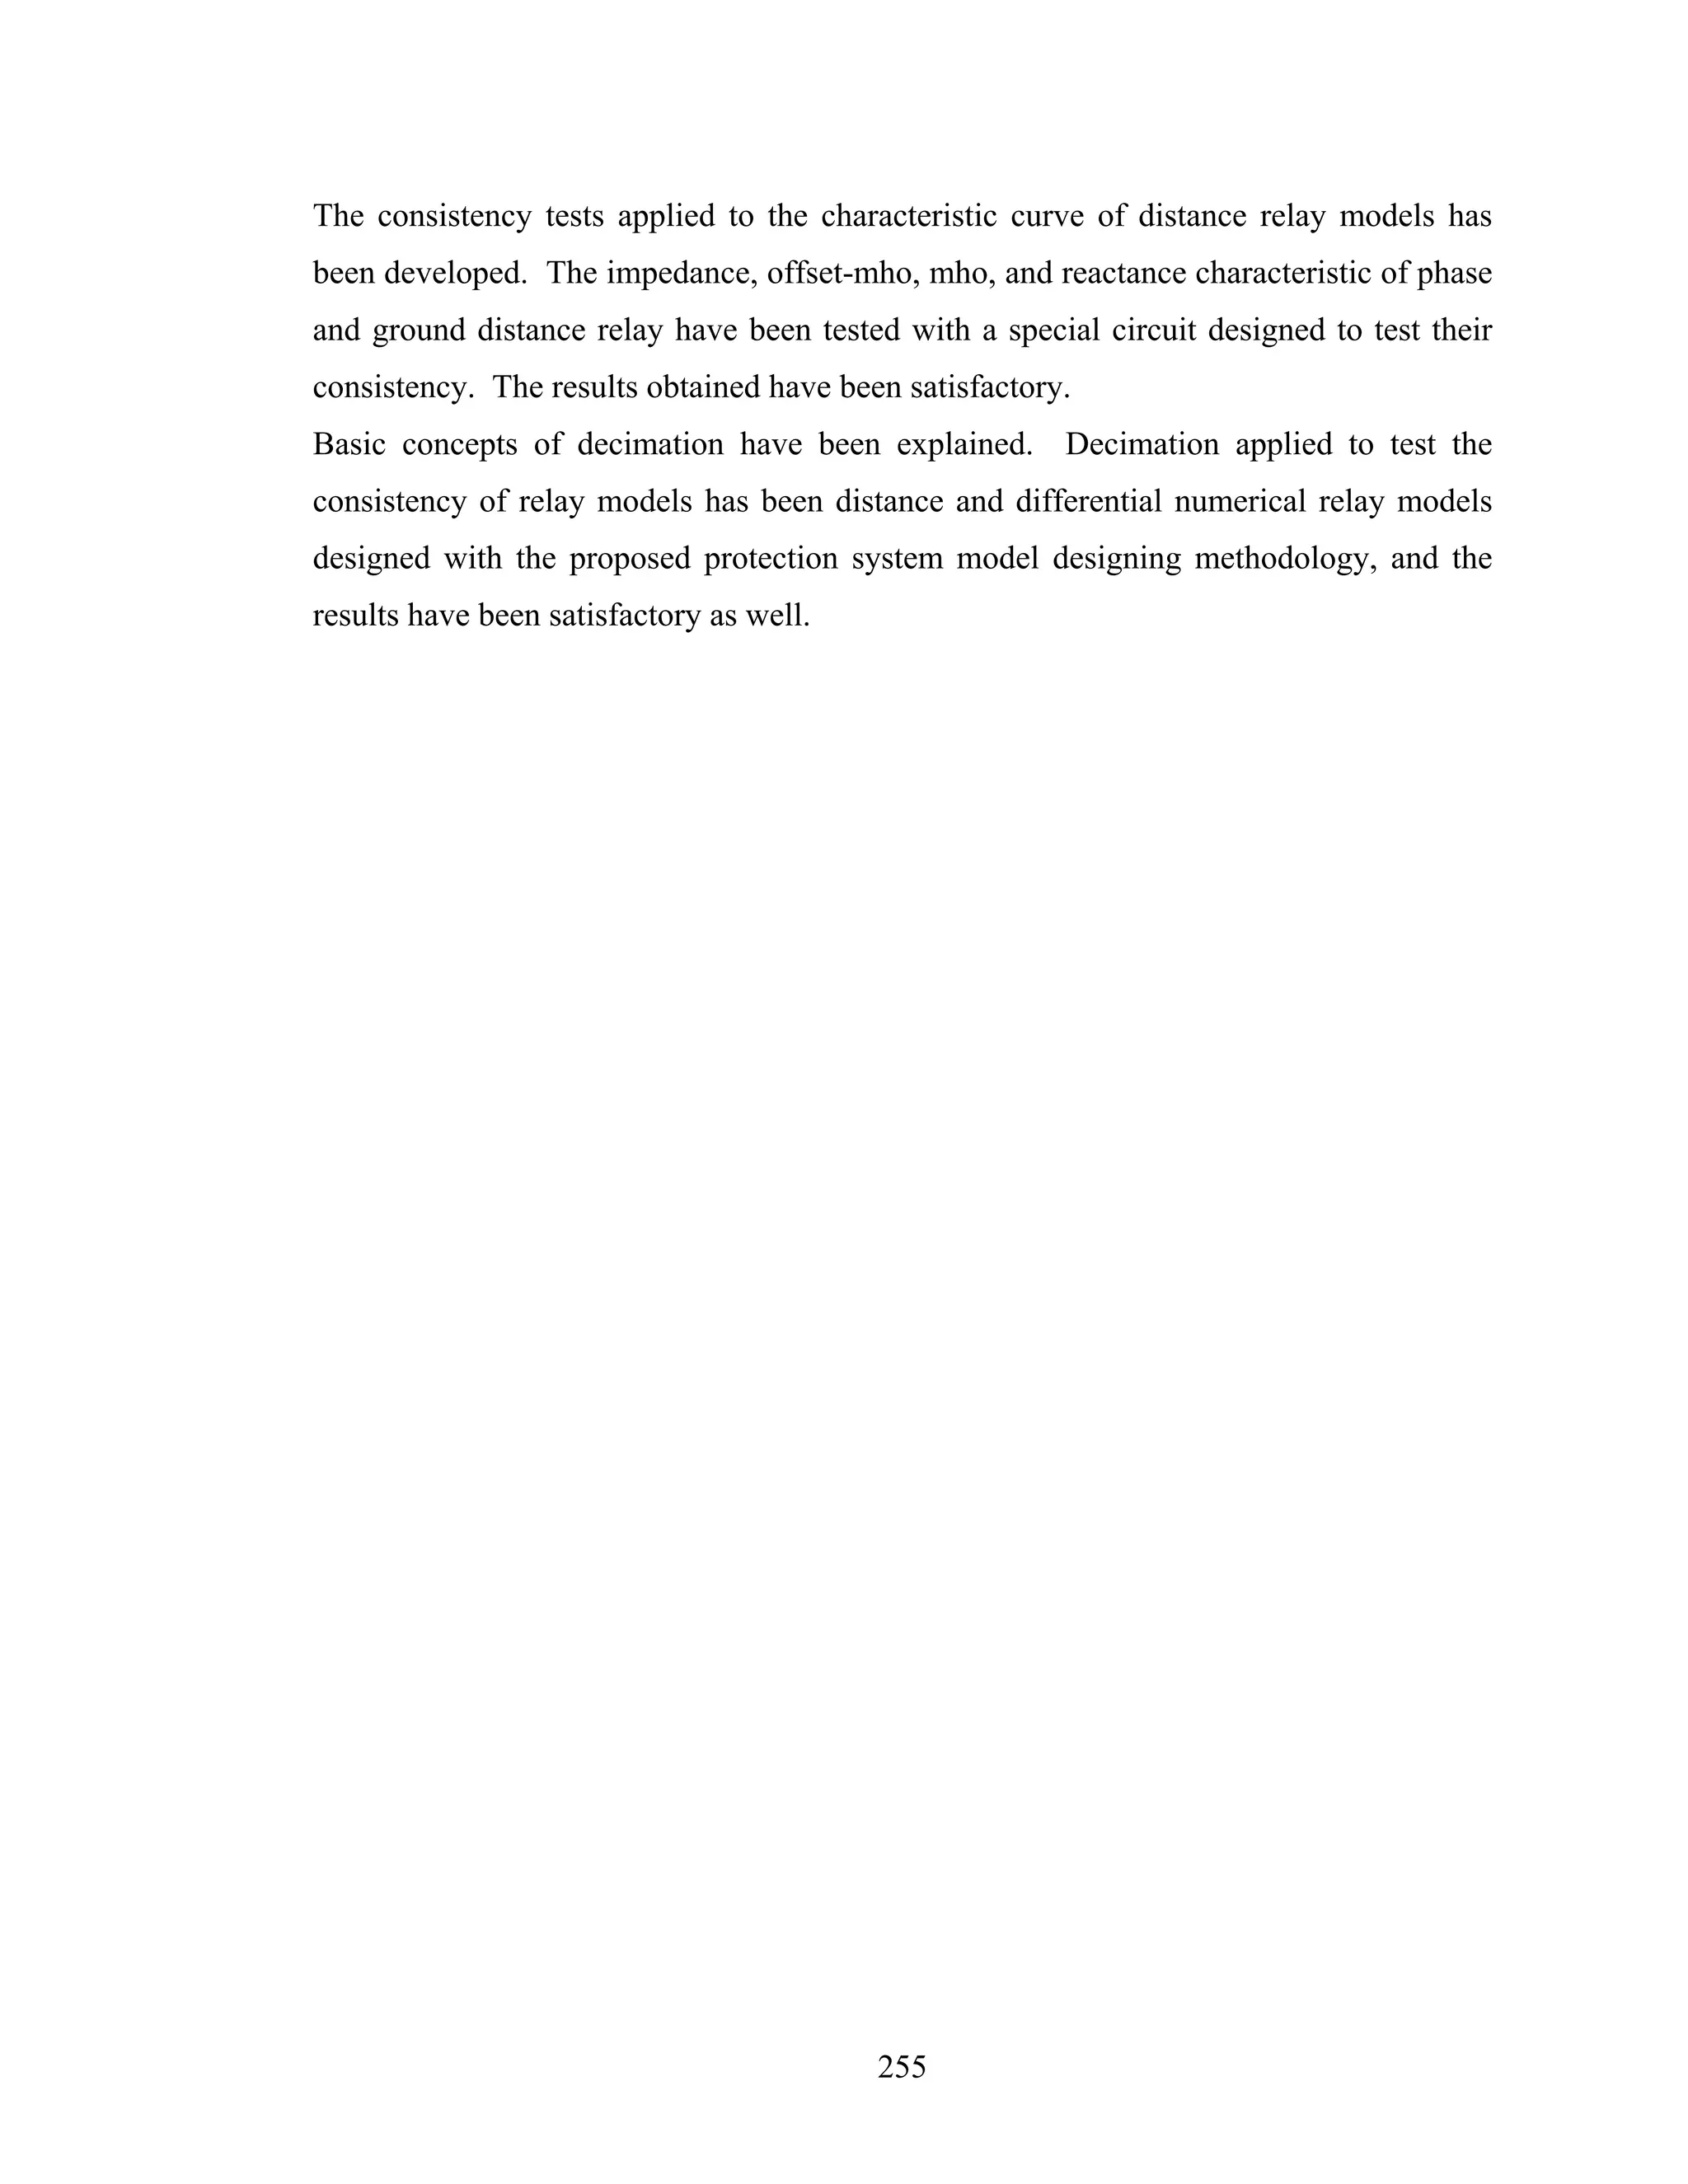
![7. Summary and Conclusions
Electrical power systems are one of the more complex and important systems ever built
by human civilization. The role of electrical power systems in the development,
sustenance and expansion of the economical activity of modern societies is of the first
order of importance. However, power systems sometimes fail due to adverse
environment and aging of equipment. When the failures happen, protection of power
systems acquires a vital significance to minimize the damages and to keep the operation
of the systems safe.
Numerical relays are a result of the application of microprocessor technology in the
protection industry. These relays are in an extensive use in modern protection schemes,
and are also a very active area of research. Modeling of numerical relays provides a
valuable source of information for manufacturers, utility engineers, educators and
trainers.
A literature review has shown that most of the modeling techniques applied to numerical
relays lack automation and generalization. This means that the modeling techniques are
not computer-aided for designing successive relay models. A new modeling process has
to be planned and implemented every time a new relay model has to be produced. Those
techniques that do offer generality in the modeling process [53] employ software that is
not an industry standard. The techniques that model power systems and numerical
relays in the same emtp need to set up a link between the electromagnetic transient
engine and the relay model. To do this, it is necessary to have an in-depth knowledge of
the structure of the emtp. The amount of work that this task takes can be as big as the
modeling process itself.
256](https://image.slidesharecdn.com/phdthesissandroaquiles060724-121017023005-phpapp01/75/Thesis-for-Power-System-protection-in-Brief-291-2048.jpg)
![REFERENCES
[1] A. Guzman, S. Zocholl, G. Benmouyal, and H. J. Altuve, “Performance Analysis
of Traditional and Improved Transformer Differential Protective Relays”, SEL
Technical Papers.
[2] J. Lewis Blackburn, “Protective Relaying,” Marcel Dekker Inc., 1987.
[3] ALSTOM T&D Energy Automation & Information, “Network Protection and
Automation,” First Edition, July 2002.
[4] IEE, “Power System Protection: Volume 1 – Principles and Components”, 2nd
Edition by the Electricity Training Association, London 1995.
[5] B. Kasztenny, A. Kulidjian, B. Campbell, M. Pozzuoli, “Operate and Restraint
Signals of a Transformer Differential Relay”, 54th Annual Georgia Tech
Protective Relaying Conference, May 2000.
[6] W. A. Elmore, “Protective Relaying. Theory and Applications,” Second Edition,
Marcel Dekker Inc., 2004.
[7] L F. Kennedy and C. D. Hayward, “Harmonic-Current-Restrained Relays for
Differential Protection,” AIEE Transactions, Vol. 57, May 1938, pp. 262-266.
[8] C. D. Hayward, “Harmonic-Current-Restrained Relays for Transformer
Differential Protection,” AIEE Transactions, Vol. 60, 1941, pp. 377-382.
[9] C. A. Mathews, “An Improved Transformer Differential Relay,” AIEE
Transactions, Vol. 73, Part III, June 1954, pp. 645-650.
[10] R. L. Sharp and W. E. Glassburn, “A Transformer Differential Relay with Second-
Harmonic Restrain,” AIEE Transactions, Vol. 77, Part III, Dec. 1958, pp. 913-918.
[11] C. H. Einval and J. R. Linders, “A Three-Phase Differential Relay for Transformer
Protection,” IEEE Transactions PAS, Vol. PAS-94, No. 6, Nov/Dec 1975, pp.
1971-1980.
[12] G. Bartula, “Enhanced Transformer Protection through Inrush-Proof Ratio
Differential Relays,” Brown Boveri Review, Vol. 32, 1945, pp. 129-133.
[13] G. D. Rockefeller, “Fault Protection with a Digital Computer,” IEEE Transactions
PAS, Vol. PAS-98, April 1969, pp. 438-464.
261](https://image.slidesharecdn.com/phdthesissandroaquiles060724-121017023005-phpapp01/75/Thesis-for-Power-System-protection-in-Brief-296-2048.jpg)
![[14] A. M. Dmitrenko, “Semiconductor Pulse-Duration Differential Restrain Relay,”
Izvestiya Vysshikh Uchebnykh Zavedenii, Elektromekhanika, No. 3, March 1970,
pp. 335-339 (in Russian).
[15] A. Giuliante and G. Clough, “Advances in the Design of Differential Protection for
Power Transformers,” 1991 Georgia Tech. Protective Relaying Conference,
Atlanta, GA, May 1-3, 1991, pp. 1-12.
[16] M. Hegazy, “New Principle for Using Full-Wave Rectifiers in Differential
Protection of Transformers,” IEE Proceedings, Vol. 116, March 1969, pp. 425-
428.
[17] A. M. Dimitrenko, “The Use of Currentless Pause for Detuning Differential
Protection from Transient Imbalances Currents,” Elektrichestvo, No. 1, January
1979, pp. 55-58 (in Russian)
[18] E. L. Michelson, “Rectifier Relay for Transformer Protection,” AIEE Transactions,
Vol. 64, May 1945, pp. 252-254.
[19] E. V. Podgornyi and E. M. Ulianitskii, “A Comparison of Principles for Detuning
Differential Relays from Transformer Inrush Currents,” Elektrichestvo, No. 10,
October 1969, pp. 26-32 (in Russian).
[20] S. B. Wilkinson, Transformer Differential Relay, U. S. Patent No. 5627712, May
6th, 1997.
[21] Mason C. Russell, “The Art and Science of Protective Relaying,” New York
Wiley, 1956.
[22] M.S. Sachdev, M. Nagpal, and T. Adu, "Interactive Software for Evaluating and
Teaching Digital Relaying Algorithms", IEEE Transactions on Power Systems,
Vol. 5, No. 1, February 1990, pp. 346-352
[23] T. S. Sidhu, M. Hfuda and M. S. Sachdev, “Generating Relay Models for
Protection Studies”, IEEE Computer Applications in Power, Vol. 11, No. 4, 1998,
pp. 33-38
[24] M. S. Sachdev (Coordinator) et al, "Advancements in Microprocessor Based
Protection and Communication", 1997, A tutorial publication of the IEEE,
Piscataway, NJ: IEEE Cat. No. 97TP120-0, pp. 127
262](https://image.slidesharecdn.com/phdthesissandroaquiles060724-121017023005-phpapp01/75/Thesis-for-Power-System-protection-in-Brief-297-2048.jpg)
![[25] P. G. McLaren, K. Mustaphi, G. Benmouyal, S. Chano, A. Girgis, C. Henville, M.
Kezunovic, L. Kojovic, R. Marttila, M. Meisinger, G. Michel, M. S. Sachdev, V.
Skendzic, T. S. Sidhu, and D. Tziouvaras, “ Software Models for Relays”, IEEE
Transactions on Power Delivery, Vol. 16, No. 12, April 2001, pp. 238-45,
[26] Canadian/American EMTP users Group, Alternative Transient Program (ATP)-
Rule book, Portland, Oregon, 1992
[27] A.K.S. Chaudhary, Kwa-sur Tam, and A. G.Phadke, “Protection System
Representation in the Electromagnetic Transient Program,” IEEE Transactions on
Power Delivery, Vol. 9, No. 2, April 1994, pp. 700-711
[28] J. Mahseredjian, G. Benmouyal, X. Lombard, M. Zouiti, B. Bressac, and L. Gérin-
Lajoie, “ A link between EMTP and MATLAB for user-defined modeling,” IEEE
Transactions on Power Delivery, Vol. 13, Issue 2, April 1998, pp. 667-674
[29] Kesunovic M., and Chen Q., “A novel approach for interactive protective system
simulation,” IEEE Trans. on Power Systems, vol. 12, no. 2, pp. 668-694, Apr. 1997
[30] M. Gole. and A. Daneshpooy, “Towards Open Systems: A PSCAD/EMTDC to
MATLAB Interface," International Conference on Power Systems Transients
(IPST97), Seattle, June22-26, 1997., pp. 145-149
[31] P. G. McLaren, G. W. Swift, A. Neufeld, Z. Zhang, E. Dirks, M. Haywood, “Open
System Relaying,” IEEE Trans. on Power Delivery, Vol. 9, no. 3, July 1994.
[32] IEEE Standard Dictionary of Electrical and Electronics Terms, IEEE, Wiley
Interscience, 1972
[33] M. S. Sachdev -Course Coordinator-, Microprocessor Relay and Protection
System, IEEE Tutorial Course, Piscataway, NJ: IEEE Cat. No 88EH0269-1-PWR.
[34] B. Porat, A Course in Digital Signal Processing, John Wiley and Sons Inc., 1997.
[35] B. P. Lathi., Signal Processing and Linear Systems, Berkeley-Cambridge Press,
Carmichael California, 1998.
[36] T. W. Parks, C. S. Burrus, Digital Filter Design, John Wiley & Sons, Inc., 1987.
[37] R. C. Jaeger, “Tutorial: Analog Data Acquisition Technology,” IEEE Micro,
February 1982.
263](https://image.slidesharecdn.com/phdthesissandroaquiles060724-121017023005-phpapp01/75/Thesis-for-Power-System-protection-in-Brief-298-2048.jpg)
![[38] G. Benmouyal, “Removal of DC-offset in current waveform using digital mimic
filtering," IEEE Transactions on Power Delivery, Vol. 10, No. 2, pp. 621-628,
April 1995.
[39] V. Cook, Analysis of Distance Protection, Research Studies Press, John Wiley and
Sons, 1985.
[40] G. Ziegler, Numerical Distance Protection, Siemens AG, Berlin and Munich, 1999.
[41] J. G. Andrichak, G. E. Alexander, “Distance Relay Fundamentals,” General
Electric Co Technical Papers.
[42] H. W. Dommel, “Digital Computer Solution of Electromagnetic Transient in
Single- and Multiphase Networks,” IEEE Transactions on Power Apparatus and
Systems, Vol. PAS-88, No. 4, April 1969.
[43] H. Dommel, “EMTP Reference Manual,” Bonneville Power Administration 1986.
[44] Introduction to PSCAD/EMTDC V3, Manitoba HVDC Research Centre Inc.,
Canada, 2000.
[45] J. Singh, M. S. Sachdev, R. J. Fleming, E. Krause, “Digital IDTM Overcurrent
Relays,” Proceedings of IEE 1980 DPSP Conference, IEE Publication No. 185, pp.
84-87.
[46] E. O. Schweitzer and A. Aliaga, “Digital Programmable Time-Parameter Relay
Offers Versatility and Accuracy,” IEEE Transactions on Power Apparatus and
Systems, Vol. PAS-89, No. 1, pp. 152-157, Jan./Feb. 1980.
[47] Z. Peng, M. S. Li, C. Y. Wu, T. C. Cheng, and T. S. Ning, “A dynamic State Space
Model of a Mho Distance Relay,” IEEE Transactions on Power Apparatus and
Systems, Vol. PAS-104, No. 12, December 1985.
[48] R. E. Wilson, J. M. Nordstrom, “EMTP Transient Modeling of a Distance Relay
and a Comparison with EMTP Laboratory Testing,” IEEE Transactions on Power
Delivery, Vol. 8, No. 3, July 1993.
[49] Chul-Hwan Kim, Myung-Hee Lee, R. K. Aggarwal, A. T. Johns, “Educational Use
of EMTP MODELS for the Study of a Distance Relay Algorithm for Protecting
Transmission Lines,” IEEE Transactions on Power Systems, Vol. 15, No. 1,
February 2000.
264](https://image.slidesharecdn.com/phdthesissandroaquiles060724-121017023005-phpapp01/75/Thesis-for-Power-System-protection-in-Brief-299-2048.jpg)
![[50] Westinghouse Electric Corporation, “Relaying Current Transformer Application
Guide,” Industrial and Commercial Power System Applications Series, July 1986.
[51] MATLAB, High-Performance Numeric Computation and Visualization Software.
External Interface Guide, January 1993. The MathWorks, Inc.
[52] The Institute of Electrical and Electronics Engineers, Inc., “IEEE Standard
Requirements for Instrument Transformer, ANSI/IEEE C57.13-1978,” June 1986.
[53] M. Kezunovic, B. Kasztenny, “New SIMULINK Libraries for Modeling Digital
Protective Relays and Evaluating Their Performance Under Fault Transients”,
Proceedings of the International Conference on Power System Transients IPST
'99. Budapest, Hungary. June 1999.
[54] MATLAB 6.1, Reference Manual, MathWorks, Inc. 2001.
[55] SIMULINK 4.1, Reference Manual, MathWorks, Inc. 2001.
[56] Power System Block Set, Reference Manual, MathWorks, Inc. 2001.
[57] A. M. Gole, A. Daneshpooy, “Towards Open Systems: A PSCAD/EMTDC to
MATLAB Interface,” Proceedings of the International Conference on Power
System Transients IPST '97. Seattle, USA. June 1997.
[58] R. W. Wall, B. K. Johnson, “Using TACS Functions within EMTP to Teach
Protective Relaying Fundamentals,” IEEE Transactions on Power Systems, Vol.
12, No. 1, February 1997.
[59] P. G. McLaren, G. W. Swift, Z. Zhang, E. Dirks, R. P. Jayasinghe, and I.
Fernando, “A New Directional Element for Numerical Distance Relays,” IEEE
Transactions on Power Delivery, Vol. 10, No. 2, April 1995.
[60] G. E. Alexander, J. G. Andrichak, “Ground Distance Relaying: Problems and
Principles,” Nineteenth Annual Western Protective Relay Conference, Washington,
October 1991.
265](https://image.slidesharecdn.com/phdthesissandroaquiles060724-121017023005-phpapp01/75/Thesis-for-Power-System-protection-in-Brief-300-2048.jpg)
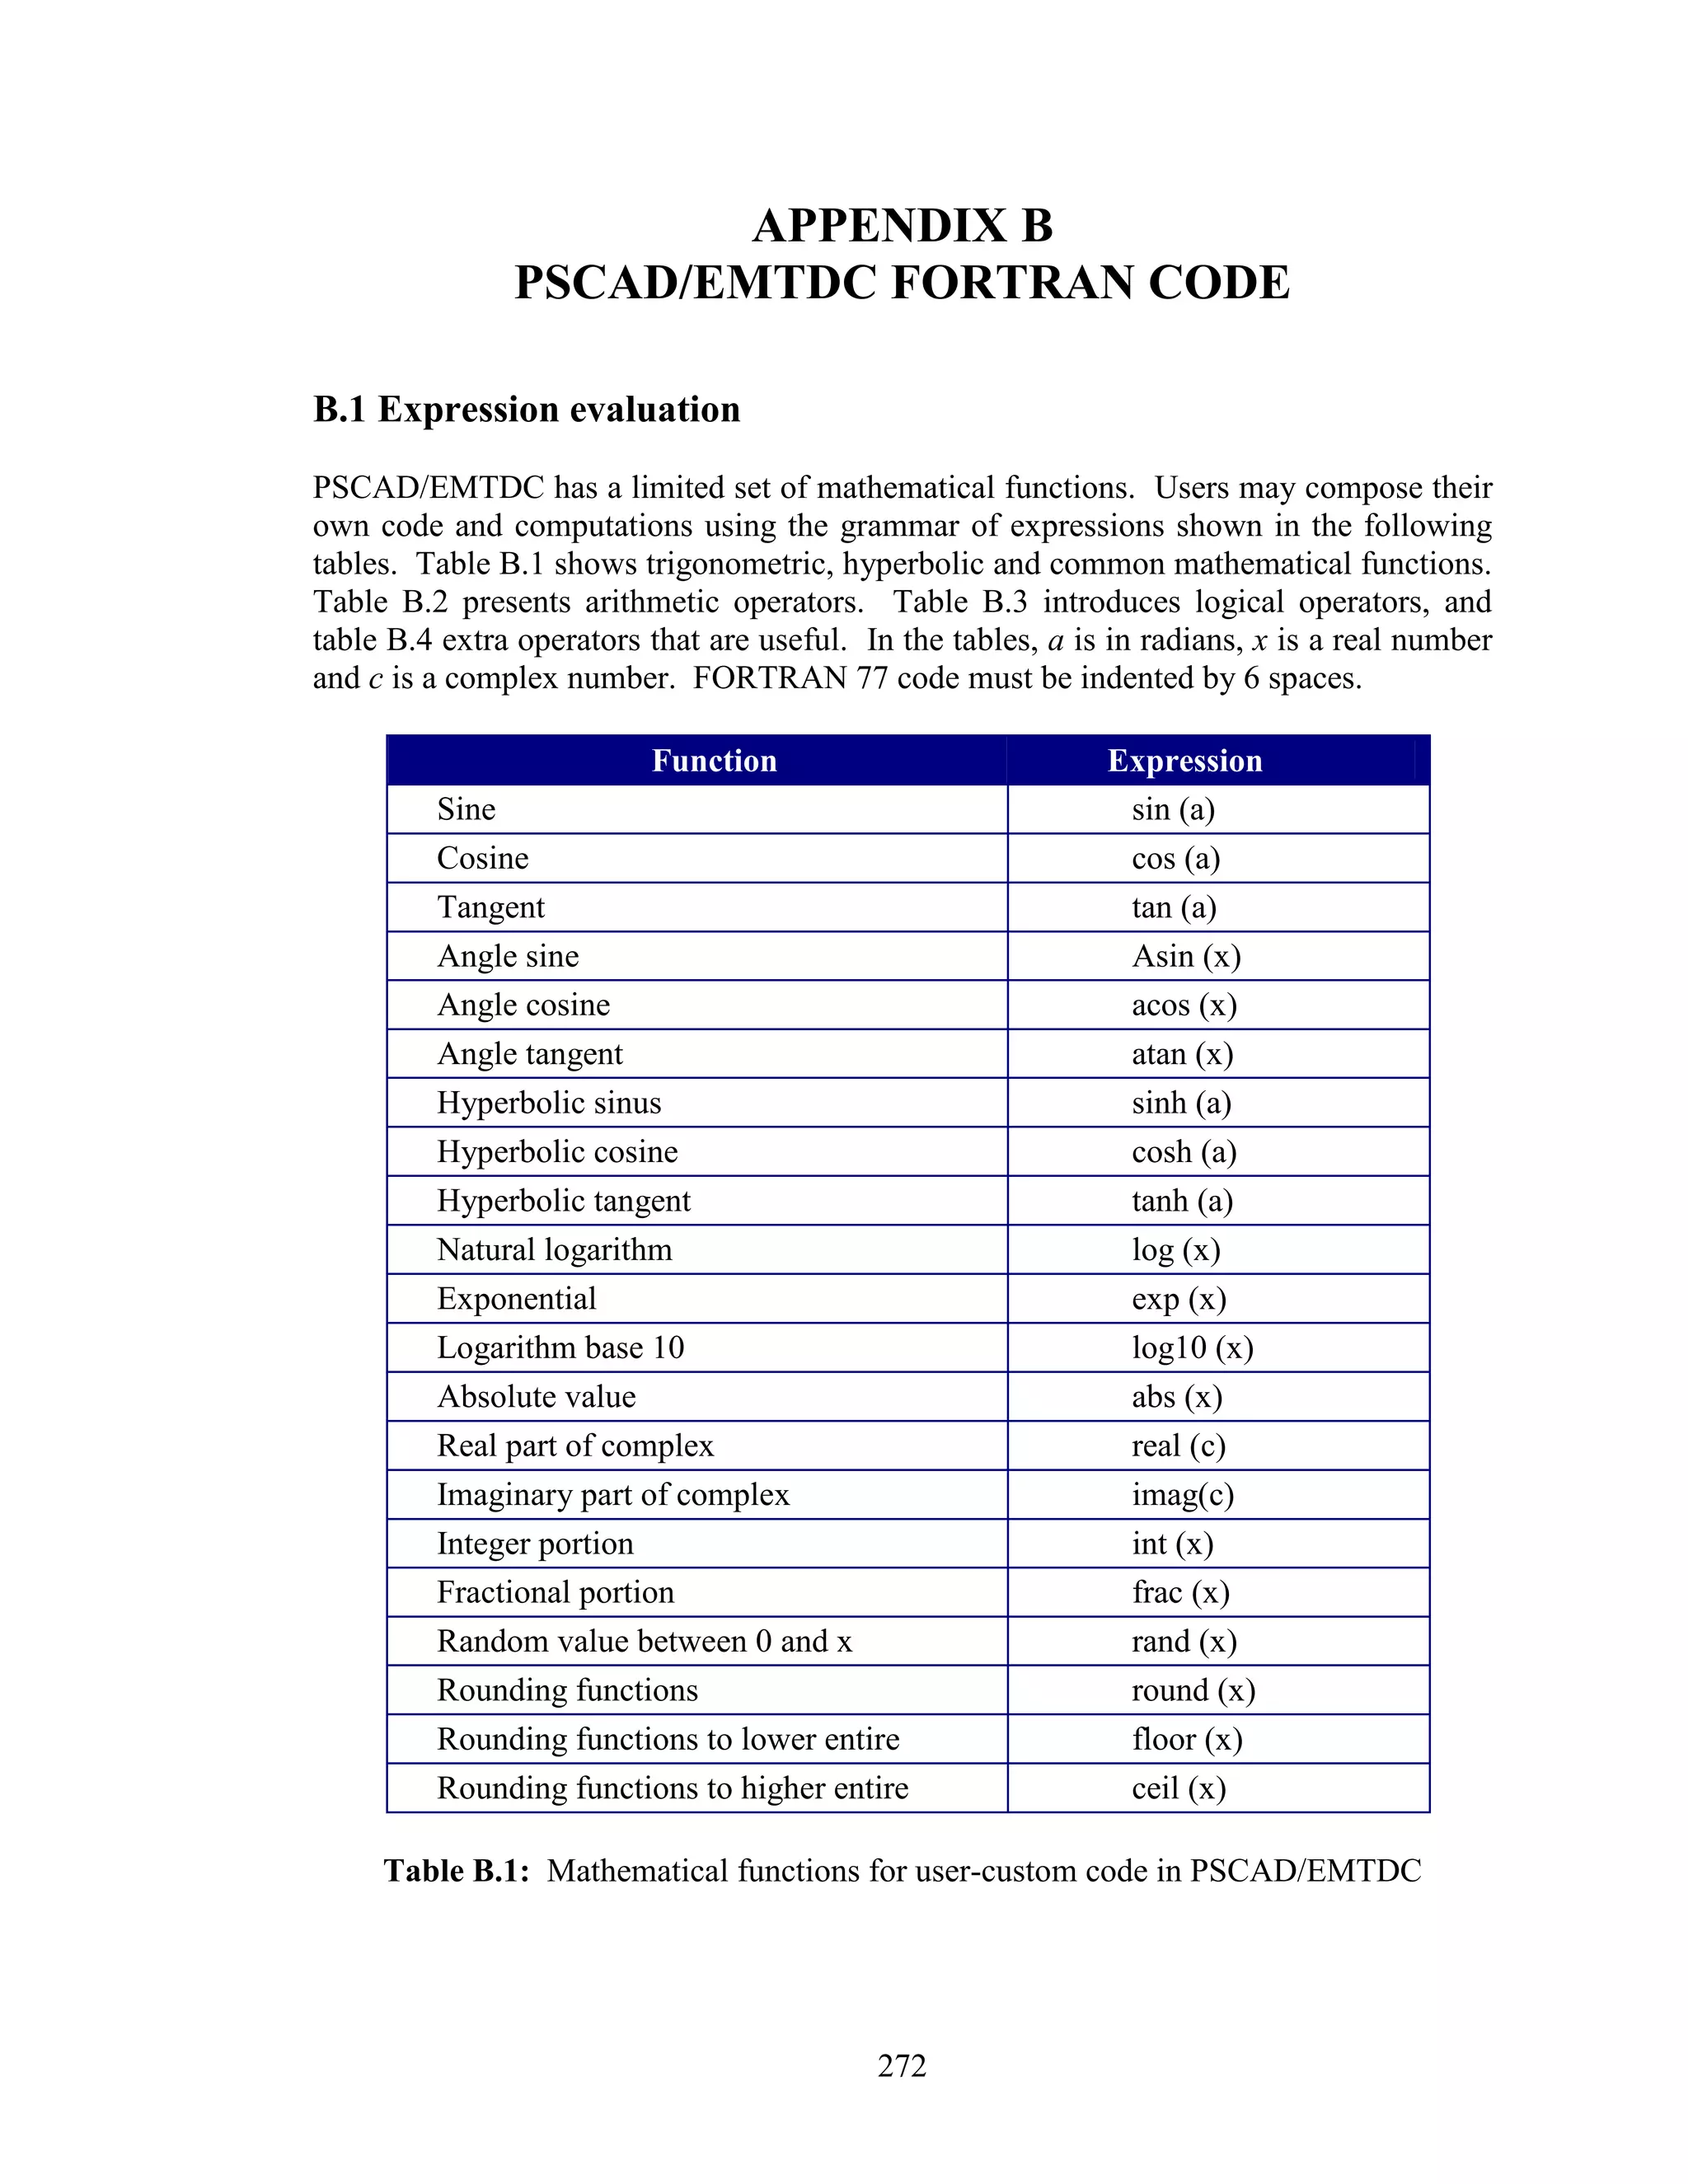
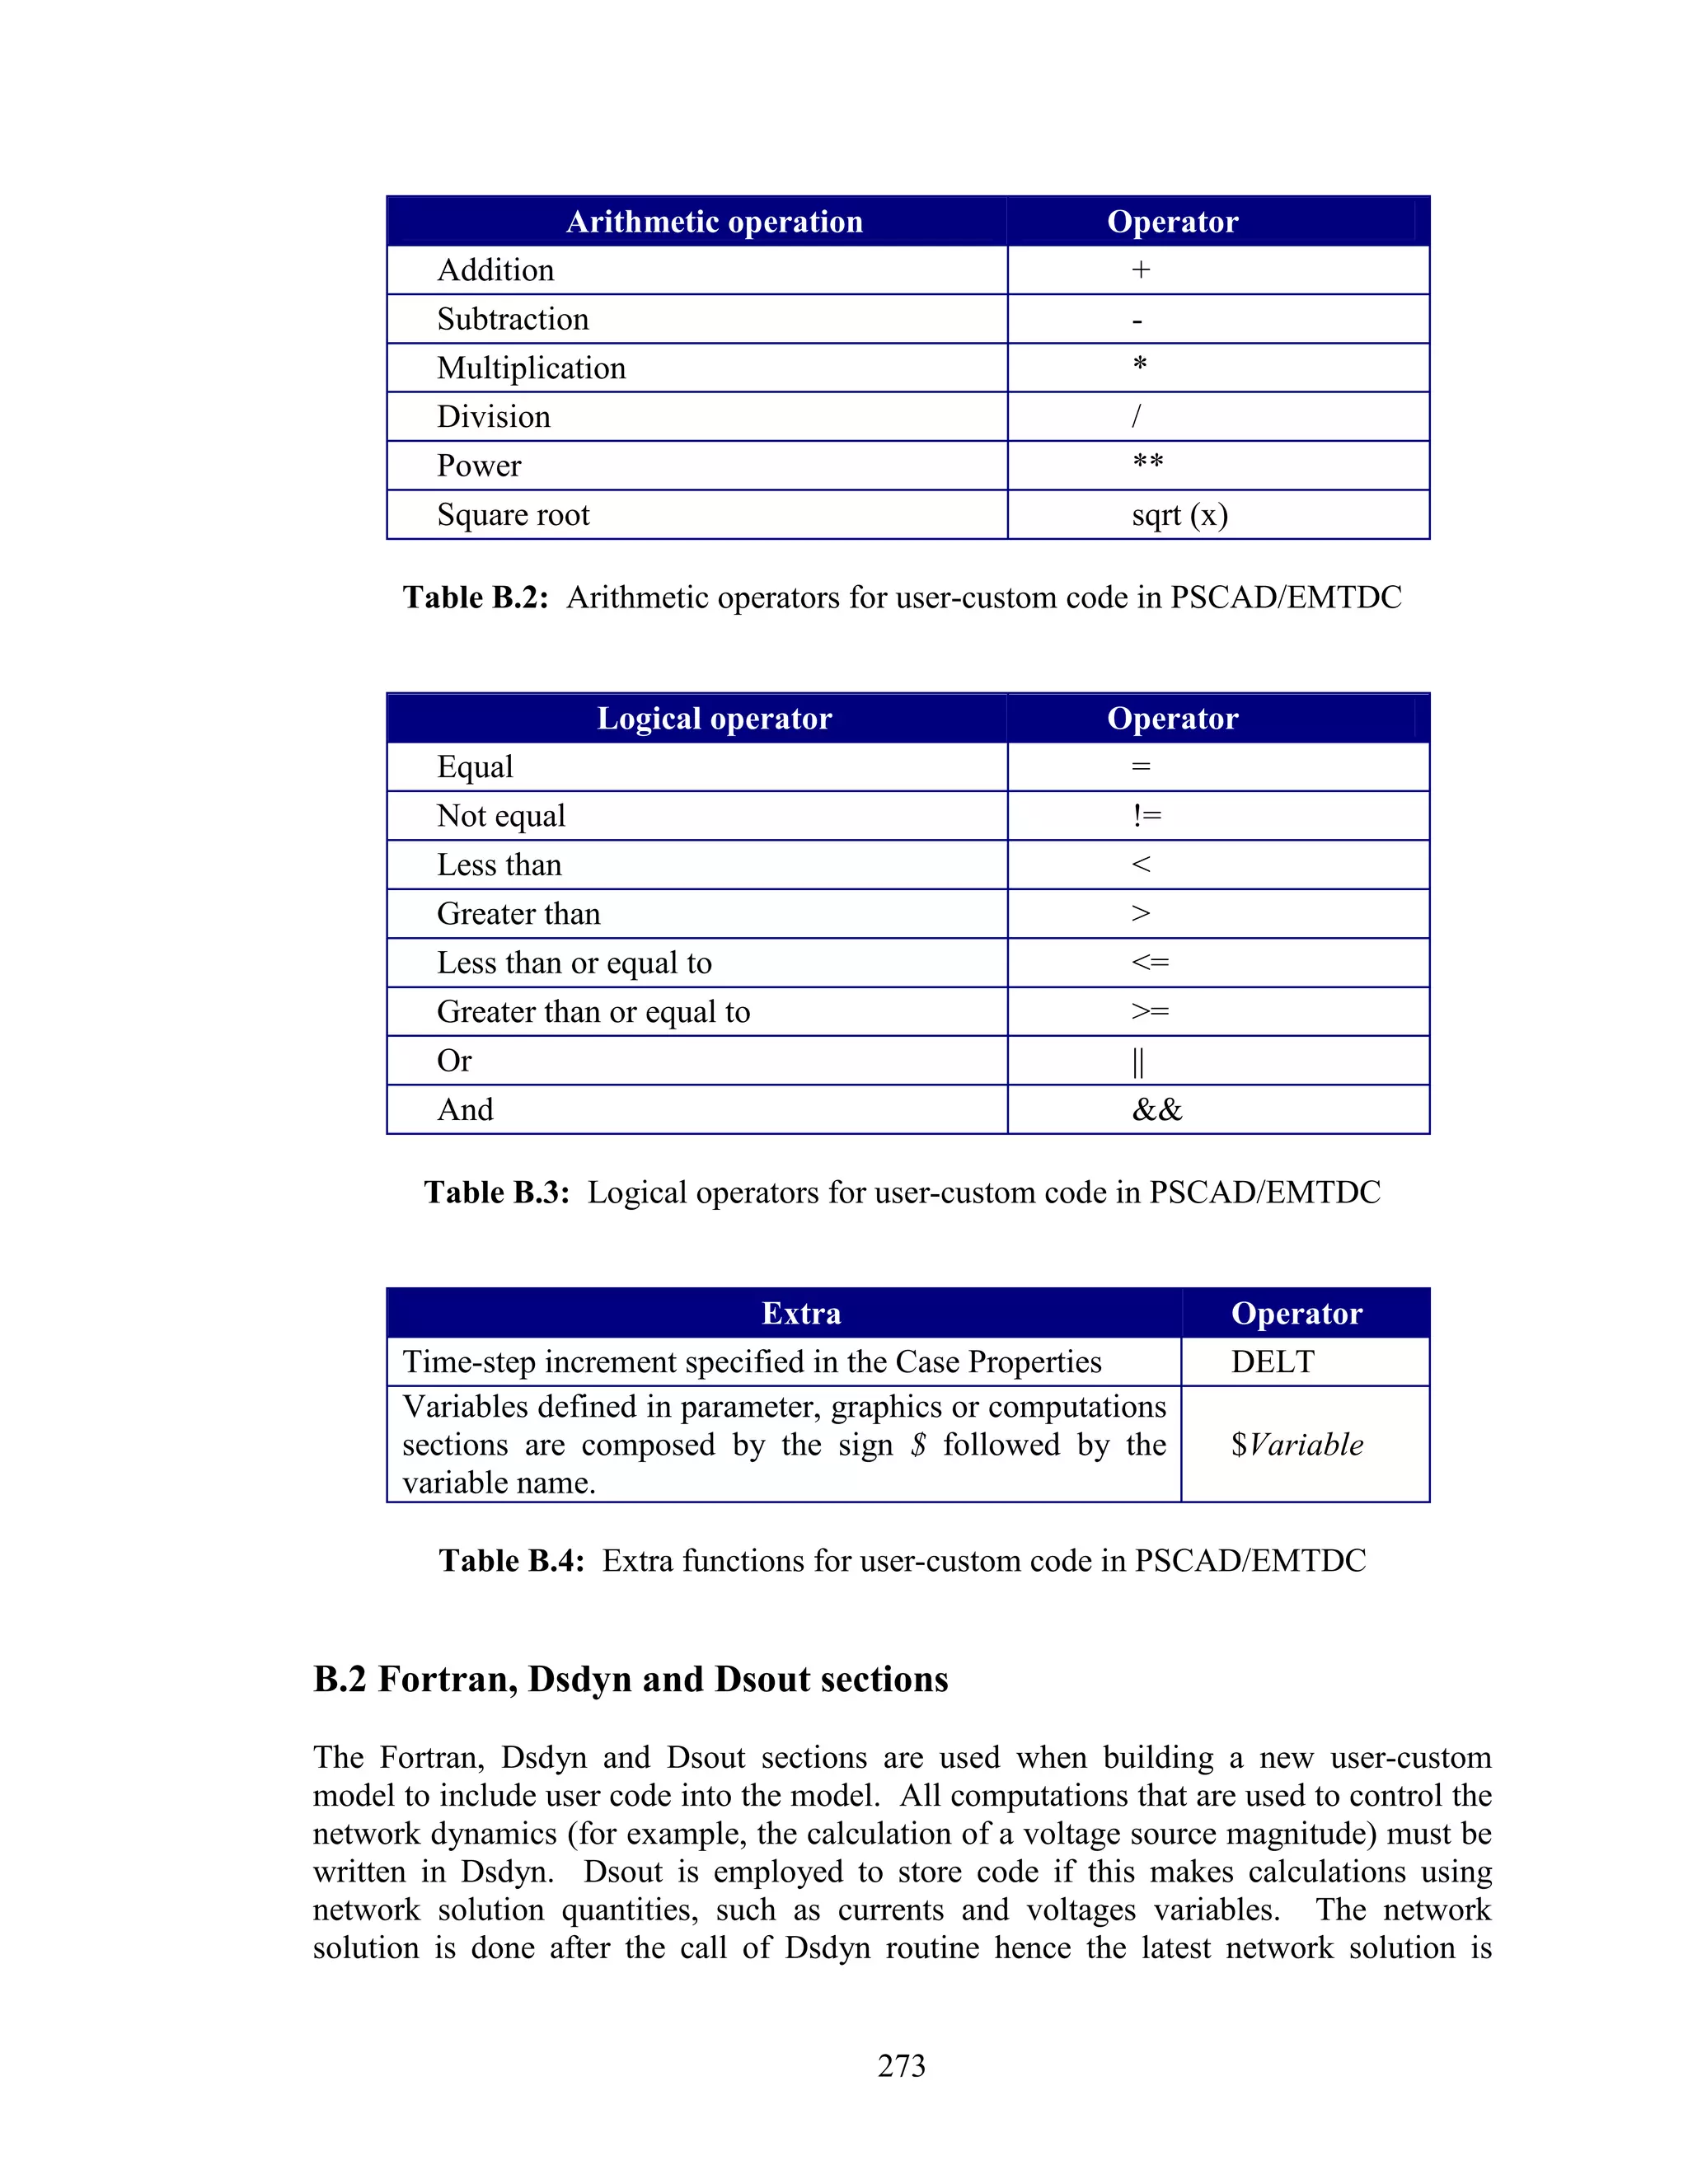
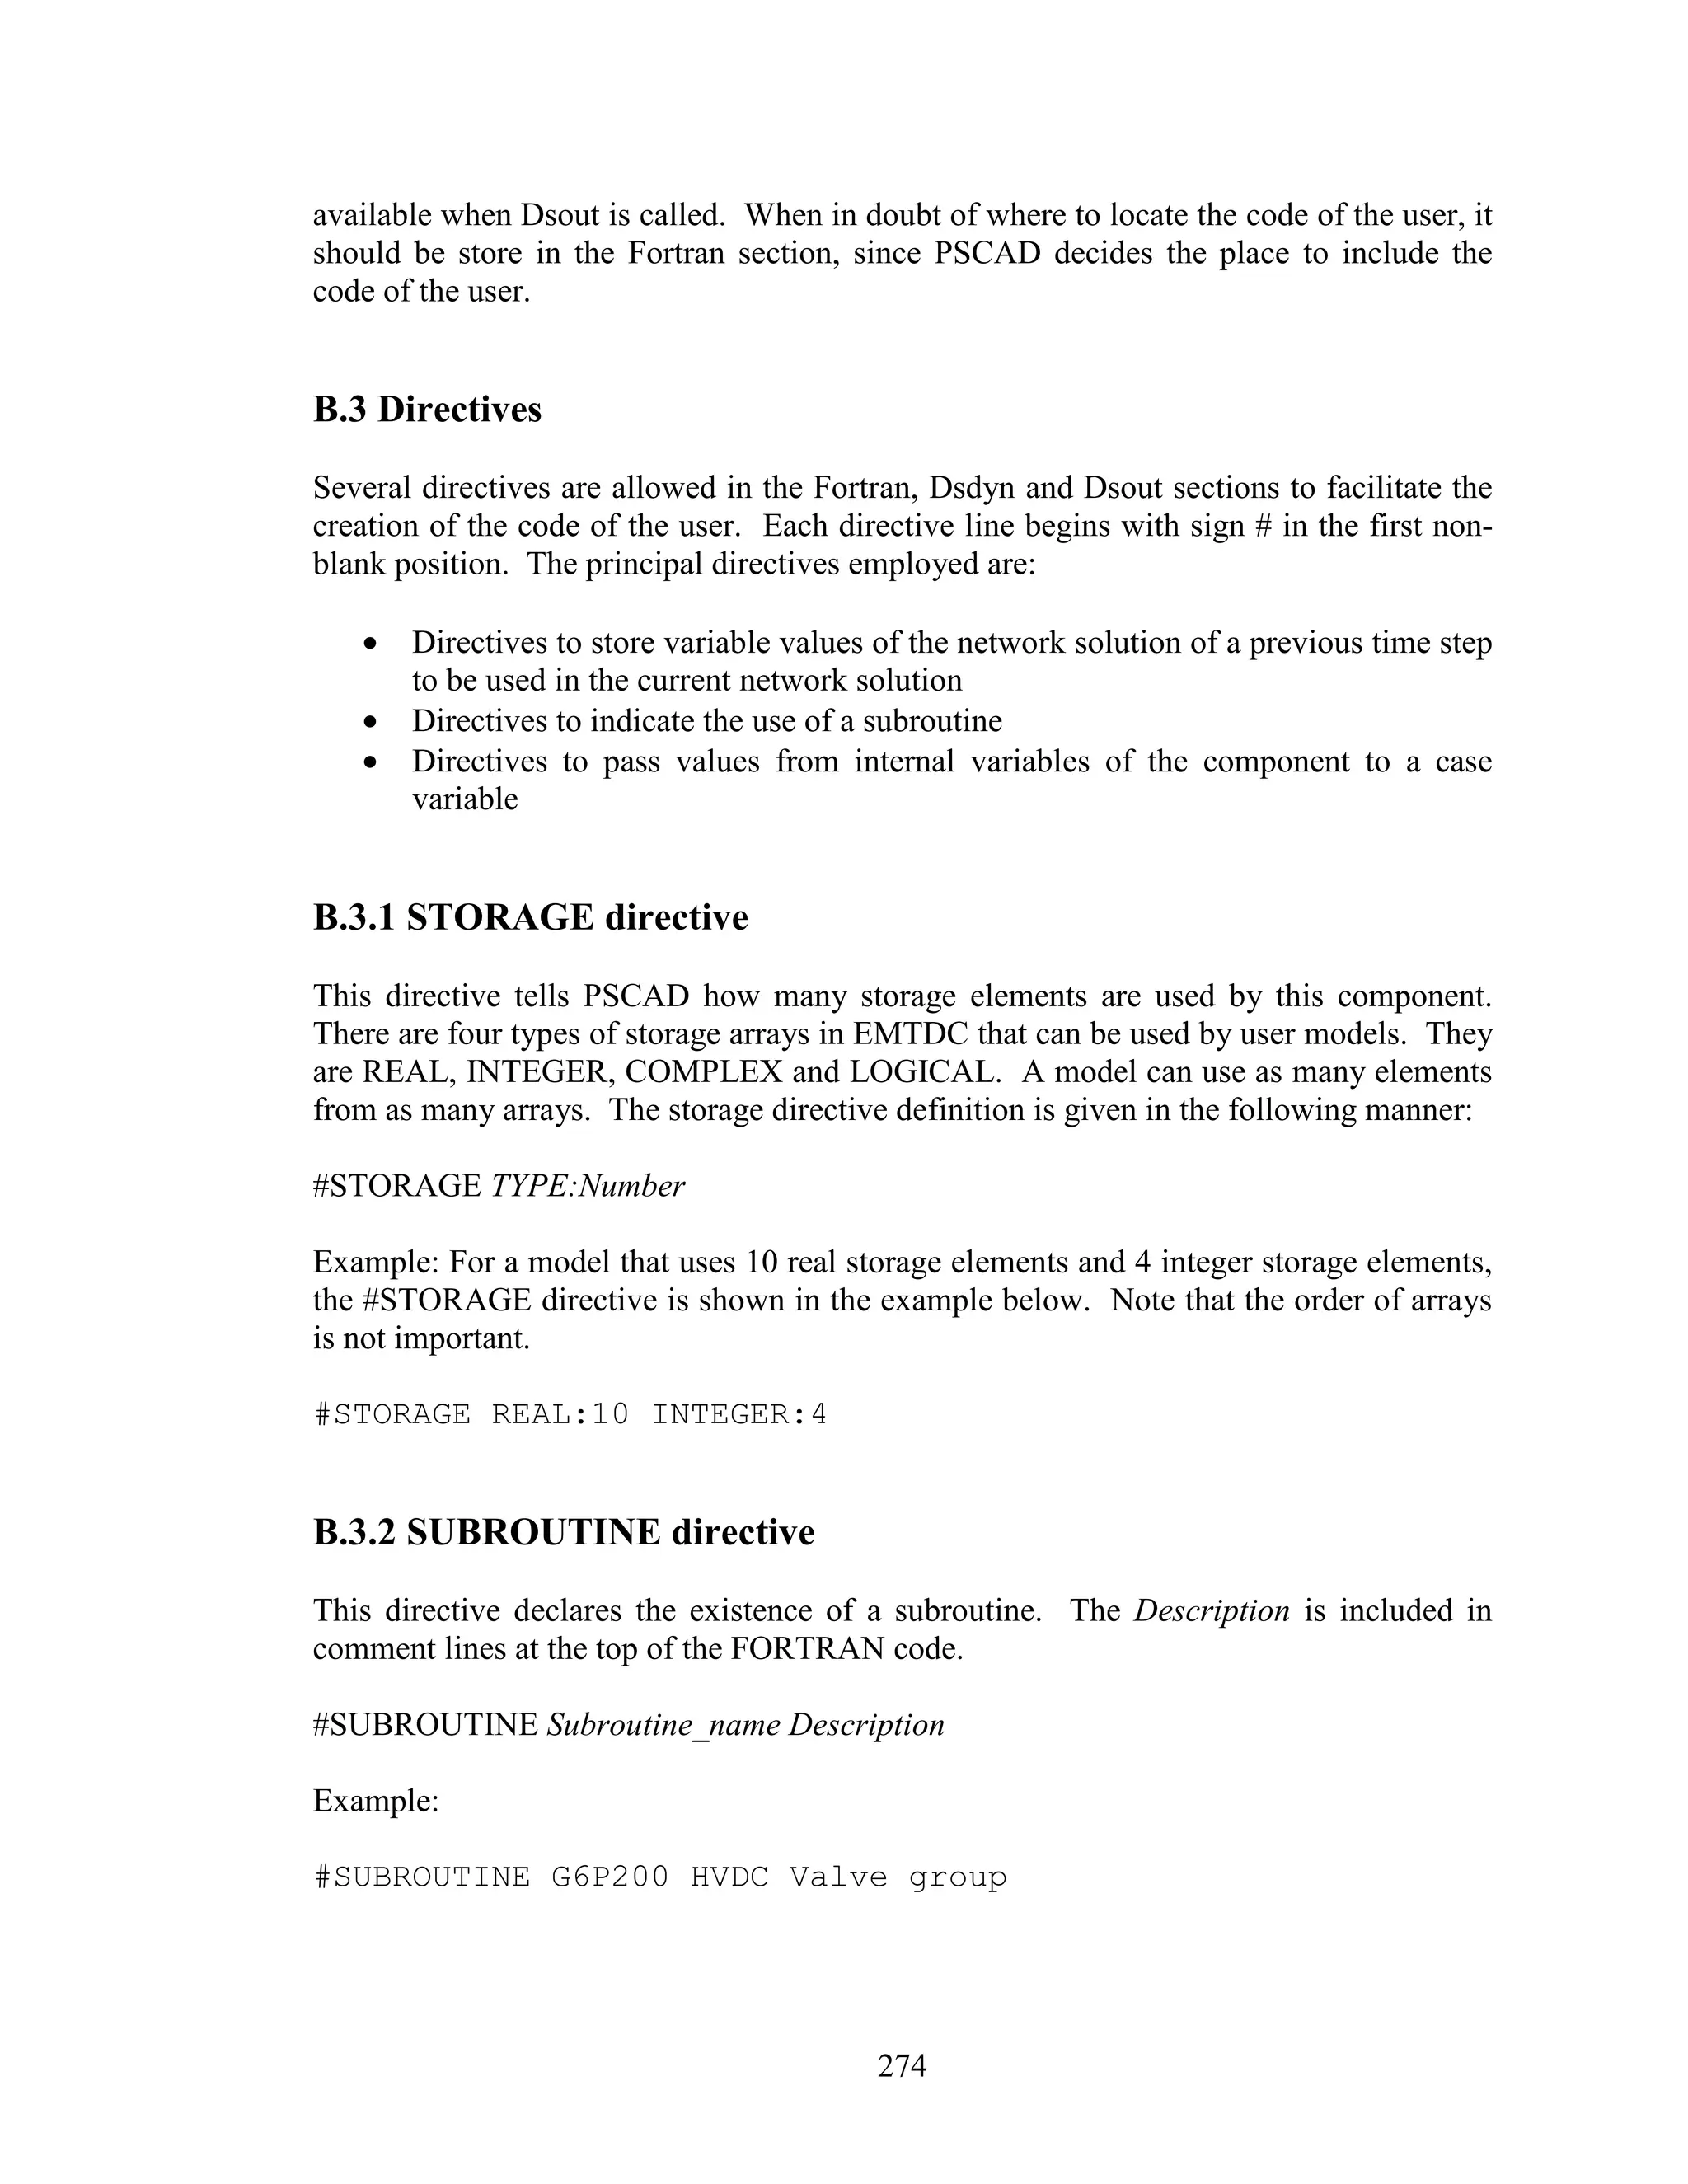
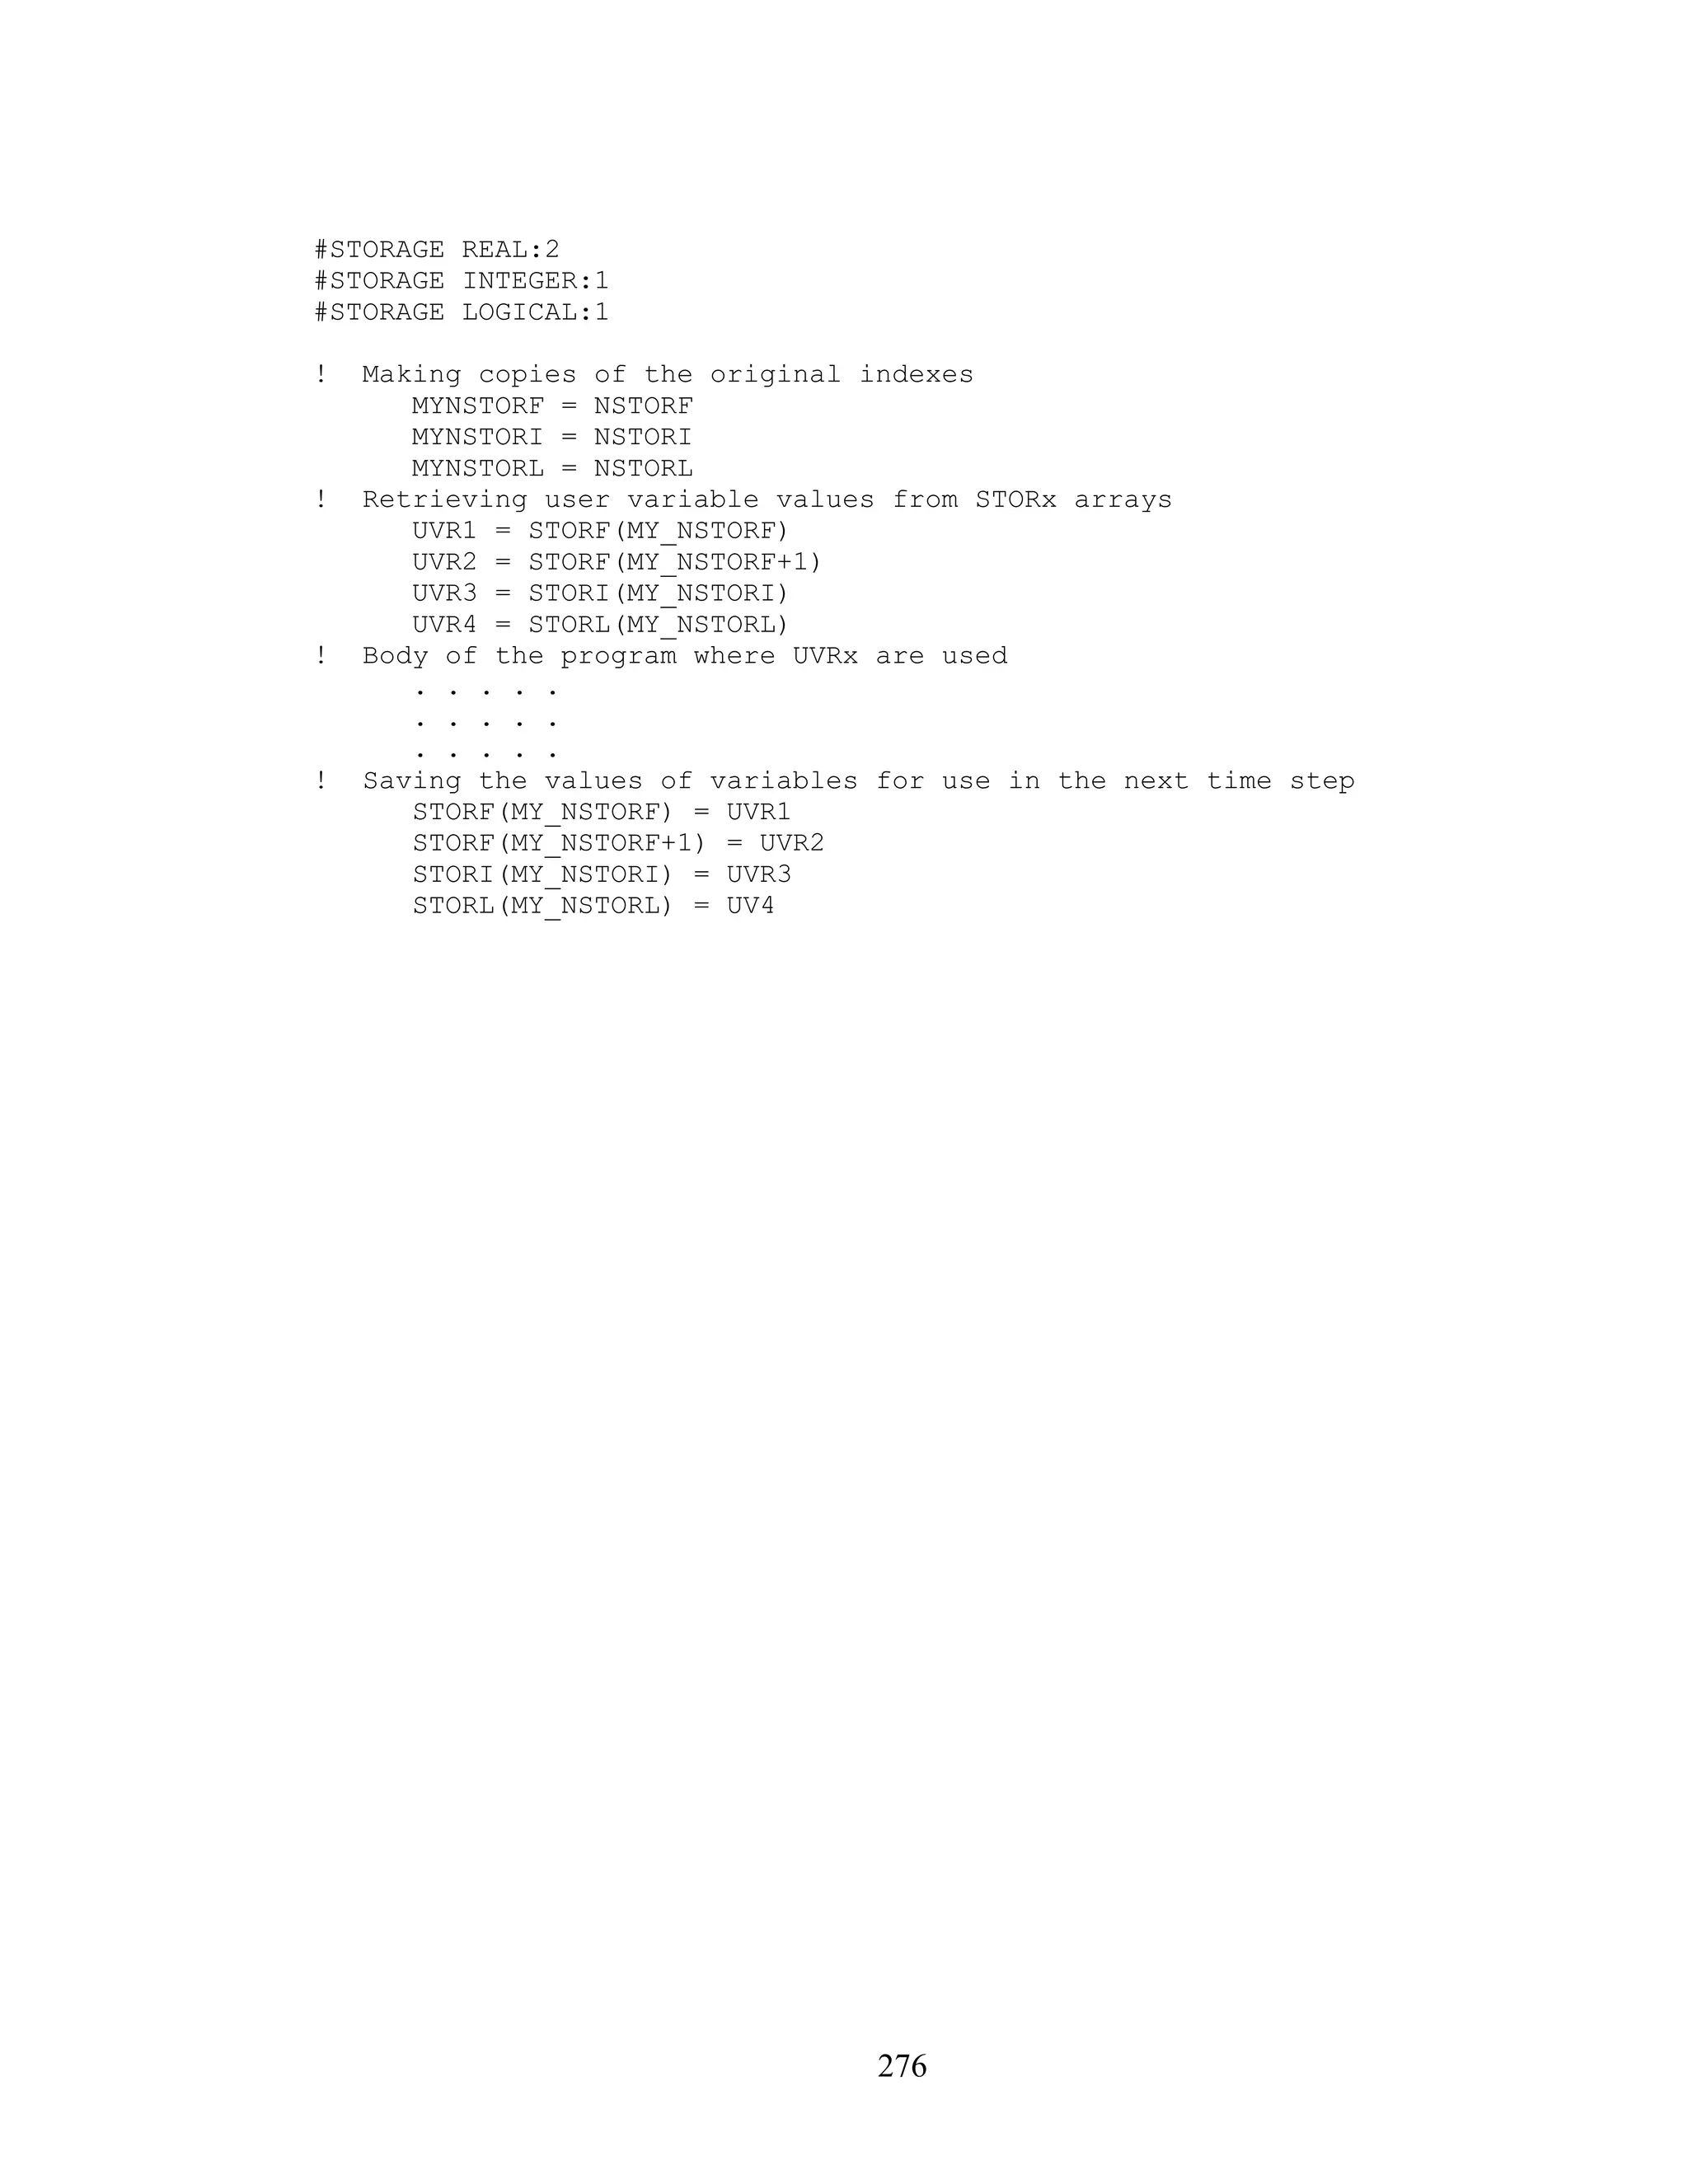
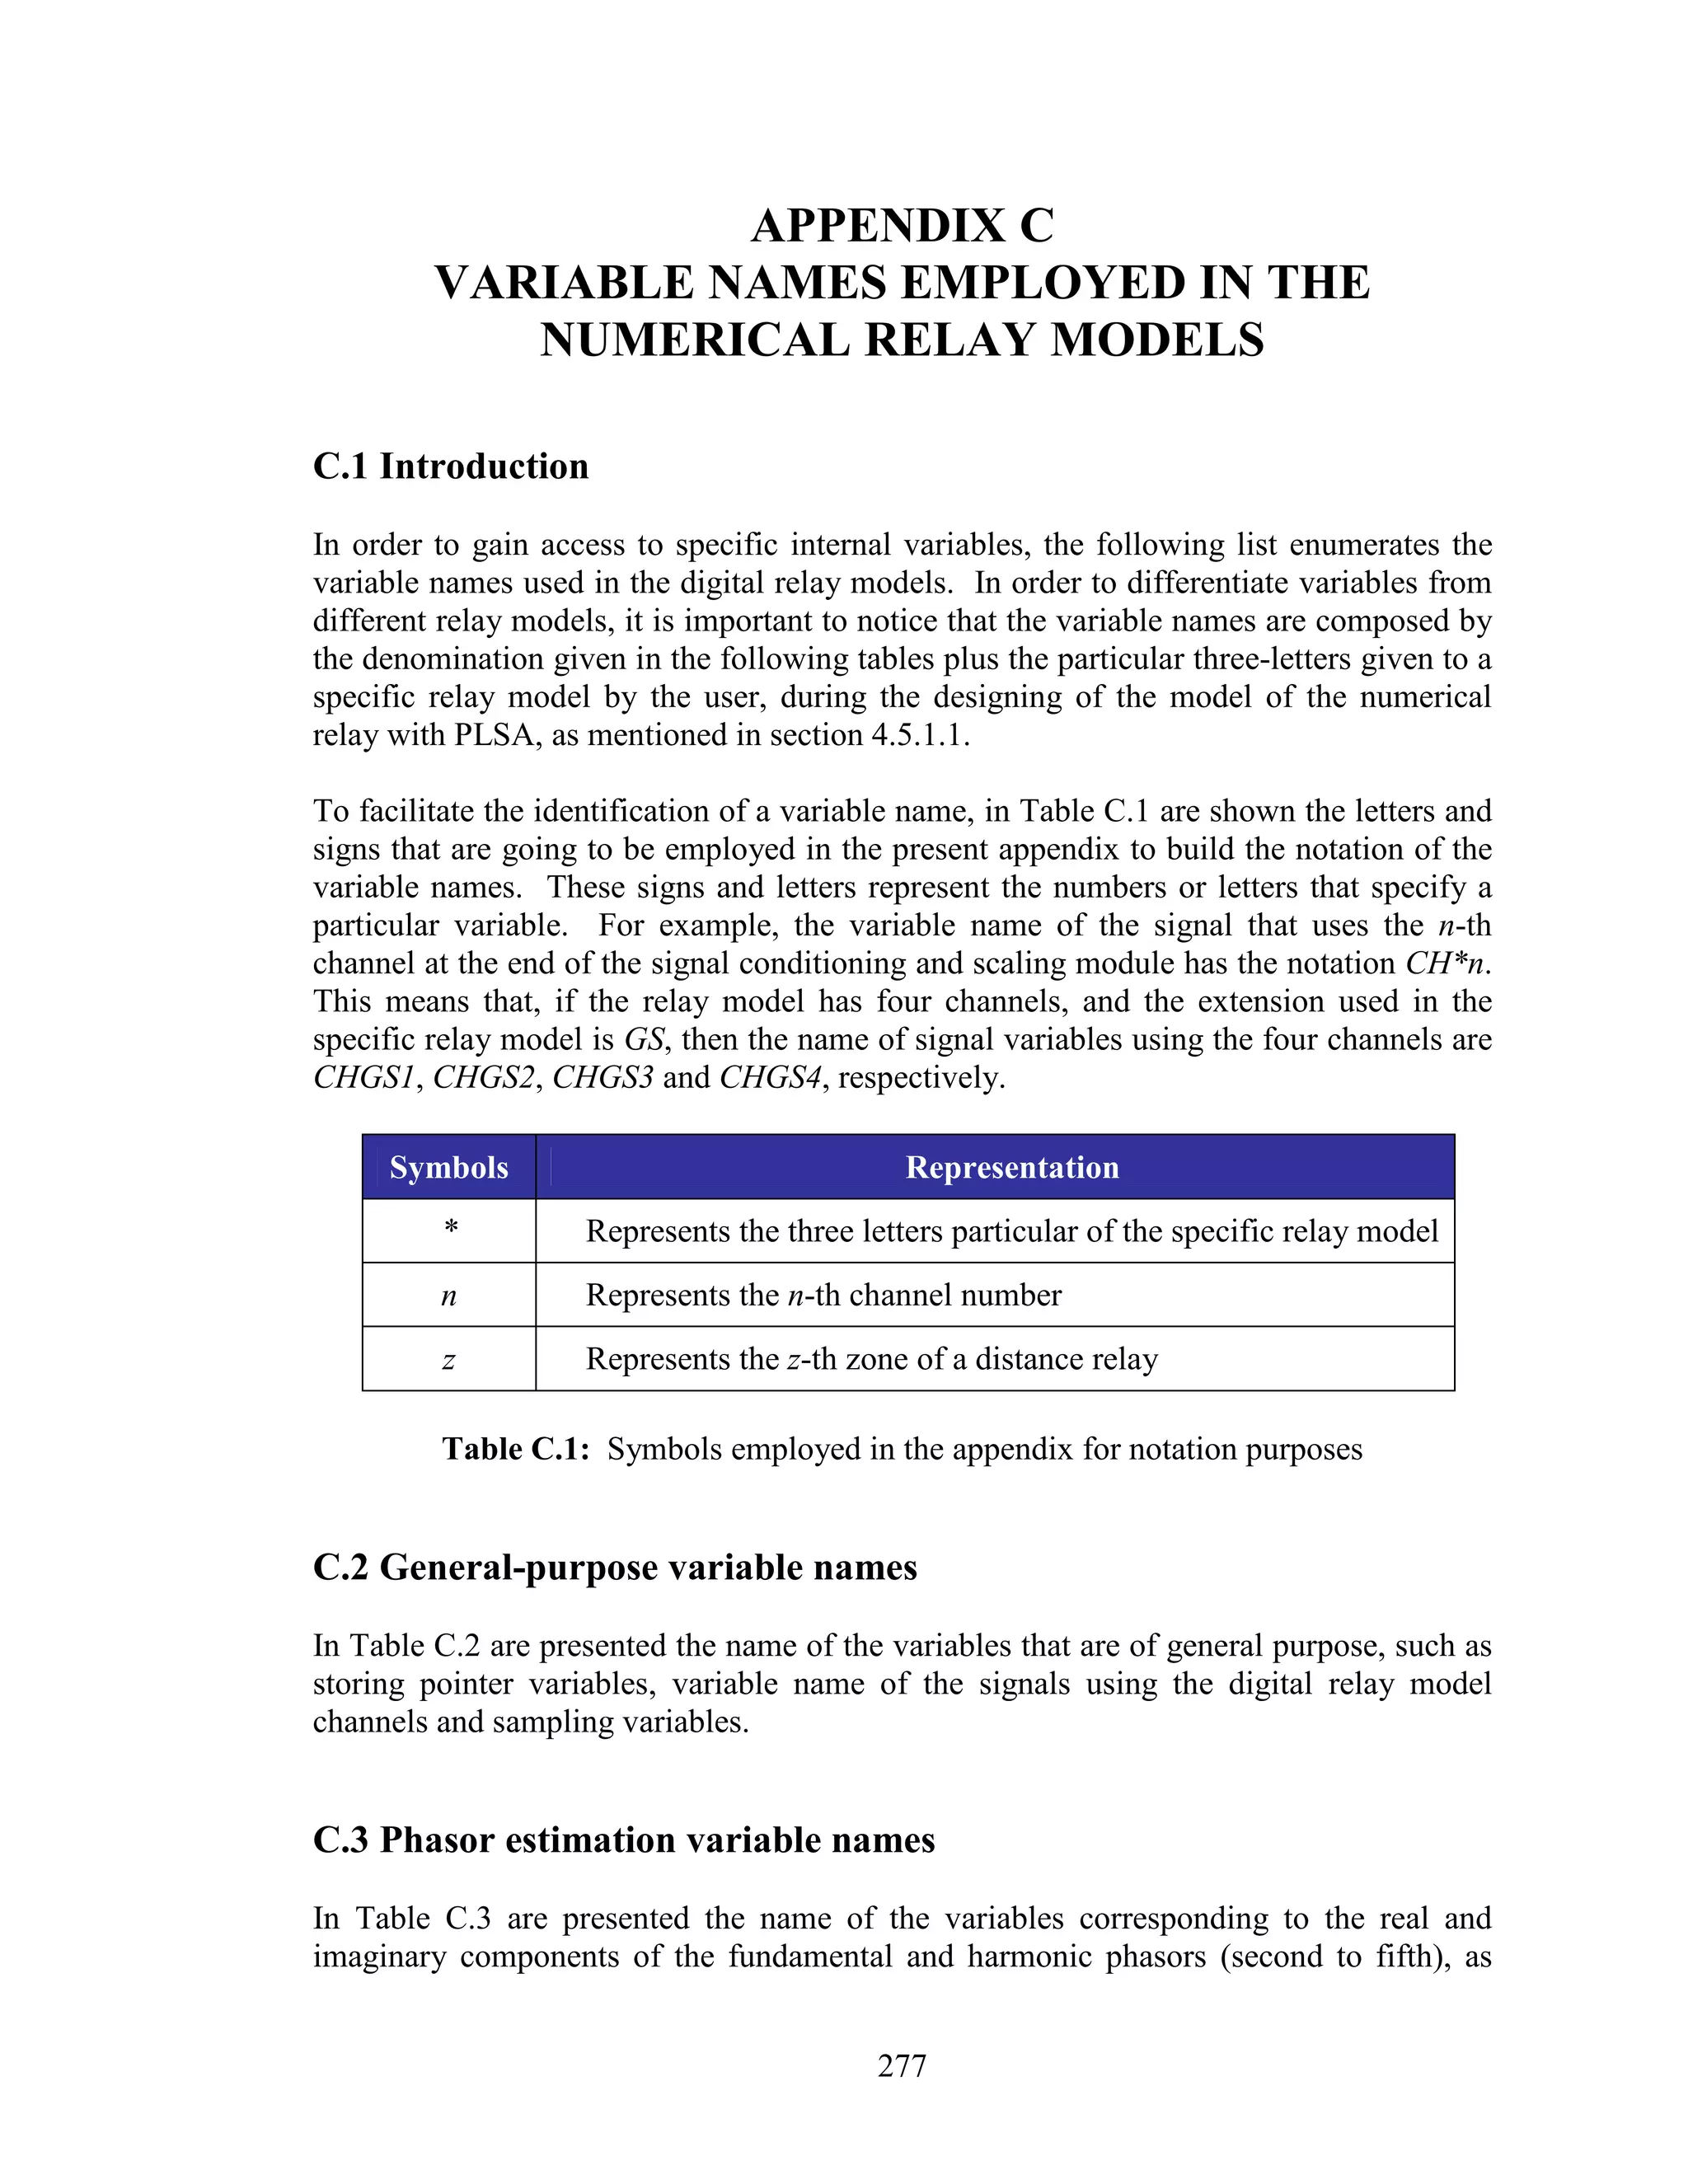
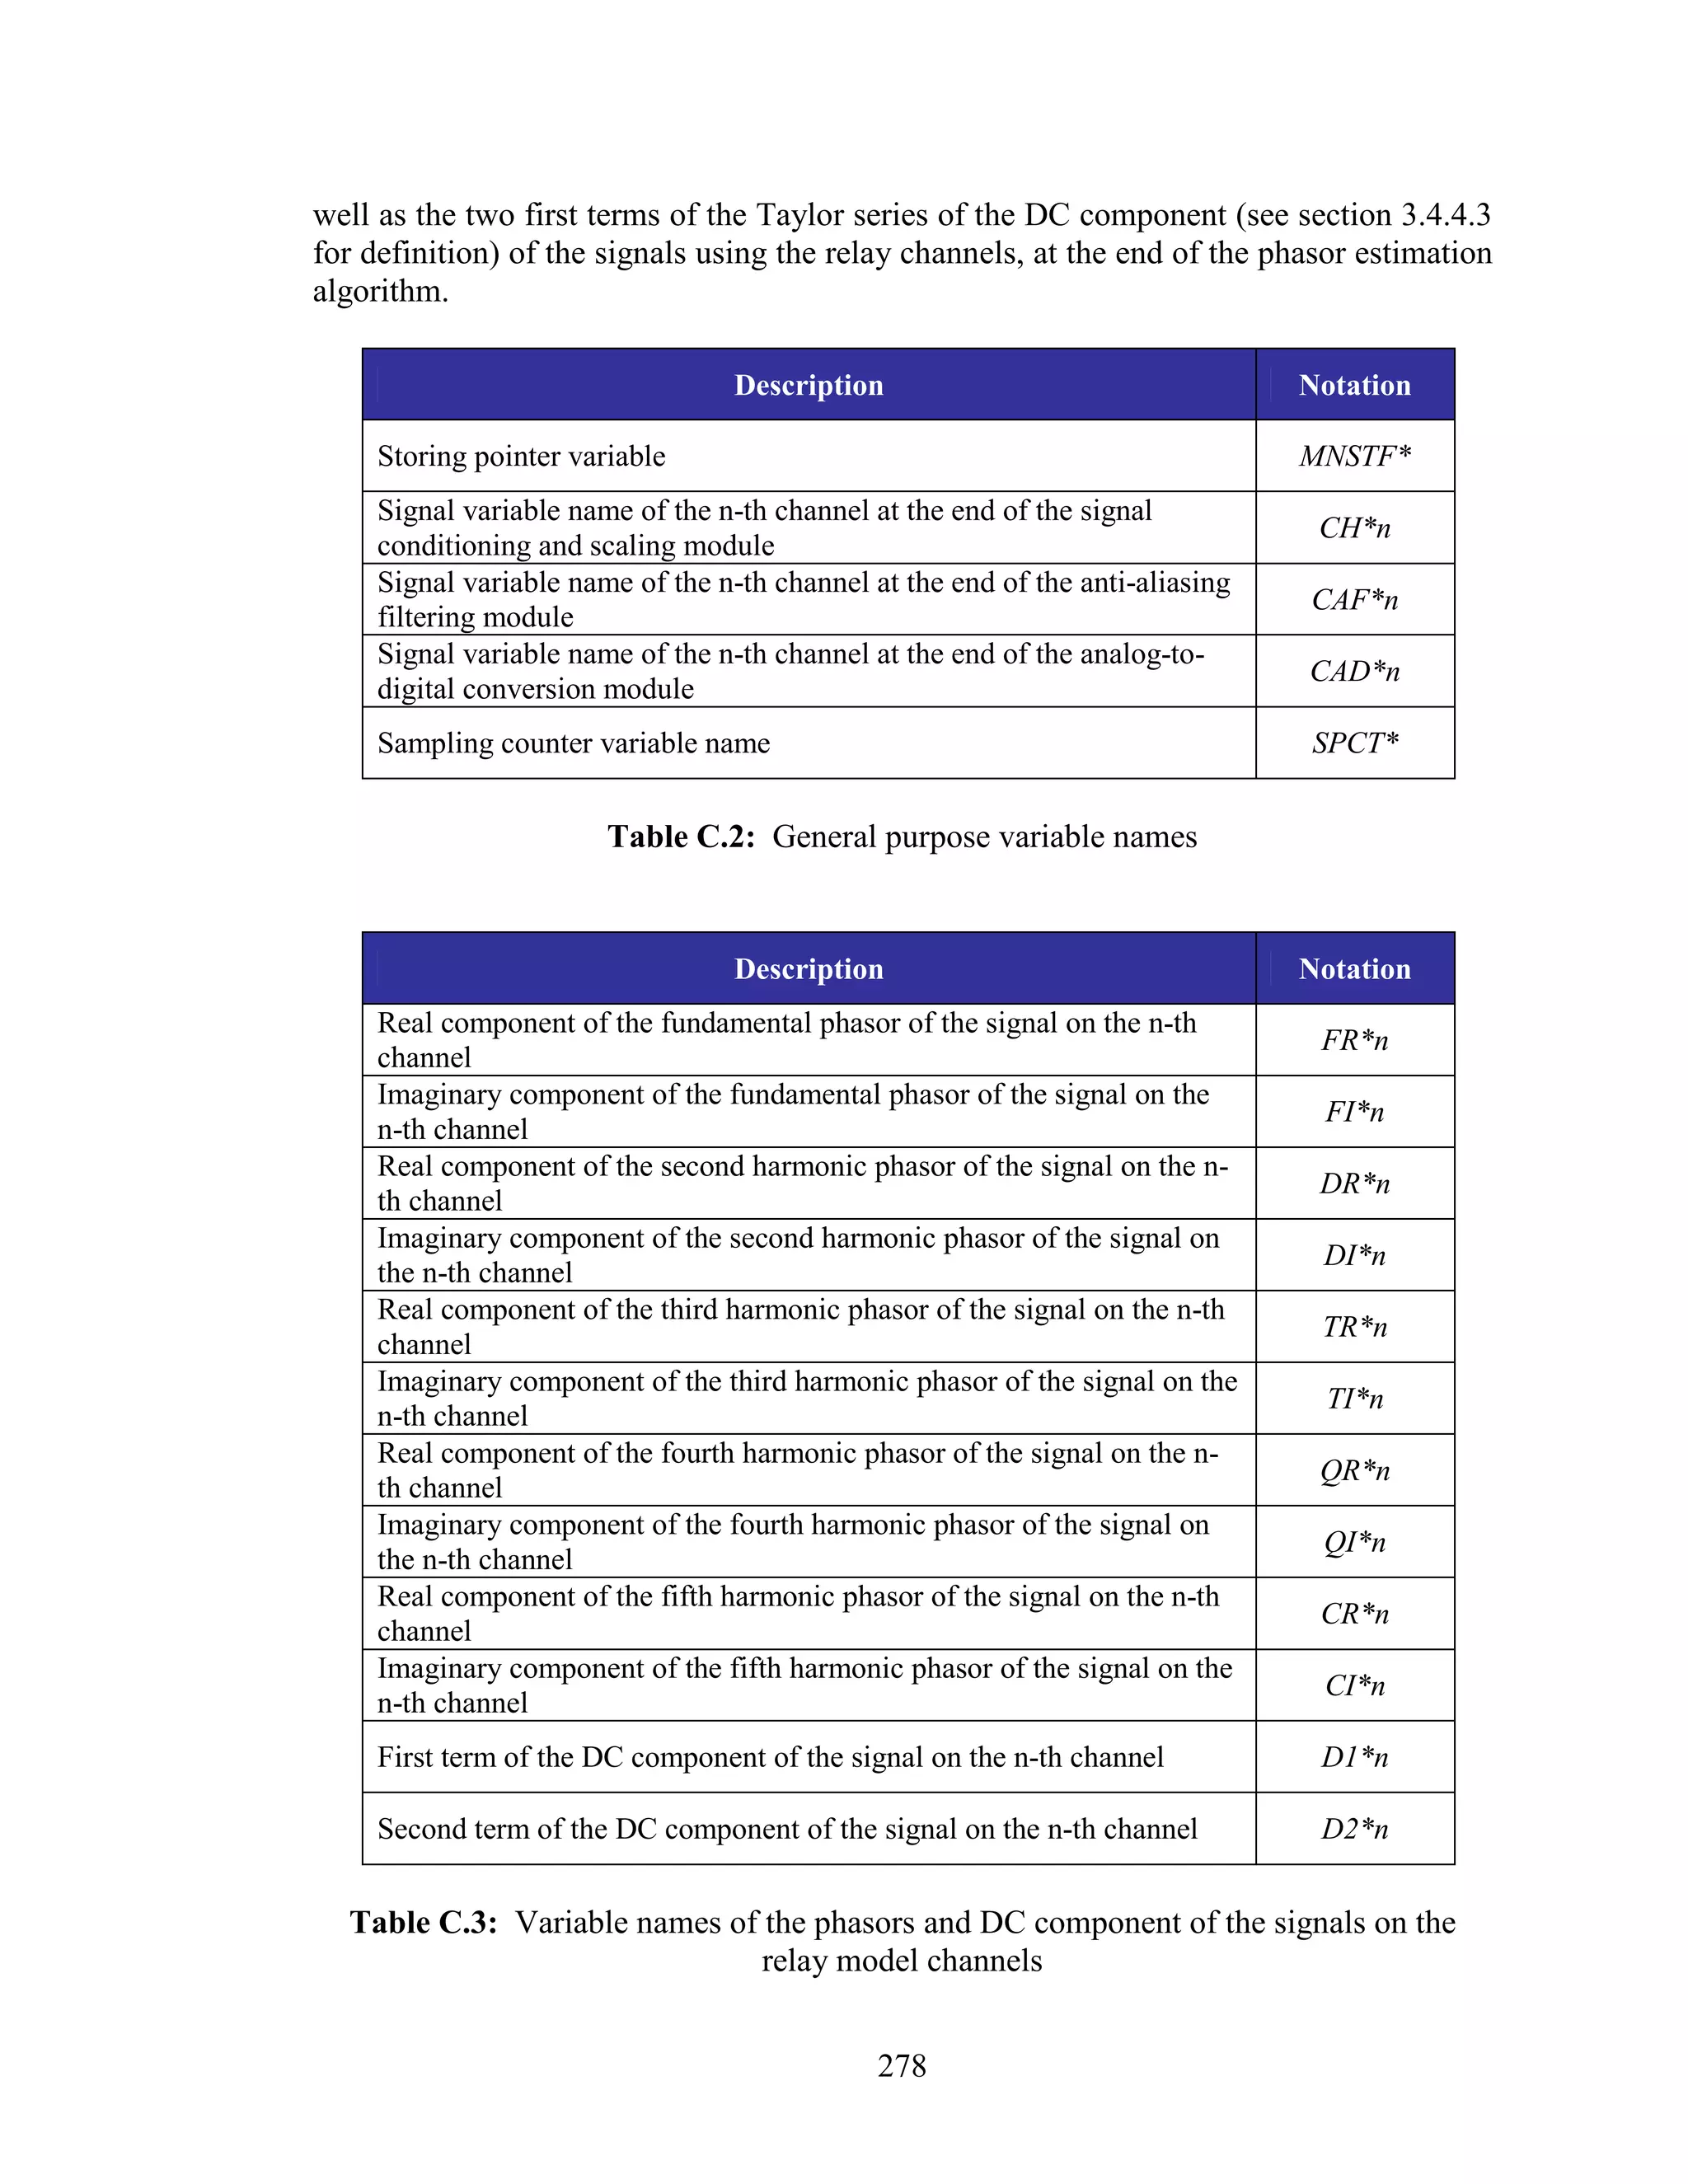
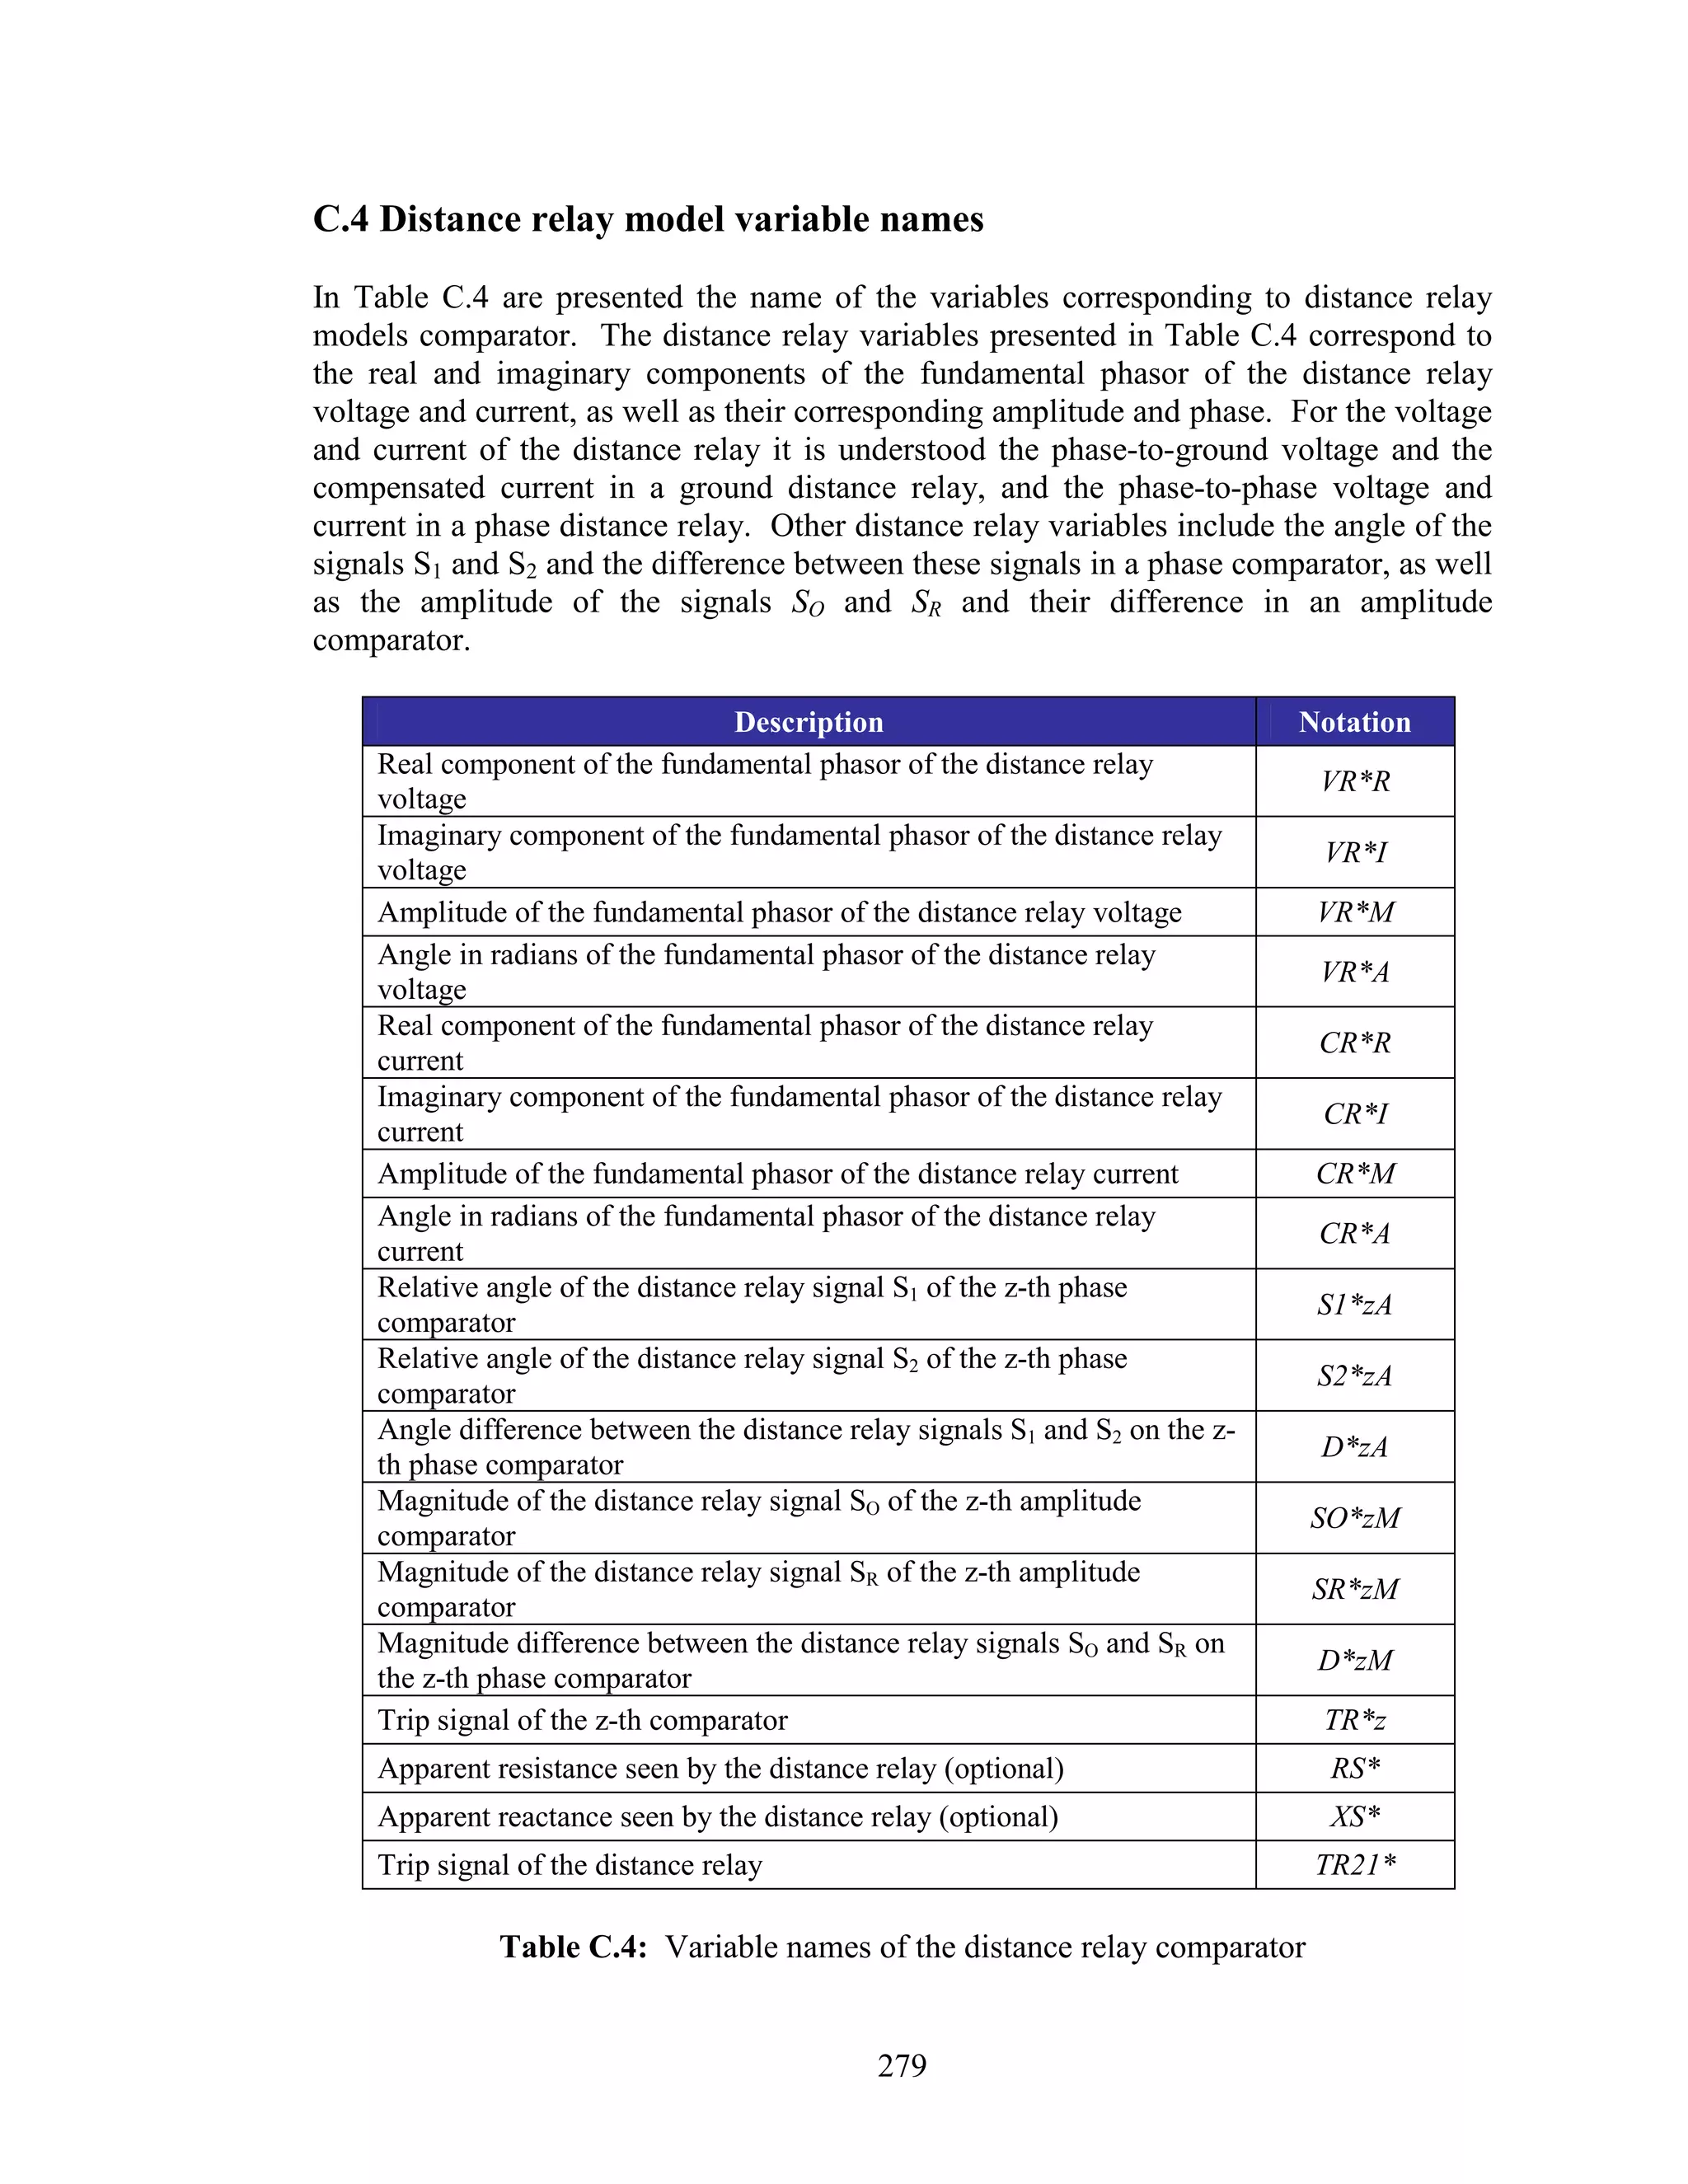
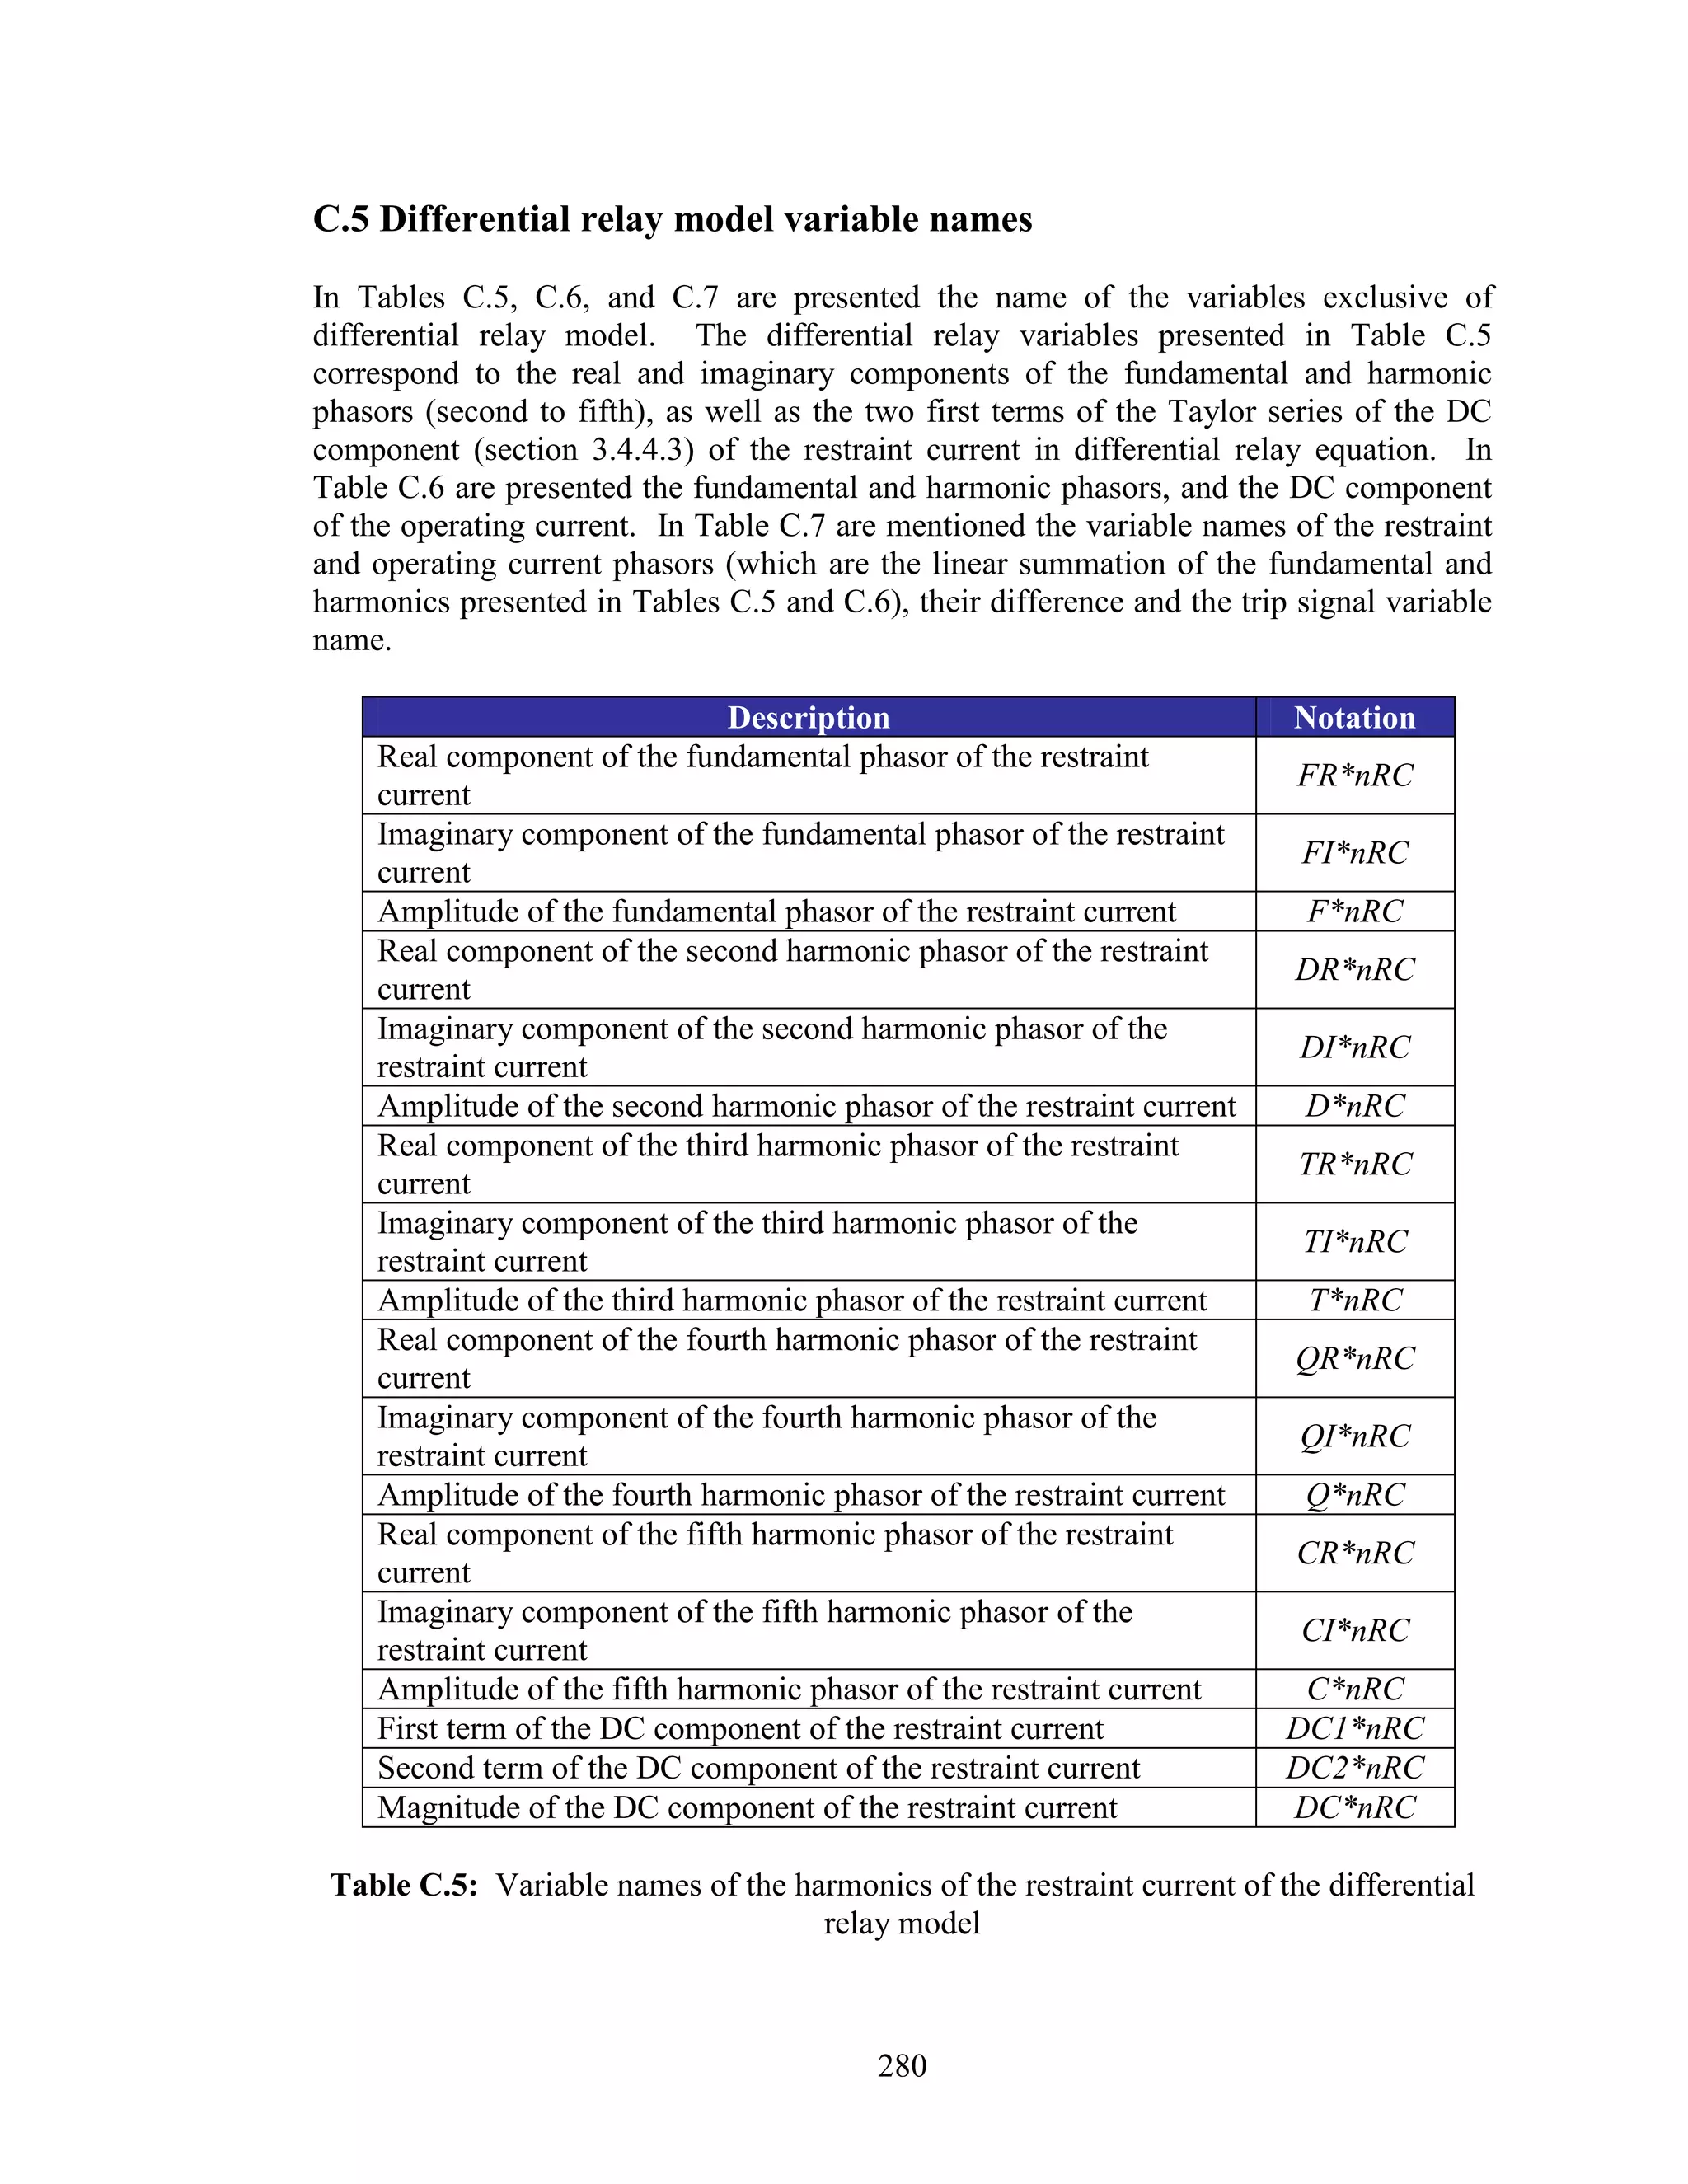
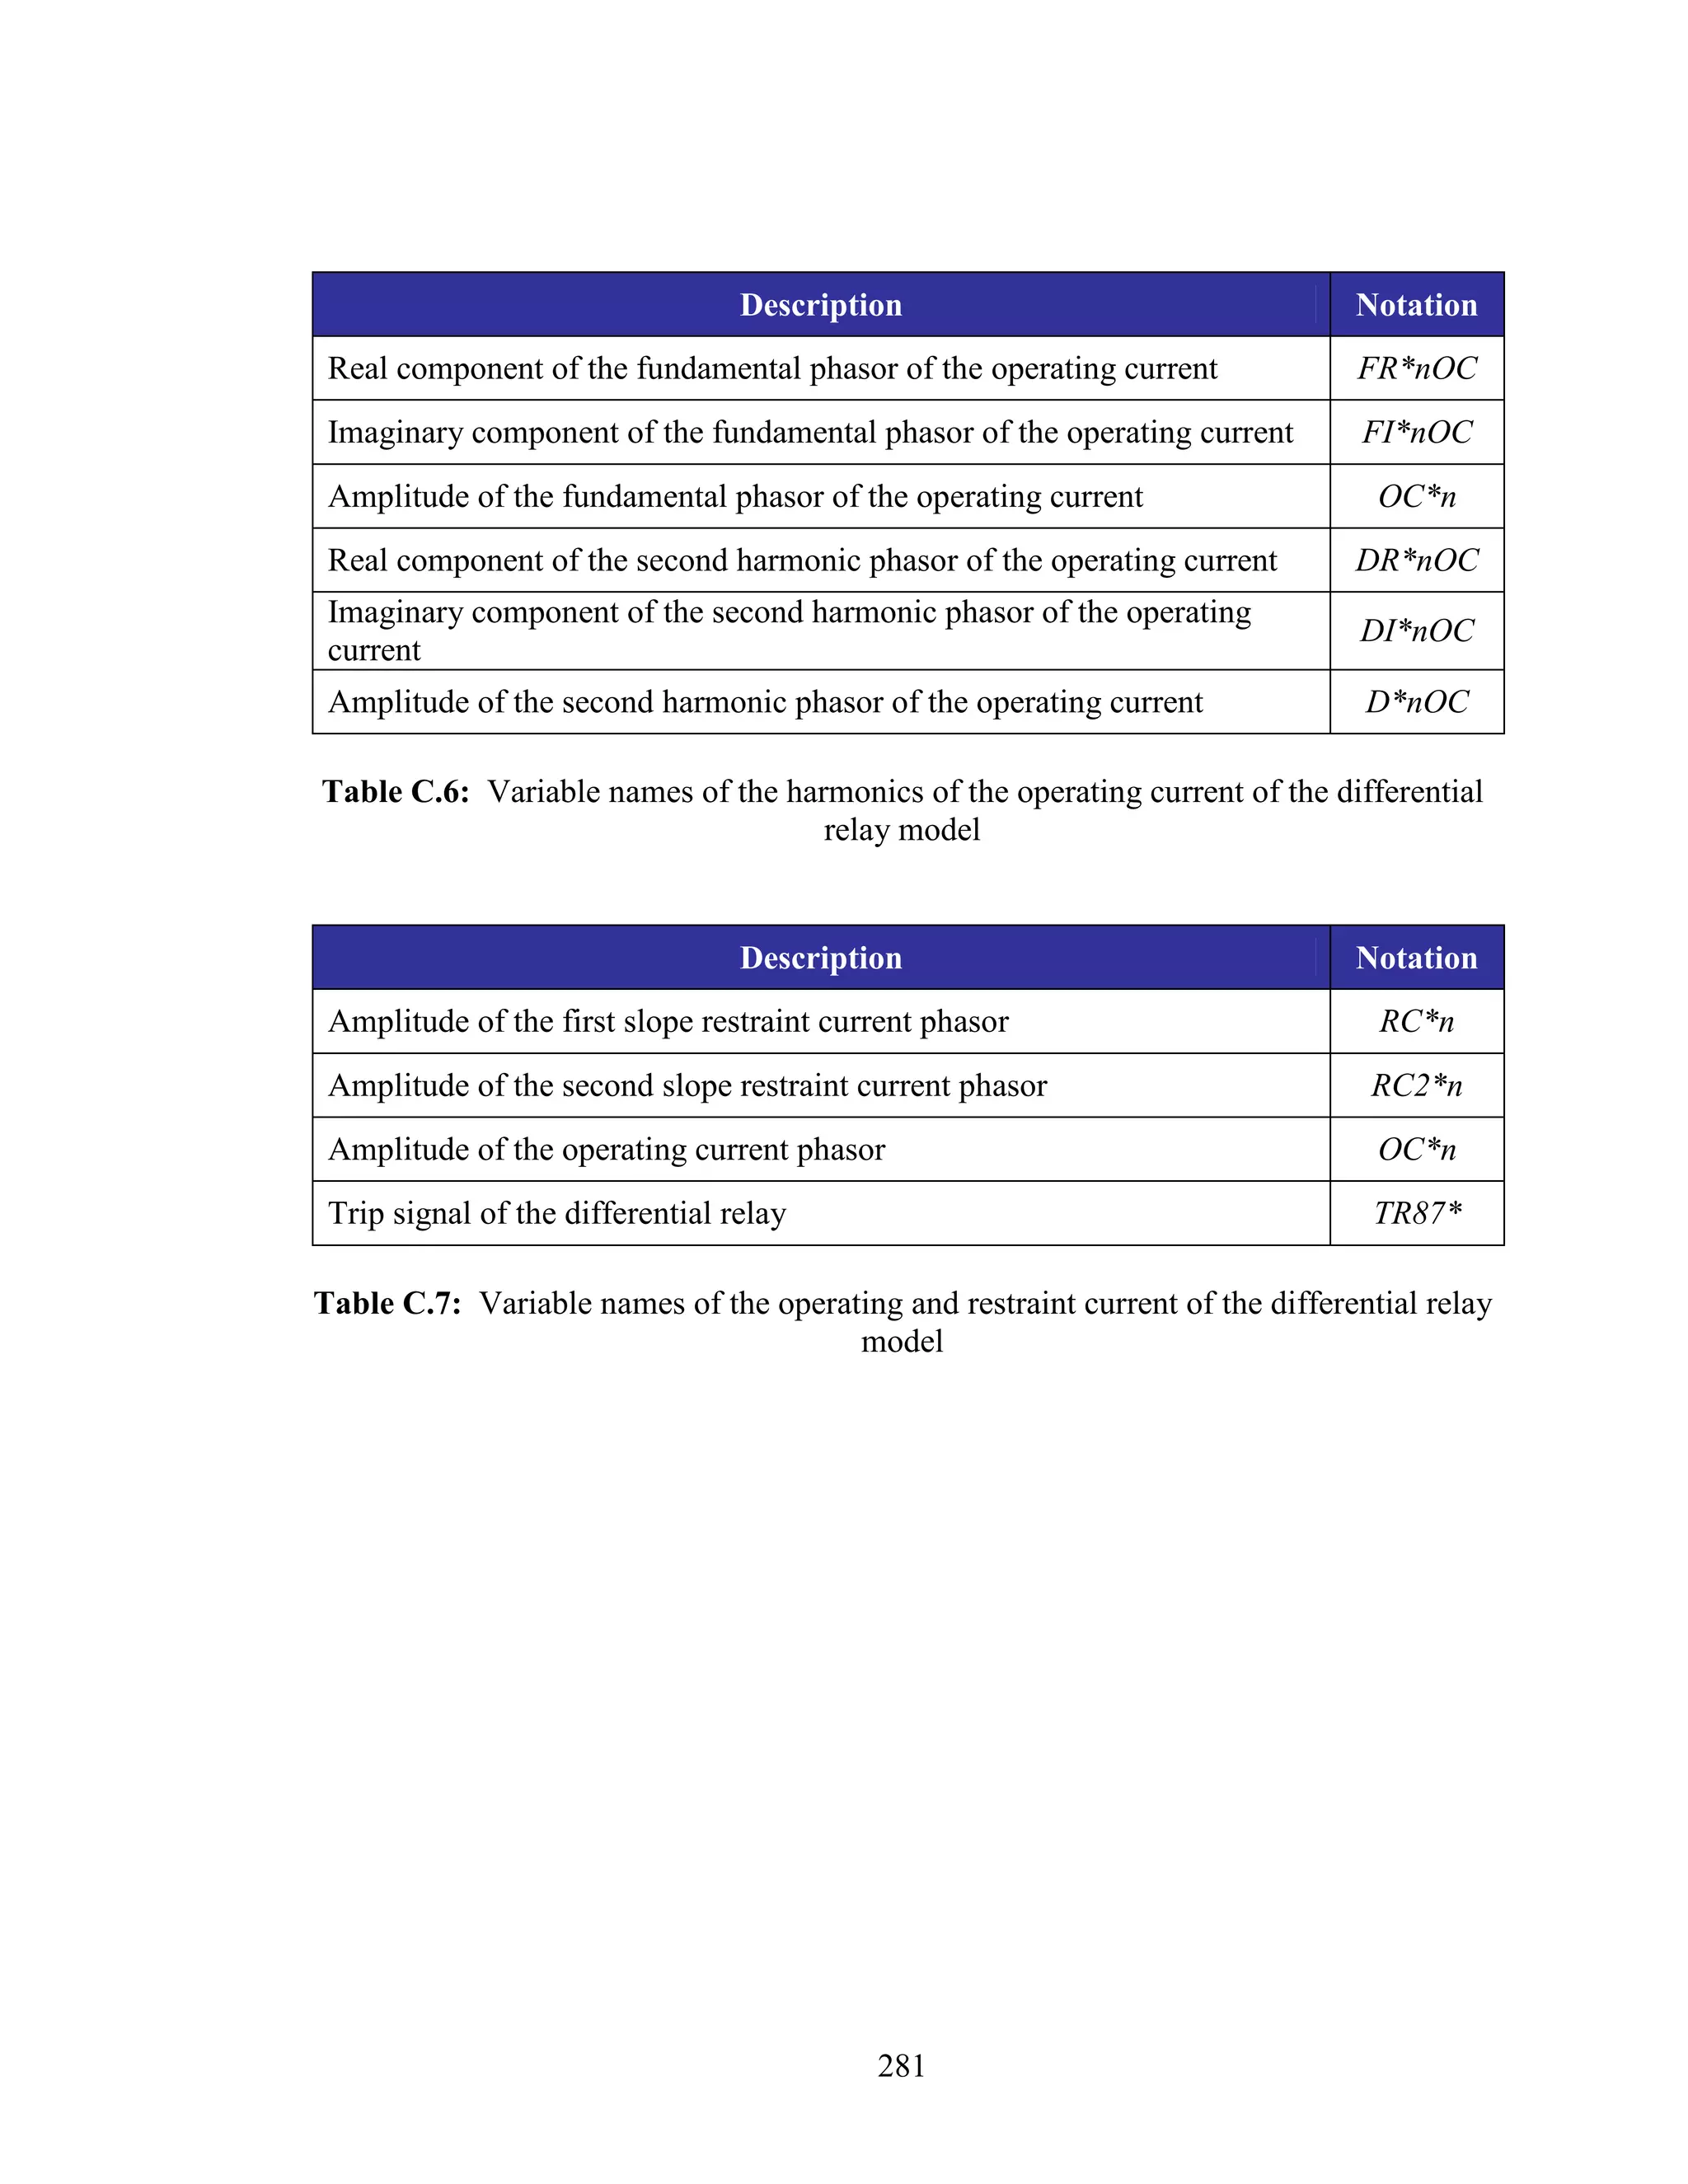
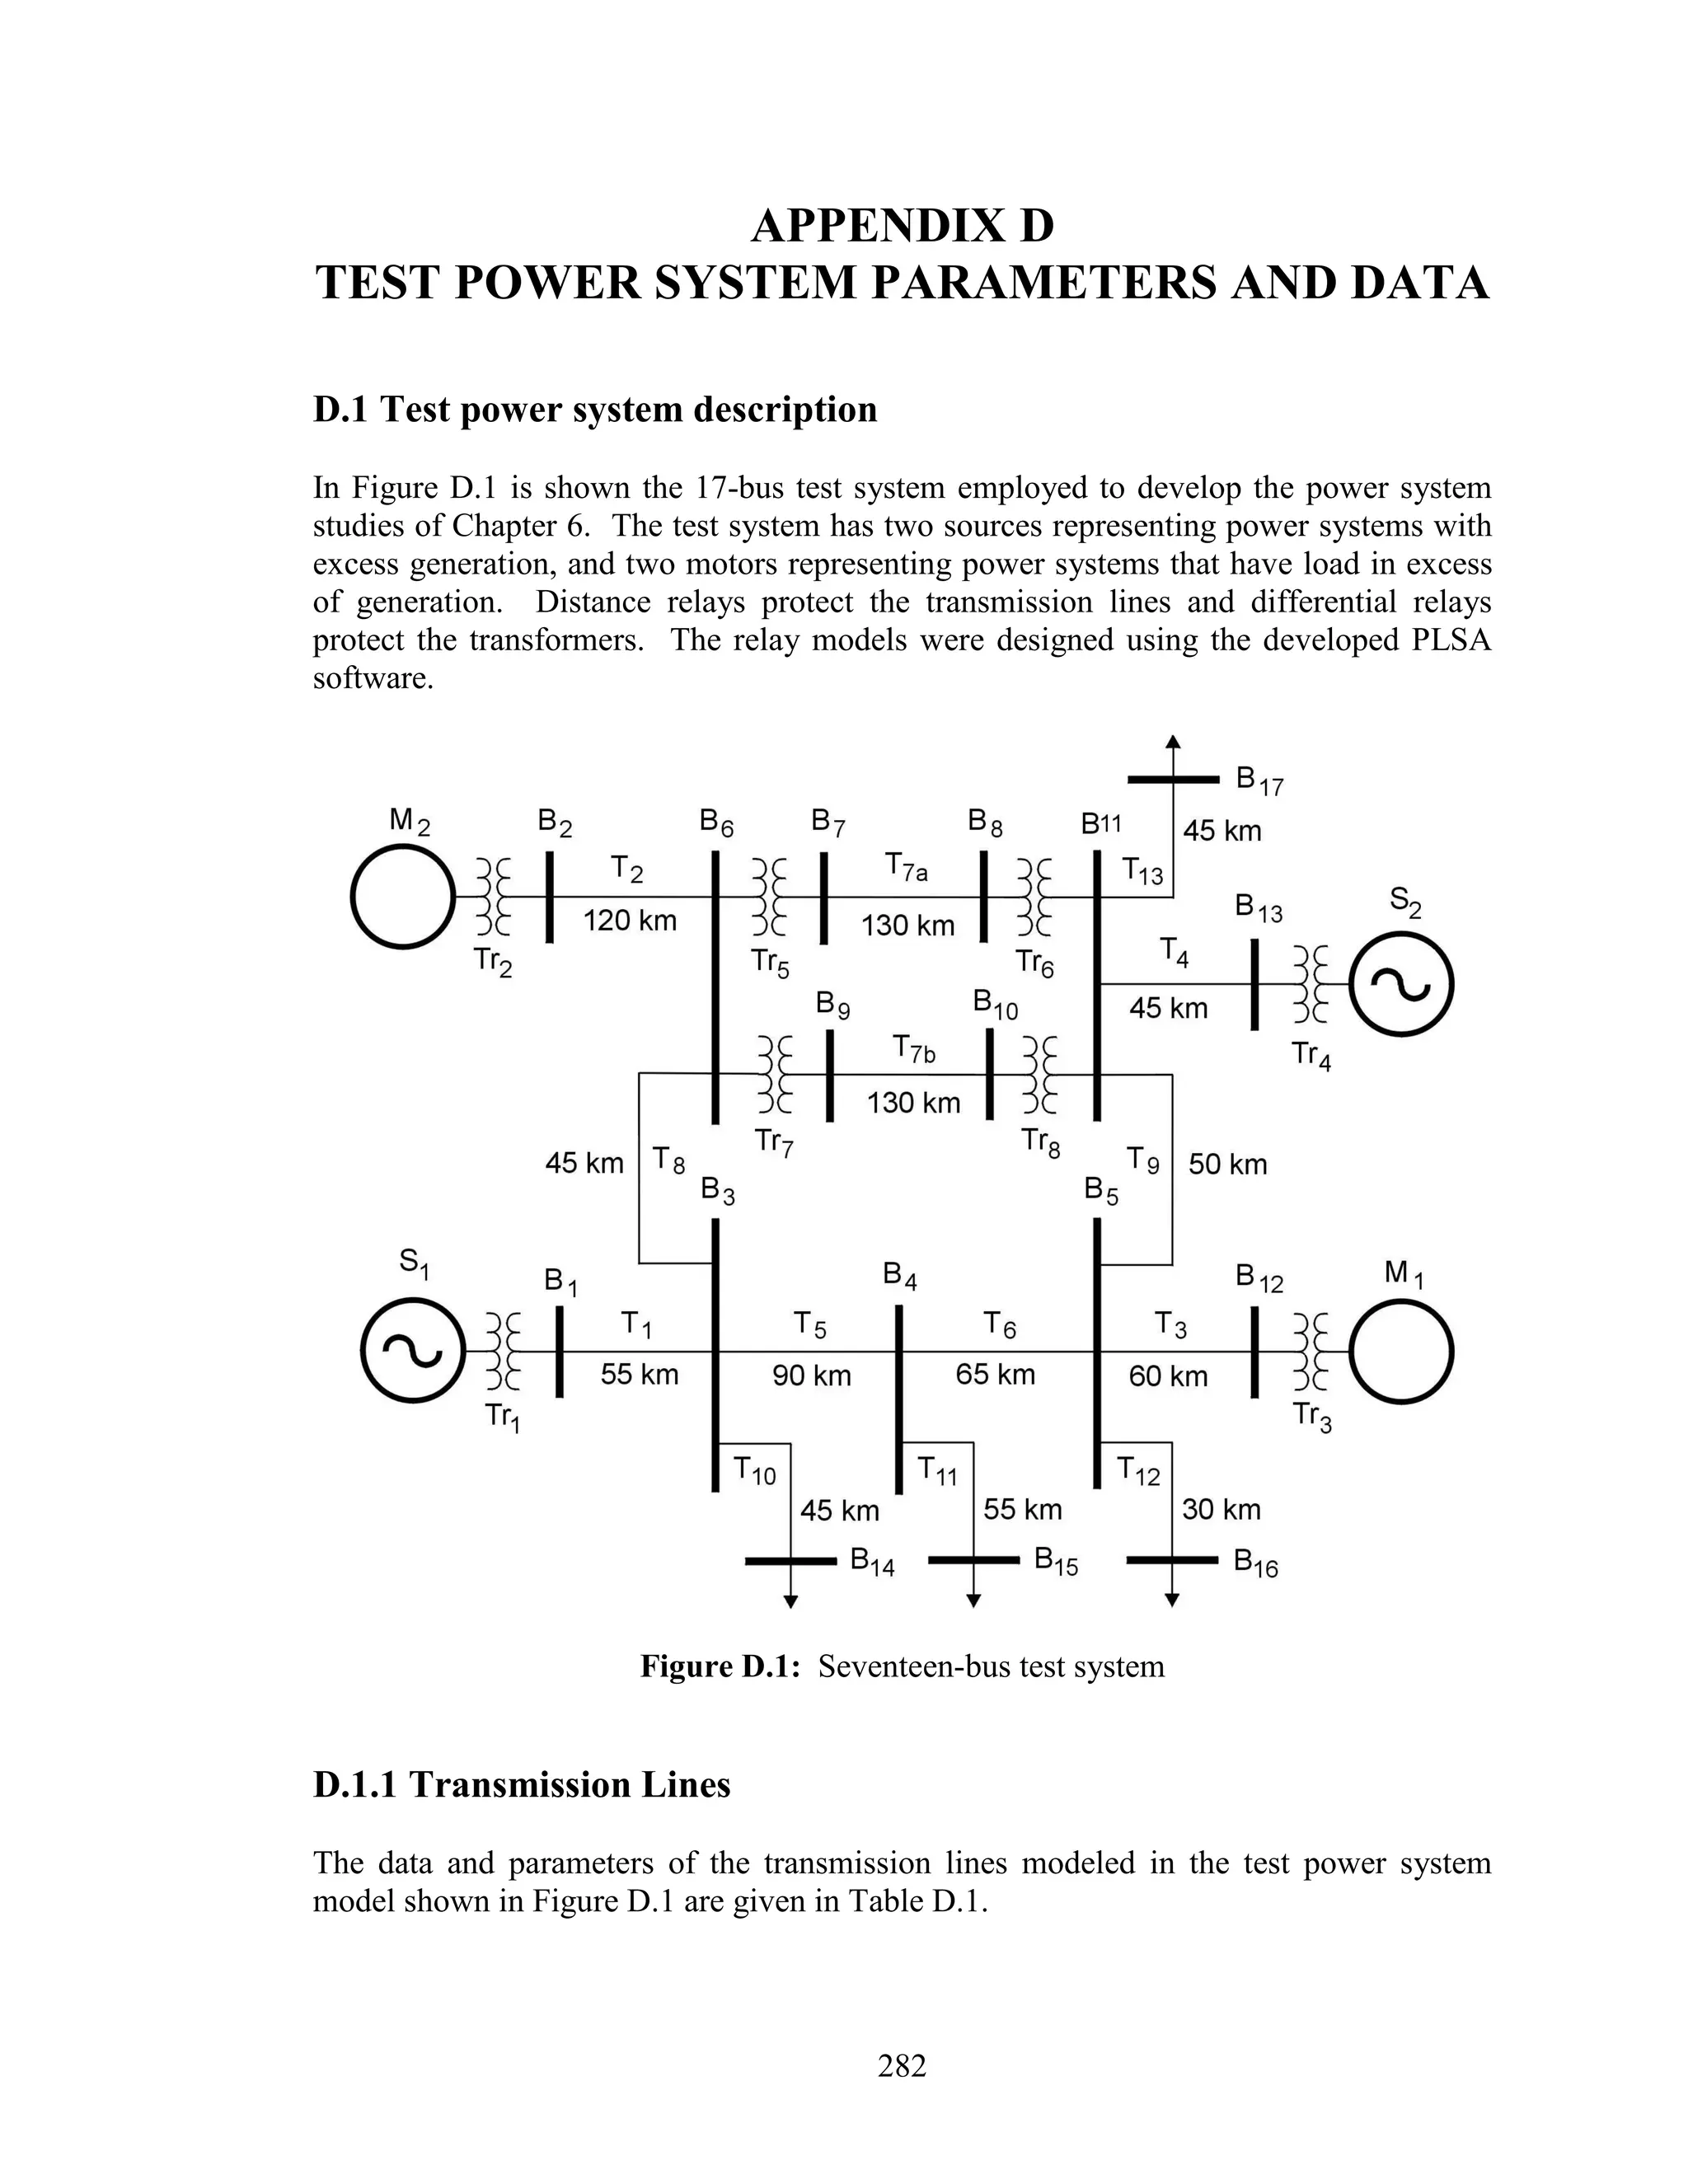
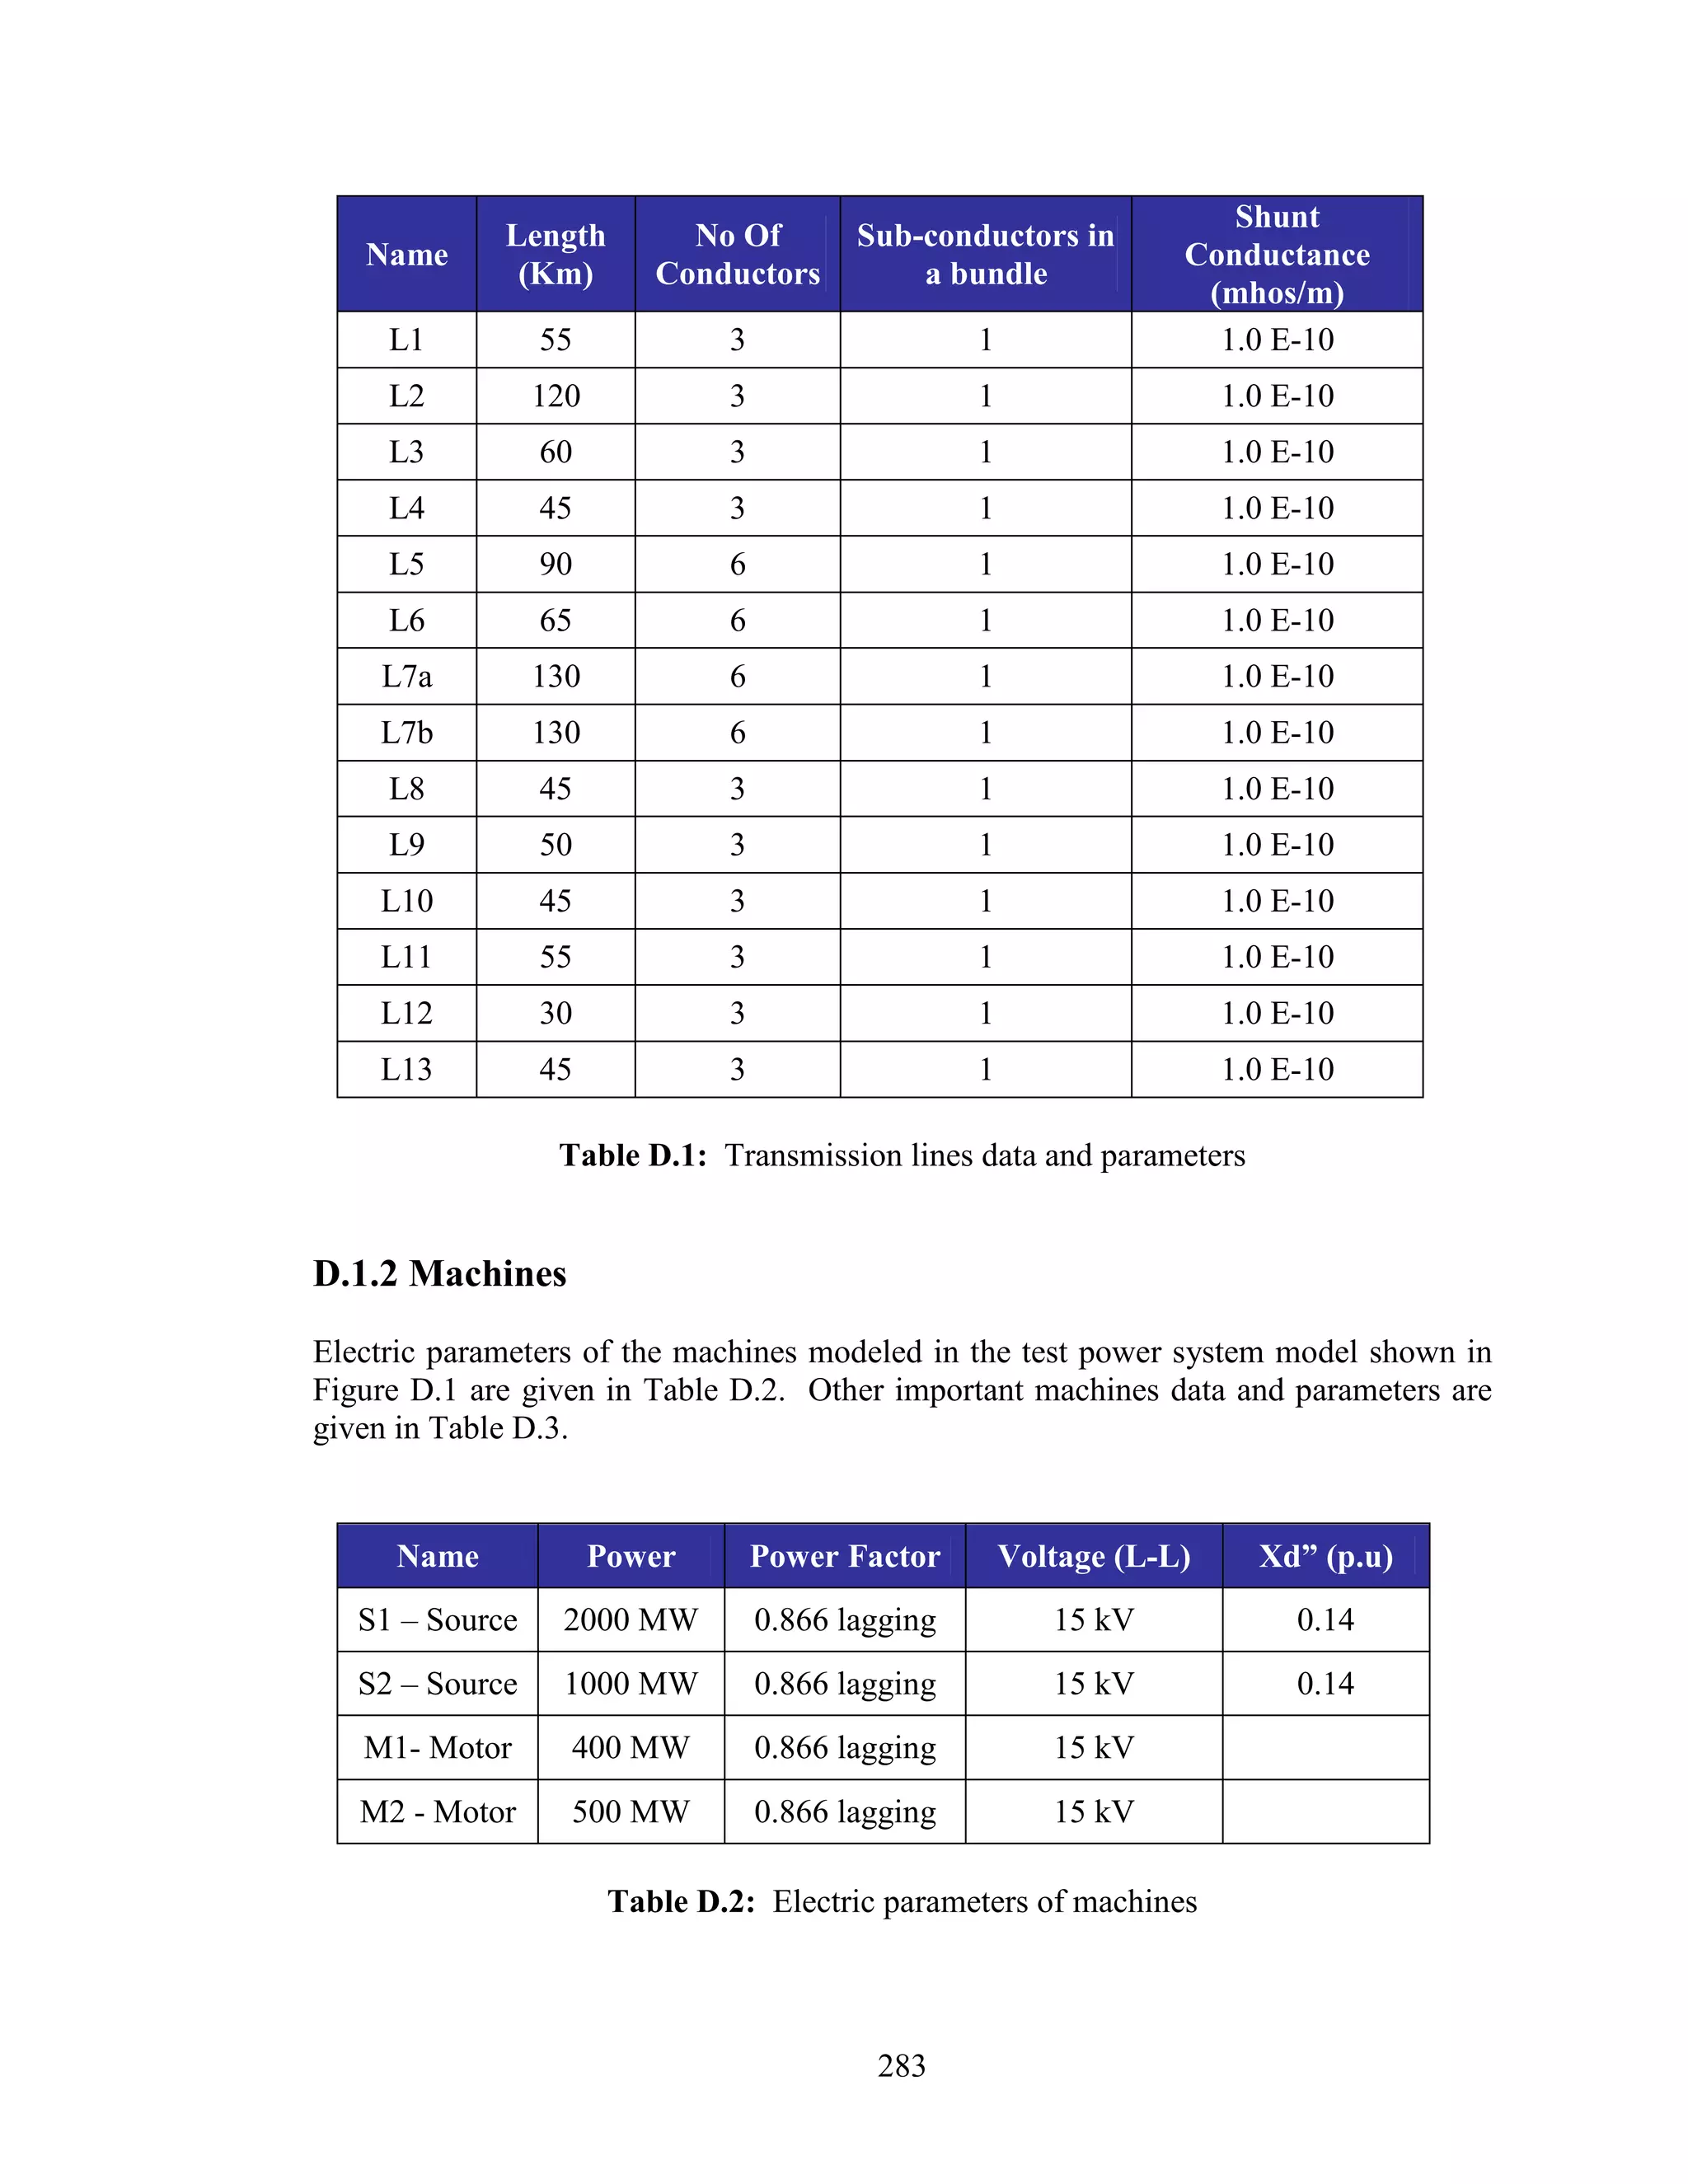
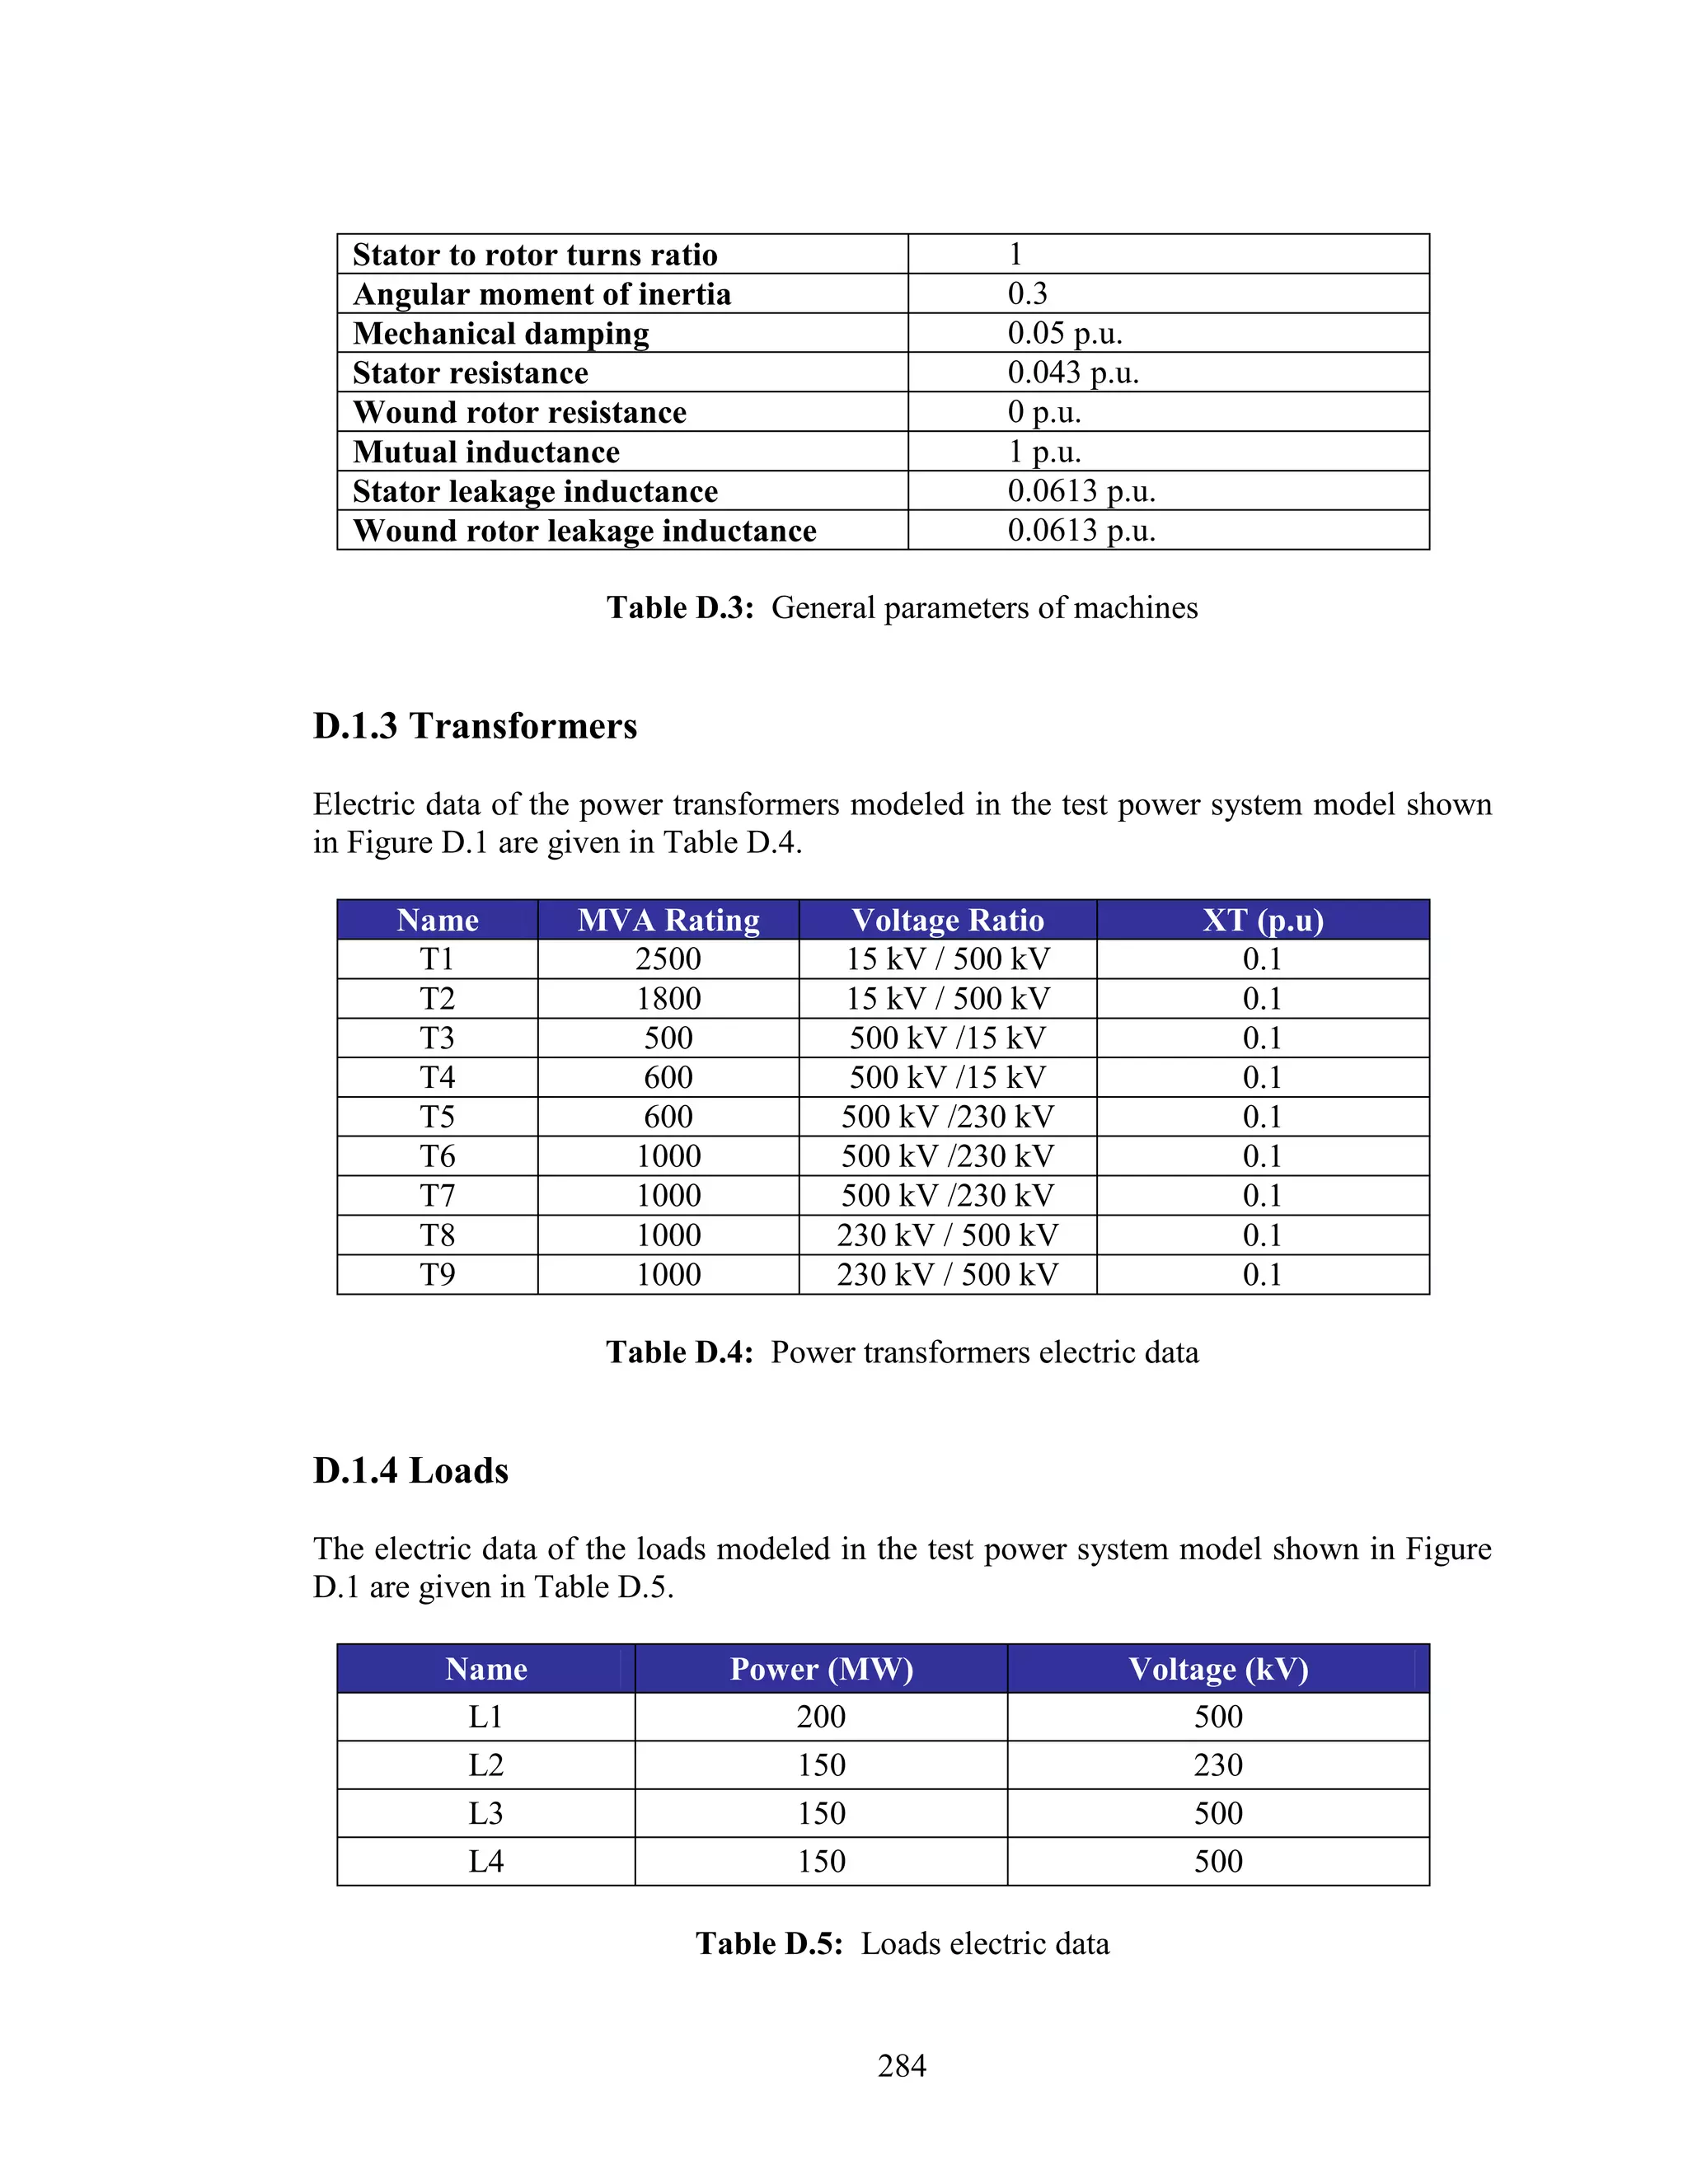

This thesis describes a new methodology for modeling and designing numerical relays. The methodology uses a Visual C++ program to generate FORTRAN code representing the functional blocks of a relay from user specifications. This code is incorporated into a PSCAD/EMTDC case using a component resource. Protection system studies are then performed with the modeled relays, including adjustment of distance and differential relays, and investigation of relay performance under different conditions. Tests show the numerical relay models respond as expected.