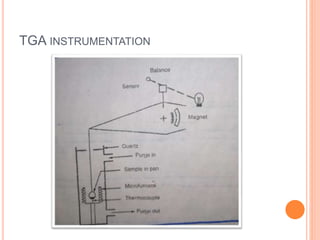
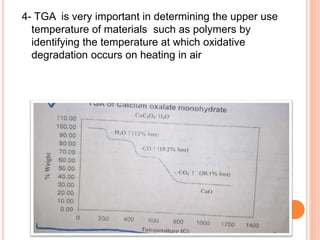
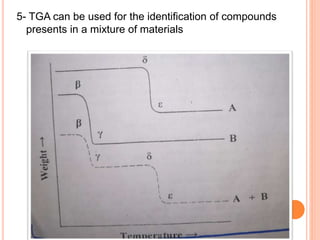
THERMOGRAVIMETRIC ANALYSIS
Presented by
AQIB JAVED
Presented to
Dr Asim Fareed
THERMOGRAVIMETRIC ANALYSIS (TGA)
 Thermogravimetric analysis measure the mass of a
sample in a specified atmosphere as the temperature of
the sample is programmed.
 The output from a TGA experiment is a plot of mass vs
temperature. The TGA plot is called a thermal curve.
Weight is plotted along the y-axis and the temperature
along the x-axis
CONTINUE…….
 The change in weight of a sample as the temperature
changes tells us several thing
 First loss of weight indicates decomposition or
evaporation of the sample .A gain weight can indicate
adsorption by the sample of a component in the
atmosphere
 Second the temperature at which no weight change take
place or determined which indicate the temperature
stability of the material
CONTINUE……
 For example :
 If pure calcium carbonate (CaCO3) is heated to
850◦C , it loses 44% of its weight
 CaCO3 → CaO + CO2
 The formation of C02 can be verified by having the
evolved gas analyzed by MS or by IR spectroscopy
 The CaO can be confirmed by analysis of the
residue by XRD or other technique
TGA INSTRUMENTATION
CONTINUE…..
 Modern TGA equipment has a sensitive balance
usually microbalance for continuously measuring
sample weight , a furnace surrounding a sample
holder , and a purge gas system for providing inert
or reactive atmosphere. A computer generally
controls the furnace and the data is collected and
processed by computer
 Modern analytical microbalance of several different
designs are commercially available
 Torsion balance
 Spring balance
 Electro balance
 TGA balance are available for sample masses from 1 to
1000mg .There are specialized high capacity TGA
system available that can accommodate samples of upto
100gram at system that can handle microgram quantities
of sample
 And sample size for TGA is very small
 A sample must be homogenous
 The balance itself must be thermally isolated from
furnace
CONFIGURATION OF FURNACE
 The horizontal
configuration was
design to minimize
buoyancy effect
 Vertical configuration
suffer from buoyancy
effect
Horizontal furnace Vertical furnace
 The furnace surrounds the sample and sample holder
 Modern instruments can be heated and cooled rapidly
the sample
 Instrument that heat at rate of up to 1000C/min are
available
 Another instrument can heat at rate upto 200◦ C/min
from room temperature to about 1200◦C
 But furnace also available for higher temperaure like
1500◦C ,1700◦C or 2400◦C but these furnace are
usefull for studying refractory material and engineering
materials
 Sample holder and any instrument parts inside the
furnace such as thermocouple that used for measuring
the temperature that must be able to withstand high
temperature and be inert at these high temperature
 Quartz platinum and various ceramics are used for the
sample holder and other parts
 The sample is place in a small pan made of Pt quartz or
ceramic
ANALYTICAL APPLICATIONS OF TGA
1- Determination of correct drying temperature for
precipitates used in gravimetric analysis.
2- Identification of the gases given off while a
sample temperature is increase.
3- The composition of the residues can be determine
using such as XRD , XRF
4- TGA is very important in determining the upper use
temperature of materials such as polymers by
identifying the temperature at which oxidative
degradation occurs on heating in air
5- TGA can be used for the identification of compounds
presents in a mixture of materials
 The uppermost curve is the weight loss curve for
pure compound A. The next lower curve is the
weight loss curve for pure compound B. The bottom
curve is the weight loss curve is the mixture of A
and B.
Thermogravimetric analysis (TGA)-1.pptx

Thermogravimetric analysis (TGA)-1.pptx

  • 1.
    THERMOGRAVIMETRIC ANALYSIS Presented by AQIBJAVED Presented to Dr Asim Fareed
  • 2.
    THERMOGRAVIMETRIC ANALYSIS (TGA) Thermogravimetric analysis measure the mass of a sample in a specified atmosphere as the temperature of the sample is programmed.  The output from a TGA experiment is a plot of mass vs temperature. The TGA plot is called a thermal curve. Weight is plotted along the y-axis and the temperature along the x-axis
  • 3.
    CONTINUE…….  The changein weight of a sample as the temperature changes tells us several thing  First loss of weight indicates decomposition or evaporation of the sample .A gain weight can indicate adsorption by the sample of a component in the atmosphere  Second the temperature at which no weight change take place or determined which indicate the temperature stability of the material
  • 4.
    CONTINUE……  For example:  If pure calcium carbonate (CaCO3) is heated to 850◦C , it loses 44% of its weight  CaCO3 → CaO + CO2
  • 6.
     The formationof C02 can be verified by having the evolved gas analyzed by MS or by IR spectroscopy  The CaO can be confirmed by analysis of the residue by XRD or other technique
  • 7.
  • 8.
    CONTINUE…..  Modern TGAequipment has a sensitive balance usually microbalance for continuously measuring sample weight , a furnace surrounding a sample holder , and a purge gas system for providing inert or reactive atmosphere. A computer generally controls the furnace and the data is collected and processed by computer
  • 9.
     Modern analyticalmicrobalance of several different designs are commercially available  Torsion balance  Spring balance  Electro balance
  • 10.
     TGA balanceare available for sample masses from 1 to 1000mg .There are specialized high capacity TGA system available that can accommodate samples of upto 100gram at system that can handle microgram quantities of sample  And sample size for TGA is very small  A sample must be homogenous  The balance itself must be thermally isolated from furnace
  • 11.
    CONFIGURATION OF FURNACE The horizontal configuration was design to minimize buoyancy effect  Vertical configuration suffer from buoyancy effect Horizontal furnace Vertical furnace
  • 12.
     The furnacesurrounds the sample and sample holder  Modern instruments can be heated and cooled rapidly the sample  Instrument that heat at rate of up to 1000C/min are available  Another instrument can heat at rate upto 200◦ C/min from room temperature to about 1200◦C  But furnace also available for higher temperaure like 1500◦C ,1700◦C or 2400◦C but these furnace are usefull for studying refractory material and engineering materials
  • 13.
     Sample holderand any instrument parts inside the furnace such as thermocouple that used for measuring the temperature that must be able to withstand high temperature and be inert at these high temperature  Quartz platinum and various ceramics are used for the sample holder and other parts  The sample is place in a small pan made of Pt quartz or ceramic
  • 14.
    ANALYTICAL APPLICATIONS OFTGA 1- Determination of correct drying temperature for precipitates used in gravimetric analysis. 2- Identification of the gases given off while a sample temperature is increase. 3- The composition of the residues can be determine using such as XRD , XRF
  • 15.
    4- TGA isvery important in determining the upper use temperature of materials such as polymers by identifying the temperature at which oxidative degradation occurs on heating in air
  • 16.
    5- TGA canbe used for the identification of compounds presents in a mixture of materials
  • 17.
     The uppermostcurve is the weight loss curve for pure compound A. The next lower curve is the weight loss curve for pure compound B. The bottom curve is the weight loss curve is the mixture of A and B.