SlideShare a Scribd company logo
Anna Ley
11/1/16
CED 450
Part One/Two
The Kuznets Curve Theory in India and Its Effects on the Rural and Urban Poor
A young boy, approximately 15 years old, cleanses his hands in the Ganges River located in Northern
India on a 2011 issue of National Geographic News. The water surrounding the boy is grey, and beneath
the boy’s feet an accumulation of dirtied plastics appears to have moved in and out with the lazy river.
The only source of color stemming from the image is the child’s yellow shirt, and a few pieces of colored
plastics- possibly discarded bottle caps. The World Bank notes that in 1990 only 71% of India’s
population had access to clean water,while the most recent estimates from 2015 indicate that up to 94%
of India’s population have access to clean water (World Bank, 2015). With such a stark improvement in
access to clean water,many are left to wonder, how did this lower-middle income country amend so
rapidly? This paper seeks to analyze how the Kuznets Curve is applicable to India’s transformation from
an agrarian economy to a service sector economy, and how this industrialization has effected India’s poor
population.
What is the Kuznets Curve Theory?
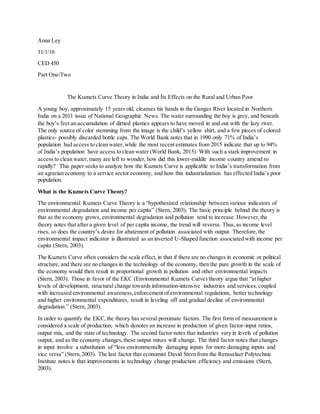
The environmental Kuznets Curve Theory is a “hypothesized relationship between various indicators of
environmental degradation and income per capita” (Stern, 2003). The basic principle behind the theory is
that as the economy grows, environmental degradation and pollution tend to increase. However,the
theory notes that after a given level of per capita income, the trend will reverse. Thus,as income level
rises, so does the country’s desire for abatement of pollution associated with output. Therefore,the
environmental impact indicator is illustrated as an inverted U-Shaped function associated with income per
capita (Stern, 2003).
The Kuznets Curve often considers the scale effect,in that if there are no changes in economic or political
structure, and there are no changes in the technology of the economy, then the pure growth in the scale of
the economy would then result in proportional growth in pollution and other environmental impacts
(Stern, 2003). Those in favor of the EKC (Environmental Kuznets Curve) theory argue that “at higher
levels of development, structural change towards information-intensive industries and services,coupled
with increased environmental awareness,enforcement of environmental regulations, better technology
and higher environmental expenditures, result in leveling off and gradual decline of environmental
degradation.” (Stern, 2003).
In order to quantify the EKC,the theory has several proximate factors. The first form of measurement is
considered a scale of production, which denotes an increase in production of given factor-input ratios,
output mix, and the state of technology. The second factor notes that industries vary in levels of pollution
output, and as the economy changes,these output mixes will change. The third factor notes that changes
in input involve a substitution of “less environmentally damaging inputs for more damaging inputs and
vice versa” (Stern,2003). The last factor that economist David Stern from the Rensselaer Polytechnic
Institute notes is that improvements in technology change production efficiency and emissions (Stern,
2003).
Stern concludes this definition by denoting that these proximate variables “may in turn be driven by
changes in underlying variables such as environmental regulation, awareness,and education in the course
of economic development” (Stern, 2003).
While recent environmental policy and education initiatives are vital in understanding how India has
improved its environment and overall standard of living, we must first investigate how the environmental
Kuznets Curve has played a role in India’s transformation from an agricultural based economy, to a
service sector economy.
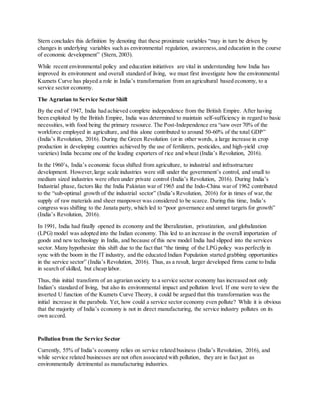
The Agrarian to Service Sector Shift
By the end of 1947, India had achieved complete independence from the British Empire. After having
been exploited by the British Empire, India was determined to maintain self-sufficiency in regard to basic
necessities, with food being the primary resource. The Post-Independence era “saw over 70% of the
workforce employed in agriculture, and this alone contributed to around 50-60% of the total GDP”
(India’s Revolution, 2016). During the Green Revolution (or in other words, a large increase in crop
production in developing countries achieved by the use of fertilizers, pesticides, and high-yield crop
varieties) India became one of the leading exporters of rice and wheat (India’s Revolution, 2016).
In the 1960’s, India’s economic focus shifted from agriculture, to industrial and infrastructure
development. However,large scale industries were still under the government’s control, and small to
medium sized industries were often under private control (India’s Revolution, 2016). During India’s
Industrial phase, factors like the India Pakistan war of 1965 and the Indo-China war of 1962 contributed
to the “sub-optimal growth of the industrial sector” (India’s Revolution, 2016) for in times of war,the
supply of raw materials and sheer manpower was considered to be scarce. During this time, India’s
congress was shifting to the Janata party, which led to “poor governance and unmet targets for growth”
(India’s Revolution, 2016).
In 1991, India had finally opened its economy and the liberalization, privatization, and globalization
(LPG) model was adopted into the Indian economy. This led to an increase in the overall importation of
goods and new technology in India, and because of this new model India had slipped into the services
sector. Many hypothesize this shift due to the fact that “the timing of the LPGpolicy was perfectly in
sync with the boom in the IT industry, and the educated Indian Population started grabbing opportunities
in the service sector” (India’s Revolution, 2016). Thus, as a result, larger developed firms came to India
in search of skilled, but cheap labor.
Thus, this initial transform of an agrarian society to a service sector economy has increased not only
Indian’s standard of living, but also its environmental impact and pollution level. If one were to view the
inverted U function of the Kuznets Curve Theory, it could be argued that this transformation was the
initial increase in the parabola. Yet, how could a service sector economy even pollute? While it is obvious
that the majority of India’s economy is not in direct manufacturing, the service industry pollutes on its
own accord.
Pollution from the Service Sector
Currently, 55% of India’s economy relies on service related business (India’s Revolution, 2016), and
while service related businesses are not often associated with pollution, they are in fact just as
environmentally detrimental as manufacturing industries.
While manufacturing products often results in obvious pollutants, such as carbon dioxide from an
automobile manufacturer,the service sector industry also pollutes through less obvious means, such as the
healthcare industry which produces solid wastes as a byproduct (Dartmouth). Sangwon Suh, an assistant
professor at the University of Minnesota notes that, “While service industries only create 5% of total
greenhouse gas emissions themselves, when the entire life cycle of the service-related product is taken
into account the picture changes dramatically. Such industries consume large quantities of electricity,
natural gas, transportation, building installations, and manufactured goods, which generate greenhouse
gases” (Dartmouth).
The problem now, and even more so sixteen years ago, is that policy makers do not have a comprehensive
understanding of the pollutants that are associated with the service sector. Thus, in order to understand
how the current policies have benefitted India, it is pertinent to understand India’s relation to the Kuznets
Curve, and how India’s preliminary policy initiatives lead to the policies that are currently in place.
India and the Environmental Kuznets Curve
Just as the EKC theory suggests, as India started to industrialize and move away from a primarily
agriculture based economy, India’s concern for the environment was thrown to the wayside, and pure
economic growth became the country’s primary focus. Shunsuke Managi, the author of an article
published in ScienceDirect titled “Environmental productivity and Kuznets curve in India” notes that the
“damage caused by pollution in India [was] estimated to cost $14 billion annually: amounting to close to
4.5% to 6% of GDP” during the years 1998 to 1999 (Managi, 2008). While the pollution in the late
1990’s was incredibly high, India, like most countries, had long been aware of the increasing levels of
pollution due to manufacturing, and inadvertently, the service sector.
In 1977, India’s first independent environmental policy was initiated. India was the first in the world to
insert an amendment into its constitution that allowed the state to protect the environment “for
safeguarding public health, forests and wildlife” (Managi, 2008). The 42nd amendment was implemented
in 1976, and went into effect January 3, 1977. Managi notes that “the Directive Principles of State Policy
(Article 47) requires not only a protectionist stance by the state but also compels the state to seek the
improvement of polluted environments” (Managi, 2008). In 1980, the Department of Environment was
created,shortly to be followed by the Air (Prevention and Control of Pollution) Act in 1981, and the
Environmental Protection Act in 1986.
Shortly after the DOE was created,it was criticized by environmental groups for “its small political and
financial base” (Managi, 2008). Environmentalist realized that the DOE merely served as an advisory
body, and had little to no real enforcement capabilities. This deficit was quickly realized by the
government, and the Ministry of Environment and Forests (MoEF) was created in 1985.
However,none of these newly enacted policies and organizations were able to alter the propulsion and the
drive of the newly emerging service sector economy, and due to the fact that the majority of these policies
were growth based, combined with poor market regulations, the expansion of the economy continued to
take heavy toll on the environment (Managi, 2008).
Many economists argue that the reason that these policies had failed, was merely due to a fragmentation
in agencies that all had different policy mandates. This fragmentation, combined with a lack of trained
personnel and a comprehensive database was what ultimately delayed a majority of environmental
abatement projects. Managi notes that “most of the state government institutions [were] relatively small
suffering from inadequacy of technical staff and resources” (Managi, 2008). It was obvious in hindsight
that these policies were ineffective, and disjointed, with no real support system. Thus, the pollution levels
continued to rise.
Like most theories, the EKC model is not yet applicable to the entire country of India. The model is
currently more or less is dependent on specific points in time, and variables within a given place. The
article “Environmental productivity and Kuznets curve in India” specifies in its model section that the
EKC theory is expected to be the most applicable in higher income regions that “would be more sensitive
towards implementing environmental regulations thereby curbing pollution” (Managi, 2008). For
example, Managi’s research found that the “productivity of SO2 improves in states like Andhra Pradesh,
Gujarat, Haryana,Madhya Pradesh,Maharashtra,Punjab, Rajasthan, Uttar Pradesh,and West Bengal
after 1999; where as in other states the productivity decline monotonously” and they concluded that in
general “the environmental productivities” in other words the natural resources used and residuals
produced per unit of useful output “decrease more in high-income states than in the low-income states”
(Managi, 2008).
So why does environmental abatement and or a decrease in pollution output occur when there is a rise in
income? Managi argues that there is a positive association between “the education index variable and
environmental productivity”, therefore as the education level in the society rises, so does the society’s
concern for the environment. There is also another factor involved that is not interrelated to income level
or education, and that factor is urbanization. As urbanization increases,there is an increase in
environmental degradation.
With the relatively ineffective policies that were implemented from the 1970’s to the late 1990’s the
pollution continued to increase, with the poor taking the brunt of the consequences associated with an
ever deteriorating environment.
The Effect ofPollution on the Poor
As India’s economy continued to expand, so did the overwhelming number of cases regarding polluted
water bodies. Klas Ringskog, author of “INDIA: Environmental Sustainability in the 1990s” states that,
“Unsafe drinking water,contaminated by human and industrial waste [were] estimated to be the biggest
environmental burden, with the poor suffering disproportionately” (Ringskog, 2002). In 1987, Ringskog
stated that nearly “60% of all deaths in urban areas were due to water-related diseases such as cholera,
dysentery, and gastroenteritis”. As time progressed, it was evident that industries were spewing out
chemical agents,fertilizers, pesticides, and contaminated silt, with little to no recourse from the
government. Thus, power plants continued to pollute rivers with coal washing effluents and thermal
pollution with no regard for communities down stream.
The World Bank wrote an article titled, “Environmental Health in India”, that notes that environmental
health risks can be broken down into two categories: traditional hazards and modern hazards. Traditional
hazards typically refer to a lack of development, such as a “lack of safe water,inadequate sanitation and
waste disposal, indoor air pollution, and vector-borne diseases” and modern hazards are typically “caused
by development that lacks environmental safeguards,such as urban air pollution and exposure to agro-
industrial chemicals and waste” (World Bank, 2001).
The World Bank argues that the prevalence of traditional health risks, caused by inadequate access to
infrastructure services,makes environmental health a poverty related issue. He notes that in rural areas,
environmental factors accounted for “22–23 percent of the burden of disease” which was significantly
higher than that of urban areas (World Bank, 2001). He claims that this was almost entirely caused by a
sheer lack of adequate water and sanitation facilities, as well as a prolonged exposure to indoor air
pollution. He notes that while urban households have an increased access to water and sanitation services,
“18-19 percent” of urban households were still victims of environmentally related disease (World Bank,
2001). Collectively, those of a lower socioeconomic status were plagued with roughly 40 percent of
environmentally associated diseases.
The Road to Recovery
It is evident that the initial environmental policies in India were underfunded and disjointed, consequently
making government enforcement of these regulations nearly impossible. Thus, as India’s economy and
population continued to grow and expand, the “potential” environmental repercussions were shoved to the
wayside.
To reiterate,this growth and utter disregard merely strengthens the Kuznets Curve theory in that as “the
economy grows, environmental degradation and pollution tend to increase” (Stern,2003). What we have
yet to investigate is the latter part of the Kuznets Curve theory in that, “after a given level of per capita
income, the trend will reverse” (Stern,2003). While this theory has certainly proved true in higher income
cities like Maharashtra and Punjab in the specific model hypothesized and tested by Shunsuke Managi,
the author of “Environmental productivity and Kuznets curve in India”, the true test relies on the overall
applicability of the Environmental Kuznets Curve to the country of India as whole.
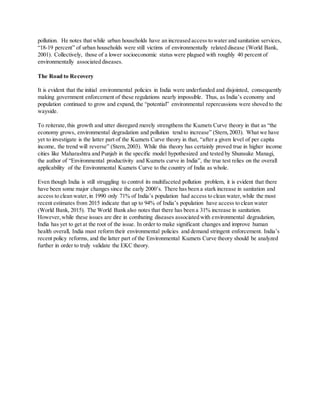
Even though India is still struggling to control its multifaceted pollution problem, it is evident that there
have been some major changes since the early 2000’s. There has been a stark increase in sanitation and
access to clean water,in 1990 only 71% of India’s population had access to clean water,while the most
recent estimates from 2015 indicate that up to 94% of India’s population have access to clean water
(World Bank, 2015). The World Bank also notes that there has been a 31% increase in sanitation.
However,while these issues are dire in combating diseases associated with environmental degradation,
India has yet to get at the root of the issue. In order to make significant changes and improve human
health overall, India must reform their environmental policies and demand stringent enforcement. India’s
recent policy reforms, and the latter part of the Environmental Kuznets Curve theory should be analyzed
further in order to truly validate the EKC theory.
Works Cited
ENVIRONMENTAL HEALTH IN INDIA Priorities in Andhra Pradesh. (2001, October). Retrieved
November 8, 2016
Environmental Issues in the Service Industry. (2016, November). Lecture presented at Dartmouth College
in New Hampshire, Hanover.
India’s evolution from agrarian to manufacturing to services economy. (2016, May 14). Retrieved
November 8, 2016
Managi, S., & Jena, P. (2008, April 1). Environmental productivity and Kuznets curve in India.
Ecological Economics, 65(2), 432-440.
Improved water source (% of population with access) [Chart]. In WHO/UNICEF Joint Monitoring
Programme ( JMP ) for Water Supply and Sanitation.
Ringskog, K.,& Chow, N. (n.d.). INDIA:Environmental Sustainability in the 1990s. THE WORLD
BANK OPERATIONS EVALUATION.
Stern, D. (2003, June). The Environmental Kuznets Curve. International Society for Ecological
Economics.

More Related Content

What's hot

Ecosystem Service Valuation winslow
Ecosystem Service Valuation winslowEcosystem Service Valuation winslow
Ecosystem Service Valuation winslow
maggiewinslow
 
Climate change and vulnerability assessment in agriculture
Climate change and vulnerability assessment in agricultureClimate change and vulnerability assessment in agriculture
Climate change and vulnerability assessment in agriculture
Dr. Rupan Raghuvanshi
 
Paris agreement
Paris agreementParis agreement
Paris agreement
Thakur Shashank
 
Understanding UNFCCC Conferences of Parties
Understanding UNFCCC Conferences of PartiesUnderstanding UNFCCC Conferences of Parties
Understanding UNFCCC Conferences of PartiesCharles Ehrhart
 
contribution of cities on Climate change ppt
contribution of cities on Climate change pptcontribution of cities on Climate change ppt
contribution of cities on Climate change ppt
Syed Kashif Shah
 
Urban Air Pollution in Developing Country Megacities - Michael P. Walsh
Urban Air Pollution in Developing Country Megacities - Michael P. WalshUrban Air Pollution in Developing Country Megacities - Michael P. Walsh
Urban Air Pollution in Developing Country Megacities - Michael P. Walsh
WRI Ross Center for Sustainable Cities
 
Module 10 - Section 1 Introduction: adaptation, mitigation & energy & climate...
Module 10 - Section 1 Introduction: adaptation, mitigation & energy & climate...Module 10 - Section 1 Introduction: adaptation, mitigation & energy & climate...
Module 10 - Section 1 Introduction: adaptation, mitigation & energy & climate...
Richard Labelle
 
Poverty-Environment Nexus - Indian Economic Development
Poverty-Environment Nexus - Indian Economic DevelopmentPoverty-Environment Nexus - Indian Economic Development
Poverty-Environment Nexus - Indian Economic Development
Ashish Bharadwaj
 
Greenhouse gas (GHG) emissions & priority action in climate mitigation in the...
Greenhouse gas (GHG) emissions & priority action in climate mitigation in the...Greenhouse gas (GHG) emissions & priority action in climate mitigation in the...
Greenhouse gas (GHG) emissions & priority action in climate mitigation in the...
CCAFS | CGIAR Research Program on Climate Change, Agriculture and Food Security
 
Effectiveness of Environmental Impact Assessment (EIA): Bangladesh Perspective
Effectiveness of Environmental Impact Assessment (EIA):  Bangladesh PerspectiveEffectiveness of Environmental Impact Assessment (EIA):  Bangladesh Perspective
Effectiveness of Environmental Impact Assessment (EIA): Bangladesh Perspective
Shahadat Hossain Shakil
 
NR kurznets curve.pptx
NR kurznets curve.pptxNR kurznets curve.pptx
NR kurznets curve.pptx
PriyadharshanBobby
 
Ecosystem-based approaches to mitigation and adaptation at landscape and seas...
Ecosystem-based approaches to mitigation and adaptation at landscape and seas...Ecosystem-based approaches to mitigation and adaptation at landscape and seas...
Ecosystem-based approaches to mitigation and adaptation at landscape and seas...
CIFOR-ICRAF
 
UNFCCC
UNFCCCUNFCCC
UNFCCC
Shivam Sood
 
effects of economic growth on environment
effects of economic growth on environmenteffects of economic growth on environment
effects of economic growth on environment
Kamaljit Singh
 
The Kyoto Protocol
The Kyoto ProtocolThe Kyoto Protocol
The Kyoto ProtocolMaria Foster
 
Stern Review On The Economics Of Climate Change
Stern Review On The Economics Of Climate ChangeStern Review On The Economics Of Climate Change
Stern Review On The Economics Of Climate Change
BioLogicalSolutions
 
climate change Policy
climate change Policyclimate change Policy
climate change Policy
Samia Sultana
 
Kyoto protocol
Kyoto protocolKyoto protocol
Kyoto protocol
AvantikaBadgujar
 
Module 3 power point presentation 20140520
Module 3 power point presentation 20140520Module 3 power point presentation 20140520
Module 3 power point presentation 20140520Nkosilathi Mpala
 

What's hot (20)

Ecosystem Service Valuation winslow
Ecosystem Service Valuation winslowEcosystem Service Valuation winslow
Ecosystem Service Valuation winslow
 
Climate change and vulnerability assessment in agriculture
Climate change and vulnerability assessment in agricultureClimate change and vulnerability assessment in agriculture
Climate change and vulnerability assessment in agriculture
 
Paris agreement
Paris agreementParis agreement
Paris agreement
 
Understanding UNFCCC Conferences of Parties
Understanding UNFCCC Conferences of PartiesUnderstanding UNFCCC Conferences of Parties
Understanding UNFCCC Conferences of Parties
 
contribution of cities on Climate change ppt
contribution of cities on Climate change pptcontribution of cities on Climate change ppt
contribution of cities on Climate change ppt
 
Urban Air Pollution in Developing Country Megacities - Michael P. Walsh
Urban Air Pollution in Developing Country Megacities - Michael P. WalshUrban Air Pollution in Developing Country Megacities - Michael P. Walsh
Urban Air Pollution in Developing Country Megacities - Michael P. Walsh
 
Module 10 - Section 1 Introduction: adaptation, mitigation & energy & climate...
Module 10 - Section 1 Introduction: adaptation, mitigation & energy & climate...Module 10 - Section 1 Introduction: adaptation, mitigation & energy & climate...
Module 10 - Section 1 Introduction: adaptation, mitigation & energy & climate...
 
Poverty-Environment Nexus - Indian Economic Development
Poverty-Environment Nexus - Indian Economic DevelopmentPoverty-Environment Nexus - Indian Economic Development
Poverty-Environment Nexus - Indian Economic Development
 
Greenhouse gas (GHG) emissions & priority action in climate mitigation in the...
Greenhouse gas (GHG) emissions & priority action in climate mitigation in the...Greenhouse gas (GHG) emissions & priority action in climate mitigation in the...
Greenhouse gas (GHG) emissions & priority action in climate mitigation in the...
 
Effectiveness of Environmental Impact Assessment (EIA): Bangladesh Perspective
Effectiveness of Environmental Impact Assessment (EIA):  Bangladesh PerspectiveEffectiveness of Environmental Impact Assessment (EIA):  Bangladesh Perspective
Effectiveness of Environmental Impact Assessment (EIA): Bangladesh Perspective
 
NR kurznets curve.pptx
NR kurznets curve.pptxNR kurznets curve.pptx
NR kurznets curve.pptx
 
Ecosystem-based approaches to mitigation and adaptation at landscape and seas...
Ecosystem-based approaches to mitigation and adaptation at landscape and seas...Ecosystem-based approaches to mitigation and adaptation at landscape and seas...
Ecosystem-based approaches to mitigation and adaptation at landscape and seas...
 
UNFCCC
UNFCCCUNFCCC
UNFCCC
 
effects of economic growth on environment
effects of economic growth on environmenteffects of economic growth on environment
effects of economic growth on environment
 
The Kyoto Protocol
The Kyoto ProtocolThe Kyoto Protocol
The Kyoto Protocol
 
The Kyoto Protocol
The Kyoto ProtocolThe Kyoto Protocol
The Kyoto Protocol
 
Stern Review On The Economics Of Climate Change
Stern Review On The Economics Of Climate ChangeStern Review On The Economics Of Climate Change
Stern Review On The Economics Of Climate Change
 
climate change Policy
climate change Policyclimate change Policy
climate change Policy
 
Kyoto protocol
Kyoto protocolKyoto protocol
Kyoto protocol
 
Module 3 power point presentation 20140520
Module 3 power point presentation 20140520Module 3 power point presentation 20140520
Module 3 power point presentation 20140520
 

Viewers also liked

Tania goel kuznets curve
Tania goel kuznets curveTania goel kuznets curve
Tania goel kuznets curve
Tania goel
 
Env Economics
Env EconomicsEnv Economics
Env Economics
chayamitra
 
EKC Analysis For Resource Use
EKC Analysis For Resource UseEKC Analysis For Resource Use
EKC Analysis For Resource Use
Alejo Etchart Ortiz
 
Resources Economics. Jon M.Conrad. Chapter 1
Resources Economics. Jon M.Conrad. Chapter 1Resources Economics. Jon M.Conrad. Chapter 1
Resources Economics. Jon M.Conrad. Chapter 1UGRME
 
ravi shankar asset allocation
ravi shankar asset allocationravi shankar asset allocation
ravi shankar asset allocationEr. RAVI SHANKAR
 
The problem of social cost
The problem of social costThe problem of social cost
The problem of social cost
Mikhail Dubov
 
Lecture 6 - Economic growth: an evolutionary view
Lecture 6 - Economic growth: an evolutionary viewLecture 6 - Economic growth: an evolutionary view
Lecture 6 - Economic growth: an evolutionary viewUNU.MERIT
 
Planning Process for Economic Development in Pakistan
Planning Process for Economic Development in PakistanPlanning Process for Economic Development in Pakistan
Planning Process for Economic Development in Pakistan
Sustainable Development Policy Institute
 
agricultural problems in Pakistan
agricultural problems in Pakistan agricultural problems in Pakistan
agricultural problems in Pakistan
Ammara Jabeen
 
Role of Agriculture in Economic Development of Pakistan
Role of Agriculture in Economic Development of PakistanRole of Agriculture in Economic Development of Pakistan
Role of Agriculture in Economic Development of PakistanGHS Kot Takht Bhai Mardan
 
Development Planning Process in Pakistan
Development Planning Process in PakistanDevelopment Planning Process in Pakistan
Development Planning Process in Pakistan
Sustainable Development Policy Institute
 
agriculture of pakistan
agriculture of pakistanagriculture of pakistan
agriculture of pakistan
Umair Riaz
 
The importance of foreign direct investment
The importance of foreign direct investmentThe importance of foreign direct investment
The importance of foreign direct investment
nurelveana
 
Types of FDI
Types of FDITypes of FDI
Foreign Direct Investment
Foreign Direct InvestmentForeign Direct Investment
Foreign Direct InvestmentIstek Schools
 
FDI , its advantages and disadvantages
FDI , its advantages and disadvantagesFDI , its advantages and disadvantages
FDI , its advantages and disadvantagesRupal Tiwari
 
Economic growth and economic development
Economic growth and economic developmentEconomic growth and economic development
Economic growth and economic development
Sweetp999
 

Viewers also liked (20)

Tania goel kuznets curve
Tania goel kuznets curveTania goel kuznets curve
Tania goel kuznets curve
 
Env Economics
Env EconomicsEnv Economics
Env Economics
 
EKC
EKCEKC
EKC
 
EKC Analysis For Resource Use
EKC Analysis For Resource UseEKC Analysis For Resource Use
EKC Analysis For Resource Use
 
Resources Economics. Jon M.Conrad. Chapter 1
Resources Economics. Jon M.Conrad. Chapter 1Resources Economics. Jon M.Conrad. Chapter 1
Resources Economics. Jon M.Conrad. Chapter 1
 
ravi shankar asset allocation
ravi shankar asset allocationravi shankar asset allocation
ravi shankar asset allocation
 
The problem of social cost
The problem of social costThe problem of social cost
The problem of social cost
 
Lecture 6 - Economic growth: an evolutionary view
Lecture 6 - Economic growth: an evolutionary viewLecture 6 - Economic growth: an evolutionary view
Lecture 6 - Economic growth: an evolutionary view
 
Planning Process for Economic Development in Pakistan
Planning Process for Economic Development in PakistanPlanning Process for Economic Development in Pakistan
Planning Process for Economic Development in Pakistan
 
agricultural problems in Pakistan
agricultural problems in Pakistan agricultural problems in Pakistan
agricultural problems in Pakistan
 
Role of Agriculture in Economic Development of Pakistan
Role of Agriculture in Economic Development of PakistanRole of Agriculture in Economic Development of Pakistan
Role of Agriculture in Economic Development of Pakistan
 
Development Planning Process in Pakistan
Development Planning Process in PakistanDevelopment Planning Process in Pakistan
Development Planning Process in Pakistan
 
agriculture of pakistan
agriculture of pakistanagriculture of pakistan
agriculture of pakistan
 
The importance of foreign direct investment
The importance of foreign direct investmentThe importance of foreign direct investment
The importance of foreign direct investment
 
Types of FDI
Types of FDITypes of FDI
Types of FDI
 
Agriculture in pakistan
Agriculture in pakistanAgriculture in pakistan
Agriculture in pakistan
 
Foreign Direct Investment
Foreign Direct InvestmentForeign Direct Investment
Foreign Direct Investment
 
FDI , its advantages and disadvantages
FDI , its advantages and disadvantagesFDI , its advantages and disadvantages
FDI , its advantages and disadvantages
 
Fdi ppt
Fdi pptFdi ppt
Fdi ppt
 
Economic growth and economic development
Economic growth and economic developmentEconomic growth and economic development
Economic growth and economic development
 

Similar to The_Kuznets_Curve_Theory (1)

Environmental isues in india:SSB Lec/Gp Dis 41
Environmental isues in india:SSB Lec/Gp Dis 41Environmental isues in india:SSB Lec/Gp Dis 41
Environmental isues in india:SSB Lec/Gp Dis 41
Col Mukteshwar Prasad
 
Am04602264269
Am04602264269Am04602264269
Am04602264269
IJERA Editor
 
DhanapalUrbanClimate.pdf
DhanapalUrbanClimate.pdfDhanapalUrbanClimate.pdf
DhanapalUrbanClimate.pdf
Ankit1922
 
Environmental auditing and sustainable development in nigeria
Environmental auditing and sustainable development in nigeriaEnvironmental auditing and sustainable development in nigeria
Environmental auditing and sustainable development in nigeria
Alexander Decker
 
“Technological solution for rural sanitation structure A Case Study Of Village.”
“Technological solution for rural sanitation structure A Case Study Of Village.”“Technological solution for rural sanitation structure A Case Study Of Village.”
“Technological solution for rural sanitation structure A Case Study Of Village.”
IRJET Journal
 
Integrating Environmental Accounting in Agro-Allied and Manufacturing Indust...
Integrating Environmental Accounting in Agro-Allied and  Manufacturing Indust...Integrating Environmental Accounting in Agro-Allied and  Manufacturing Indust...
Integrating Environmental Accounting in Agro-Allied and Manufacturing Indust...
IJMER
 
Integrating Environmental Accounting in Agro-Allied and Manufacturing Industr...
Integrating Environmental Accounting in Agro-Allied and Manufacturing Industr...Integrating Environmental Accounting in Agro-Allied and Manufacturing Industr...
Integrating Environmental Accounting in Agro-Allied and Manufacturing Industr...
IJMER
 
Developing Corporate Social Responsibility for a Sustainable Food System in H...
Developing Corporate Social Responsibility for a Sustainable Food System in H...Developing Corporate Social Responsibility for a Sustainable Food System in H...
Developing Corporate Social Responsibility for a Sustainable Food System in H...11leeco
 
IRJET- A Review of Studies on Sustainable Development
IRJET- A Review of Studies on Sustainable DevelopmentIRJET- A Review of Studies on Sustainable Development
IRJET- A Review of Studies on Sustainable Development
IRJET Journal
 
Analysing The Environmental Impact Assessment Systems...
Analysing The Environmental Impact Assessment Systems...Analysing The Environmental Impact Assessment Systems...
Analysing The Environmental Impact Assessment Systems...
Tammy Majors
 
Innovation and Sustainable Development: The Question of Energy Efficiency
Innovation and Sustainable Development: The Question of Energy EfficiencyInnovation and Sustainable Development: The Question of Energy Efficiency
Innovation and Sustainable Development: The Question of Energy Efficiency
IOSR Journals
 
Environmental issues in india
Environmental issues in indiaEnvironmental issues in india
Environmental issues in india
nayaklucky
 
Critical analysis why growth is good
Critical analysis why growth is goodCritical analysis why growth is good
Critical analysis why growth is good
Влад Панасенко
 
DOC-20230920-WA0030.pptx
DOC-20230920-WA0030.pptxDOC-20230920-WA0030.pptx
DOC-20230920-WA0030.pptx
sharmilaperla
 
Urbanisation Essay
Urbanisation EssayUrbanisation Essay
Urbanisation Essay
Custom Paper Writing Services
 
A Study on the Effect of Climate Emergency in Urban India and with Growing Po...
A Study on the Effect of Climate Emergency in Urban India and with Growing Po...A Study on the Effect of Climate Emergency in Urban India and with Growing Po...
A Study on the Effect of Climate Emergency in Urban India and with Growing Po...
ijtsrd
 
AN EMPIRICAL STUDY OF PUBLIC’S OPINION ON GLOBAL WARMING AND SUSTAINABLE DEVE...
AN EMPIRICAL STUDY OF PUBLIC’S OPINION ON GLOBAL WARMING AND SUSTAINABLE DEVE...AN EMPIRICAL STUDY OF PUBLIC’S OPINION ON GLOBAL WARMING AND SUSTAINABLE DEVE...
AN EMPIRICAL STUDY OF PUBLIC’S OPINION ON GLOBAL WARMING AND SUSTAINABLE DEVE...
Sri Sathya Sai University
 
Road Transport in Urban India: Its Implications on Health
Road Transport in Urban India: Its Implications  on HealthRoad Transport in Urban India: Its Implications  on Health
Road Transport in Urban India: Its Implications on Health
Rohit Sharma
 
The adverse impact of ecosystem degradation and poor governance on marginaliz...
The adverse impact of ecosystem degradation and poor governance on marginaliz...The adverse impact of ecosystem degradation and poor governance on marginaliz...
The adverse impact of ecosystem degradation and poor governance on marginaliz...
NAAR Journal
 
Complete paper arbaaz & suhail
Complete paper arbaaz & suhailComplete paper arbaaz & suhail
Complete paper arbaaz & suhailArbaaz khan
 

Similar to The_Kuznets_Curve_Theory (1) (20)

Environmental isues in india:SSB Lec/Gp Dis 41
Environmental isues in india:SSB Lec/Gp Dis 41Environmental isues in india:SSB Lec/Gp Dis 41
Environmental isues in india:SSB Lec/Gp Dis 41
 
Am04602264269
Am04602264269Am04602264269
Am04602264269
 
DhanapalUrbanClimate.pdf
DhanapalUrbanClimate.pdfDhanapalUrbanClimate.pdf
DhanapalUrbanClimate.pdf
 
Environmental auditing and sustainable development in nigeria
Environmental auditing and sustainable development in nigeriaEnvironmental auditing and sustainable development in nigeria
Environmental auditing and sustainable development in nigeria
 
“Technological solution for rural sanitation structure A Case Study Of Village.”
“Technological solution for rural sanitation structure A Case Study Of Village.”“Technological solution for rural sanitation structure A Case Study Of Village.”
“Technological solution for rural sanitation structure A Case Study Of Village.”
 
Integrating Environmental Accounting in Agro-Allied and Manufacturing Indust...
Integrating Environmental Accounting in Agro-Allied and  Manufacturing Indust...Integrating Environmental Accounting in Agro-Allied and  Manufacturing Indust...
Integrating Environmental Accounting in Agro-Allied and Manufacturing Indust...
 
Integrating Environmental Accounting in Agro-Allied and Manufacturing Industr...
Integrating Environmental Accounting in Agro-Allied and Manufacturing Industr...Integrating Environmental Accounting in Agro-Allied and Manufacturing Industr...
Integrating Environmental Accounting in Agro-Allied and Manufacturing Industr...
 
Developing Corporate Social Responsibility for a Sustainable Food System in H...
Developing Corporate Social Responsibility for a Sustainable Food System in H...Developing Corporate Social Responsibility for a Sustainable Food System in H...
Developing Corporate Social Responsibility for a Sustainable Food System in H...
 
IRJET- A Review of Studies on Sustainable Development
IRJET- A Review of Studies on Sustainable DevelopmentIRJET- A Review of Studies on Sustainable Development
IRJET- A Review of Studies on Sustainable Development
 
Analysing The Environmental Impact Assessment Systems...
Analysing The Environmental Impact Assessment Systems...Analysing The Environmental Impact Assessment Systems...
Analysing The Environmental Impact Assessment Systems...
 
Innovation and Sustainable Development: The Question of Energy Efficiency
Innovation and Sustainable Development: The Question of Energy EfficiencyInnovation and Sustainable Development: The Question of Energy Efficiency
Innovation and Sustainable Development: The Question of Energy Efficiency
 
Environmental issues in india
Environmental issues in indiaEnvironmental issues in india
Environmental issues in india
 
Critical analysis why growth is good
Critical analysis why growth is goodCritical analysis why growth is good
Critical analysis why growth is good
 
DOC-20230920-WA0030.pptx
DOC-20230920-WA0030.pptxDOC-20230920-WA0030.pptx
DOC-20230920-WA0030.pptx
 
Urbanisation Essay
Urbanisation EssayUrbanisation Essay
Urbanisation Essay
 
A Study on the Effect of Climate Emergency in Urban India and with Growing Po...
A Study on the Effect of Climate Emergency in Urban India and with Growing Po...A Study on the Effect of Climate Emergency in Urban India and with Growing Po...
A Study on the Effect of Climate Emergency in Urban India and with Growing Po...
 
AN EMPIRICAL STUDY OF PUBLIC’S OPINION ON GLOBAL WARMING AND SUSTAINABLE DEVE...
AN EMPIRICAL STUDY OF PUBLIC’S OPINION ON GLOBAL WARMING AND SUSTAINABLE DEVE...AN EMPIRICAL STUDY OF PUBLIC’S OPINION ON GLOBAL WARMING AND SUSTAINABLE DEVE...
AN EMPIRICAL STUDY OF PUBLIC’S OPINION ON GLOBAL WARMING AND SUSTAINABLE DEVE...
 
Road Transport in Urban India: Its Implications on Health
Road Transport in Urban India: Its Implications  on HealthRoad Transport in Urban India: Its Implications  on Health
Road Transport in Urban India: Its Implications on Health
 
The adverse impact of ecosystem degradation and poor governance on marginaliz...
The adverse impact of ecosystem degradation and poor governance on marginaliz...The adverse impact of ecosystem degradation and poor governance on marginaliz...
The adverse impact of ecosystem degradation and poor governance on marginaliz...
 
Complete paper arbaaz & suhail
Complete paper arbaaz & suhailComplete paper arbaaz & suhail
Complete paper arbaaz & suhail
 

The_Kuznets_Curve_Theory (1)

  • 1. Anna Ley 11/1/16 CED 450 Part One/Two The Kuznets Curve Theory in India and Its Effects on the Rural and Urban Poor A young boy, approximately 15 years old, cleanses his hands in the Ganges River located in Northern India on a 2011 issue of National Geographic News. The water surrounding the boy is grey, and beneath the boy’s feet an accumulation of dirtied plastics appears to have moved in and out with the lazy river. The only source of color stemming from the image is the child’s yellow shirt, and a few pieces of colored plastics- possibly discarded bottle caps. The World Bank notes that in 1990 only 71% of India’s population had access to clean water,while the most recent estimates from 2015 indicate that up to 94% of India’s population have access to clean water (World Bank, 2015). With such a stark improvement in access to clean water,many are left to wonder, how did this lower-middle income country amend so rapidly? This paper seeks to analyze how the Kuznets Curve is applicable to India’s transformation from an agrarian economy to a service sector economy, and how this industrialization has effected India’s poor population. What is the Kuznets Curve Theory? The environmental Kuznets Curve Theory is a “hypothesized relationship between various indicators of environmental degradation and income per capita” (Stern, 2003). The basic principle behind the theory is that as the economy grows, environmental degradation and pollution tend to increase. However,the theory notes that after a given level of per capita income, the trend will reverse. Thus,as income level rises, so does the country’s desire for abatement of pollution associated with output. Therefore,the environmental impact indicator is illustrated as an inverted U-Shaped function associated with income per capita (Stern, 2003). The Kuznets Curve often considers the scale effect,in that if there are no changes in economic or political structure, and there are no changes in the technology of the economy, then the pure growth in the scale of the economy would then result in proportional growth in pollution and other environmental impacts (Stern, 2003). Those in favor of the EKC (Environmental Kuznets Curve) theory argue that “at higher levels of development, structural change towards information-intensive industries and services,coupled with increased environmental awareness,enforcement of environmental regulations, better technology and higher environmental expenditures, result in leveling off and gradual decline of environmental degradation.” (Stern, 2003). In order to quantify the EKC,the theory has several proximate factors. The first form of measurement is considered a scale of production, which denotes an increase in production of given factor-input ratios, output mix, and the state of technology. The second factor notes that industries vary in levels of pollution output, and as the economy changes,these output mixes will change. The third factor notes that changes in input involve a substitution of “less environmentally damaging inputs for more damaging inputs and vice versa” (Stern,2003). The last factor that economist David Stern from the Rensselaer Polytechnic Institute notes is that improvements in technology change production efficiency and emissions (Stern, 2003).
  • 2. Stern concludes this definition by denoting that these proximate variables “may in turn be driven by changes in underlying variables such as environmental regulation, awareness,and education in the course of economic development” (Stern, 2003). While recent environmental policy and education initiatives are vital in understanding how India has improved its environment and overall standard of living, we must first investigate how the environmental Kuznets Curve has played a role in India’s transformation from an agricultural based economy, to a service sector economy. The Agrarian to Service Sector Shift By the end of 1947, India had achieved complete independence from the British Empire. After having been exploited by the British Empire, India was determined to maintain self-sufficiency in regard to basic necessities, with food being the primary resource. The Post-Independence era “saw over 70% of the workforce employed in agriculture, and this alone contributed to around 50-60% of the total GDP” (India’s Revolution, 2016). During the Green Revolution (or in other words, a large increase in crop production in developing countries achieved by the use of fertilizers, pesticides, and high-yield crop varieties) India became one of the leading exporters of rice and wheat (India’s Revolution, 2016). In the 1960’s, India’s economic focus shifted from agriculture, to industrial and infrastructure development. However,large scale industries were still under the government’s control, and small to medium sized industries were often under private control (India’s Revolution, 2016). During India’s Industrial phase, factors like the India Pakistan war of 1965 and the Indo-China war of 1962 contributed to the “sub-optimal growth of the industrial sector” (India’s Revolution, 2016) for in times of war,the supply of raw materials and sheer manpower was considered to be scarce. During this time, India’s congress was shifting to the Janata party, which led to “poor governance and unmet targets for growth” (India’s Revolution, 2016). In 1991, India had finally opened its economy and the liberalization, privatization, and globalization (LPG) model was adopted into the Indian economy. This led to an increase in the overall importation of goods and new technology in India, and because of this new model India had slipped into the services sector. Many hypothesize this shift due to the fact that “the timing of the LPGpolicy was perfectly in sync with the boom in the IT industry, and the educated Indian Population started grabbing opportunities in the service sector” (India’s Revolution, 2016). Thus, as a result, larger developed firms came to India in search of skilled, but cheap labor. Thus, this initial transform of an agrarian society to a service sector economy has increased not only Indian’s standard of living, but also its environmental impact and pollution level. If one were to view the inverted U function of the Kuznets Curve Theory, it could be argued that this transformation was the initial increase in the parabola. Yet, how could a service sector economy even pollute? While it is obvious that the majority of India’s economy is not in direct manufacturing, the service industry pollutes on its own accord. Pollution from the Service Sector Currently, 55% of India’s economy relies on service related business (India’s Revolution, 2016), and while service related businesses are not often associated with pollution, they are in fact just as environmentally detrimental as manufacturing industries.
  • 3. While manufacturing products often results in obvious pollutants, such as carbon dioxide from an automobile manufacturer,the service sector industry also pollutes through less obvious means, such as the healthcare industry which produces solid wastes as a byproduct (Dartmouth). Sangwon Suh, an assistant professor at the University of Minnesota notes that, “While service industries only create 5% of total greenhouse gas emissions themselves, when the entire life cycle of the service-related product is taken into account the picture changes dramatically. Such industries consume large quantities of electricity, natural gas, transportation, building installations, and manufactured goods, which generate greenhouse gases” (Dartmouth). The problem now, and even more so sixteen years ago, is that policy makers do not have a comprehensive understanding of the pollutants that are associated with the service sector. Thus, in order to understand how the current policies have benefitted India, it is pertinent to understand India’s relation to the Kuznets Curve, and how India’s preliminary policy initiatives lead to the policies that are currently in place. India and the Environmental Kuznets Curve Just as the EKC theory suggests, as India started to industrialize and move away from a primarily agriculture based economy, India’s concern for the environment was thrown to the wayside, and pure economic growth became the country’s primary focus. Shunsuke Managi, the author of an article published in ScienceDirect titled “Environmental productivity and Kuznets curve in India” notes that the “damage caused by pollution in India [was] estimated to cost $14 billion annually: amounting to close to 4.5% to 6% of GDP” during the years 1998 to 1999 (Managi, 2008). While the pollution in the late 1990’s was incredibly high, India, like most countries, had long been aware of the increasing levels of pollution due to manufacturing, and inadvertently, the service sector. In 1977, India’s first independent environmental policy was initiated. India was the first in the world to insert an amendment into its constitution that allowed the state to protect the environment “for safeguarding public health, forests and wildlife” (Managi, 2008). The 42nd amendment was implemented in 1976, and went into effect January 3, 1977. Managi notes that “the Directive Principles of State Policy (Article 47) requires not only a protectionist stance by the state but also compels the state to seek the improvement of polluted environments” (Managi, 2008). In 1980, the Department of Environment was created,shortly to be followed by the Air (Prevention and Control of Pollution) Act in 1981, and the Environmental Protection Act in 1986. Shortly after the DOE was created,it was criticized by environmental groups for “its small political and financial base” (Managi, 2008). Environmentalist realized that the DOE merely served as an advisory body, and had little to no real enforcement capabilities. This deficit was quickly realized by the government, and the Ministry of Environment and Forests (MoEF) was created in 1985. However,none of these newly enacted policies and organizations were able to alter the propulsion and the drive of the newly emerging service sector economy, and due to the fact that the majority of these policies were growth based, combined with poor market regulations, the expansion of the economy continued to take heavy toll on the environment (Managi, 2008). Many economists argue that the reason that these policies had failed, was merely due to a fragmentation in agencies that all had different policy mandates. This fragmentation, combined with a lack of trained personnel and a comprehensive database was what ultimately delayed a majority of environmental abatement projects. Managi notes that “most of the state government institutions [were] relatively small suffering from inadequacy of technical staff and resources” (Managi, 2008). It was obvious in hindsight
  • 4. that these policies were ineffective, and disjointed, with no real support system. Thus, the pollution levels continued to rise. Like most theories, the EKC model is not yet applicable to the entire country of India. The model is currently more or less is dependent on specific points in time, and variables within a given place. The article “Environmental productivity and Kuznets curve in India” specifies in its model section that the EKC theory is expected to be the most applicable in higher income regions that “would be more sensitive towards implementing environmental regulations thereby curbing pollution” (Managi, 2008). For example, Managi’s research found that the “productivity of SO2 improves in states like Andhra Pradesh, Gujarat, Haryana,Madhya Pradesh,Maharashtra,Punjab, Rajasthan, Uttar Pradesh,and West Bengal after 1999; where as in other states the productivity decline monotonously” and they concluded that in general “the environmental productivities” in other words the natural resources used and residuals produced per unit of useful output “decrease more in high-income states than in the low-income states” (Managi, 2008). So why does environmental abatement and or a decrease in pollution output occur when there is a rise in income? Managi argues that there is a positive association between “the education index variable and environmental productivity”, therefore as the education level in the society rises, so does the society’s concern for the environment. There is also another factor involved that is not interrelated to income level or education, and that factor is urbanization. As urbanization increases,there is an increase in environmental degradation. With the relatively ineffective policies that were implemented from the 1970’s to the late 1990’s the pollution continued to increase, with the poor taking the brunt of the consequences associated with an ever deteriorating environment. The Effect ofPollution on the Poor As India’s economy continued to expand, so did the overwhelming number of cases regarding polluted water bodies. Klas Ringskog, author of “INDIA: Environmental Sustainability in the 1990s” states that, “Unsafe drinking water,contaminated by human and industrial waste [were] estimated to be the biggest environmental burden, with the poor suffering disproportionately” (Ringskog, 2002). In 1987, Ringskog stated that nearly “60% of all deaths in urban areas were due to water-related diseases such as cholera, dysentery, and gastroenteritis”. As time progressed, it was evident that industries were spewing out chemical agents,fertilizers, pesticides, and contaminated silt, with little to no recourse from the government. Thus, power plants continued to pollute rivers with coal washing effluents and thermal pollution with no regard for communities down stream. The World Bank wrote an article titled, “Environmental Health in India”, that notes that environmental health risks can be broken down into two categories: traditional hazards and modern hazards. Traditional hazards typically refer to a lack of development, such as a “lack of safe water,inadequate sanitation and waste disposal, indoor air pollution, and vector-borne diseases” and modern hazards are typically “caused by development that lacks environmental safeguards,such as urban air pollution and exposure to agro- industrial chemicals and waste” (World Bank, 2001). The World Bank argues that the prevalence of traditional health risks, caused by inadequate access to infrastructure services,makes environmental health a poverty related issue. He notes that in rural areas, environmental factors accounted for “22–23 percent of the burden of disease” which was significantly higher than that of urban areas (World Bank, 2001). He claims that this was almost entirely caused by a sheer lack of adequate water and sanitation facilities, as well as a prolonged exposure to indoor air
  • 5. pollution. He notes that while urban households have an increased access to water and sanitation services, “18-19 percent” of urban households were still victims of environmentally related disease (World Bank, 2001). Collectively, those of a lower socioeconomic status were plagued with roughly 40 percent of environmentally associated diseases. The Road to Recovery It is evident that the initial environmental policies in India were underfunded and disjointed, consequently making government enforcement of these regulations nearly impossible. Thus, as India’s economy and population continued to grow and expand, the “potential” environmental repercussions were shoved to the wayside. To reiterate,this growth and utter disregard merely strengthens the Kuznets Curve theory in that as “the economy grows, environmental degradation and pollution tend to increase” (Stern,2003). What we have yet to investigate is the latter part of the Kuznets Curve theory in that, “after a given level of per capita income, the trend will reverse” (Stern,2003). While this theory has certainly proved true in higher income cities like Maharashtra and Punjab in the specific model hypothesized and tested by Shunsuke Managi, the author of “Environmental productivity and Kuznets curve in India”, the true test relies on the overall applicability of the Environmental Kuznets Curve to the country of India as whole. Even though India is still struggling to control its multifaceted pollution problem, it is evident that there have been some major changes since the early 2000’s. There has been a stark increase in sanitation and access to clean water,in 1990 only 71% of India’s population had access to clean water,while the most recent estimates from 2015 indicate that up to 94% of India’s population have access to clean water (World Bank, 2015). The World Bank also notes that there has been a 31% increase in sanitation. However,while these issues are dire in combating diseases associated with environmental degradation, India has yet to get at the root of the issue. In order to make significant changes and improve human health overall, India must reform their environmental policies and demand stringent enforcement. India’s recent policy reforms, and the latter part of the Environmental Kuznets Curve theory should be analyzed further in order to truly validate the EKC theory.
  • 6. Works Cited ENVIRONMENTAL HEALTH IN INDIA Priorities in Andhra Pradesh. (2001, October). Retrieved November 8, 2016 Environmental Issues in the Service Industry. (2016, November). Lecture presented at Dartmouth College in New Hampshire, Hanover. India’s evolution from agrarian to manufacturing to services economy. (2016, May 14). Retrieved November 8, 2016 Managi, S., & Jena, P. (2008, April 1). Environmental productivity and Kuznets curve in India. Ecological Economics, 65(2), 432-440. Improved water source (% of population with access) [Chart]. In WHO/UNICEF Joint Monitoring Programme ( JMP ) for Water Supply and Sanitation. Ringskog, K.,& Chow, N. (n.d.). INDIA:Environmental Sustainability in the 1990s. THE WORLD BANK OPERATIONS EVALUATION. Stern, D. (2003, June). The Environmental Kuznets Curve. International Society for Ecological Economics.