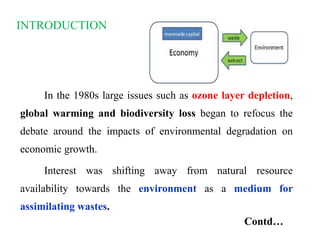
PANDIT JAWAHARLAL NEHRU COLLEGE OF AGRICULTURE &
RESEARCH INSTITUTE
DEPARTMENT OF AGRICULTURAL ECONOMICS
AEC 512 NATURAL RESOURCE AND ENVIRONMENTAL
ECONOMICS
Term paper presentation on
ENVIRONMENTAL KUZNET’S CURVE
Submitted by,
K.MOHANAKRISHNAN
I M.Sc., (Agricultural Economics)
PAJANCOA & RI
INTRODUCTION
In the 1980s large issues such as ozone layer depletion,
global warming and biodiversity loss began to refocus the
debate around the impacts of environmental degradation on
economic growth.
Interest was shifting away from natural resource
availability towards the environment as a medium for
assimilating wastes.
Contd…
This led to the emergence of the ‘source’ to ‘sink’
concept
source to sink concept is a theoretical model used by
ecologist to describe how variation in habitat quality may affect
the population growth or decline of organisms.
The Brundtland Report (1987), the discourse of
sustainable development largely embraced economic growth as
a way out of poverty, environmental degradation particularly
for the developing world.
Contd…
Why might economic growth benefit the environment?
There are a number of theoretical explanations that suggest the
sink side of the environment will be less impacted as incomes rise.
Environmental quality is often cited as a normal good, if not
even a luxury good.
Sustainable development is the achievement of a sustained path
of economic growth which does not undermine future generation
possibilities of consumption.
Contd…
In addition, rich countries may be better able to meet the
higher demands for environmental protection through their
institutional environmental capacity.
In other words, the income elasticity of demand for
environmental quality is greater than zero, possibly even greater
than one, or as income grows environmental concern rises as well,
perhaps even more than proportionally so.
Contd…
While pollution per unit of output might go down, absolute
pollution levels might very well go up as economic growth increases.
Therefore the effect of technological change on pollution is in
principle ambiguous
As economic development progresses and income grows, the
share of industry will go down as services goes up, thus sectoral
changes may favor less-polluting sectors.
Contd…
It is likely that economic growth increases the
possibility that more modern and less pollution intensive
man-made capital and technology are introduced.
It is also suspected that high-income countries have
become cleaner because they have exported their pollution-
intensive industry to Least Developed Countries, also known
as the “pollution haven hypothesis.
Contd…
Rising income brings population growth rates down,
therefore population pressure on the environment decreases.
Thus the relationship between economic growth and the
environment came under increased scrutiny.
In the 1990's the empirical literature on the link between
economic growth and environmental pollution literally exploded.
Much of this literature sought to test the Environmental Kuznets
Curve (EKC) hypothesis.
Kuznets Curve
The sixty-seventh annual meeting of the American Economic
Association in December 1954, Simon Kuznets delivered the
presidential address, entitled “Economic Growth and Income
Inequality.”
He suggested that as per capita income increases, income
inequality also increases at first but then, after some turning point,
starts declining.
Contd…
Kuznets believed that the distribution of income becomes
more unequal at early stages of income growth but that the
distribution eventually moves back toward greater equality as
economic growth continues.
This changing relationship between per capita income and
income inequality, now observed graphically, can be represented by a
bell-shaped curve (or) inverted “U” shaped curve now known as the
Kuznets Curve.
Contd…
Contd…
THE KUZNETS CURVE
ENVIRONMENTAL KUZNETS CURVE
Contd…
When the Kuznets curve is applied to environment it is
called the environment Kuznets curve. Thus the Environmental
Kuznets Curve (EKC) is an adaptation of Simon Kuznets curve.
The Environment Kuznets curve is a hypothesized
relationship between various indicators of environment
degradation/ deterioration and income per capita.
Contd…
The Kuznets curve implies that as a nation undergoes
industrialization , the centre of the nation’s economy will shift to
the cities.
As capitalism causes a significant rural-urban inequality
gap, rural populations are expected to decrease as urban
populations increase, due to people migrating to cities in search of
income.
Contd…
Inequality is again expected to decrease when a certain
level of average income is reached and the processes of
industrialization allow for the trickle-down of the benefits from
rapid growth, and increase the per capita income.
This was Kuznets’ belief; that inequality would follow
an inverted “U” shape as it rises and then falls again with the
increase of income per capita.
Contd…
The EKC again follow growth in per capital income from
very low to higher levels, but instead of graphing this against
income inequality, the new variable is pollution(deterioration).
When the EKC relation holds, what might be the reason? Here
are some possible explanations:
Environmental quality may be income elastic. As
individuals enjoy greater incomes, they demand better
environmental quality either through markets or regulatory
policies.
Contd…
At lower levels of per capita income found in pre-
industrial and agrarian economies, one might expect rather
pristine environmental conditions relatively unaffected by
economic activities.
The EKC relationship suggests that as development and
industrialization progress , environmental damage increases
due to greater use of natural resources, more emission of
pollutants, the operation of less efficient and relatively dirty
technologies.
Contd…
The high priority given to increases in material output,
and disregard for or ignorance of the environmental
consequences of growth.
In the post-industrial stage, cleaner technologies and a
shift to information and service-based activities combine with a
growing ability and willingness to enhance environmental
quality.
Contd…
Rich countries outsource their polluting industries to less
developed countries.
There is an increasing role of democracy with economic
development. Since emissions of many environmental pollutants
reflect missing markets, government institutions are necessary to
address them.
More responsive democracy may be necessary in order to
translate individual demand for environmental quality into policies
that restrict pollution.
0
5000
10000
15000
20000
25000
30000
35000
40000
SULPHUR EMISSIONS
SULPHUR EMISSIONS
Examples
In the above graph we have tried to obtain the Environmental
Kuznets Curve by plotting the per capita income on the X axis and the
quantity of sulphur emissions on the y axis starting from the year 1850
to 2005 with a 10 year interval.
Sulphur emissions mainly come from manufacturing
production activities.
The curve assumes an inverted V-shape.
In the year 1970 when the per capita income was 21.00274
Contd…
Levels of income per capita under $1,000. Between $1,000
and $3,000 both the economy and environmental degradation
undergo dramatic structural change from rural to urban and from the
pursuit of agricultural production to industrial production.
For the 1960s, toxic intensity grew most quickly in high-
income economies. This pattern is sharply reversed during the 1970s
and 1980s, when toxic intensity in manufacturing in less developed
countries grew most quickly.
0
1000
2000
3000
4000
5000
6000
7000
CO2 EMISSIONS(in million tons)
CO2 Emissions
Carbon dioxide (CO2) emissions with regard to the same years
we found a different trend, one which was consistently increasing.
Carbon emissions arise from not only production but also from
consumption such as :
1. Automobile use
2. Burning of fossil fuels for the generation of electricity
THANK YOU

EKC

  • 1.
    PANDIT JAWAHARLAL NEHRUCOLLEGE OF AGRICULTURE & RESEARCH INSTITUTE DEPARTMENT OF AGRICULTURAL ECONOMICS AEC 512 NATURAL RESOURCE AND ENVIRONMENTAL ECONOMICS Term paper presentation on ENVIRONMENTAL KUZNET’S CURVE Submitted by, K.MOHANAKRISHNAN I M.Sc., (Agricultural Economics) PAJANCOA & RI
  • 2.
    INTRODUCTION In the 1980slarge issues such as ozone layer depletion, global warming and biodiversity loss began to refocus the debate around the impacts of environmental degradation on economic growth. Interest was shifting away from natural resource availability towards the environment as a medium for assimilating wastes. Contd…
  • 3.
    This led tothe emergence of the ‘source’ to ‘sink’ concept source to sink concept is a theoretical model used by ecologist to describe how variation in habitat quality may affect the population growth or decline of organisms. The Brundtland Report (1987), the discourse of sustainable development largely embraced economic growth as a way out of poverty, environmental degradation particularly for the developing world. Contd…
  • 4.
    Why might economicgrowth benefit the environment? There are a number of theoretical explanations that suggest the sink side of the environment will be less impacted as incomes rise. Environmental quality is often cited as a normal good, if not even a luxury good. Sustainable development is the achievement of a sustained path of economic growth which does not undermine future generation possibilities of consumption. Contd…
  • 5.
    In addition, richcountries may be better able to meet the higher demands for environmental protection through their institutional environmental capacity. In other words, the income elasticity of demand for environmental quality is greater than zero, possibly even greater than one, or as income grows environmental concern rises as well, perhaps even more than proportionally so. Contd…
  • 6.
    While pollution perunit of output might go down, absolute pollution levels might very well go up as economic growth increases. Therefore the effect of technological change on pollution is in principle ambiguous As economic development progresses and income grows, the share of industry will go down as services goes up, thus sectoral changes may favor less-polluting sectors. Contd…
  • 7.
    It is likelythat economic growth increases the possibility that more modern and less pollution intensive man-made capital and technology are introduced. It is also suspected that high-income countries have become cleaner because they have exported their pollution- intensive industry to Least Developed Countries, also known as the “pollution haven hypothesis. Contd…
  • 8.
    Rising income bringspopulation growth rates down, therefore population pressure on the environment decreases. Thus the relationship between economic growth and the environment came under increased scrutiny. In the 1990's the empirical literature on the link between economic growth and environmental pollution literally exploded. Much of this literature sought to test the Environmental Kuznets Curve (EKC) hypothesis.
  • 9.
    Kuznets Curve The sixty-seventhannual meeting of the American Economic Association in December 1954, Simon Kuznets delivered the presidential address, entitled “Economic Growth and Income Inequality.” He suggested that as per capita income increases, income inequality also increases at first but then, after some turning point, starts declining. Contd…
  • 10.
    Kuznets believed thatthe distribution of income becomes more unequal at early stages of income growth but that the distribution eventually moves back toward greater equality as economic growth continues. This changing relationship between per capita income and income inequality, now observed graphically, can be represented by a bell-shaped curve (or) inverted “U” shaped curve now known as the Kuznets Curve. Contd…
  • 11.
  • 12.
  • 13.
    When the Kuznetscurve is applied to environment it is called the environment Kuznets curve. Thus the Environmental Kuznets Curve (EKC) is an adaptation of Simon Kuznets curve. The Environment Kuznets curve is a hypothesized relationship between various indicators of environment degradation/ deterioration and income per capita. Contd…
  • 14.
    The Kuznets curveimplies that as a nation undergoes industrialization , the centre of the nation’s economy will shift to the cities. As capitalism causes a significant rural-urban inequality gap, rural populations are expected to decrease as urban populations increase, due to people migrating to cities in search of income. Contd…
  • 15.
    Inequality is againexpected to decrease when a certain level of average income is reached and the processes of industrialization allow for the trickle-down of the benefits from rapid growth, and increase the per capita income. This was Kuznets’ belief; that inequality would follow an inverted “U” shape as it rises and then falls again with the increase of income per capita. Contd…
  • 16.
    The EKC againfollow growth in per capital income from very low to higher levels, but instead of graphing this against income inequality, the new variable is pollution(deterioration). When the EKC relation holds, what might be the reason? Here are some possible explanations: Environmental quality may be income elastic. As individuals enjoy greater incomes, they demand better environmental quality either through markets or regulatory policies. Contd…
  • 17.
    At lower levelsof per capita income found in pre- industrial and agrarian economies, one might expect rather pristine environmental conditions relatively unaffected by economic activities. The EKC relationship suggests that as development and industrialization progress , environmental damage increases due to greater use of natural resources, more emission of pollutants, the operation of less efficient and relatively dirty technologies. Contd…
  • 18.
    The high prioritygiven to increases in material output, and disregard for or ignorance of the environmental consequences of growth. In the post-industrial stage, cleaner technologies and a shift to information and service-based activities combine with a growing ability and willingness to enhance environmental quality. Contd…
  • 19.
    Rich countries outsourcetheir polluting industries to less developed countries. There is an increasing role of democracy with economic development. Since emissions of many environmental pollutants reflect missing markets, government institutions are necessary to address them. More responsive democracy may be necessary in order to translate individual demand for environmental quality into policies that restrict pollution.
  • 20.
  • 21.
    In the abovegraph we have tried to obtain the Environmental Kuznets Curve by plotting the per capita income on the X axis and the quantity of sulphur emissions on the y axis starting from the year 1850 to 2005 with a 10 year interval. Sulphur emissions mainly come from manufacturing production activities. The curve assumes an inverted V-shape. In the year 1970 when the per capita income was 21.00274 Contd…
  • 22.
    Levels of incomeper capita under $1,000. Between $1,000 and $3,000 both the economy and environmental degradation undergo dramatic structural change from rural to urban and from the pursuit of agricultural production to industrial production. For the 1960s, toxic intensity grew most quickly in high- income economies. This pattern is sharply reversed during the 1970s and 1980s, when toxic intensity in manufacturing in less developed countries grew most quickly.
  • 23.
  • 24.
    Carbon dioxide (CO2)emissions with regard to the same years we found a different trend, one which was consistently increasing. Carbon emissions arise from not only production but also from consumption such as : 1. Automobile use 2. Burning of fossil fuels for the generation of electricity
  • 25.