Download as PDF, PPTX


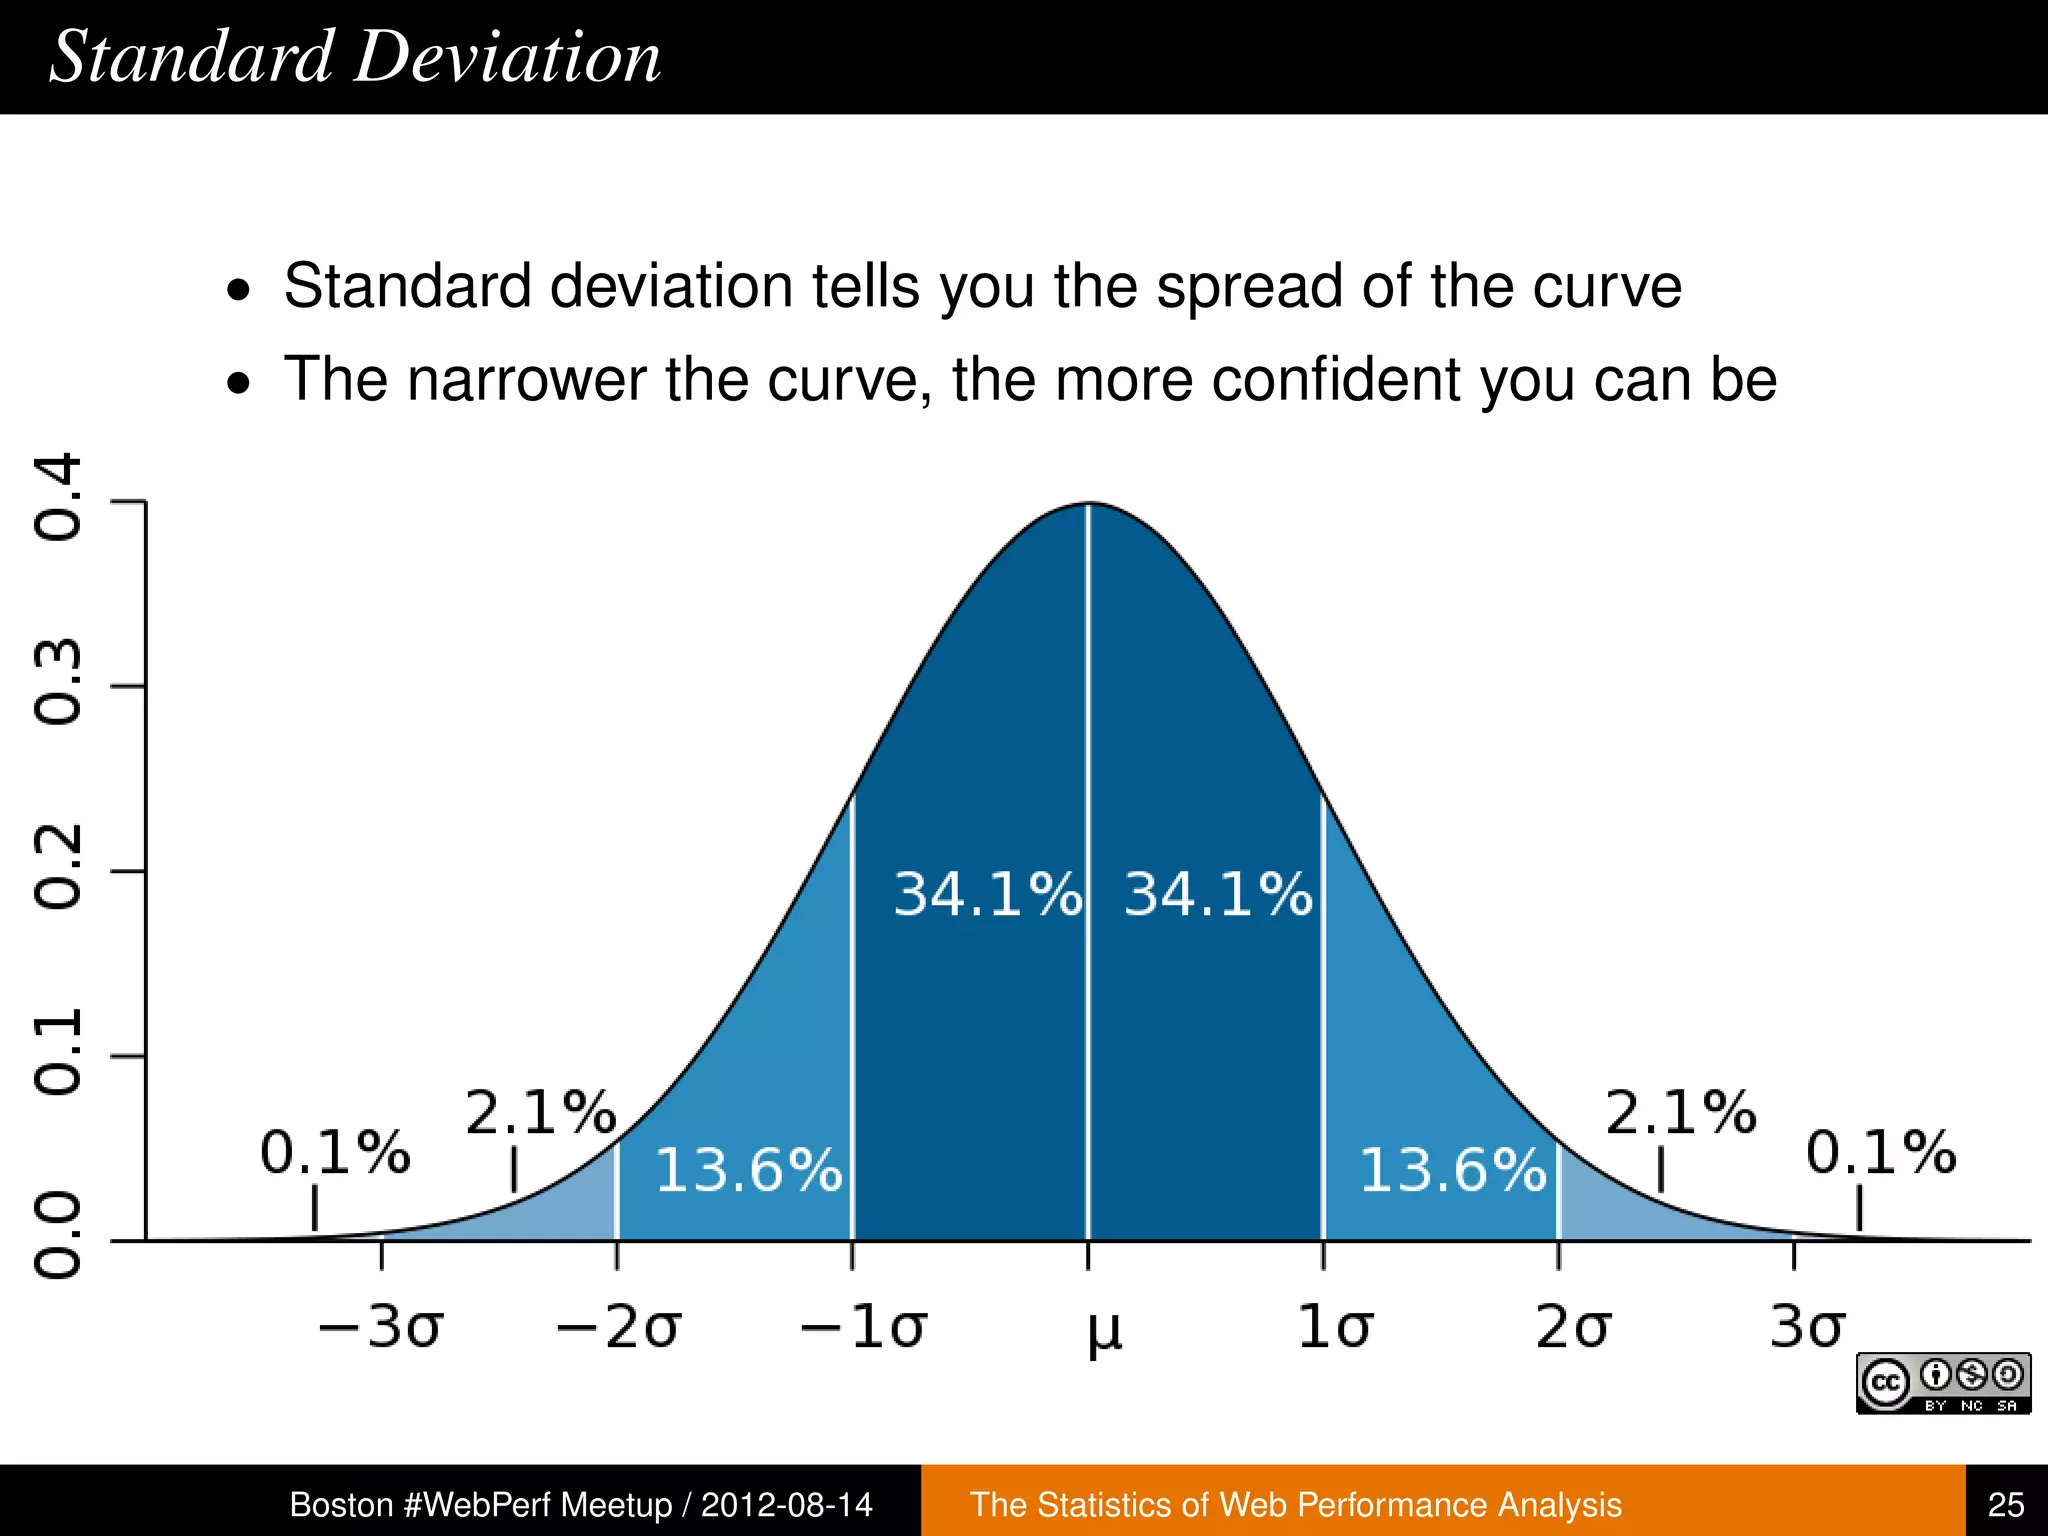

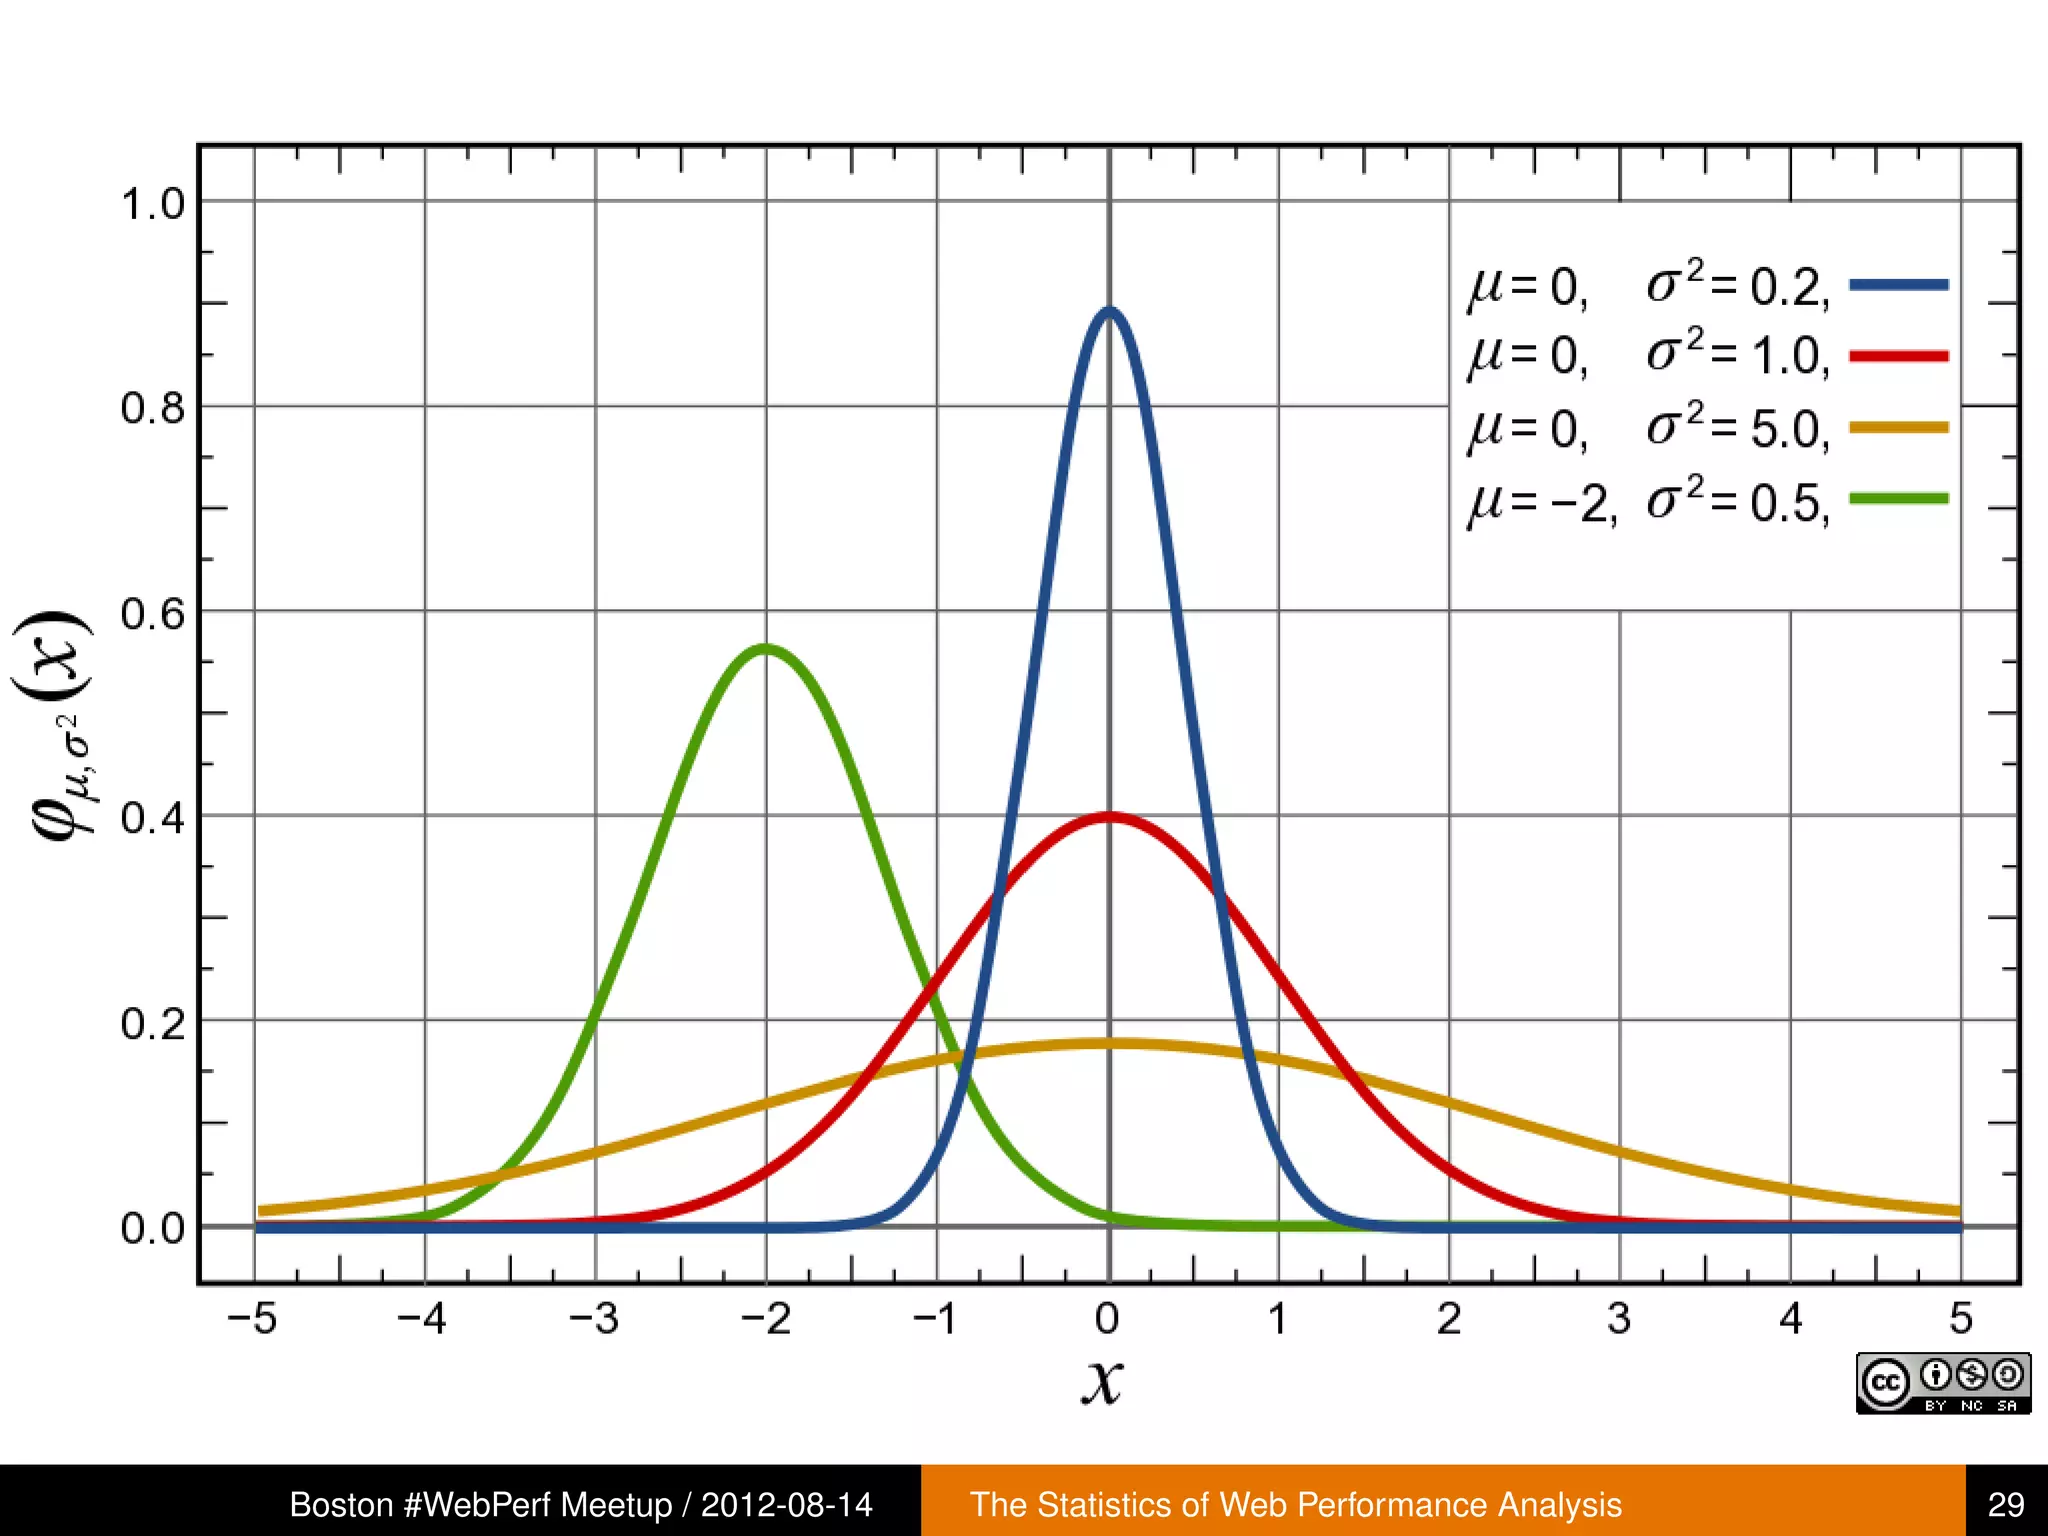
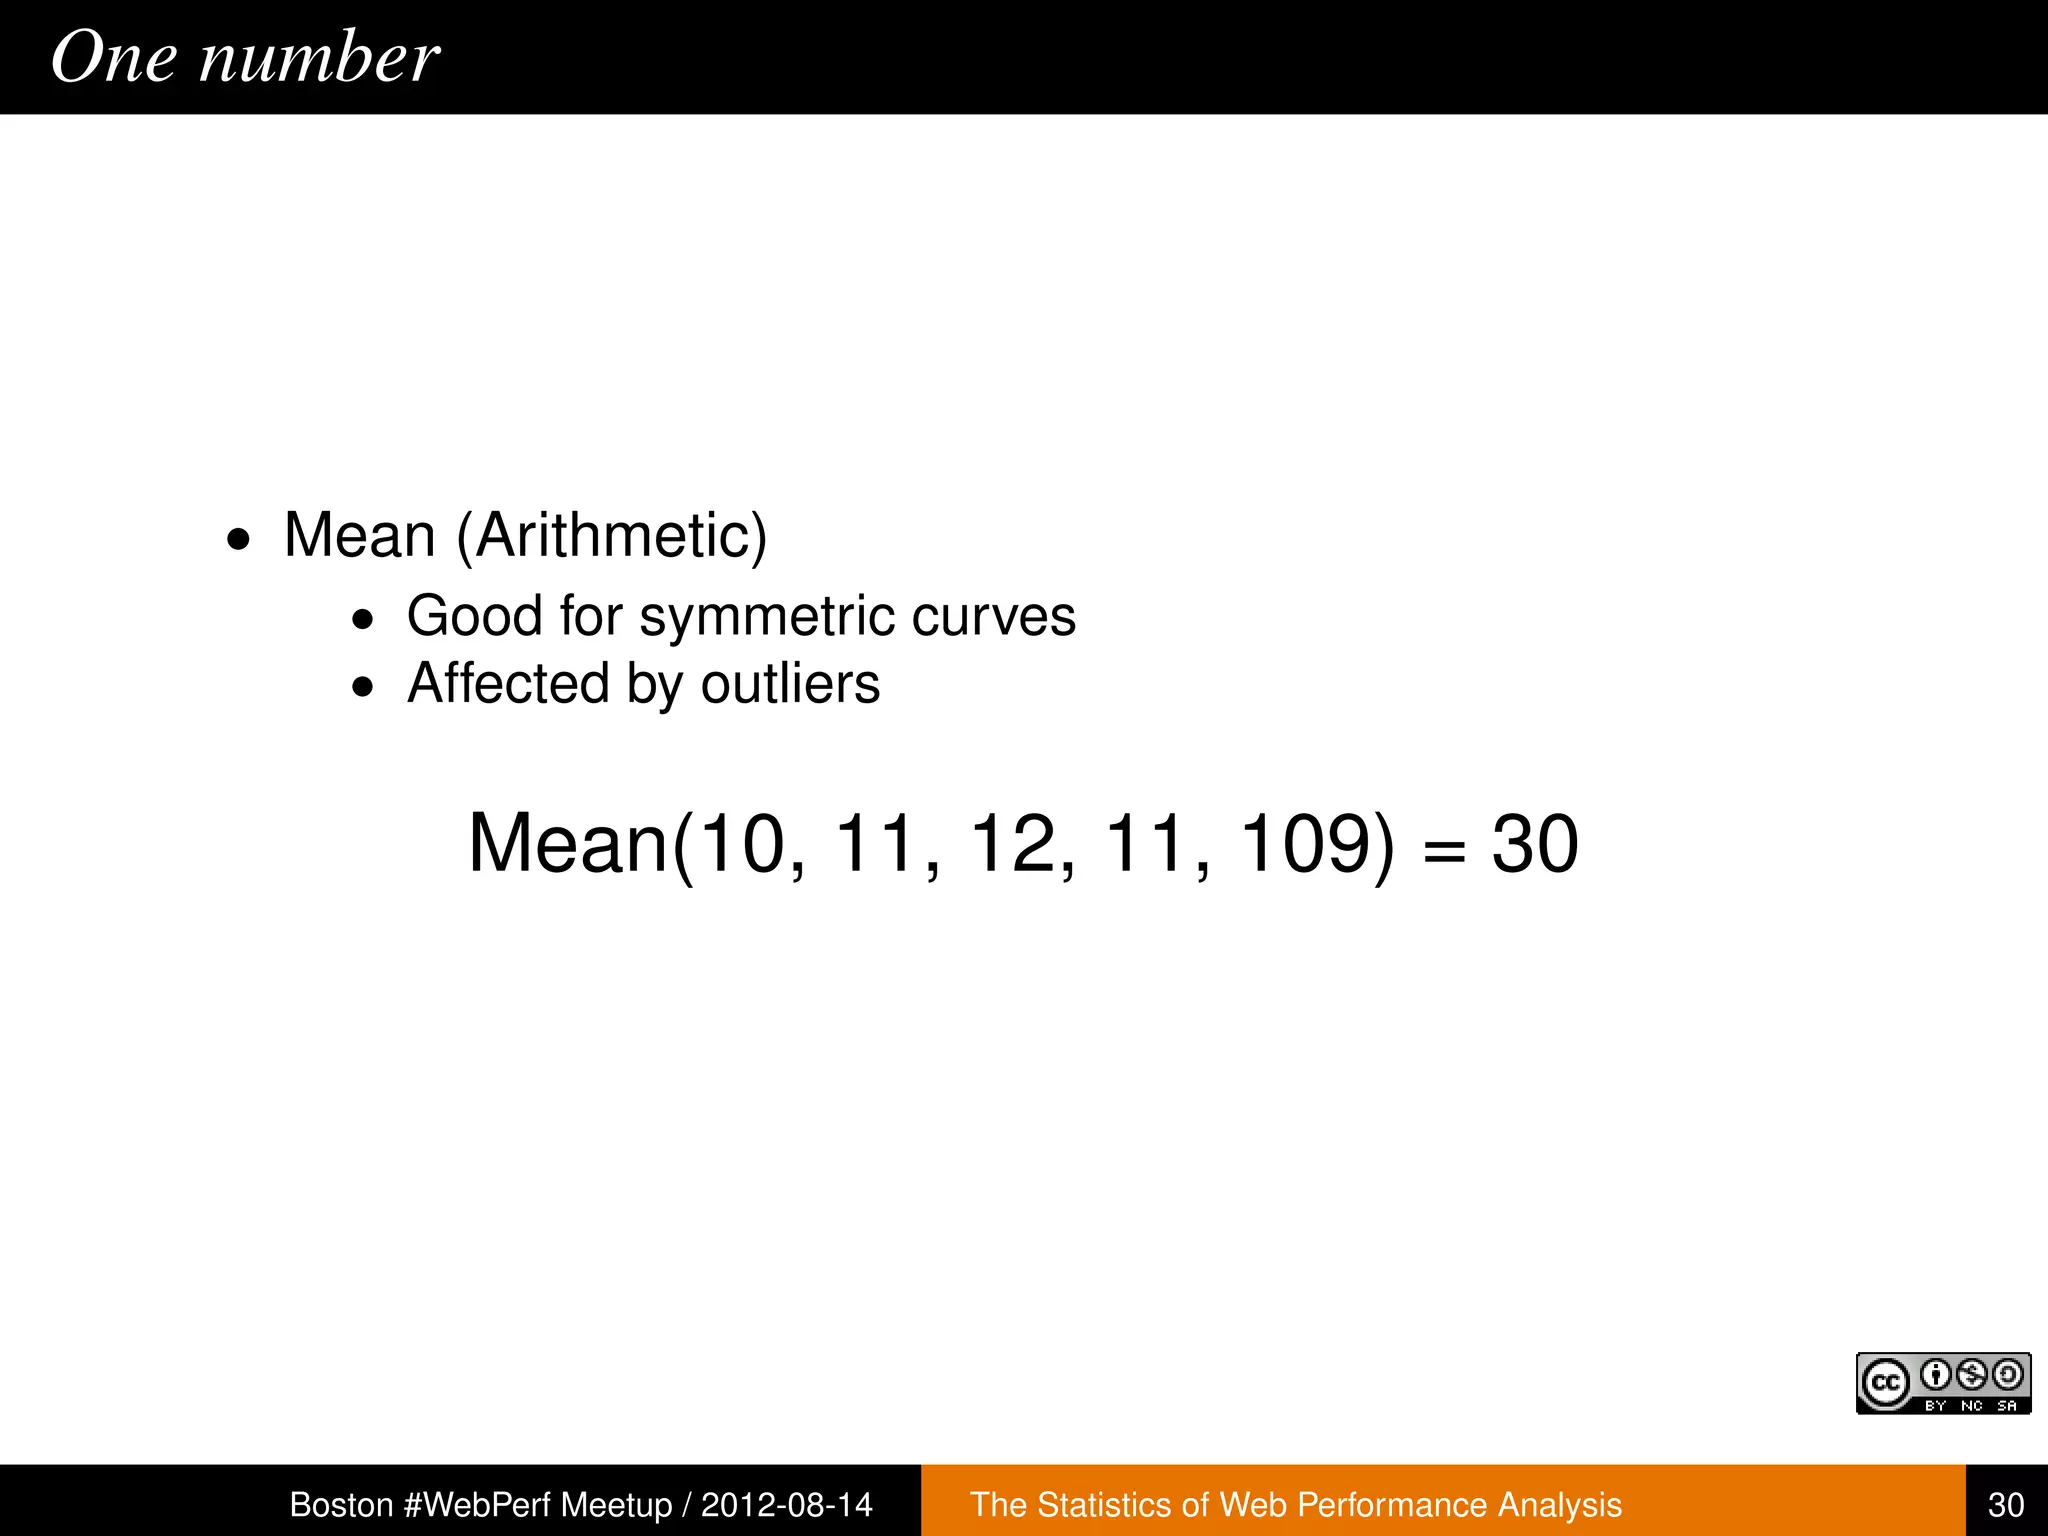
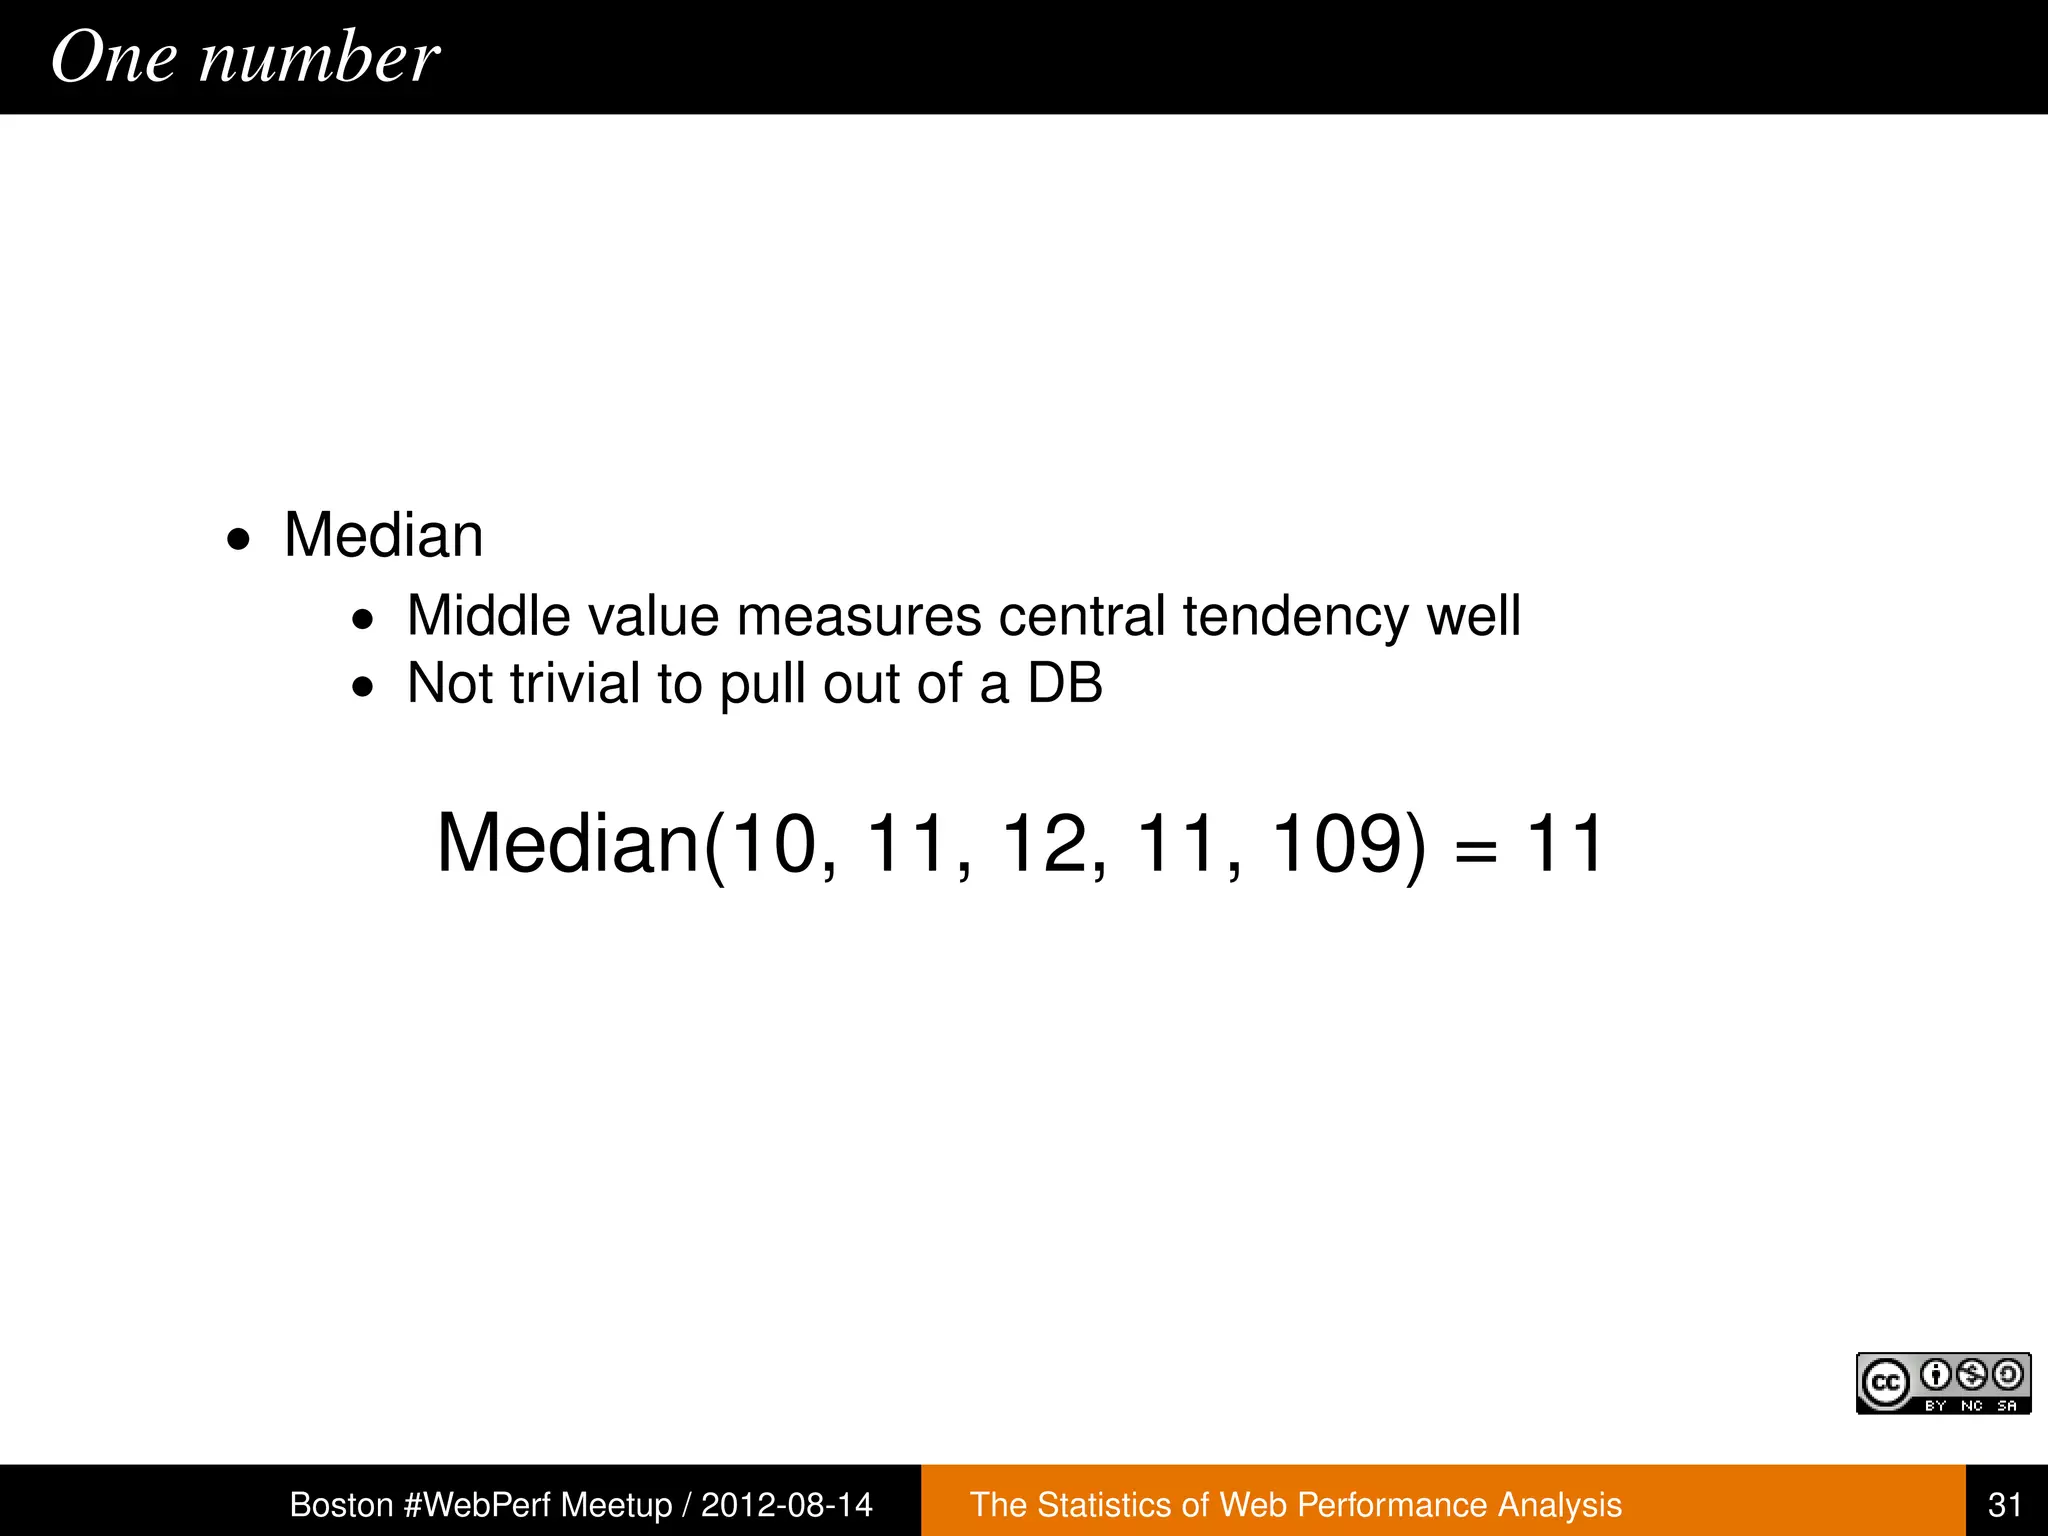
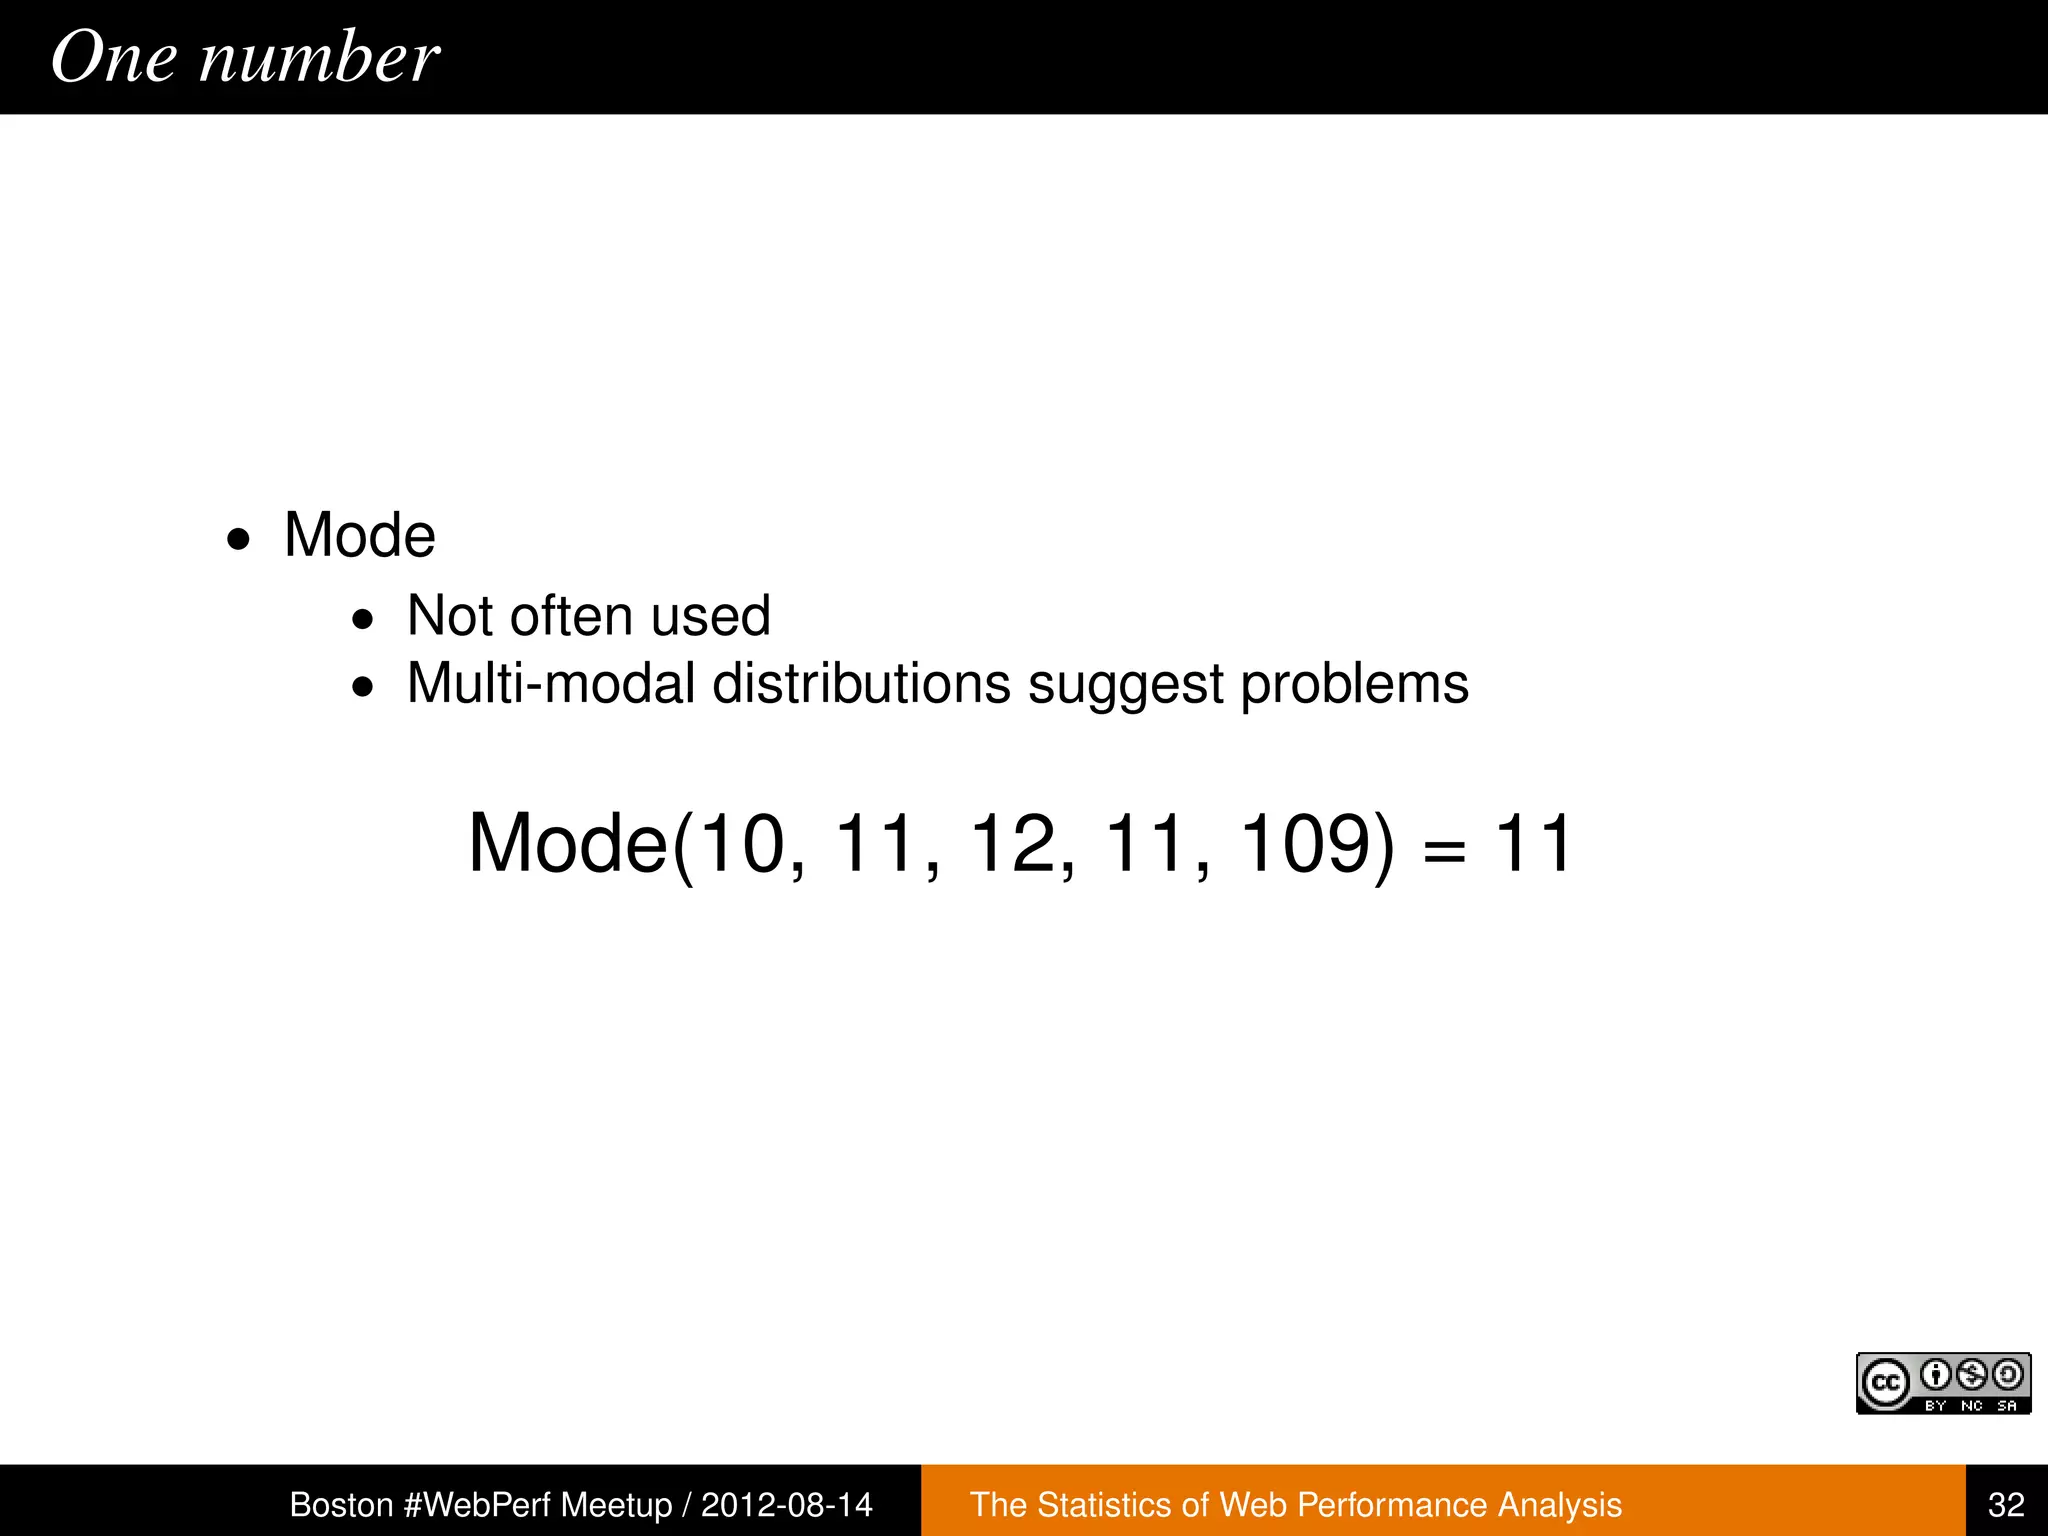
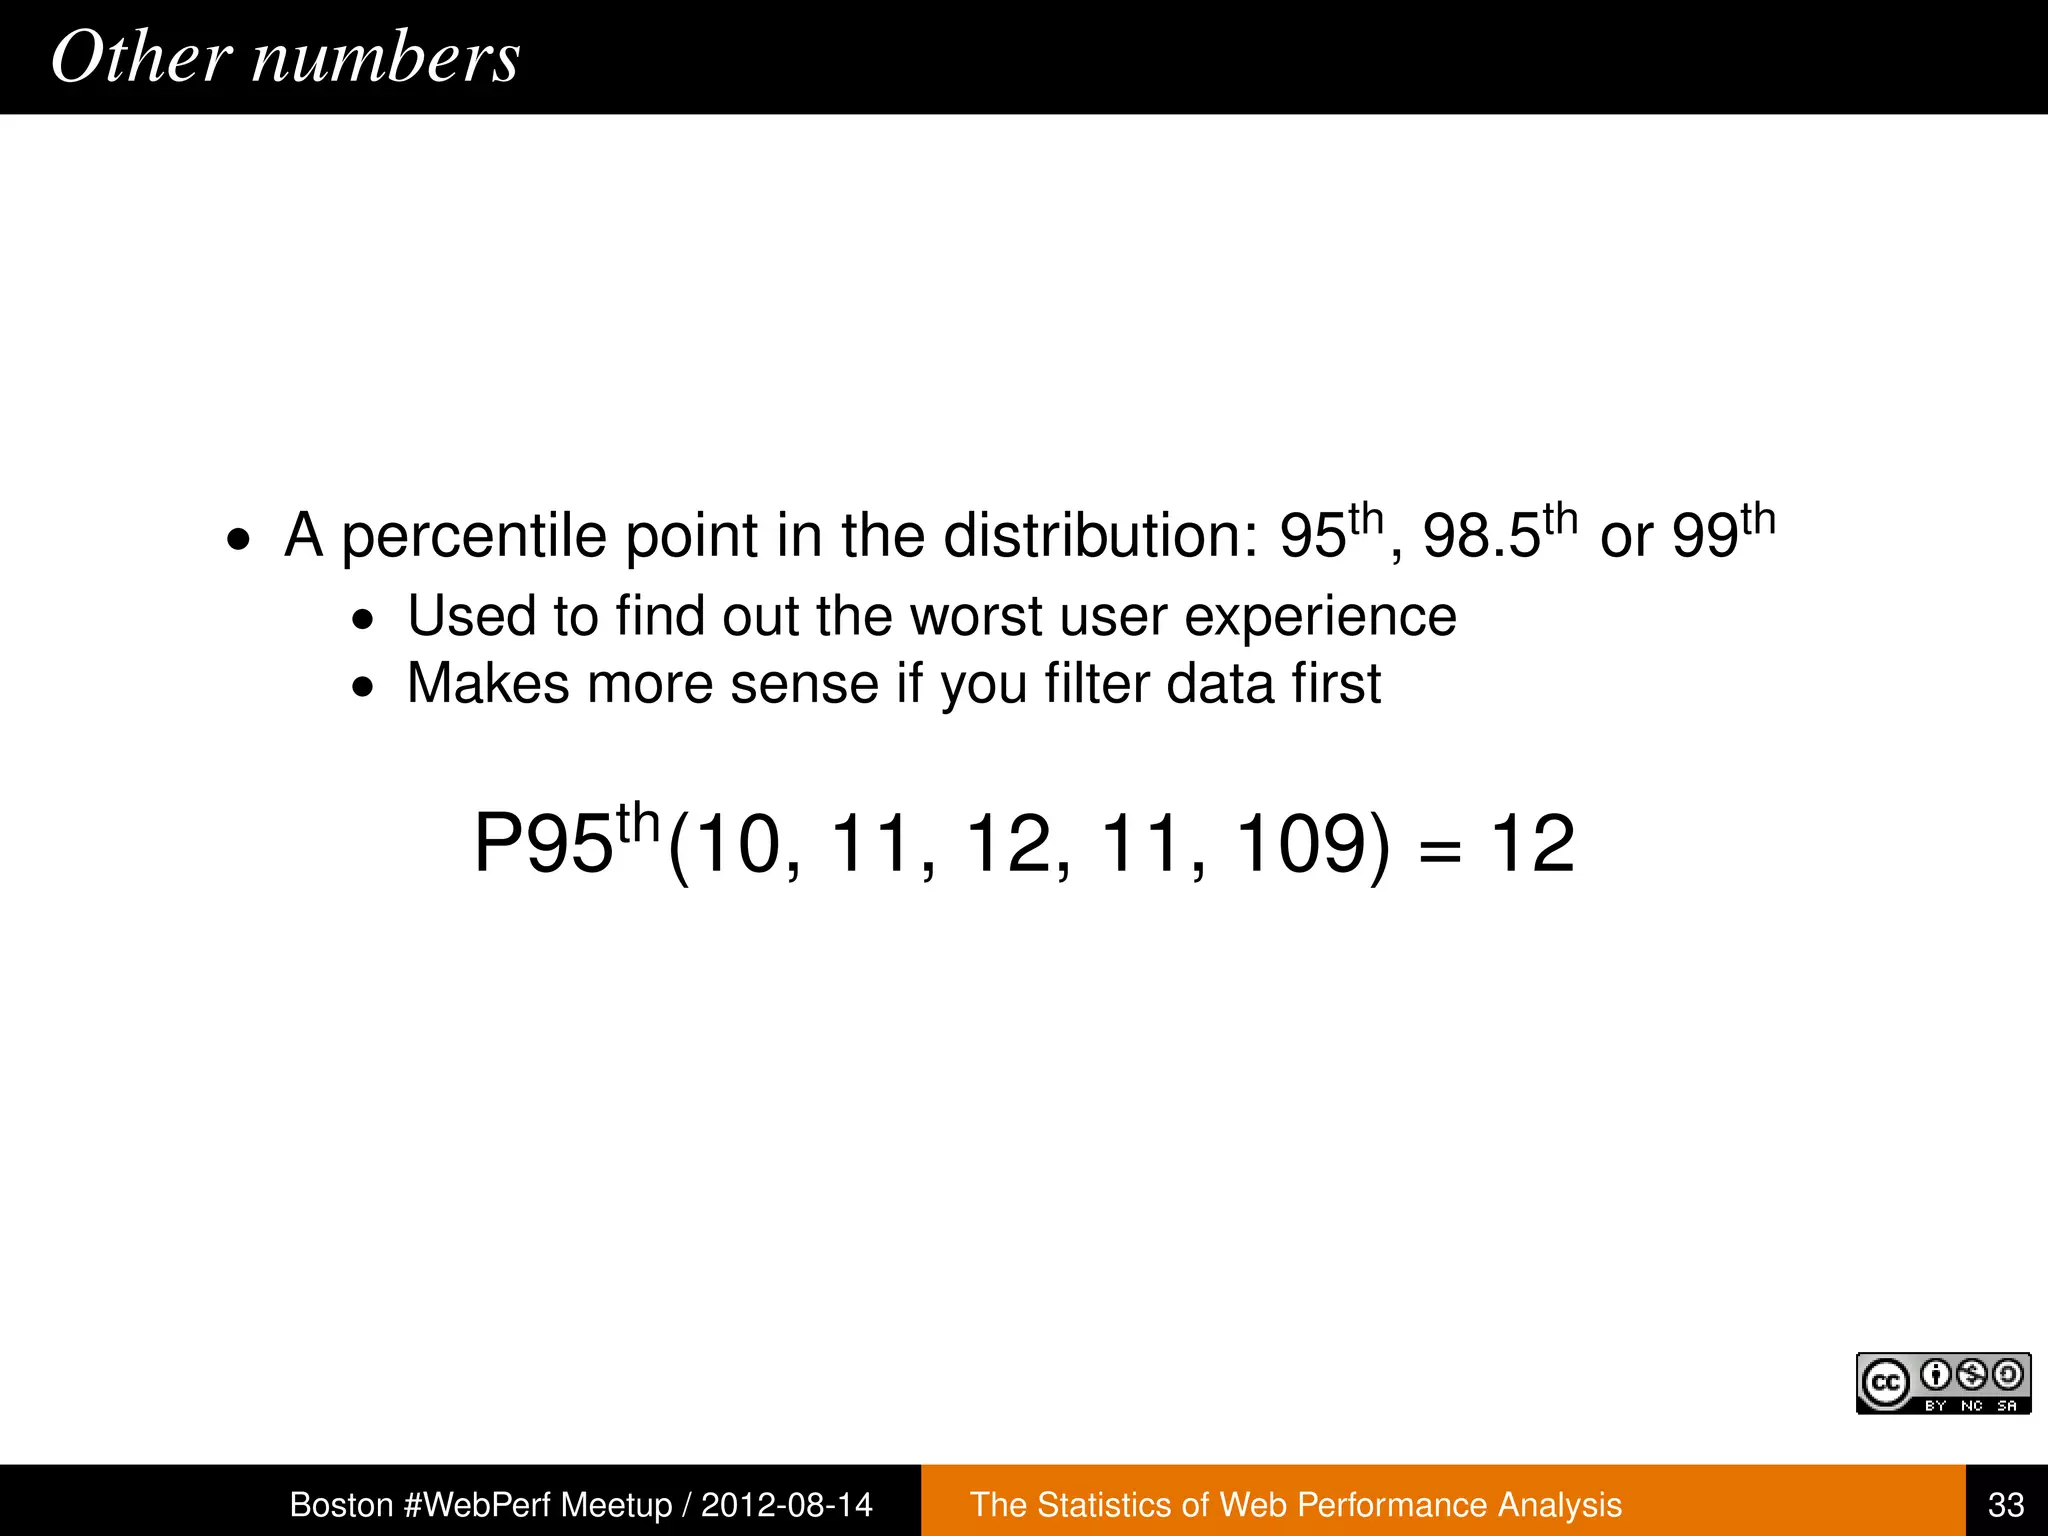


The document presents an analysis of web performance statistics, emphasizing the importance of measuring real user data and using accurate sampling methods. It discusses various statistical concepts such as mean, median, and distribution types while highlighting the need to filter out outliers for more reliable insights. Ultimately, it provides guidance on choosing appropriate sample sizes and methodologies for performance measurement.


![Coded Agents – with UiPath SDK + LangGraph [Virtual Hands-on Workshop]](https://cdn.slidesharecdn.com/ss_thumbnails/codedagentsdeck-251215155422-5497c599-thumbnail.jpg?width=640&height=640&fit=bounds)


