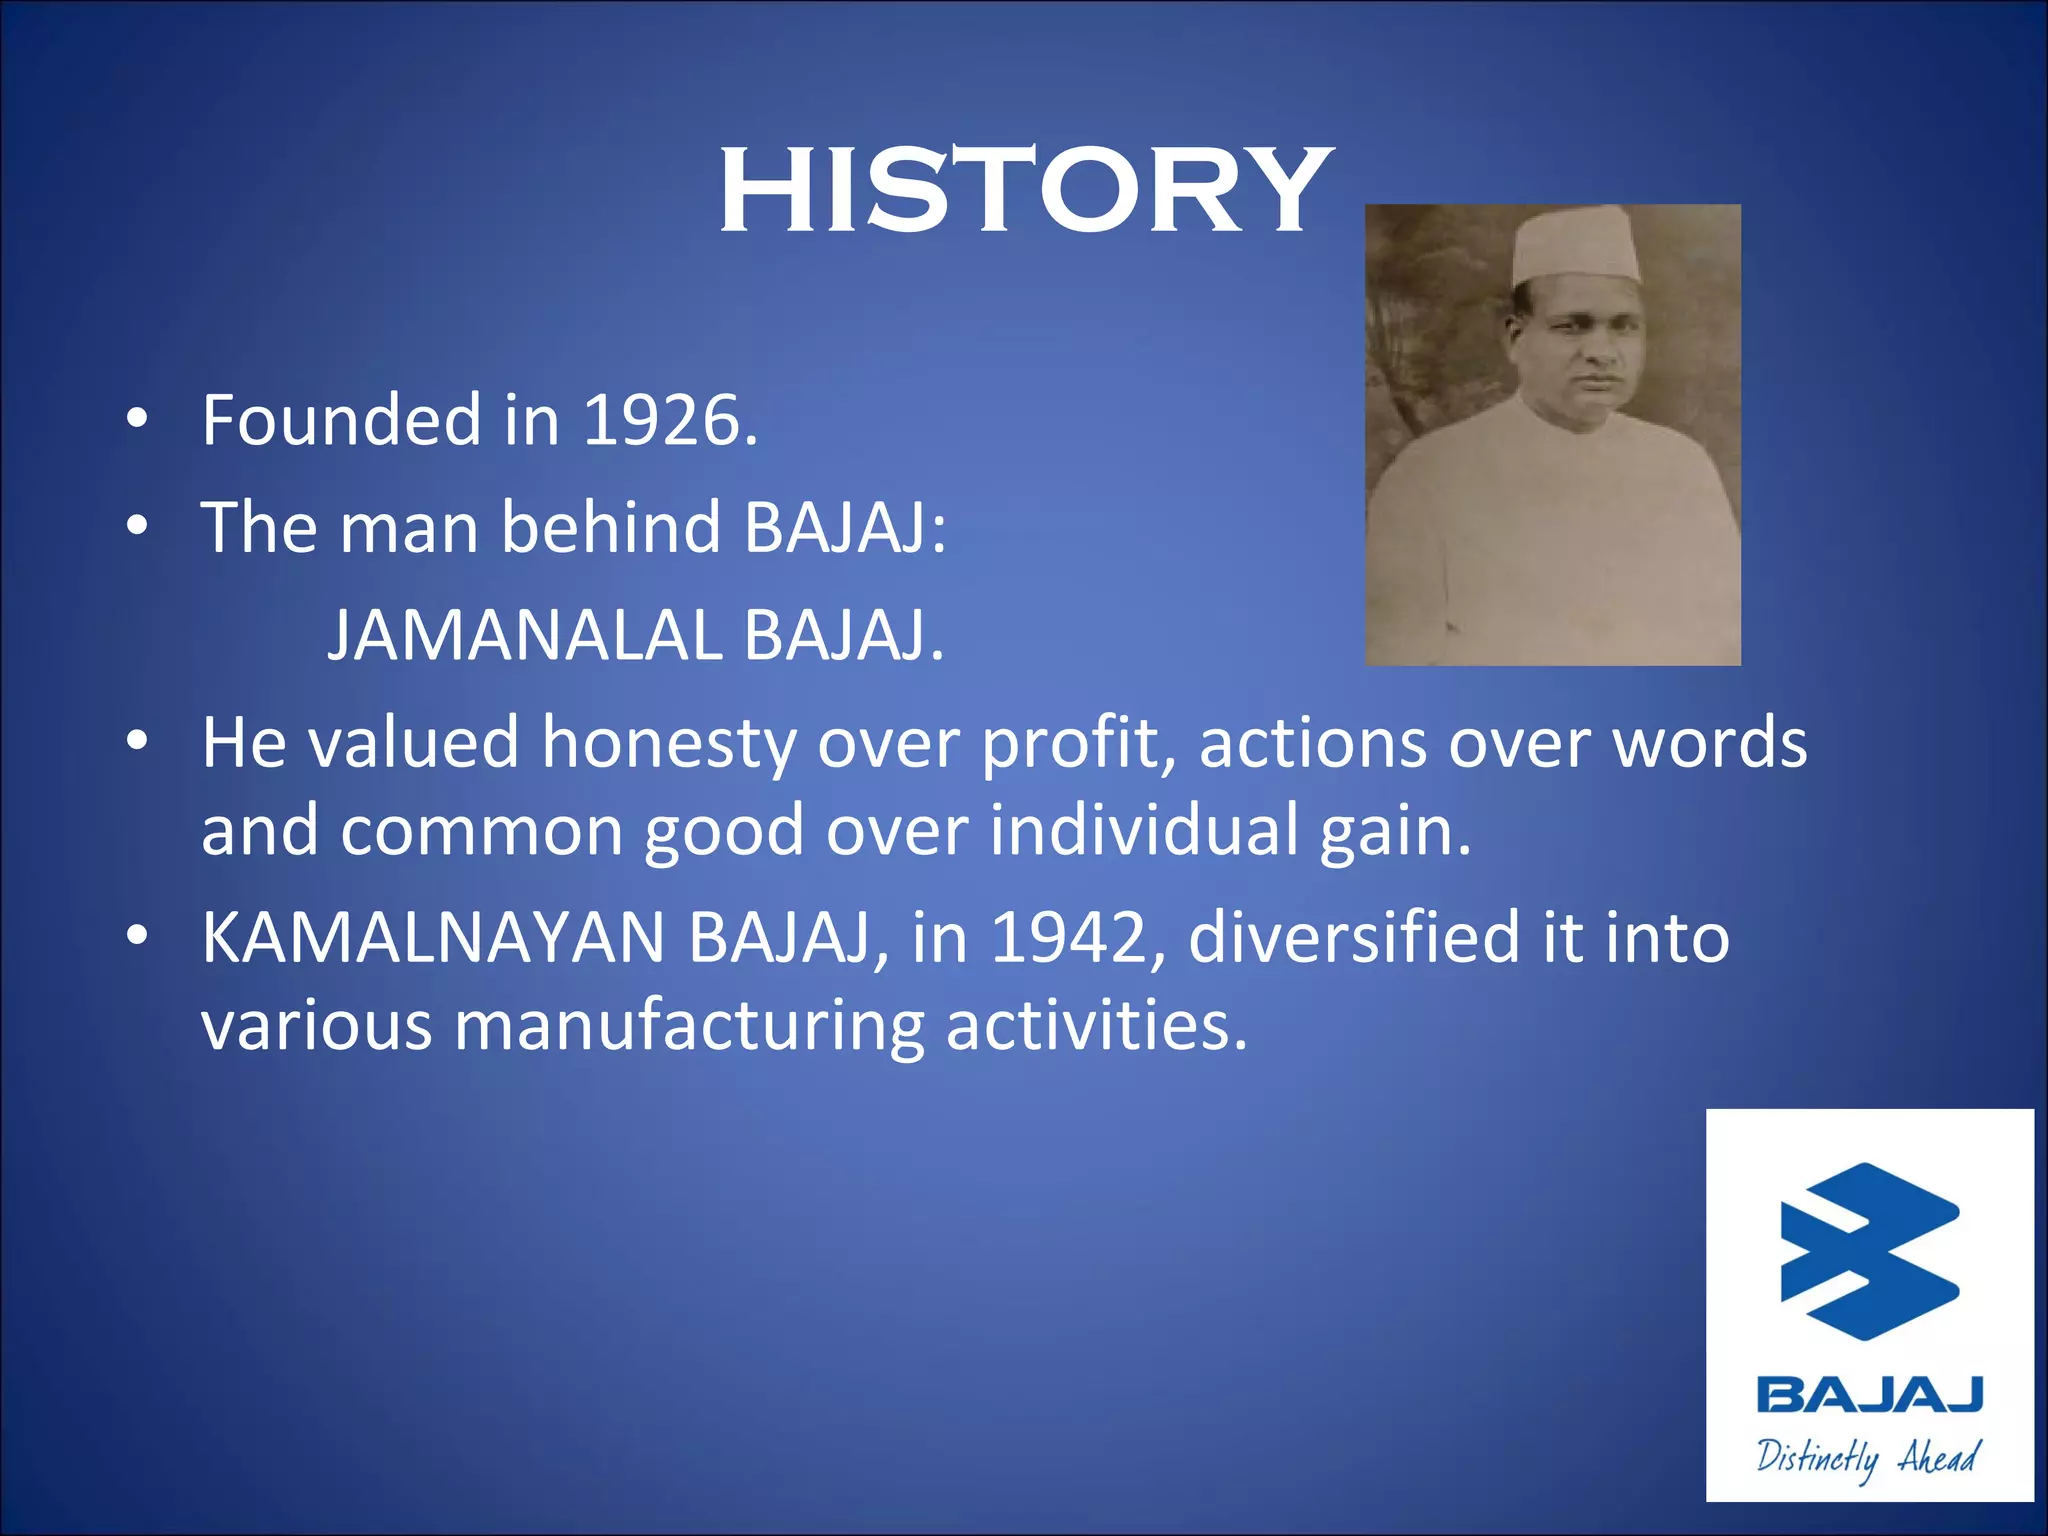
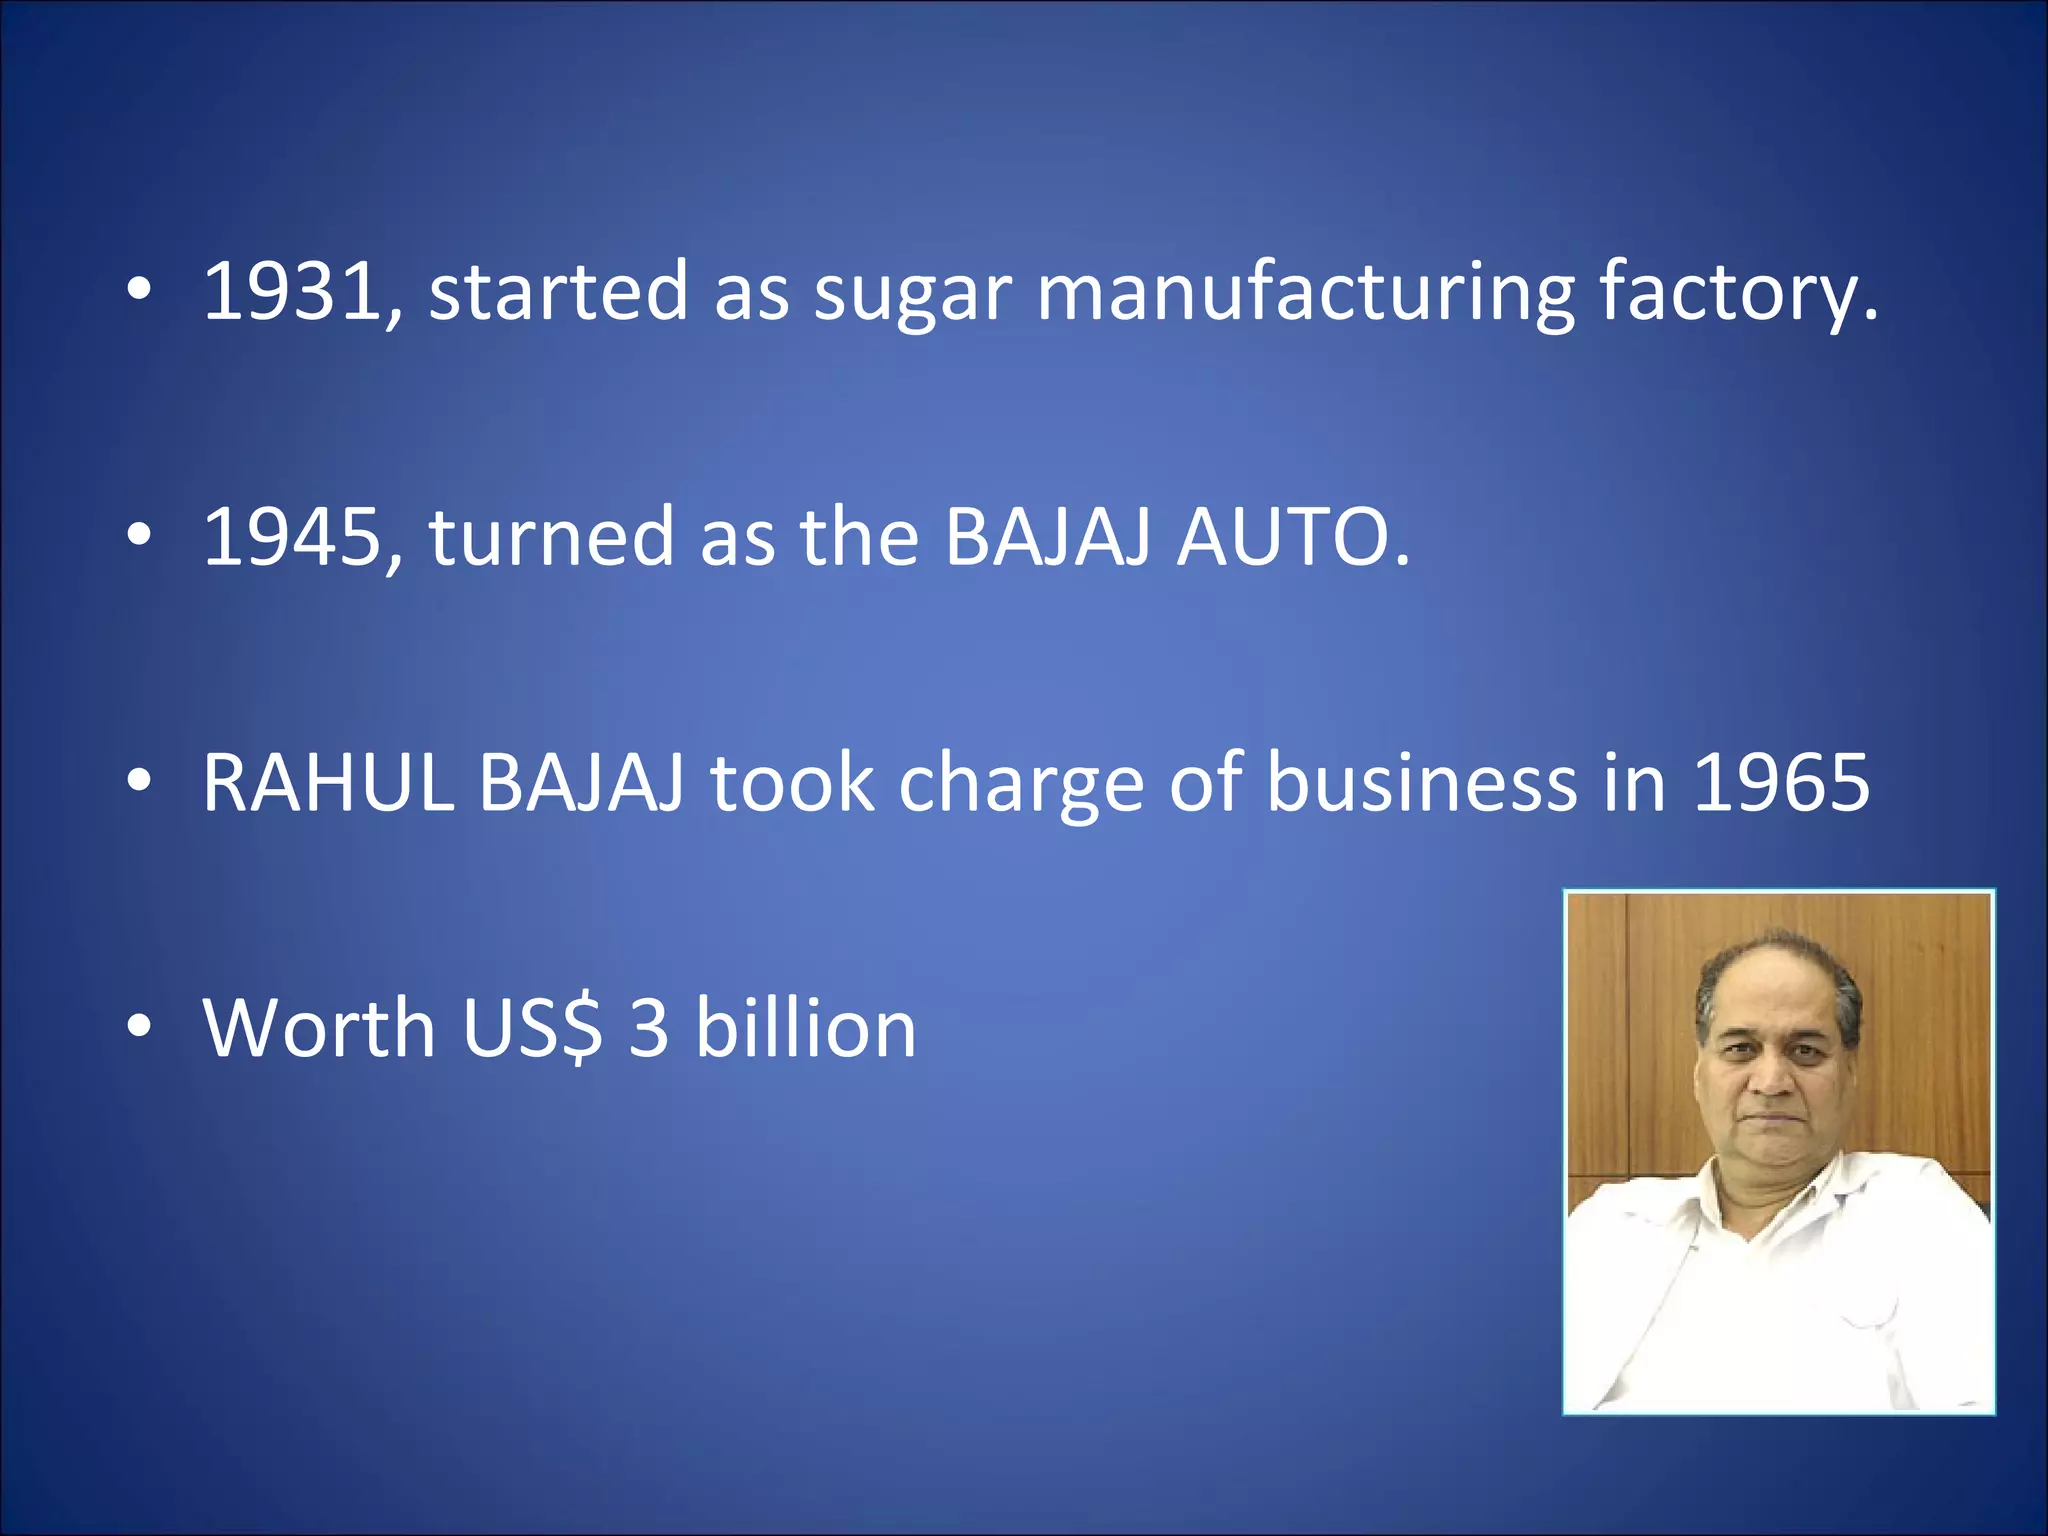
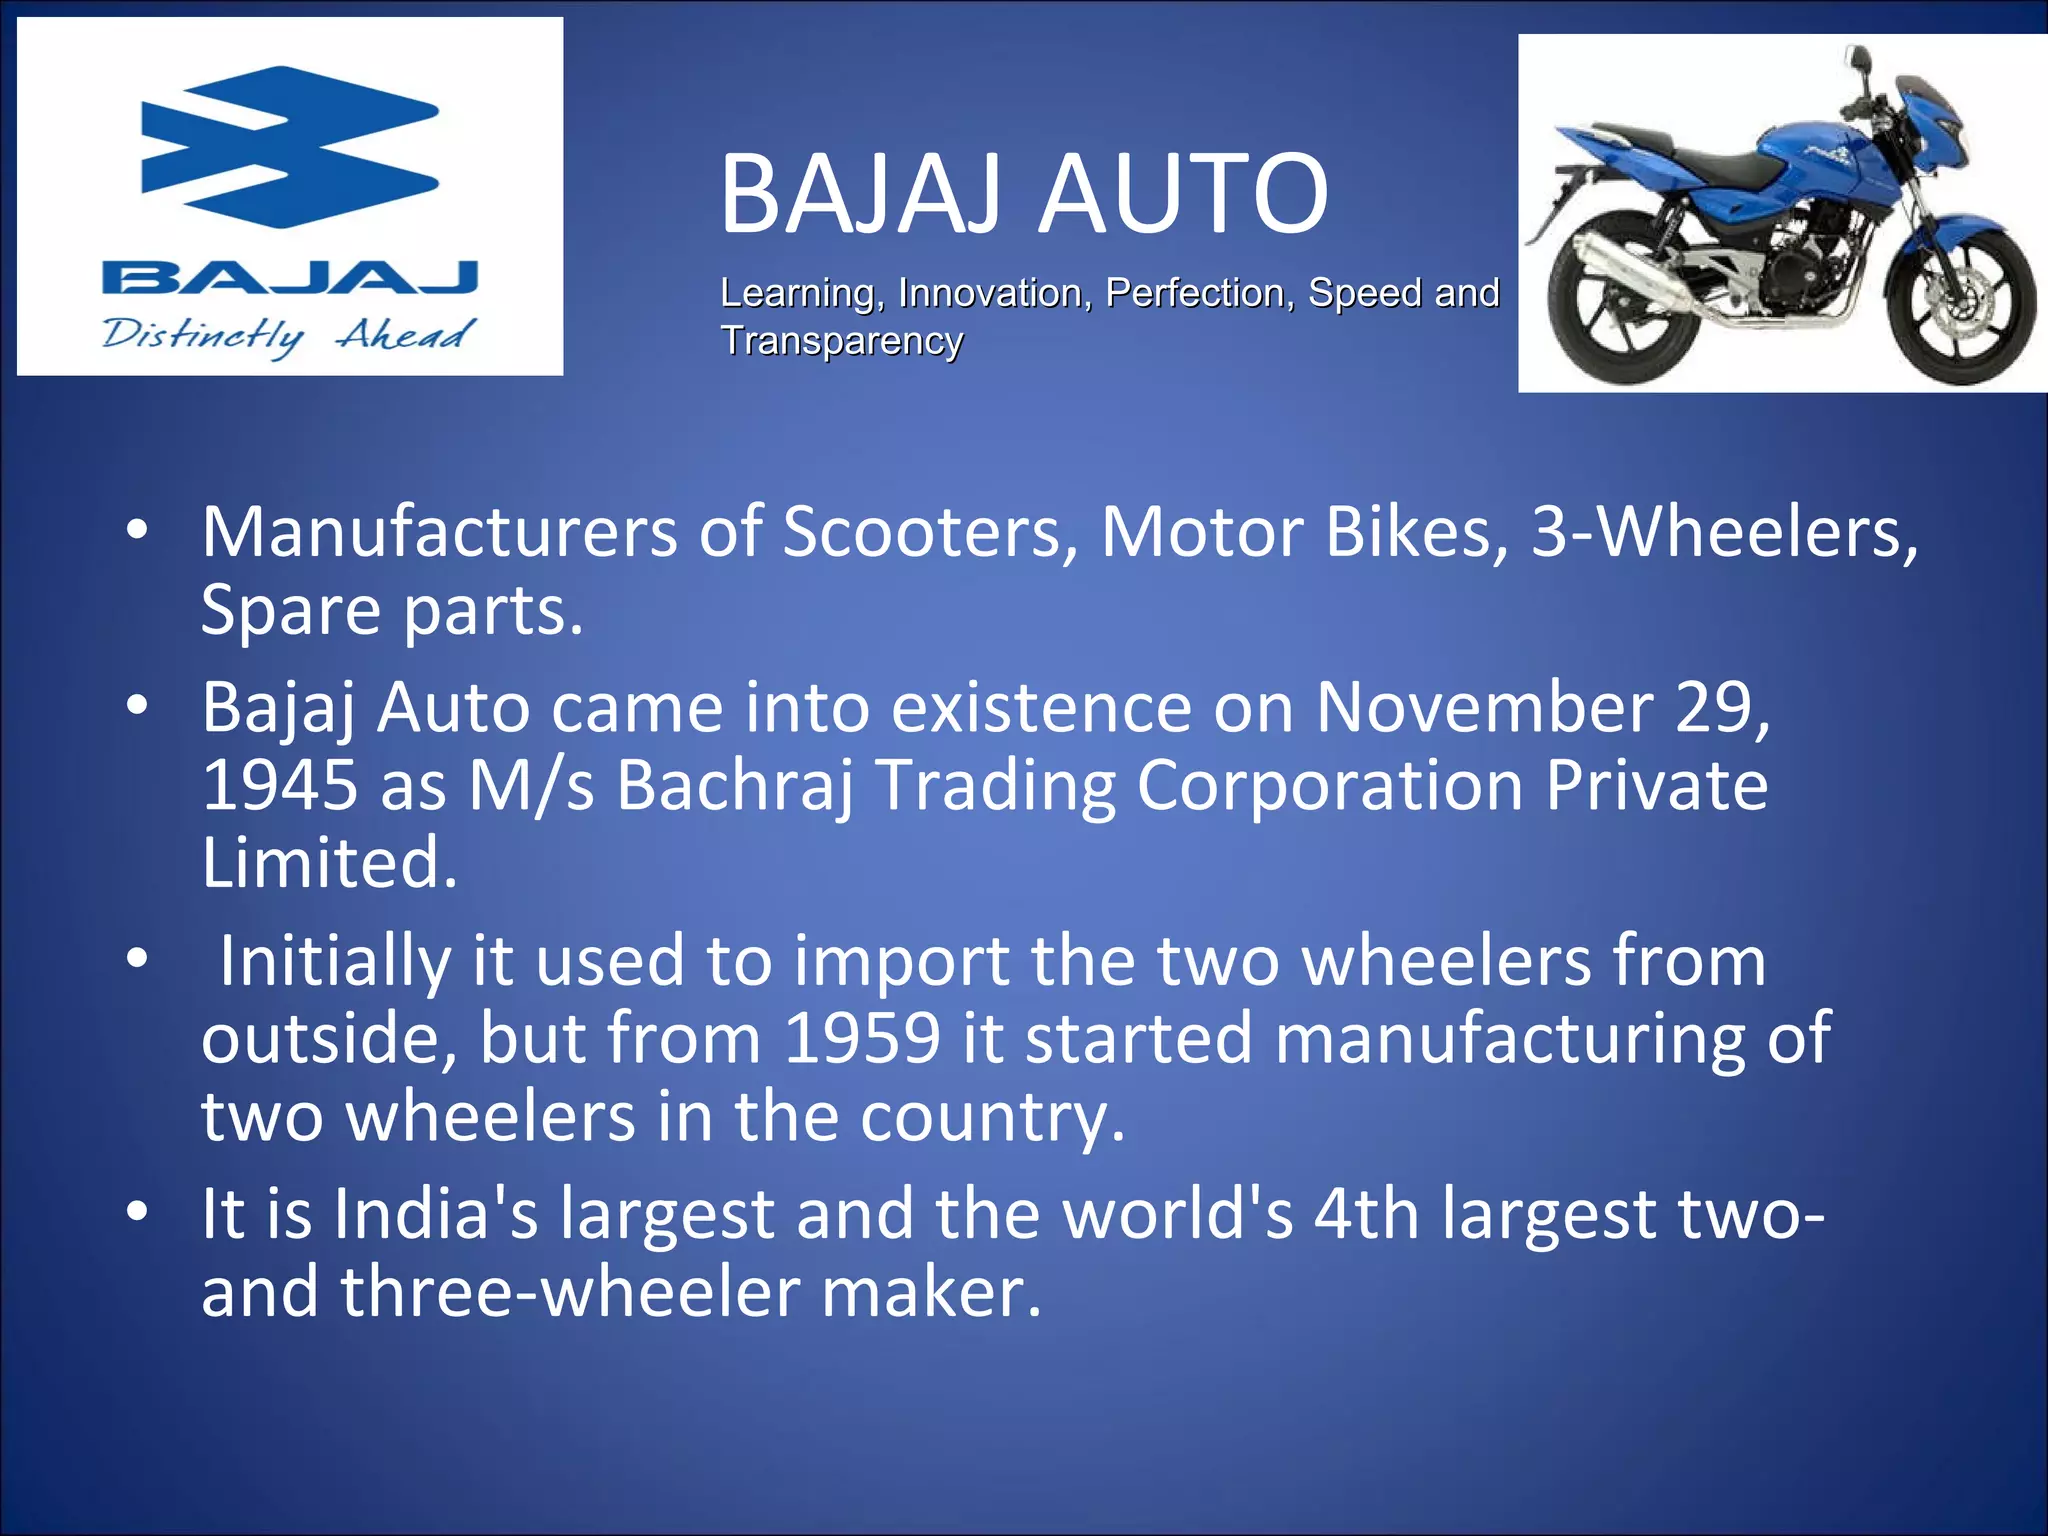
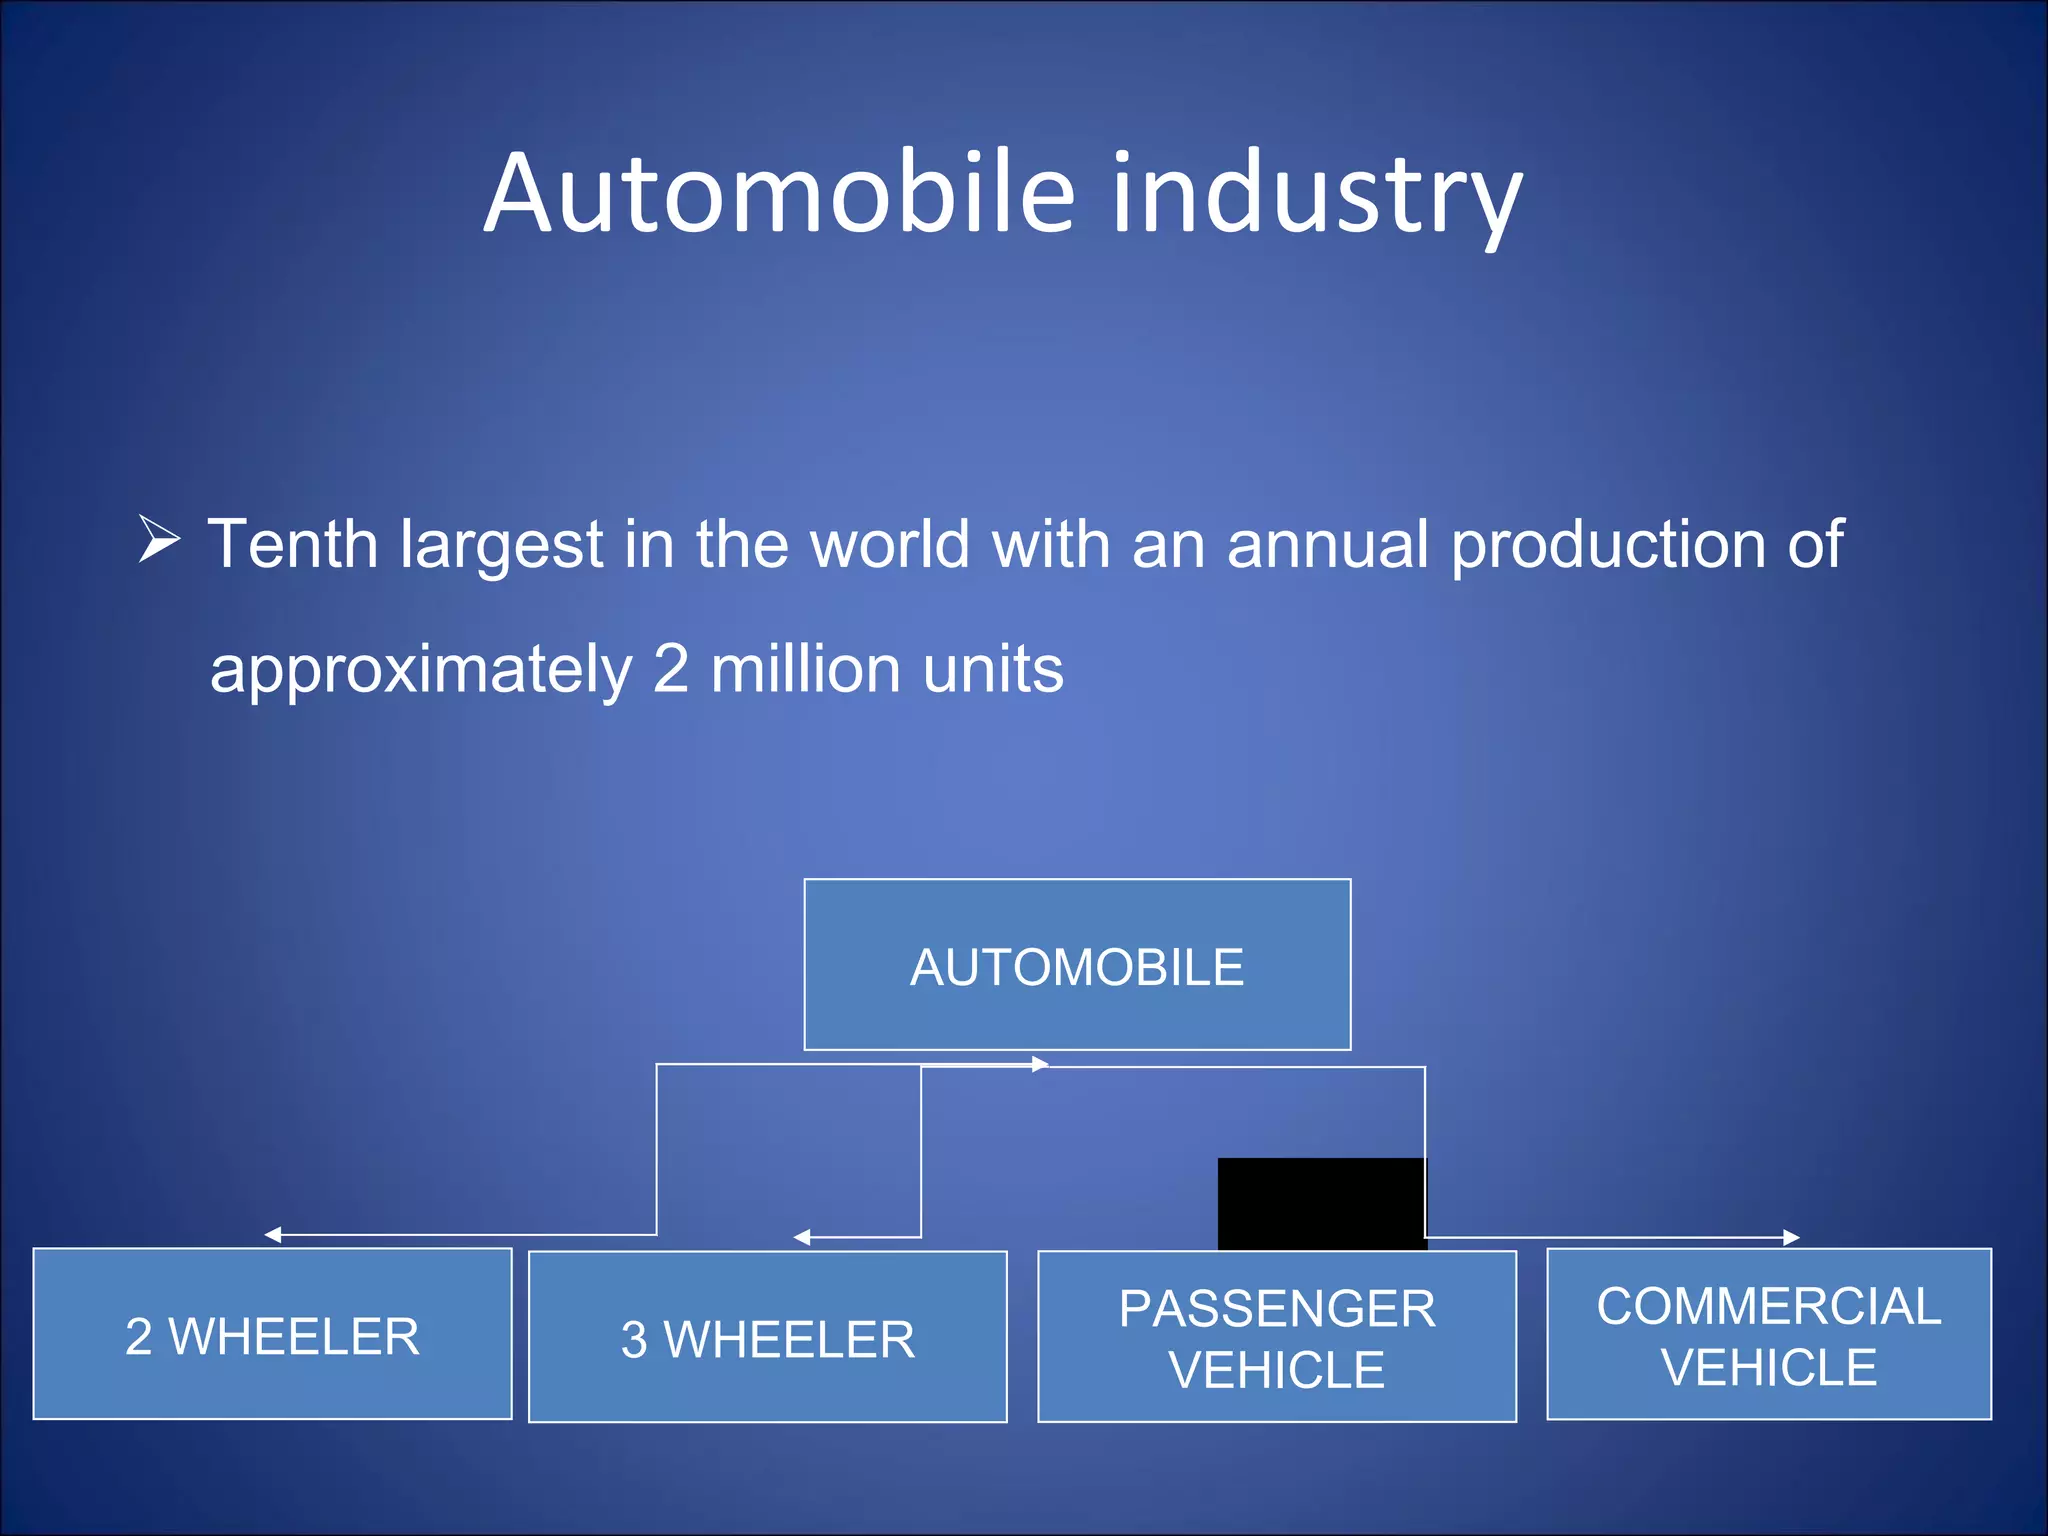
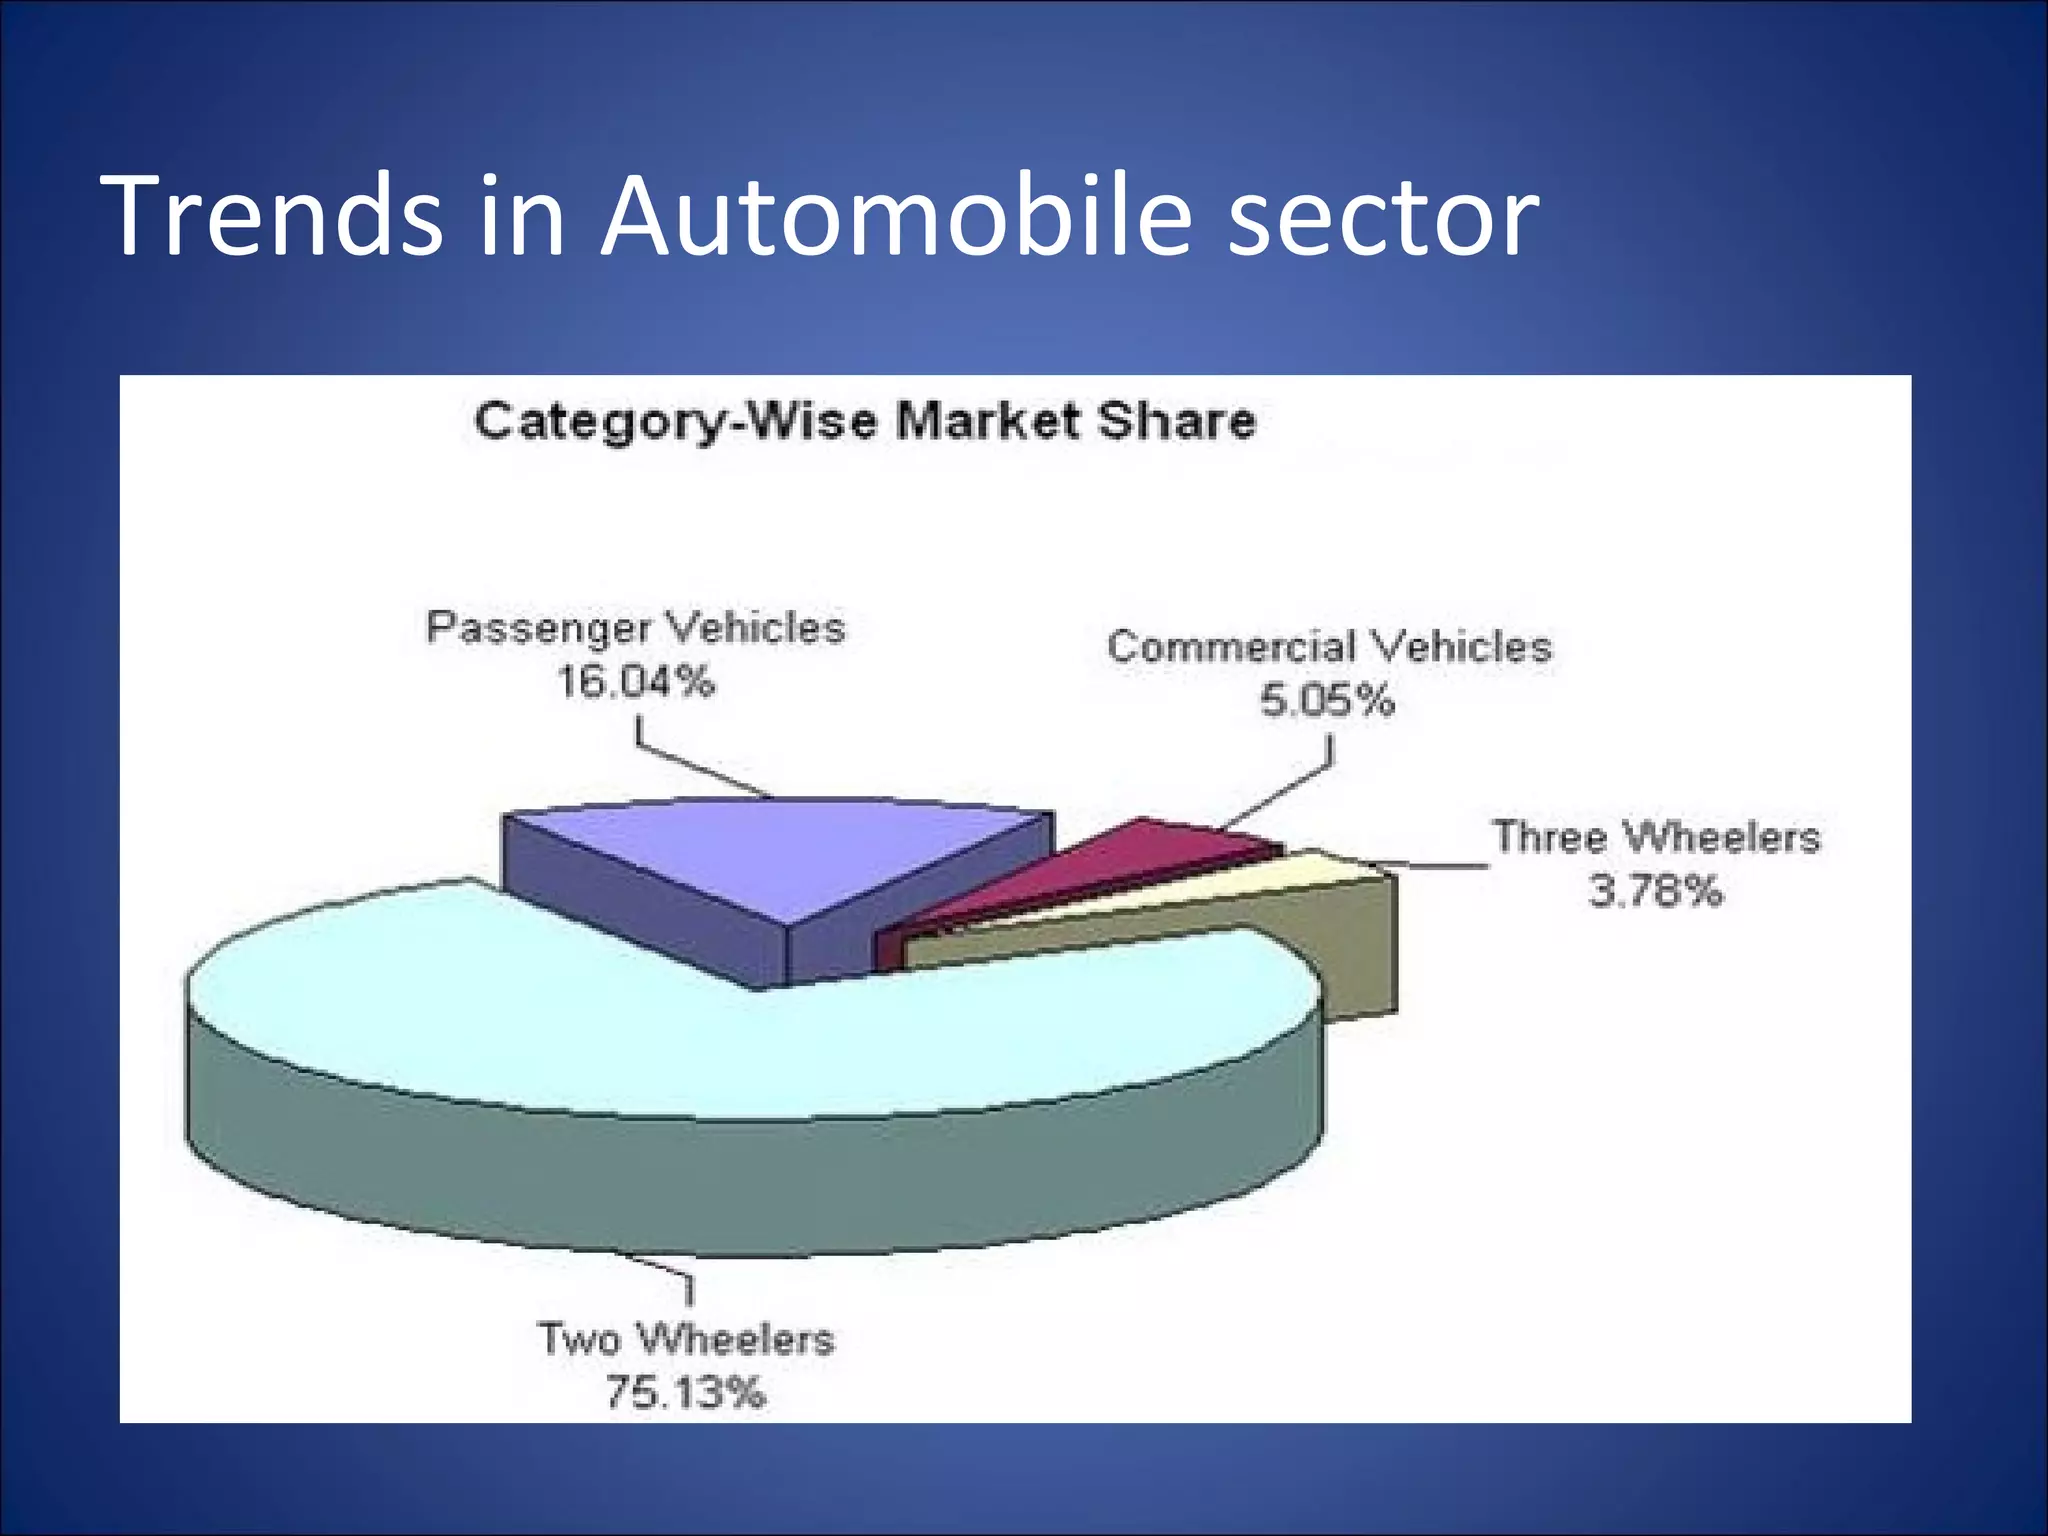
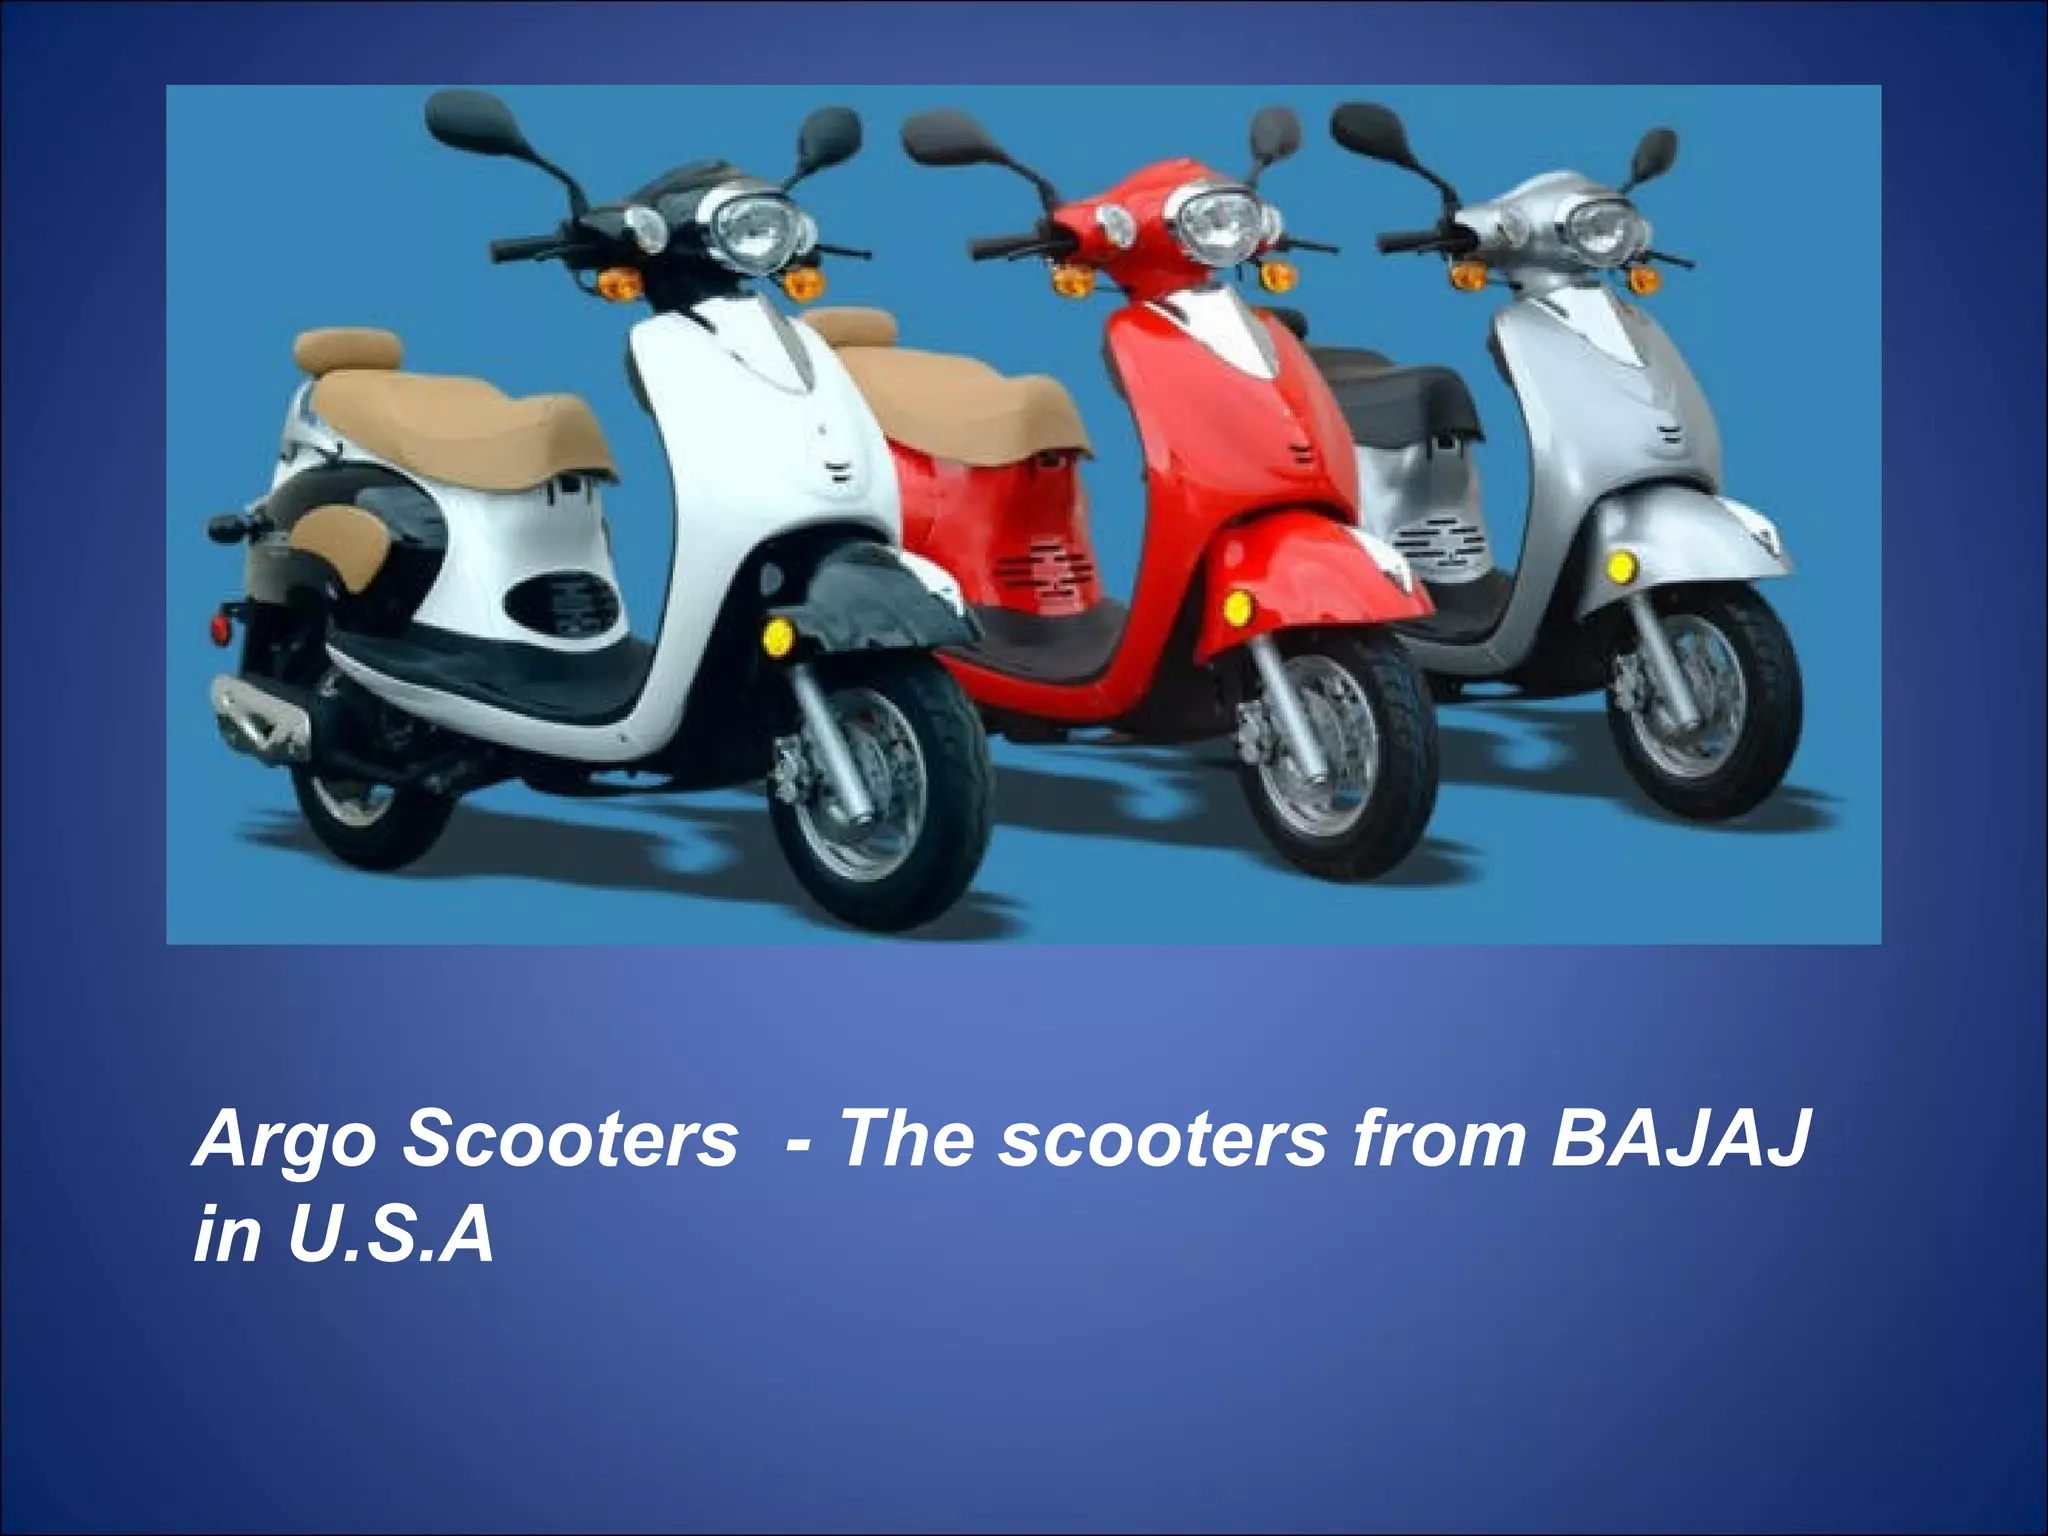
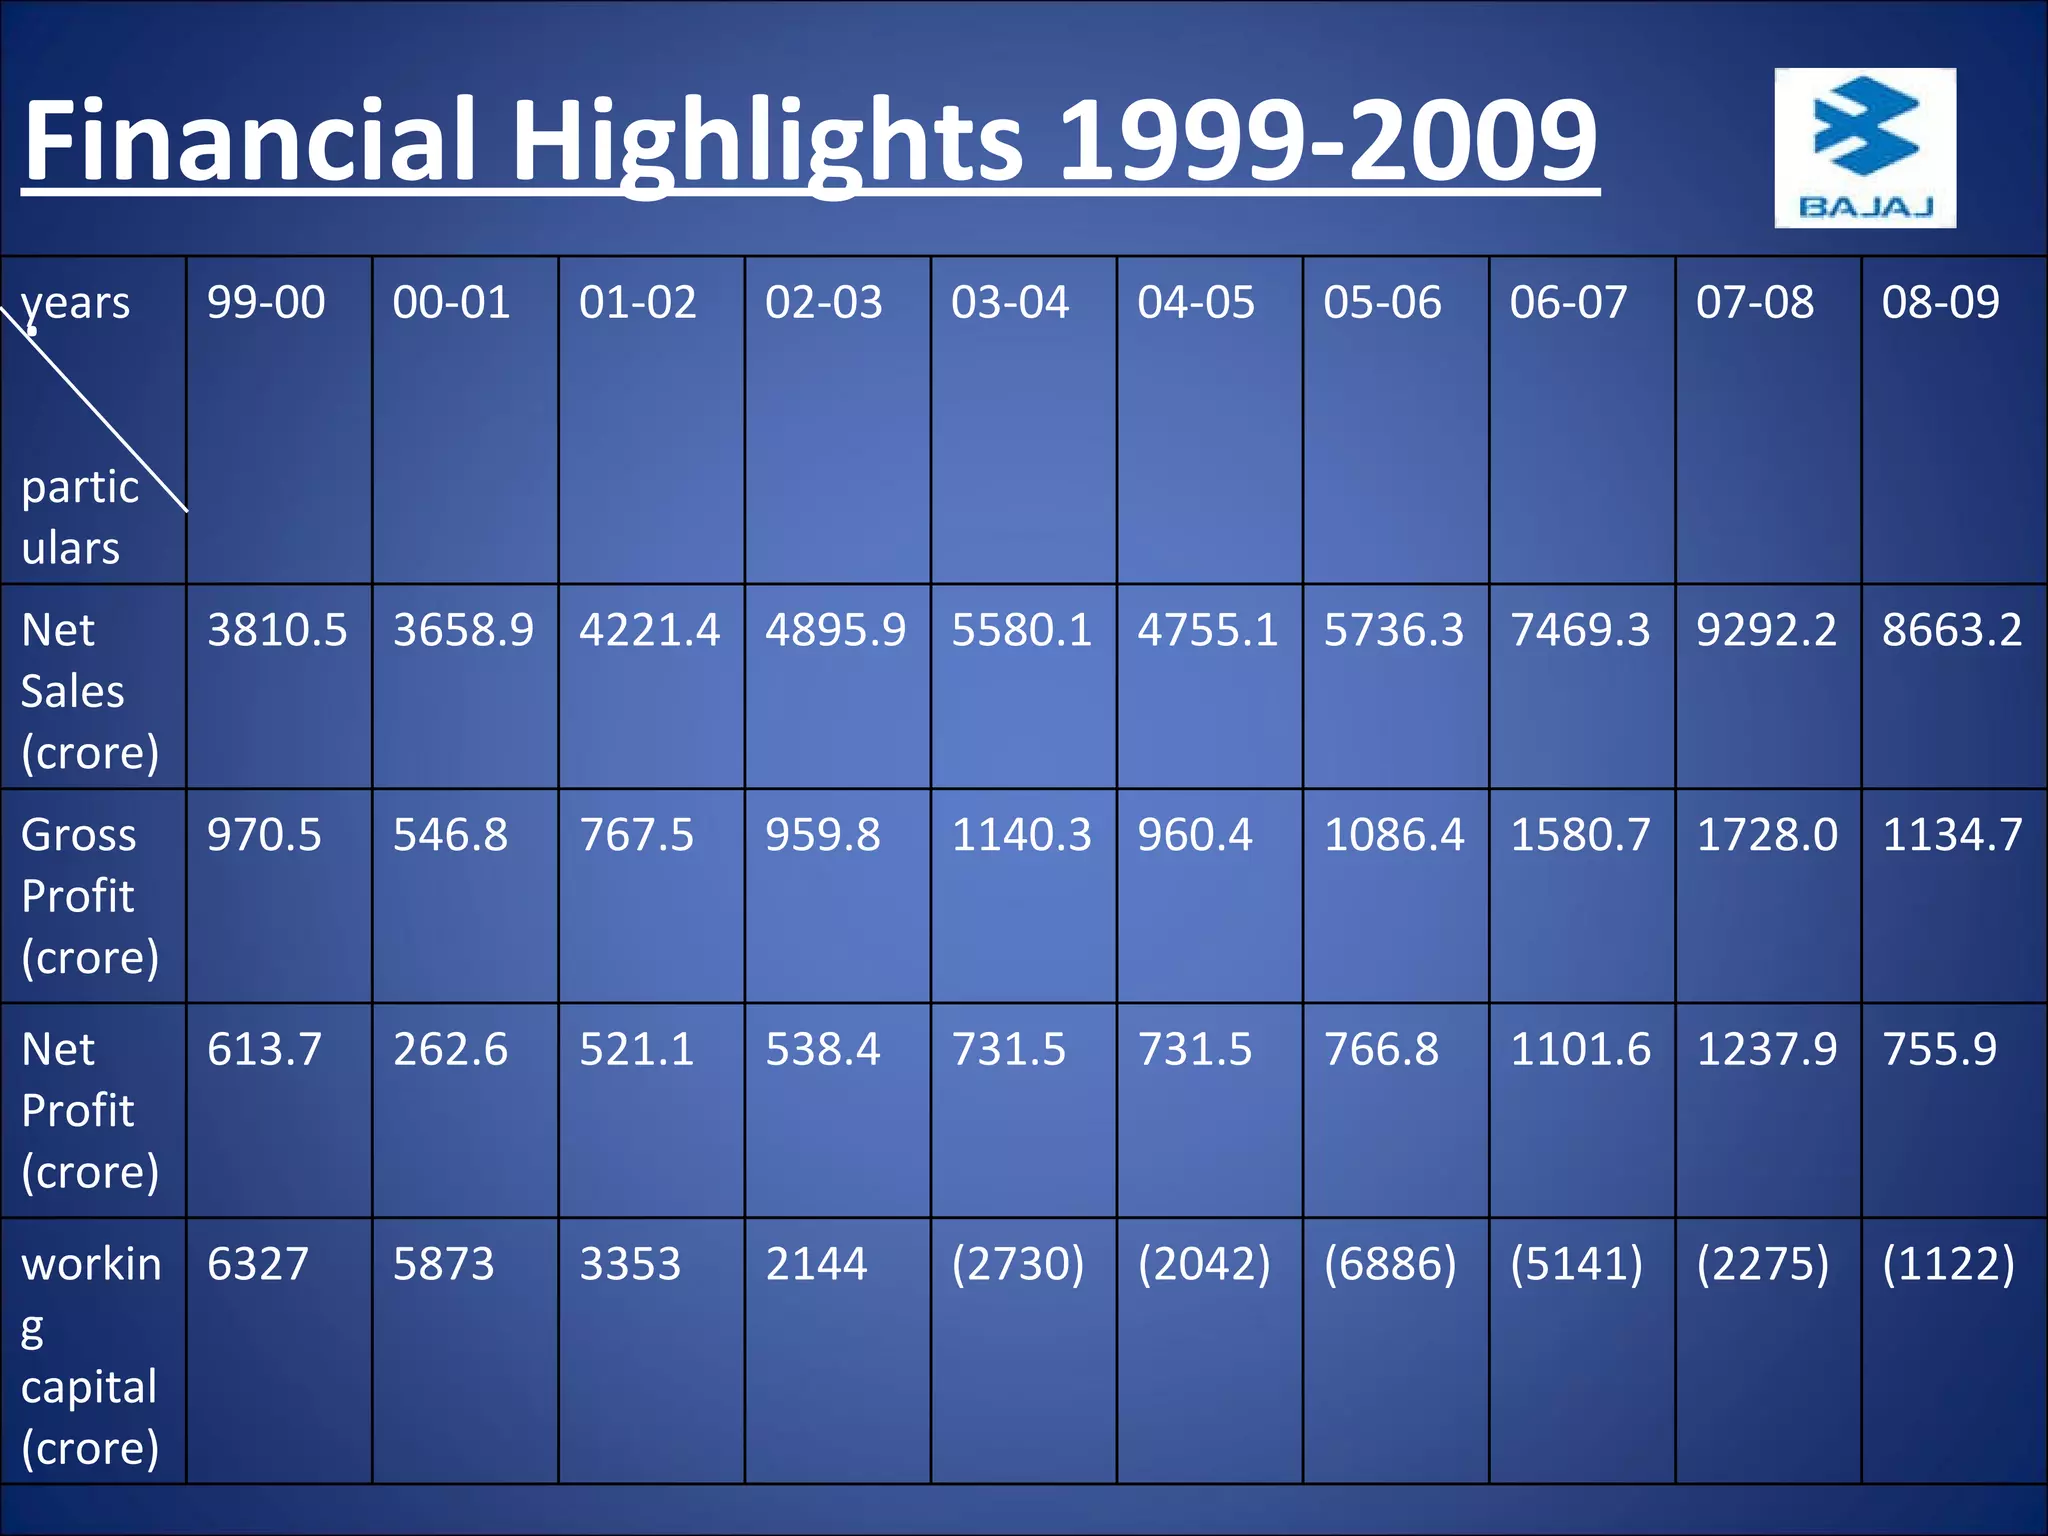
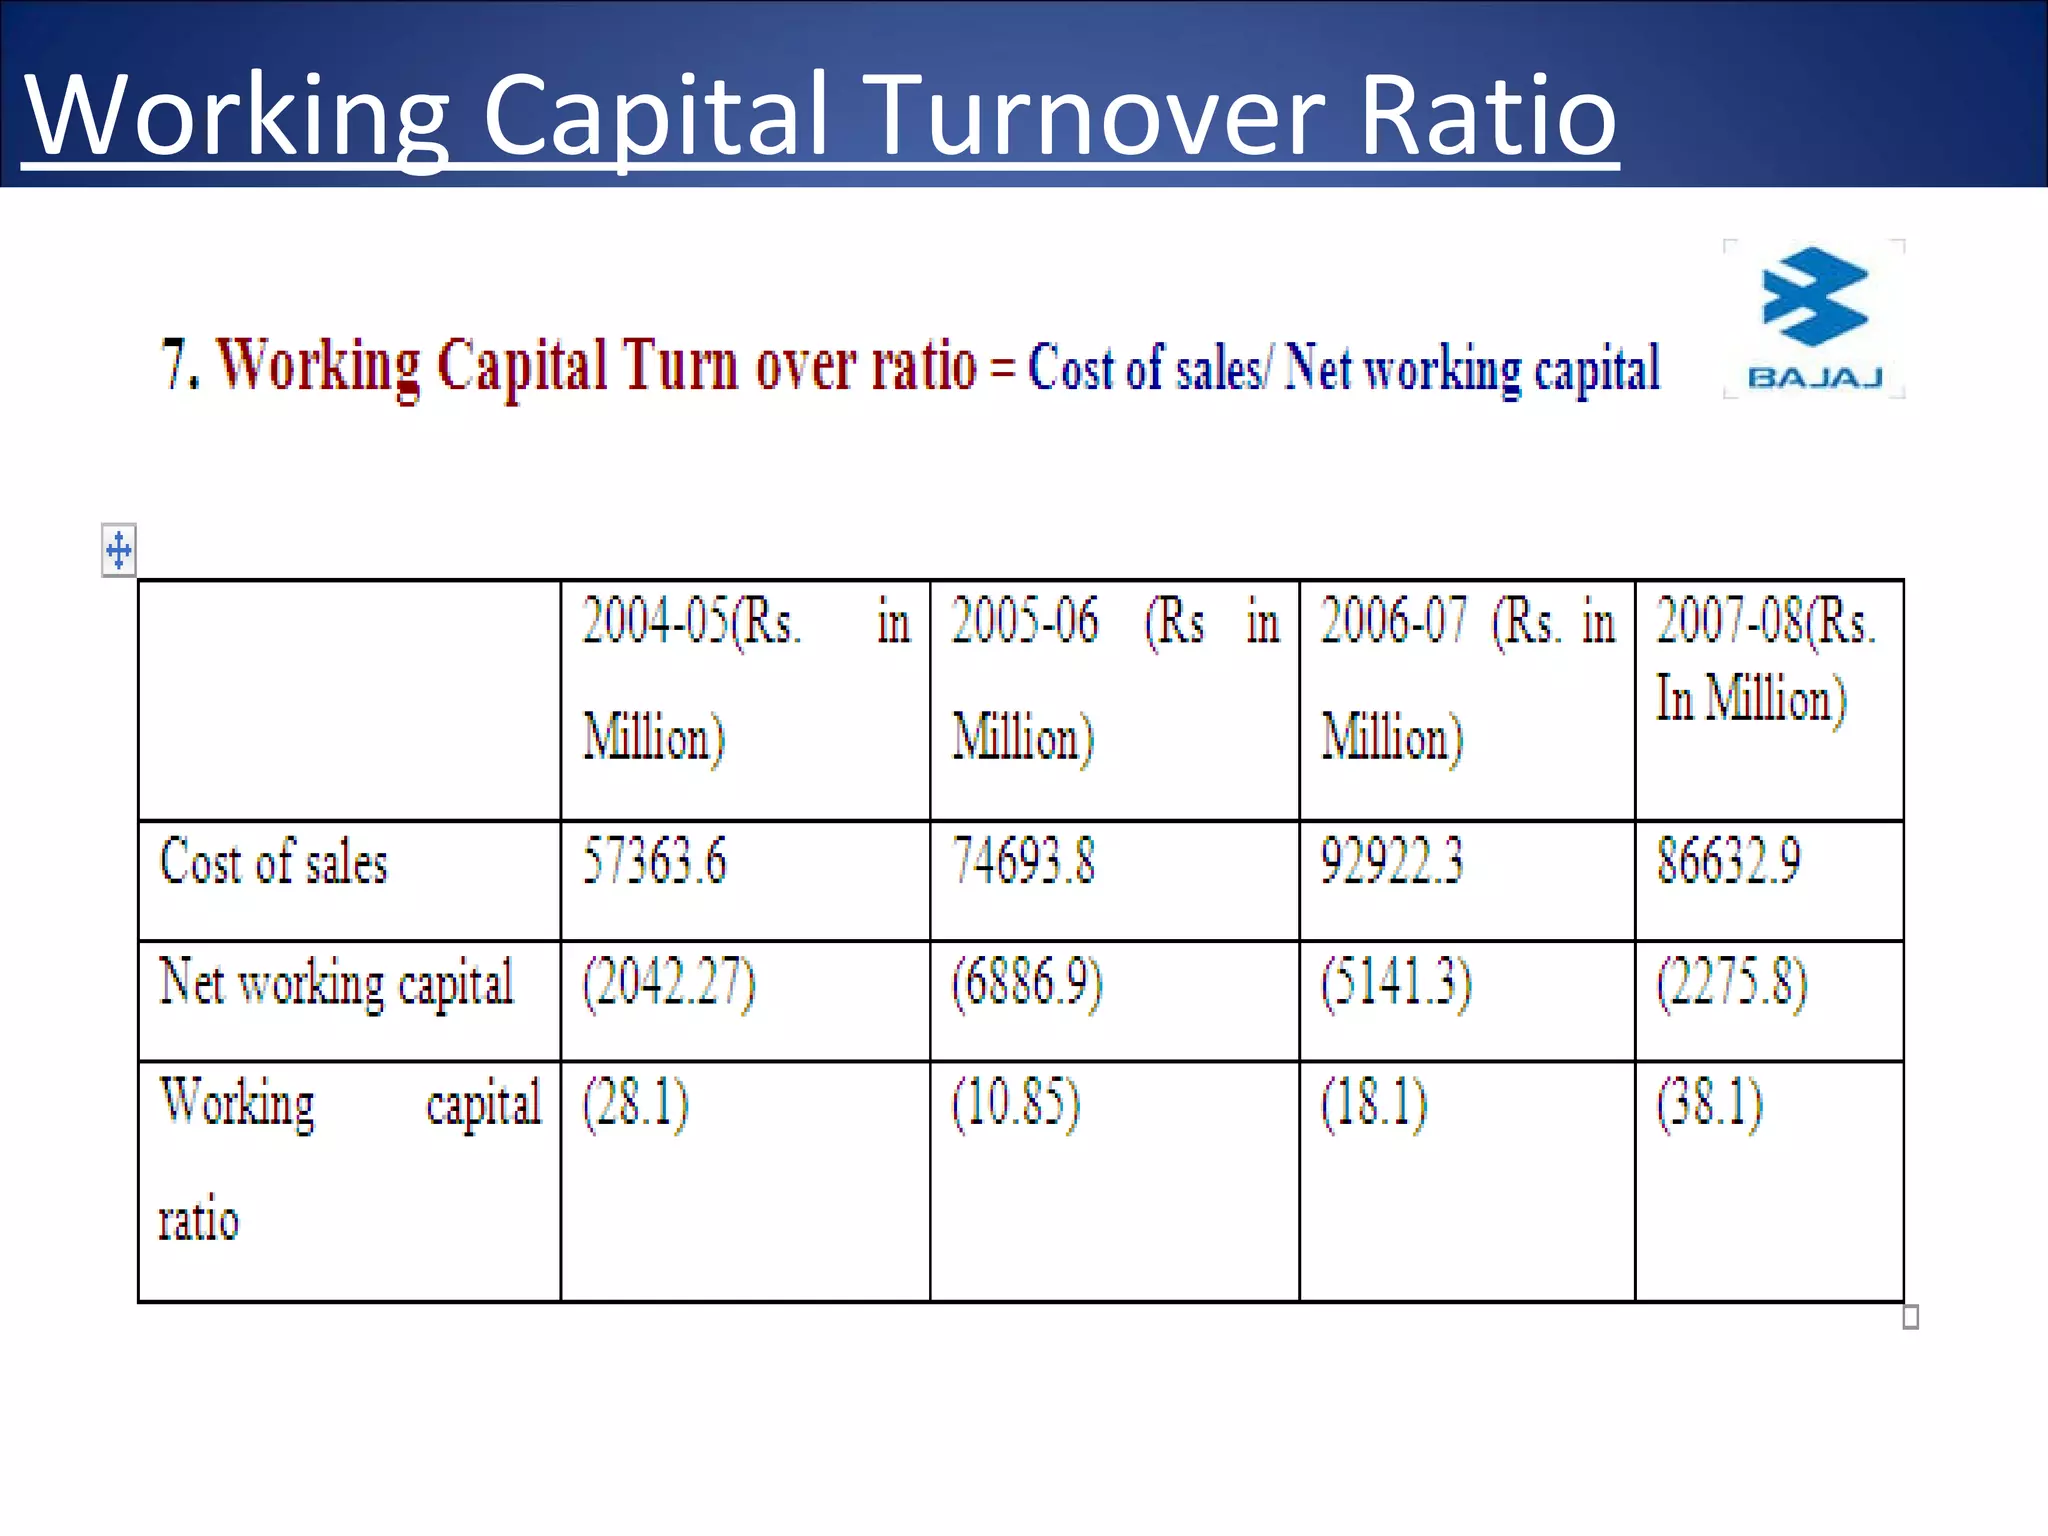
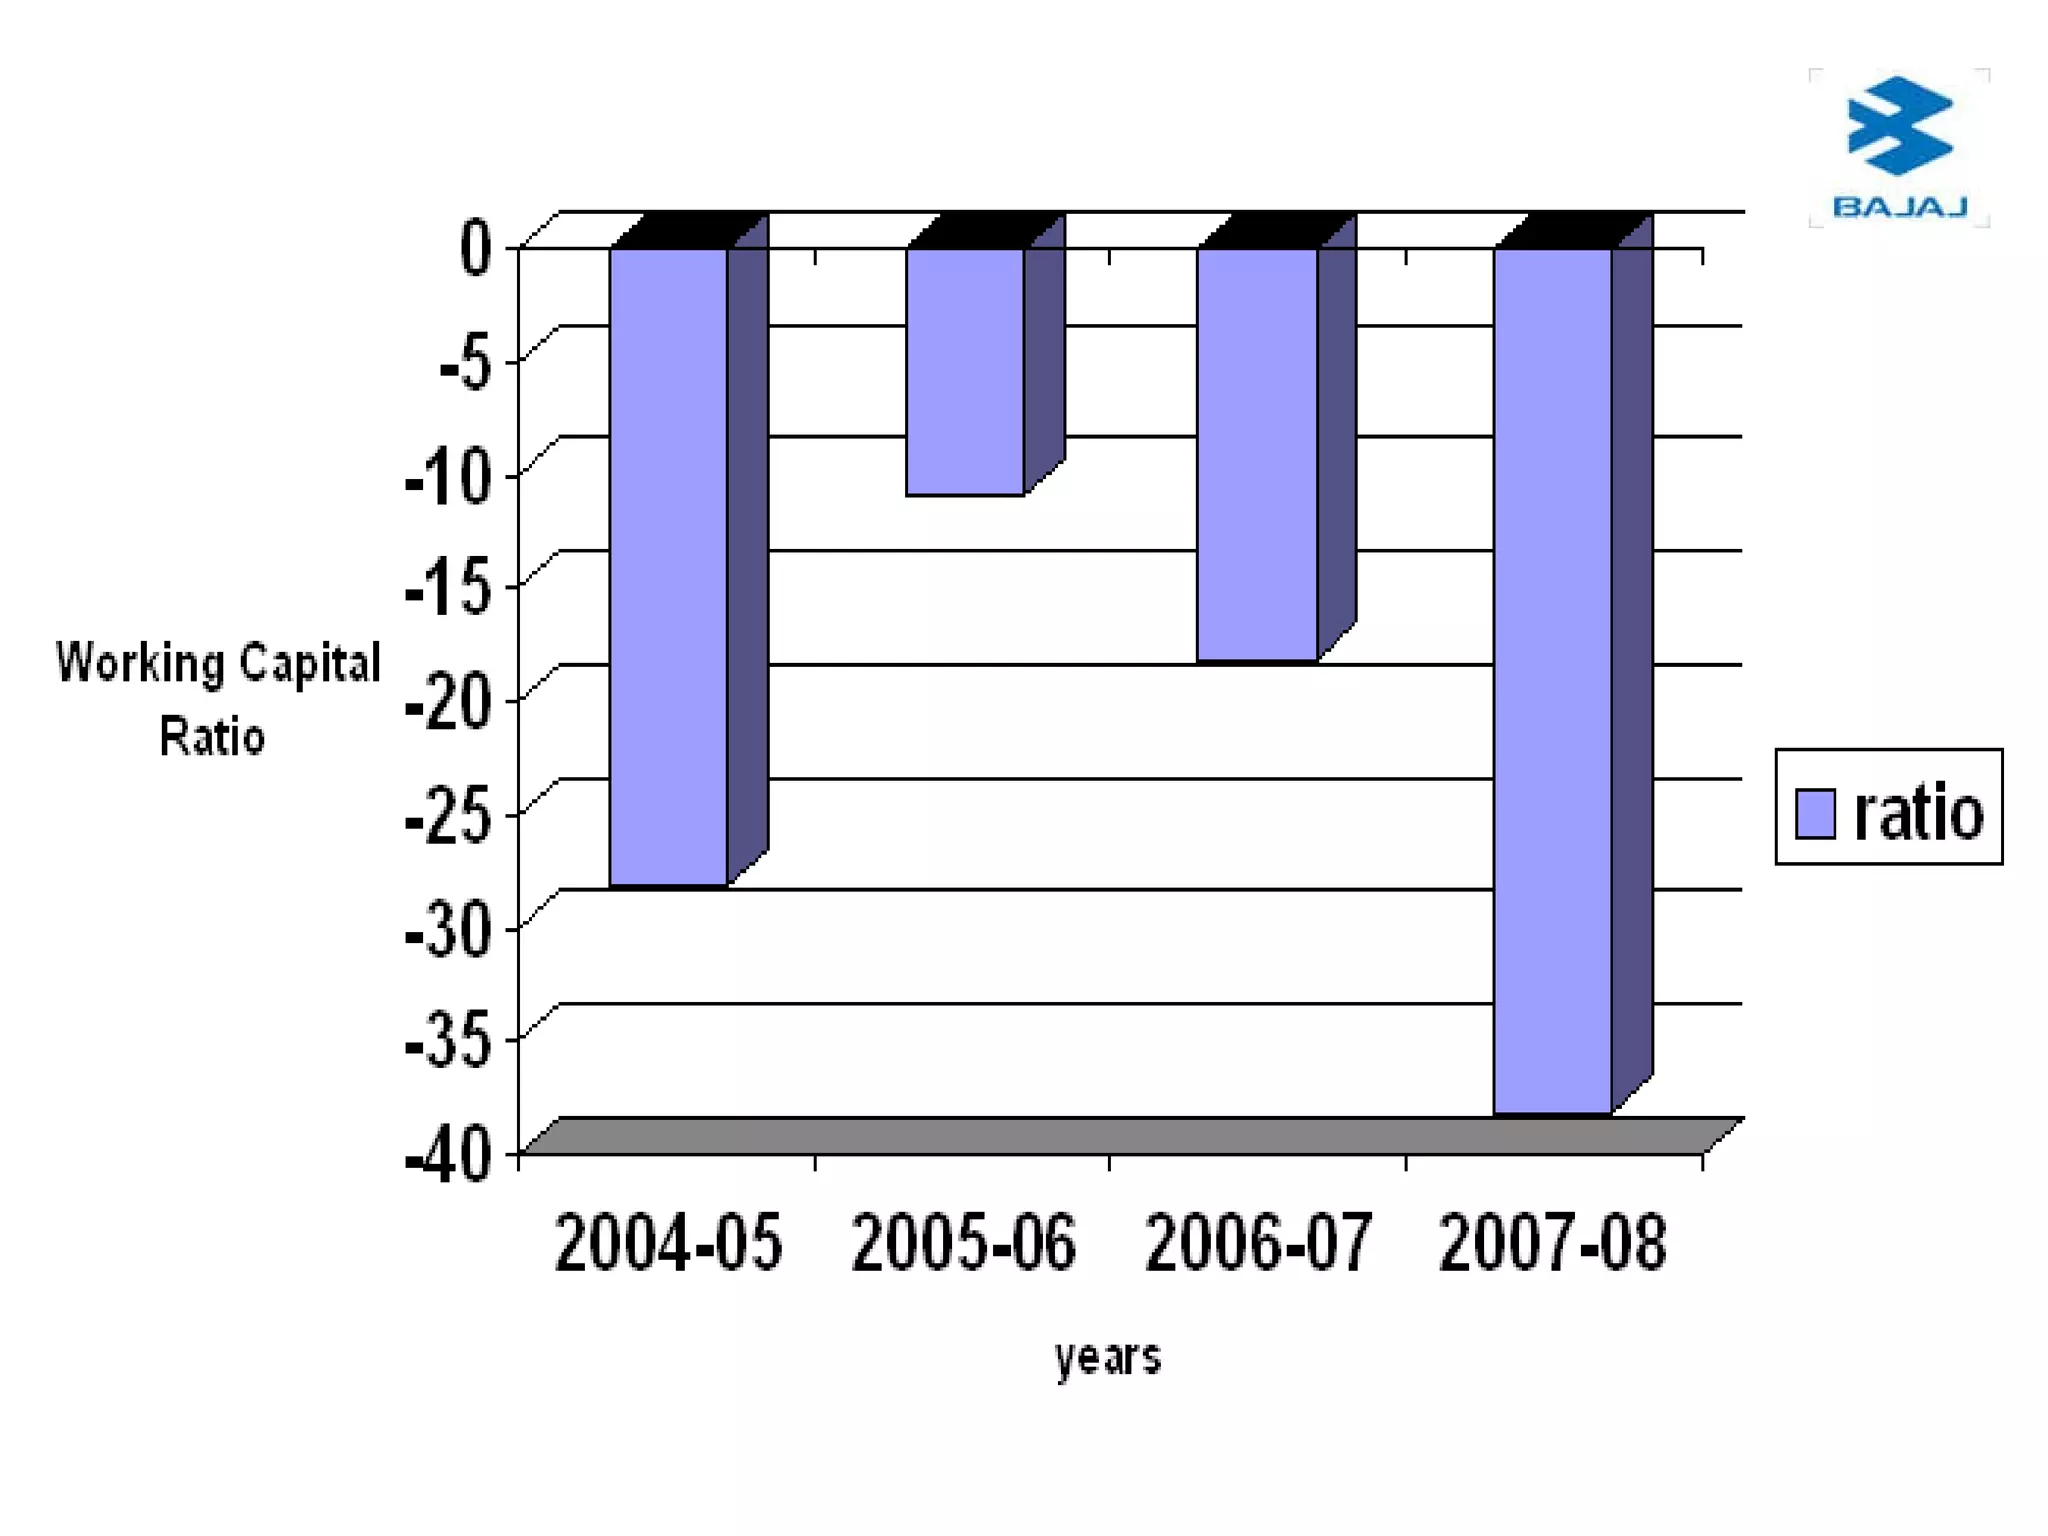
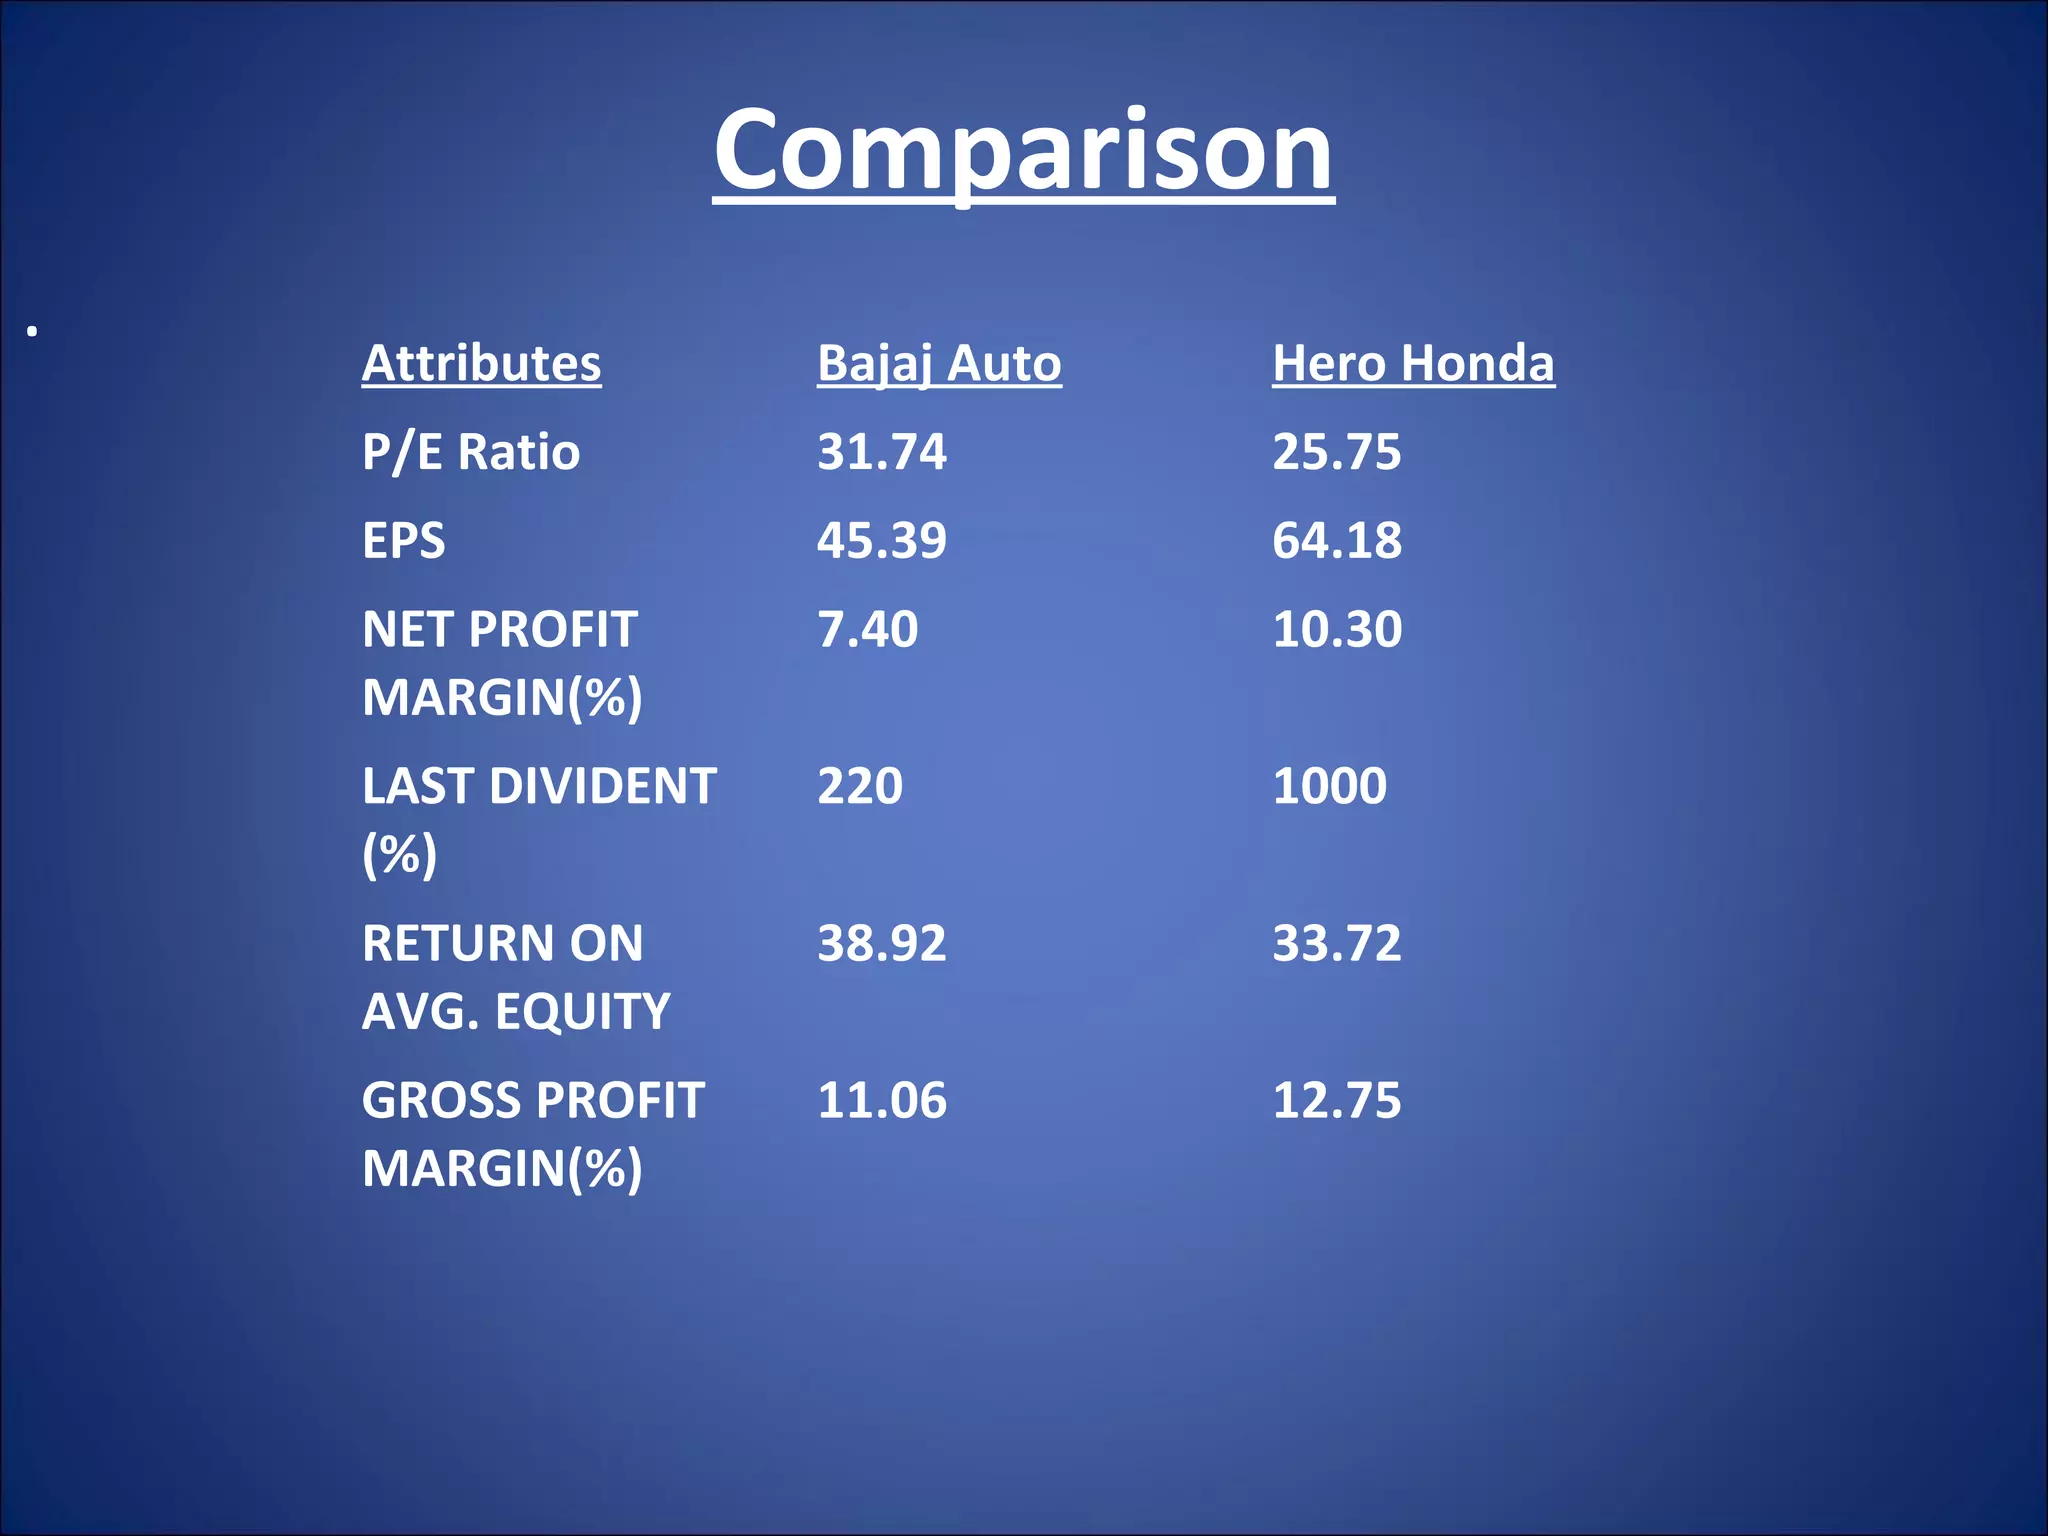
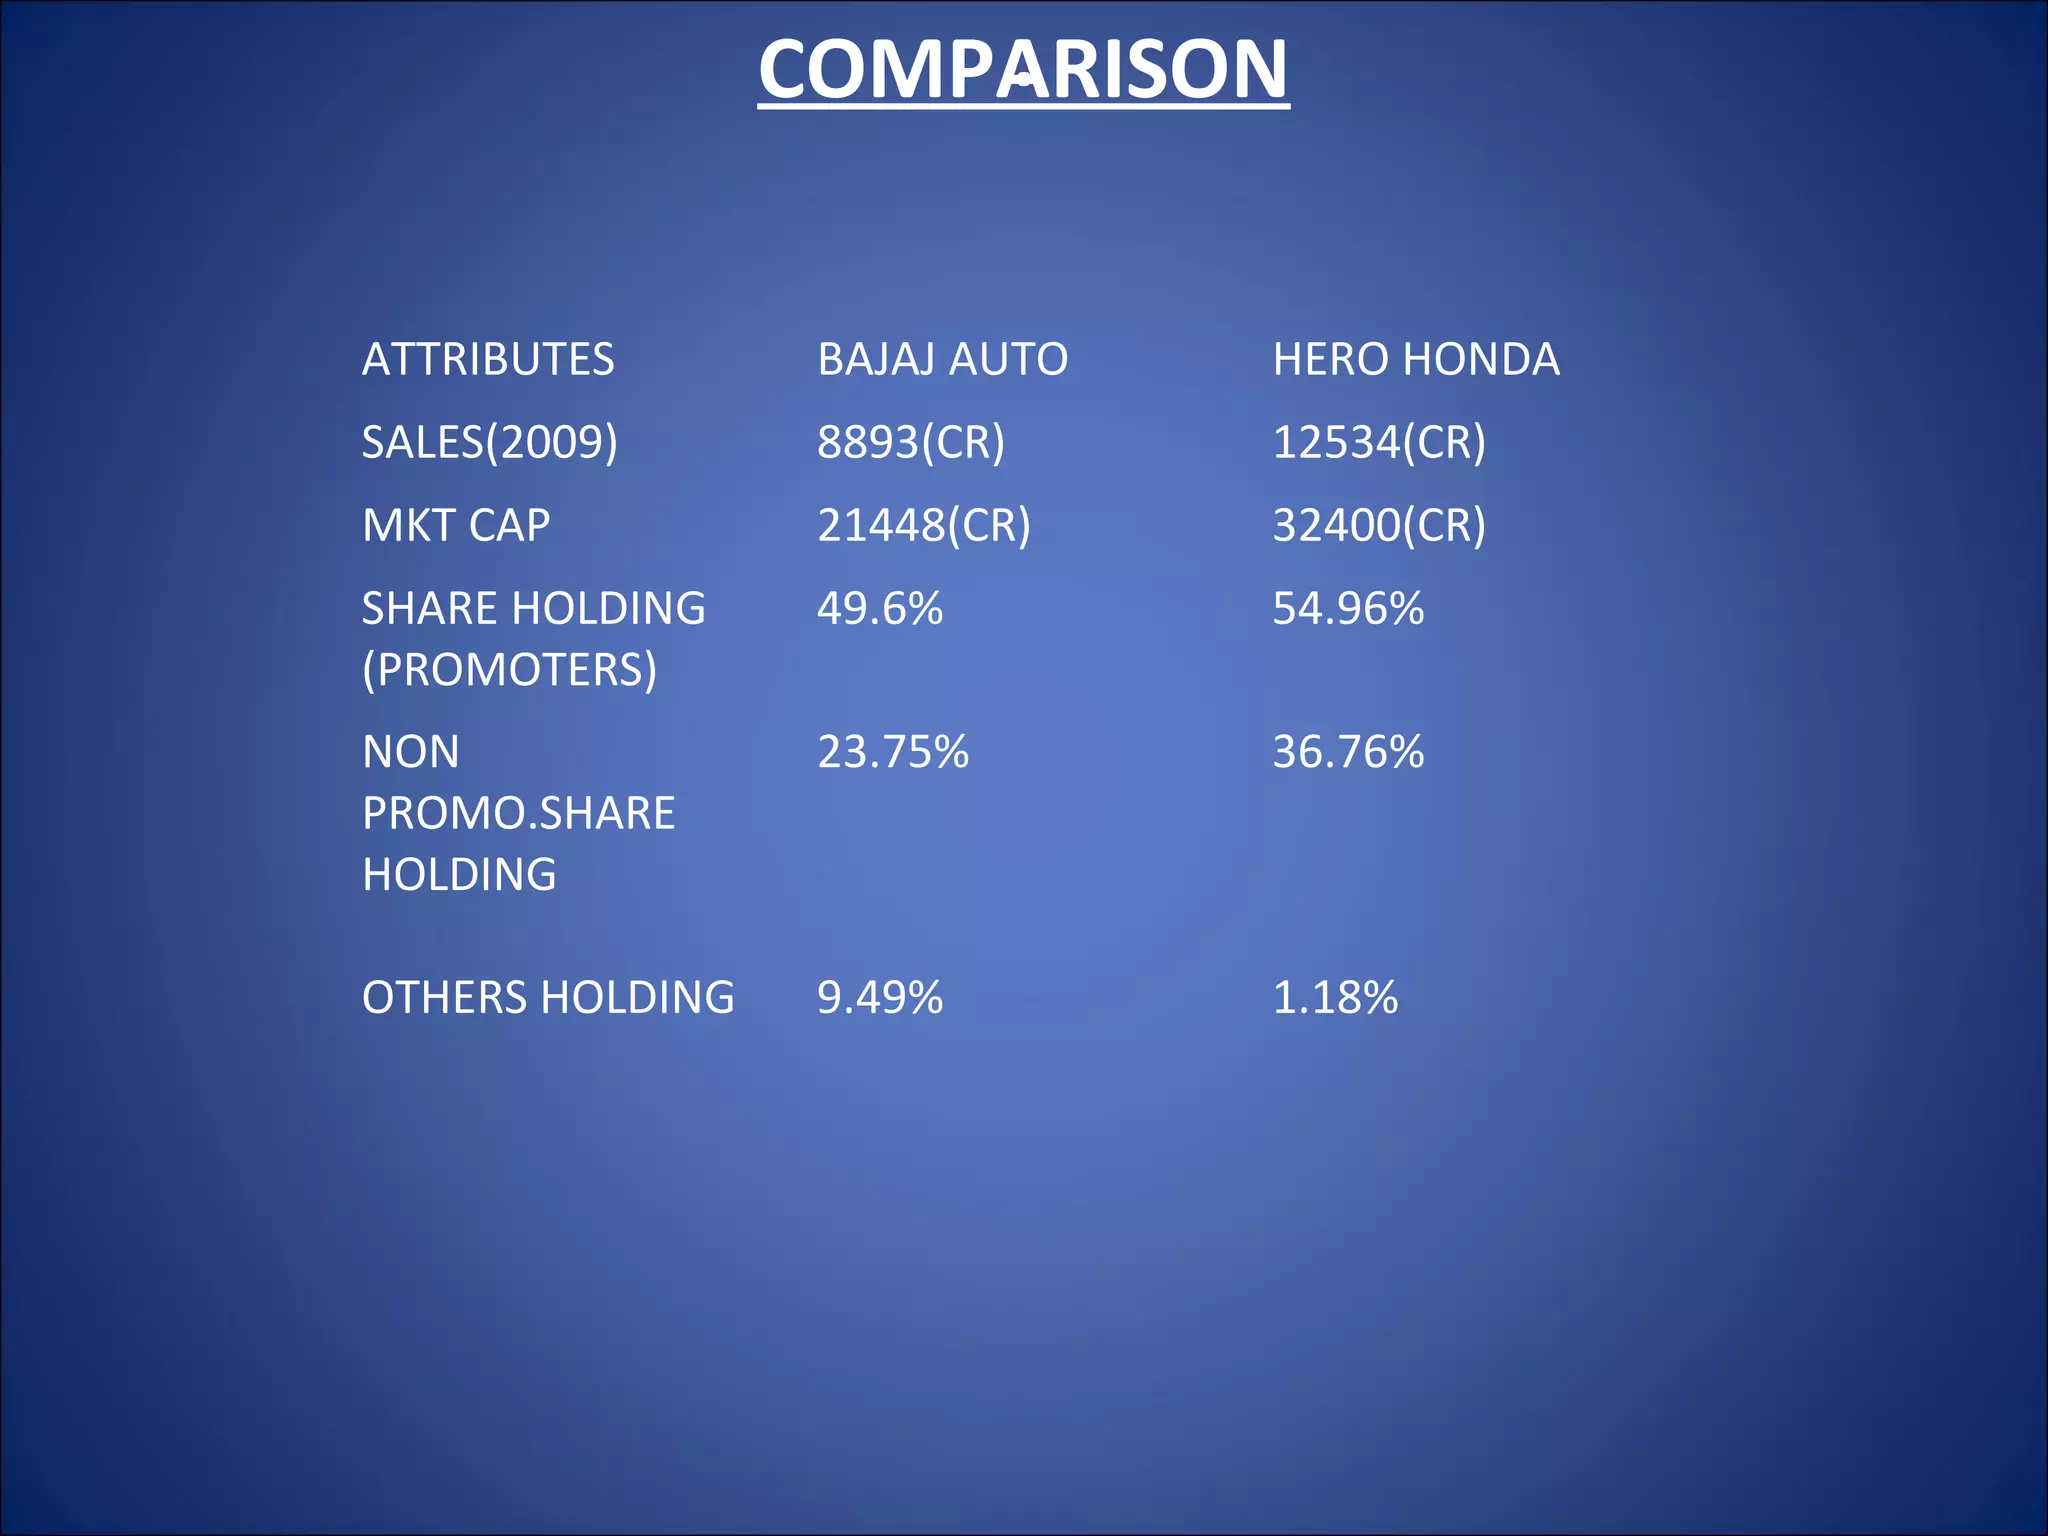
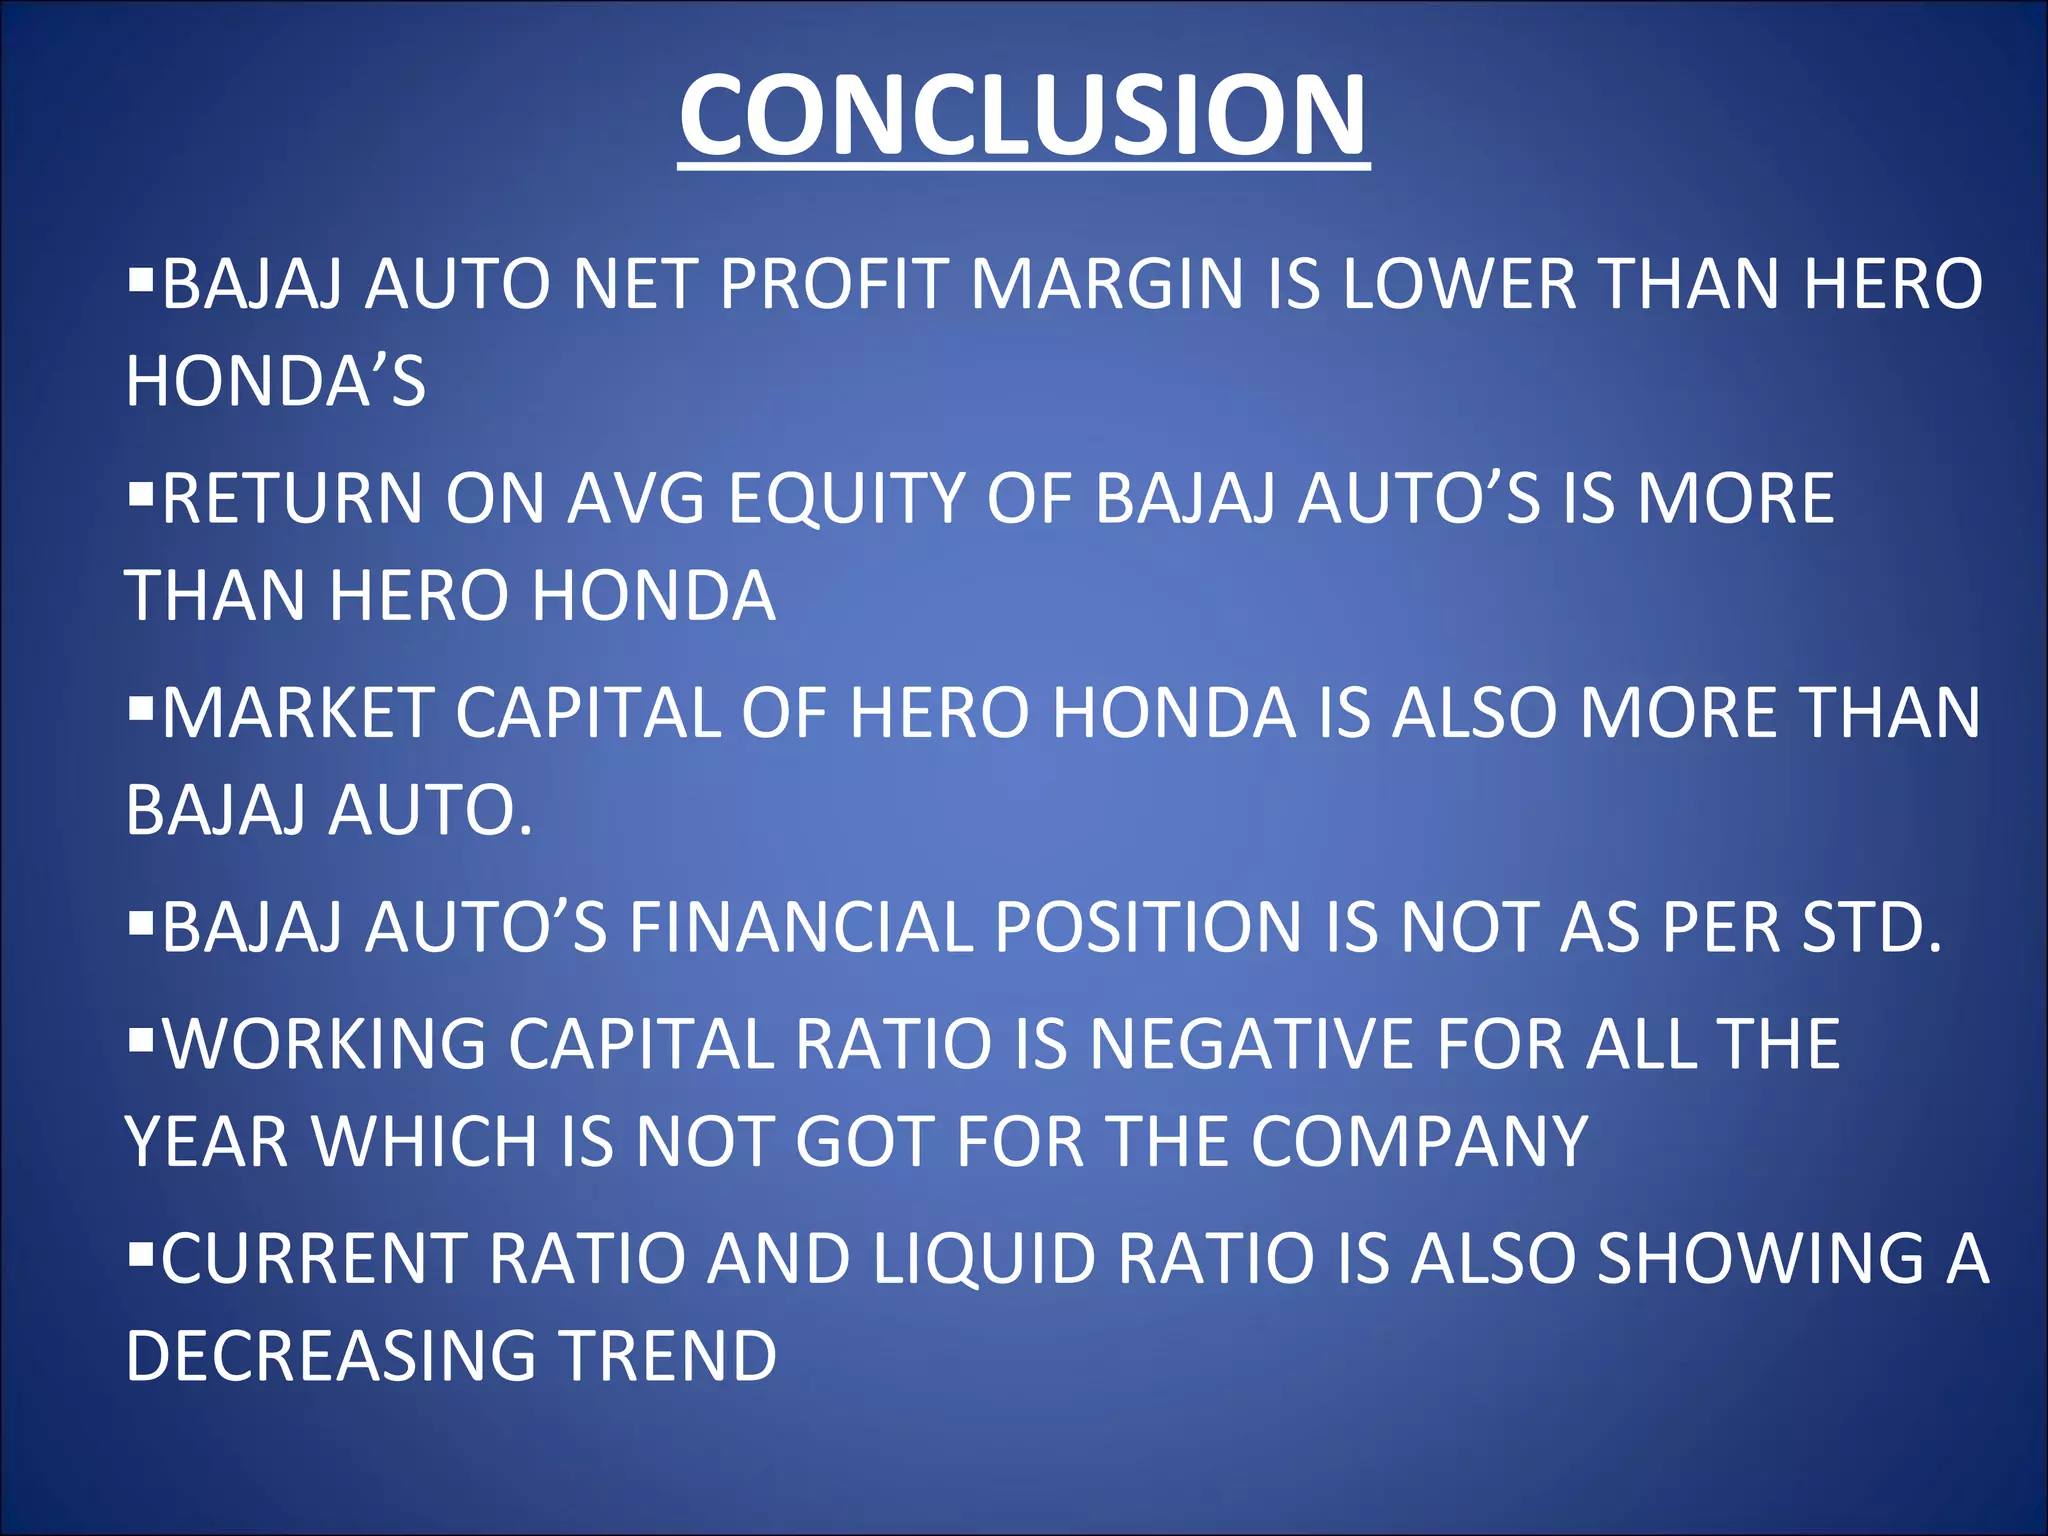
Bajaj Auto Financial Analysis Presented by: Shailesh Mishra Trilokinath Gupta Purushottam Singh
HISTORY Founded in 1926. The man behind BAJAJ:  JAMANALAL BAJAJ. He valued honesty over profit, actions over words and common good over individual gain. KAMALNAYAN BAJAJ, in 1942, diversified it into various manufacturing activities.
1931, started as sugar manufacturing factory. 1945, turned as the BAJAJ AUTO. RAHUL BAJAJ took charge of business in 1965 Worth US$ 3 billion
BAJAJ AUTO Manufacturers of Scooters, Motor Bikes, 3-Wheelers, Spare parts. Bajaj Auto came into existence on November 29, 1945 as M/s Bachraj Trading Corporation Private Limited. Initially it used to import the two wheelers from outside, but from 1959 it started manufacturing of two wheelers in the country.  It is India's largest and the world's 4th largest two- and three-wheeler maker.  Learning, Innovation, Perfection, Speed and Transparency
Timeline of new releases  1971 - three-wheeler goods carrier  1972 - Bajaj Chetak 1990- Bajaj Sunny 1997- Kawasaki Bajaj Boxer 1998 - Kawasaki Bajaj Caliber,legend,Bajaj Spirit 2000 - Bajaj Saffire 2001 - Eliminator, Pulsar  2003 - Caliber115, Bajaj Wind 125, Bajaj Pulsar  2004 - Bajaj CT 100, New Bajaj Chetak 4-stroke 2006 - Bajaj Platina  2007 - Bajaj Pulsar-200(Oil Cooled), Bajaj Kristal, Bajaj Pulsar 220 DTS-Fi , XCD 125 DTS-Si
.
Automobile industry  Tenth largest in the world with an annual production of approximately 2 million units AUTOMOBILE 2 WHEELER 3 WHEELER PASSENGER VEHICLE COMMERCIAL VEHICLE
Trends in Automobile sector
Argo Scooters  - The scooters from BAJAJ in U.S.A
Export Destinations
Financial Highlights 1999-2009 . years particulars 99-00 00-01 01-02 02-03 03-04 04-05 05-06 06-07 07-08 08-09 Net Sales (crore) 3810.5 3658.9 4221.4 4895.9 5580.1 4755.1 5736.3 7469.3 9292.2 8663.2 Gross Profit (crore) 970.5 546.8 767.5 959.8 1140.3 960.4 1086.4 1580.7 1728.0 1134.7 Net Profit (crore) 613.7 262.6 521.1 538.4 731.5 731.5 766.8 1101.6 1237.9 755.9 working capital(crore) 6327 5873 3353 2144 (2730) (2042) (6886) (5141) (2275) (1122)
We adopt the ratio analysis method to analyze the financial position of  Bajaj Auto Ltd .
Objectives of Ratio Analysis Standardize financial information for comparisons Evaluate current operations Compare performance with past performance Compare performance against other firms or industry standards Study the efficiency of operations Study the risk of operations .
. Analysis and interpretation
.
Liquid Ratio .
.
Absolute Liquid Ratio
.
Inventory Turnover Ratio
. .
Debtors Turnover Ratio
. .
Creditors Turnover Ratio .
.
Working Capital Turnover Ratio .
. .
Bajaj Auto V/s Hero Honda .
Comparison . Attributes Bajaj Auto Hero Honda P/E Ratio 31.74 25.75 EPS 45.39 64.18 NET PROFIT MARGIN(%) 7.40 10.30 LAST DIVIDENT (%) 220 1000 RETURN ON AVG. EQUITY 38.92 33.72 GROSS PROFIT MARGIN(%) 11.06 12.75
. COMPARISON ATTRIBUTES BAJAJ AUTO HERO HONDA SALES(2009) 8893(CR) 12534(CR) MKT CAP 21448(CR) 32400(CR) SHARE HOLDING (PROMOTERS) 49.6% 54.96% NON PROMO.SHARE HOLDING OTHERS HOLDING 23.75% 9.49% 36.76% 1.18%
CONCLUSION BAJAJ AUTO NET PROFIT MARGIN IS LOWER THAN HERO HONDA’S  RETURN ON AVG EQUITY OF BAJAJ AUTO’S IS MORE THAN HERO HONDA  MARKET CAPITAL OF HERO HONDA IS ALSO MORE THAN BAJAJ AUTO. BAJAJ AUTO’S FINANCIAL POSITION IS NOT AS PER STD. WORKING CAPITAL RATIO IS NEGATIVE FOR ALL THE YEAR WHICH IS NOT GOT FOR THE COMPANY CURRENT RATIO AND LIQUID RATIO IS ALSO SHOWING A DECREASING TREND
CONCLUSION ….. BAJAJ AUTO SHOULD TRY TO IMPROVE ITS CURRENT RATIO WORKING CAPITAL IS NEGATIVE WHICH IS NOT IMPRESSIVE  SALES IN THE CURRENT YR.DECREASES DUE TO RECESSION OVERALL FINANCIAL  AND EARNING CAPACITY OF BAJAJ AUTO IS LOWER THAN HERO HONDA
COMMUNITY SERVICE JankiDevi Bajaj Gram Vikas Sanstha. Samaj Seva Kendra. Kamalnayan Bajaj Hospital.
THANK YOU .

Bajaj Auto Financial Analysis

  • 1.
    Bajaj Auto FinancialAnalysis Presented by: Shailesh Mishra Trilokinath Gupta Purushottam Singh
  • 2.
    HISTORY Founded in1926. The man behind BAJAJ: JAMANALAL BAJAJ. He valued honesty over profit, actions over words and common good over individual gain. KAMALNAYAN BAJAJ, in 1942, diversified it into various manufacturing activities.
  • 3.
    1931, started assugar manufacturing factory. 1945, turned as the BAJAJ AUTO. RAHUL BAJAJ took charge of business in 1965 Worth US$ 3 billion
  • 4.
    BAJAJ AUTO Manufacturersof Scooters, Motor Bikes, 3-Wheelers, Spare parts. Bajaj Auto came into existence on November 29, 1945 as M/s Bachraj Trading Corporation Private Limited. Initially it used to import the two wheelers from outside, but from 1959 it started manufacturing of two wheelers in the country. It is India's largest and the world's 4th largest two- and three-wheeler maker. Learning, Innovation, Perfection, Speed and Transparency
  • 5.
    Timeline of newreleases 1971 - three-wheeler goods carrier 1972 - Bajaj Chetak 1990- Bajaj Sunny 1997- Kawasaki Bajaj Boxer 1998 - Kawasaki Bajaj Caliber,legend,Bajaj Spirit 2000 - Bajaj Saffire 2001 - Eliminator, Pulsar 2003 - Caliber115, Bajaj Wind 125, Bajaj Pulsar 2004 - Bajaj CT 100, New Bajaj Chetak 4-stroke 2006 - Bajaj Platina 2007 - Bajaj Pulsar-200(Oil Cooled), Bajaj Kristal, Bajaj Pulsar 220 DTS-Fi , XCD 125 DTS-Si
  • 6.
  • 7.
    Automobile industry Tenth largest in the world with an annual production of approximately 2 million units AUTOMOBILE 2 WHEELER 3 WHEELER PASSENGER VEHICLE COMMERCIAL VEHICLE
  • 8.
  • 9.
    Argo Scooters - The scooters from BAJAJ in U.S.A
  • 10.
  • 11.
    Financial Highlights 1999-2009. years particulars 99-00 00-01 01-02 02-03 03-04 04-05 05-06 06-07 07-08 08-09 Net Sales (crore) 3810.5 3658.9 4221.4 4895.9 5580.1 4755.1 5736.3 7469.3 9292.2 8663.2 Gross Profit (crore) 970.5 546.8 767.5 959.8 1140.3 960.4 1086.4 1580.7 1728.0 1134.7 Net Profit (crore) 613.7 262.6 521.1 538.4 731.5 731.5 766.8 1101.6 1237.9 755.9 working capital(crore) 6327 5873 3353 2144 (2730) (2042) (6886) (5141) (2275) (1122)
  • 12.
    We adopt theratio analysis method to analyze the financial position of Bajaj Auto Ltd .
  • 13.
    Objectives of RatioAnalysis Standardize financial information for comparisons Evaluate current operations Compare performance with past performance Compare performance against other firms or industry standards Study the efficiency of operations Study the risk of operations .
  • 14.
    . Analysis andinterpretation
  • 15.
  • 16.
  • 17.
  • 18.
  • 19.
  • 20.
  • 21.
  • 22.
  • 23.
  • 24.
  • 25.
  • 26.
  • 27.
  • 28.
    Bajaj Auto V/sHero Honda .
  • 29.
    Comparison . AttributesBajaj Auto Hero Honda P/E Ratio 31.74 25.75 EPS 45.39 64.18 NET PROFIT MARGIN(%) 7.40 10.30 LAST DIVIDENT (%) 220 1000 RETURN ON AVG. EQUITY 38.92 33.72 GROSS PROFIT MARGIN(%) 11.06 12.75
  • 30.
    . COMPARISON ATTRIBUTESBAJAJ AUTO HERO HONDA SALES(2009) 8893(CR) 12534(CR) MKT CAP 21448(CR) 32400(CR) SHARE HOLDING (PROMOTERS) 49.6% 54.96% NON PROMO.SHARE HOLDING OTHERS HOLDING 23.75% 9.49% 36.76% 1.18%
  • 31.
    CONCLUSION BAJAJ AUTONET PROFIT MARGIN IS LOWER THAN HERO HONDA’S RETURN ON AVG EQUITY OF BAJAJ AUTO’S IS MORE THAN HERO HONDA MARKET CAPITAL OF HERO HONDA IS ALSO MORE THAN BAJAJ AUTO. BAJAJ AUTO’S FINANCIAL POSITION IS NOT AS PER STD. WORKING CAPITAL RATIO IS NEGATIVE FOR ALL THE YEAR WHICH IS NOT GOT FOR THE COMPANY CURRENT RATIO AND LIQUID RATIO IS ALSO SHOWING A DECREASING TREND
  • 32.
    CONCLUSION ….. BAJAJAUTO SHOULD TRY TO IMPROVE ITS CURRENT RATIO WORKING CAPITAL IS NEGATIVE WHICH IS NOT IMPRESSIVE SALES IN THE CURRENT YR.DECREASES DUE TO RECESSION OVERALL FINANCIAL AND EARNING CAPACITY OF BAJAJ AUTO IS LOWER THAN HERO HONDA
  • 33.
    COMMUNITY SERVICE JankiDeviBajaj Gram Vikas Sanstha. Samaj Seva Kendra. Kamalnayan Bajaj Hospital.
  • 34.

Editor's Notes

  • #14 Financial Statement Analysis October 2000 C.J. Brown, M.M. Dutton and T.A. Rietz Uses 1.      Managers – to help analyze, control, improve a firm’s operations 2.      Credit analysts – to help ascertain a company’s ability to pay its debts 3.      Stock analysts – to determine a company’s efficiency, risk and growth potential