Download as PDF, PPTX


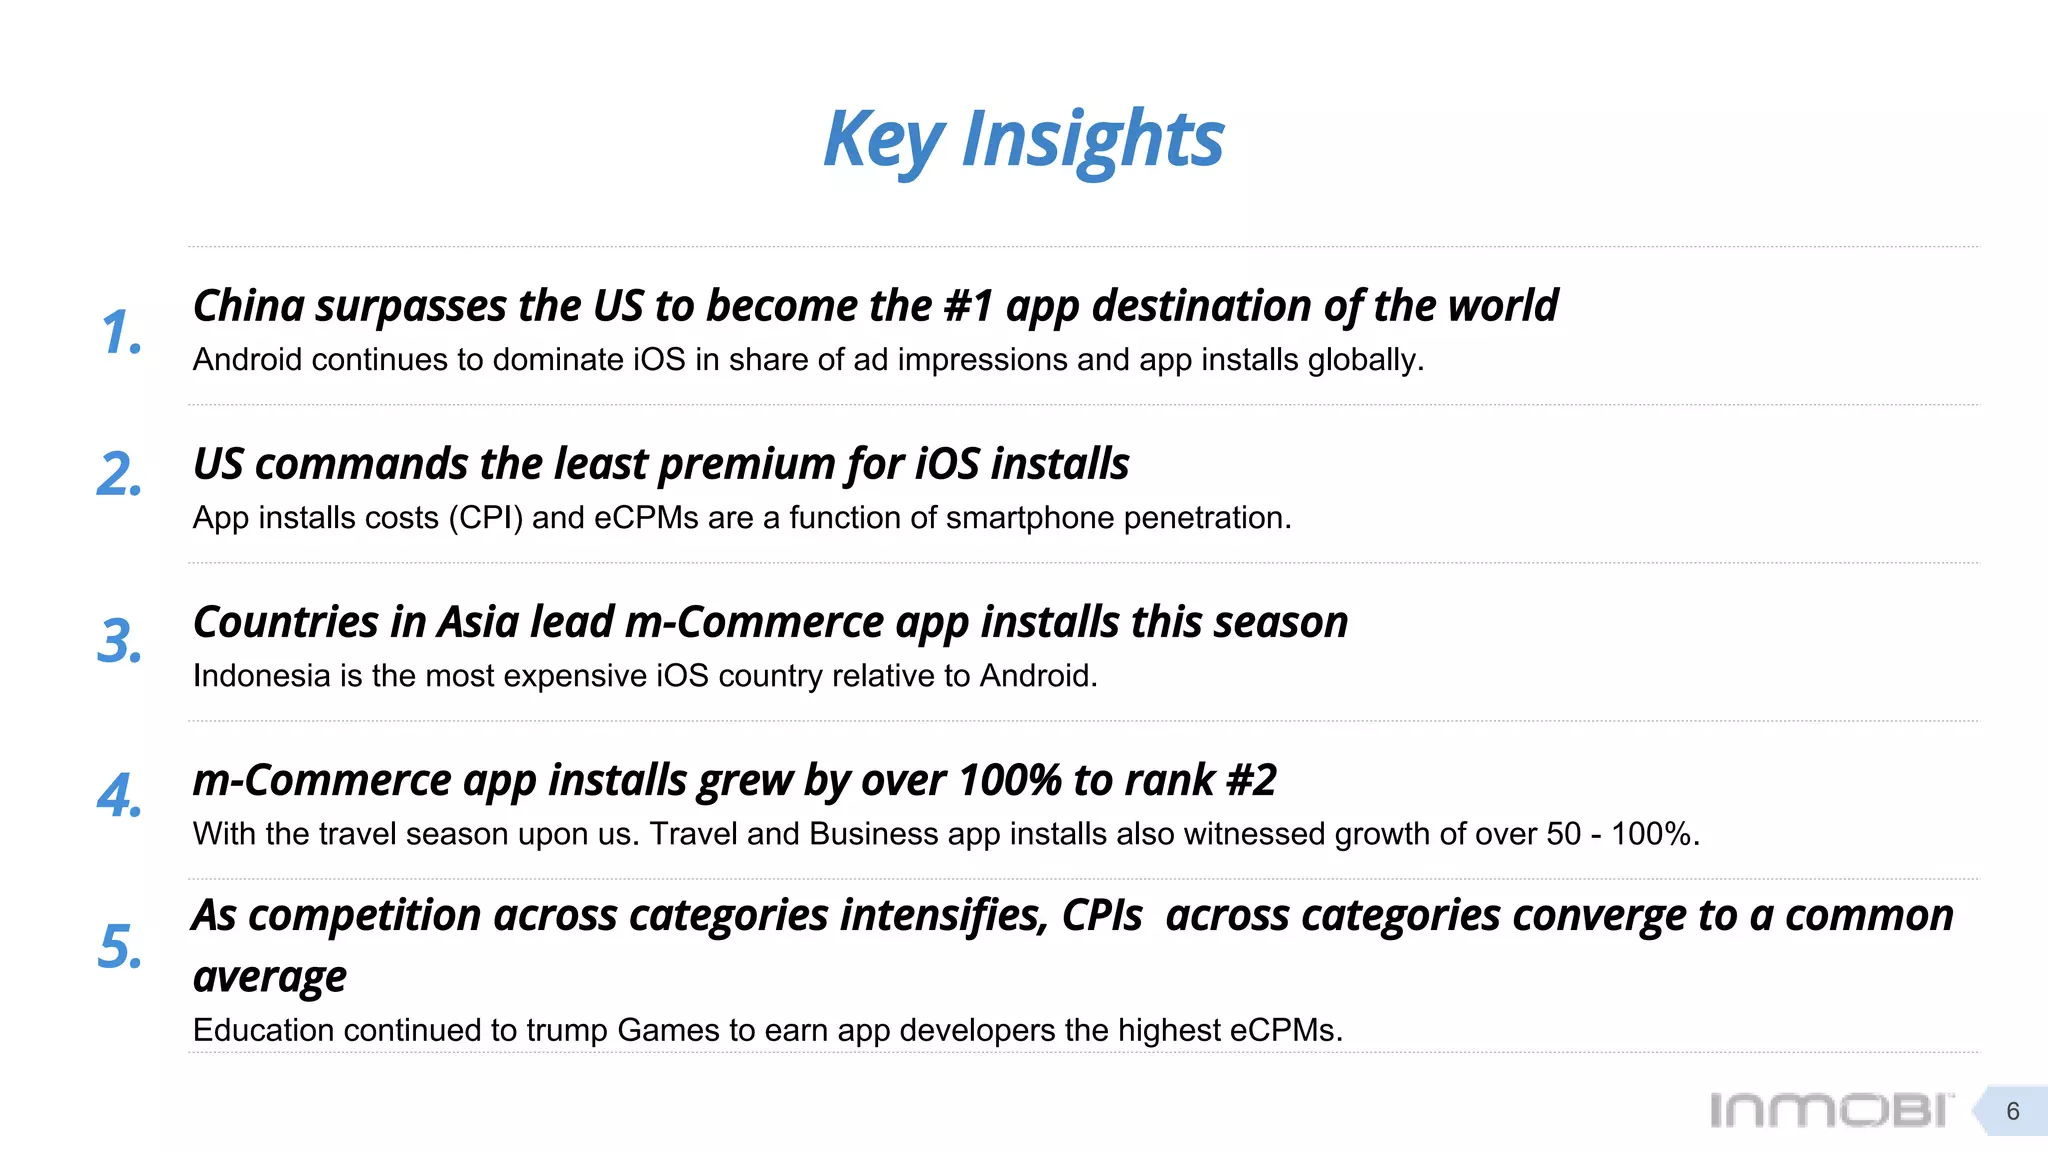
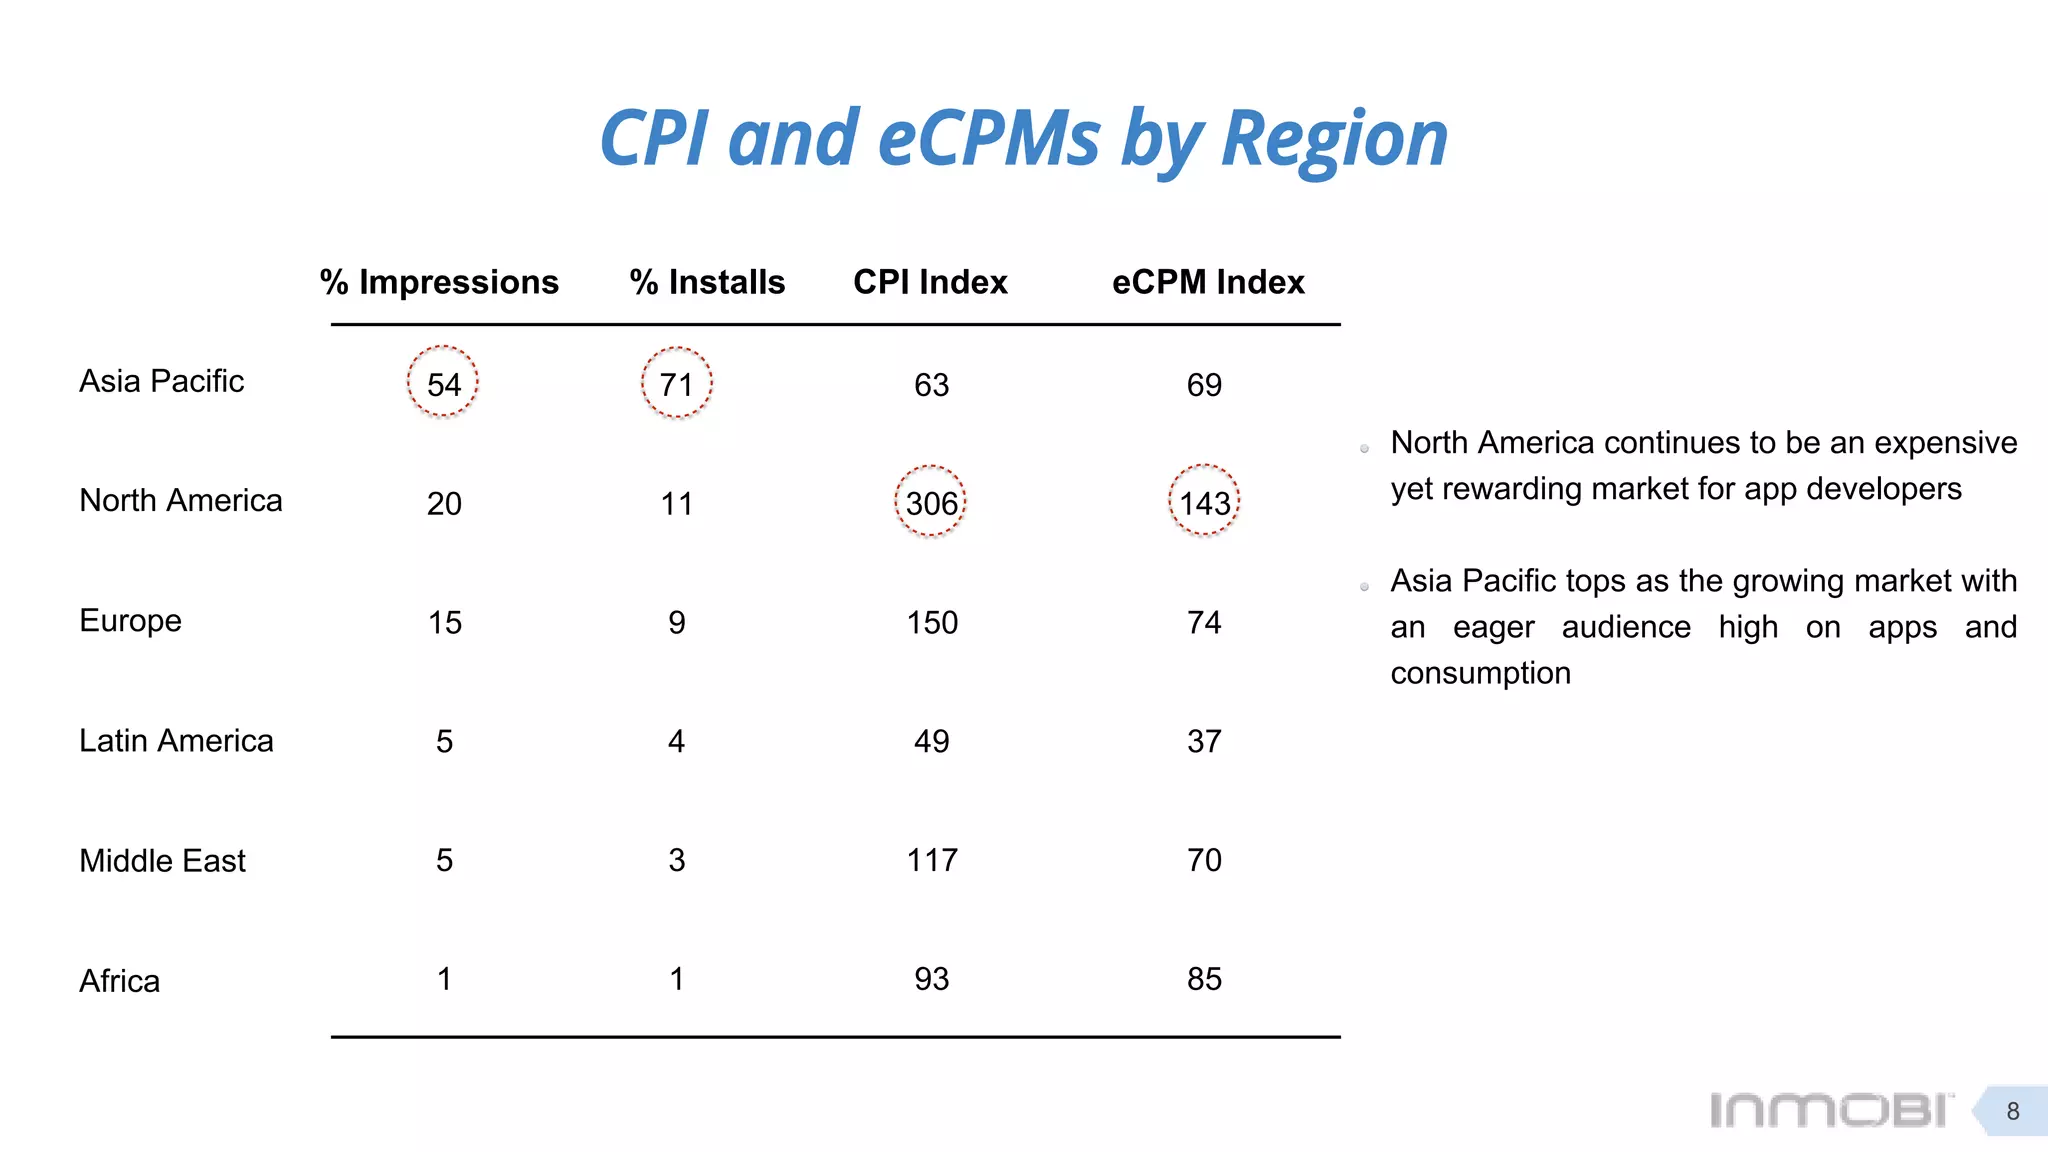
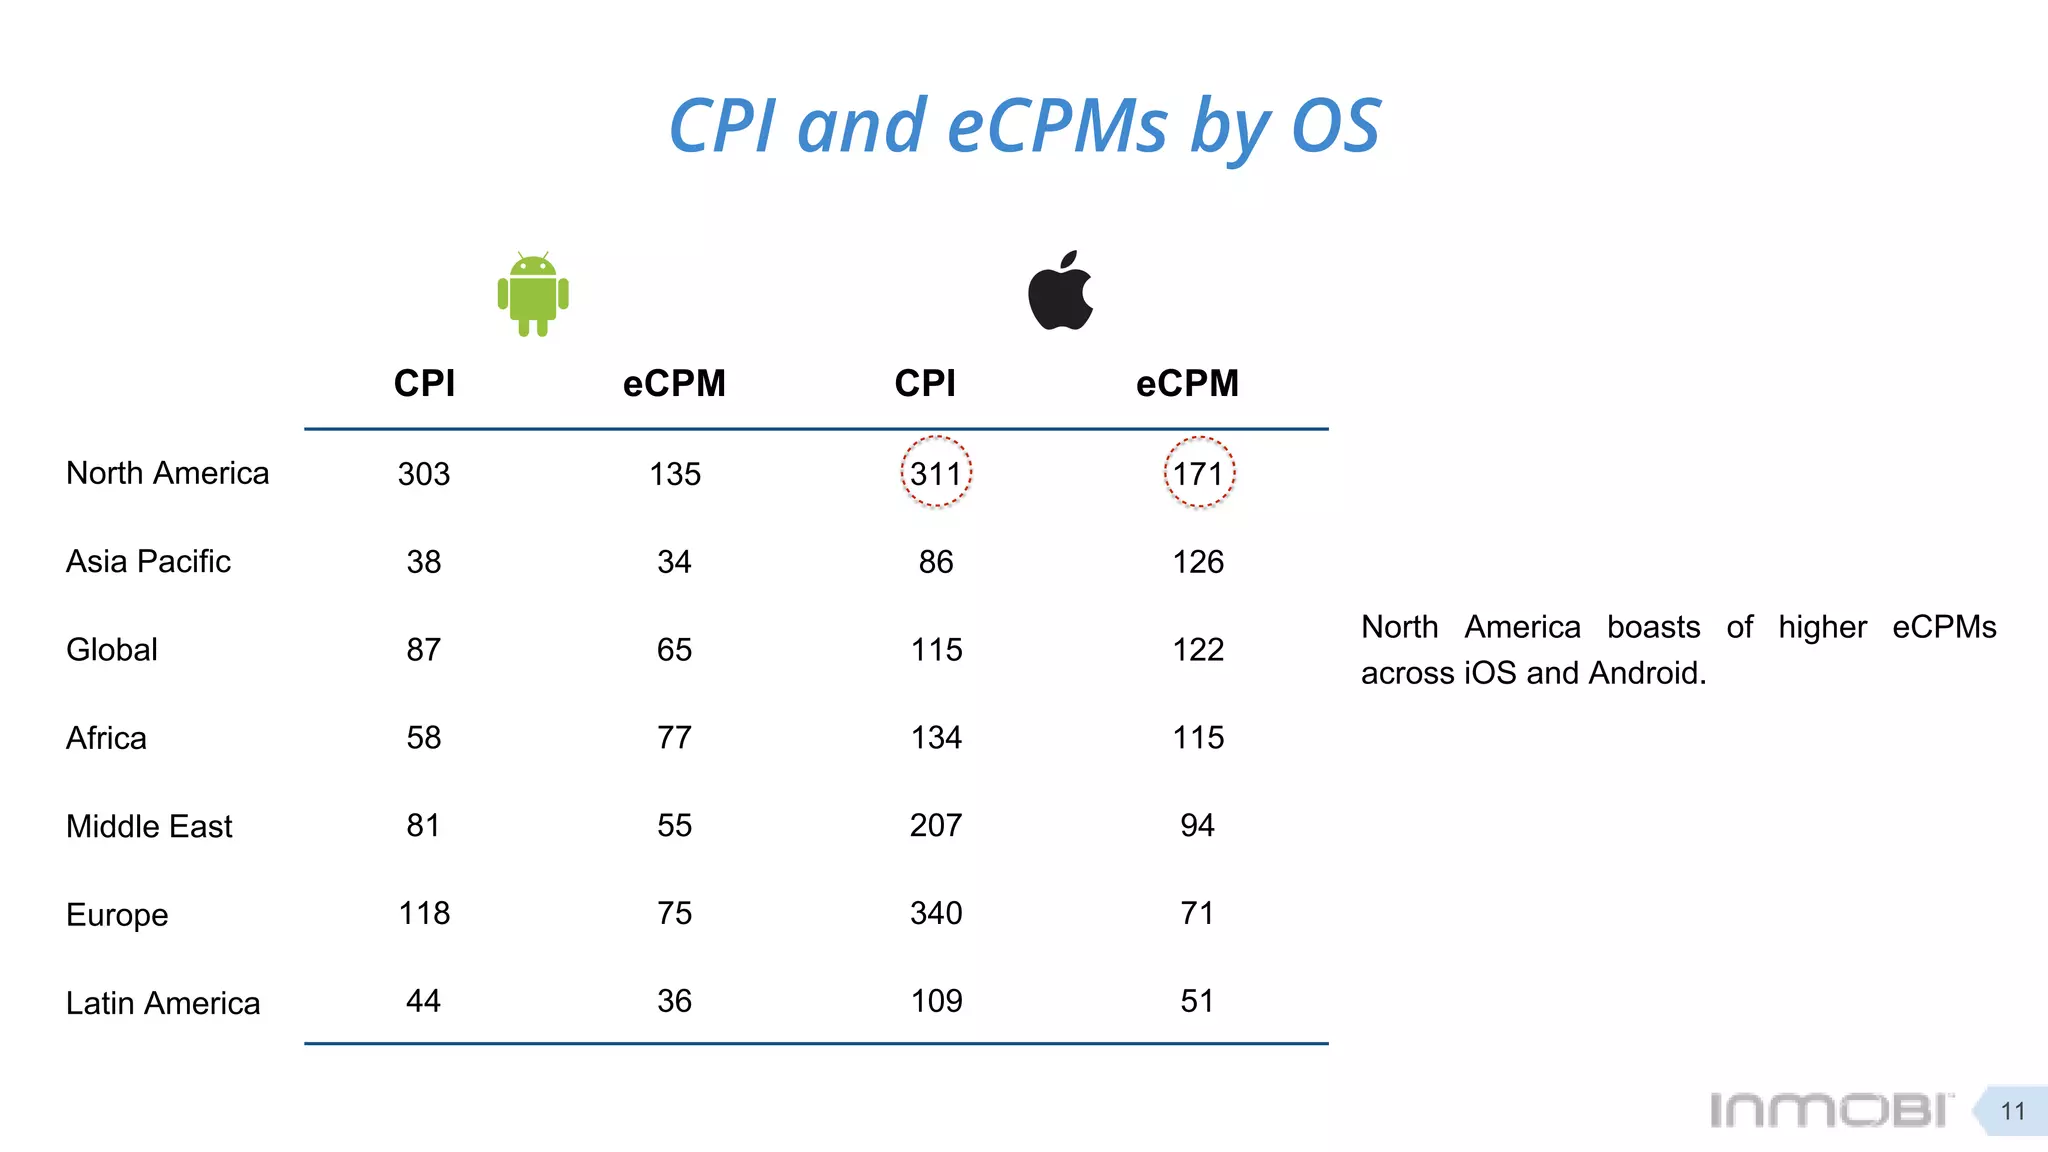

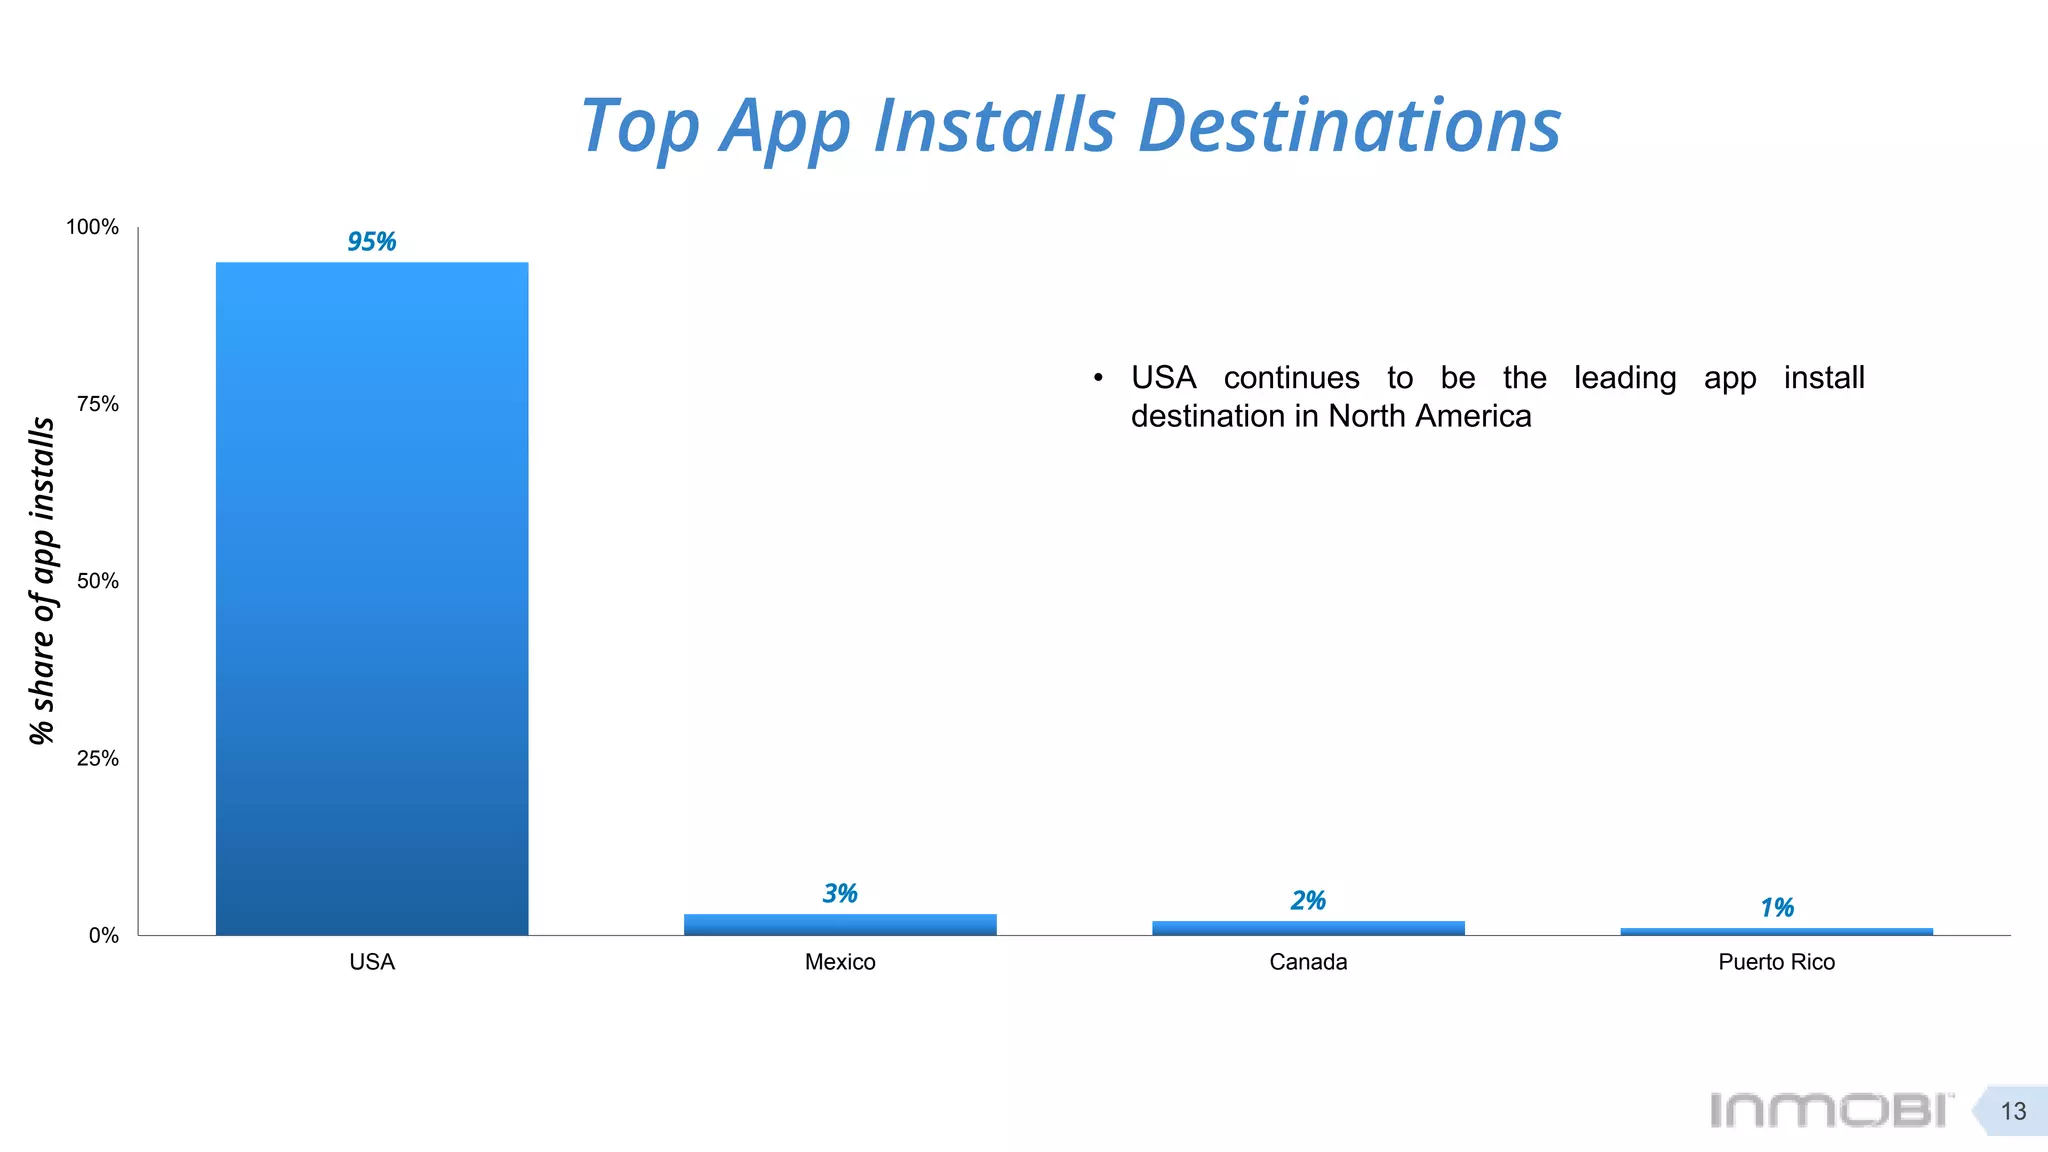
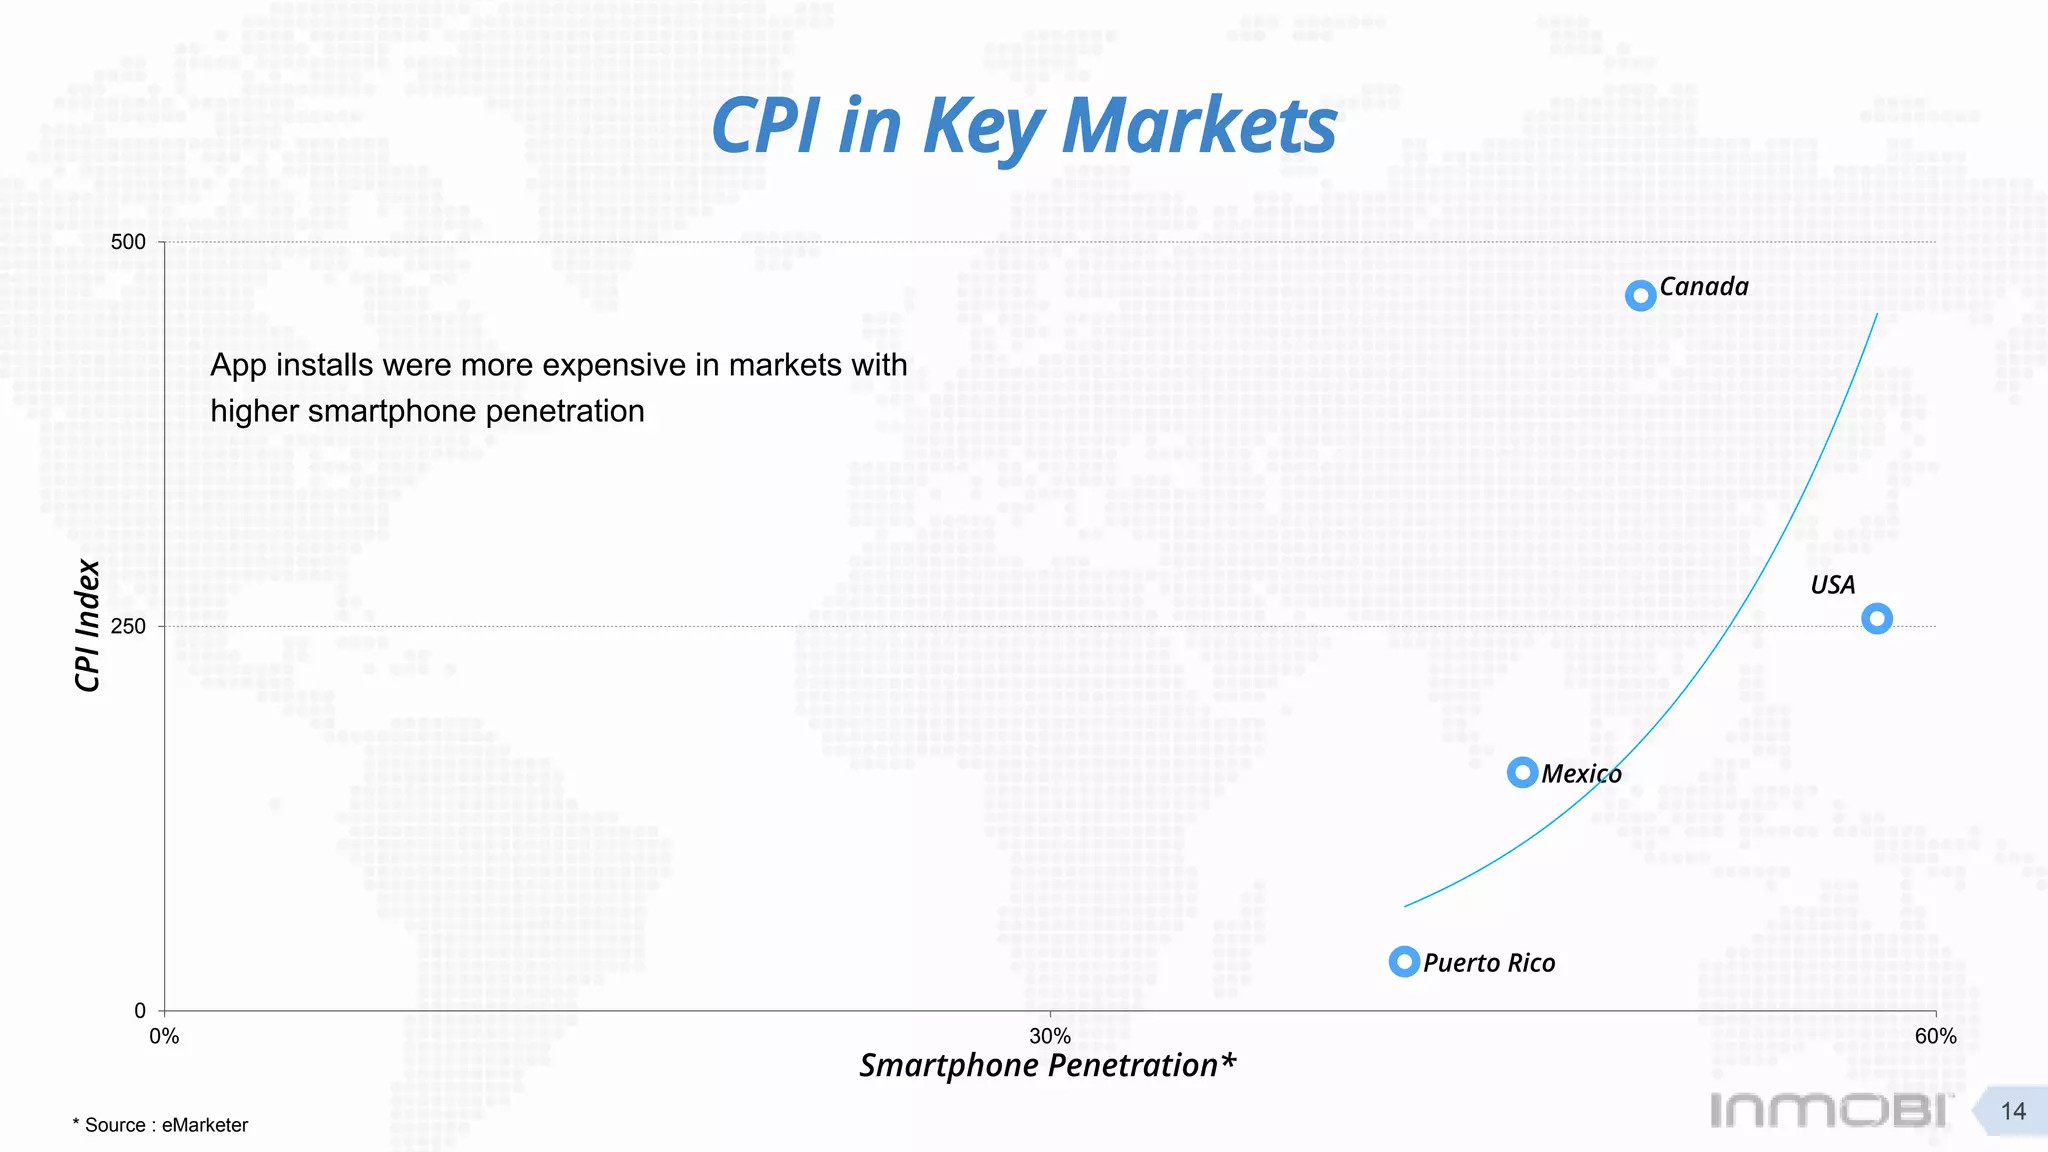
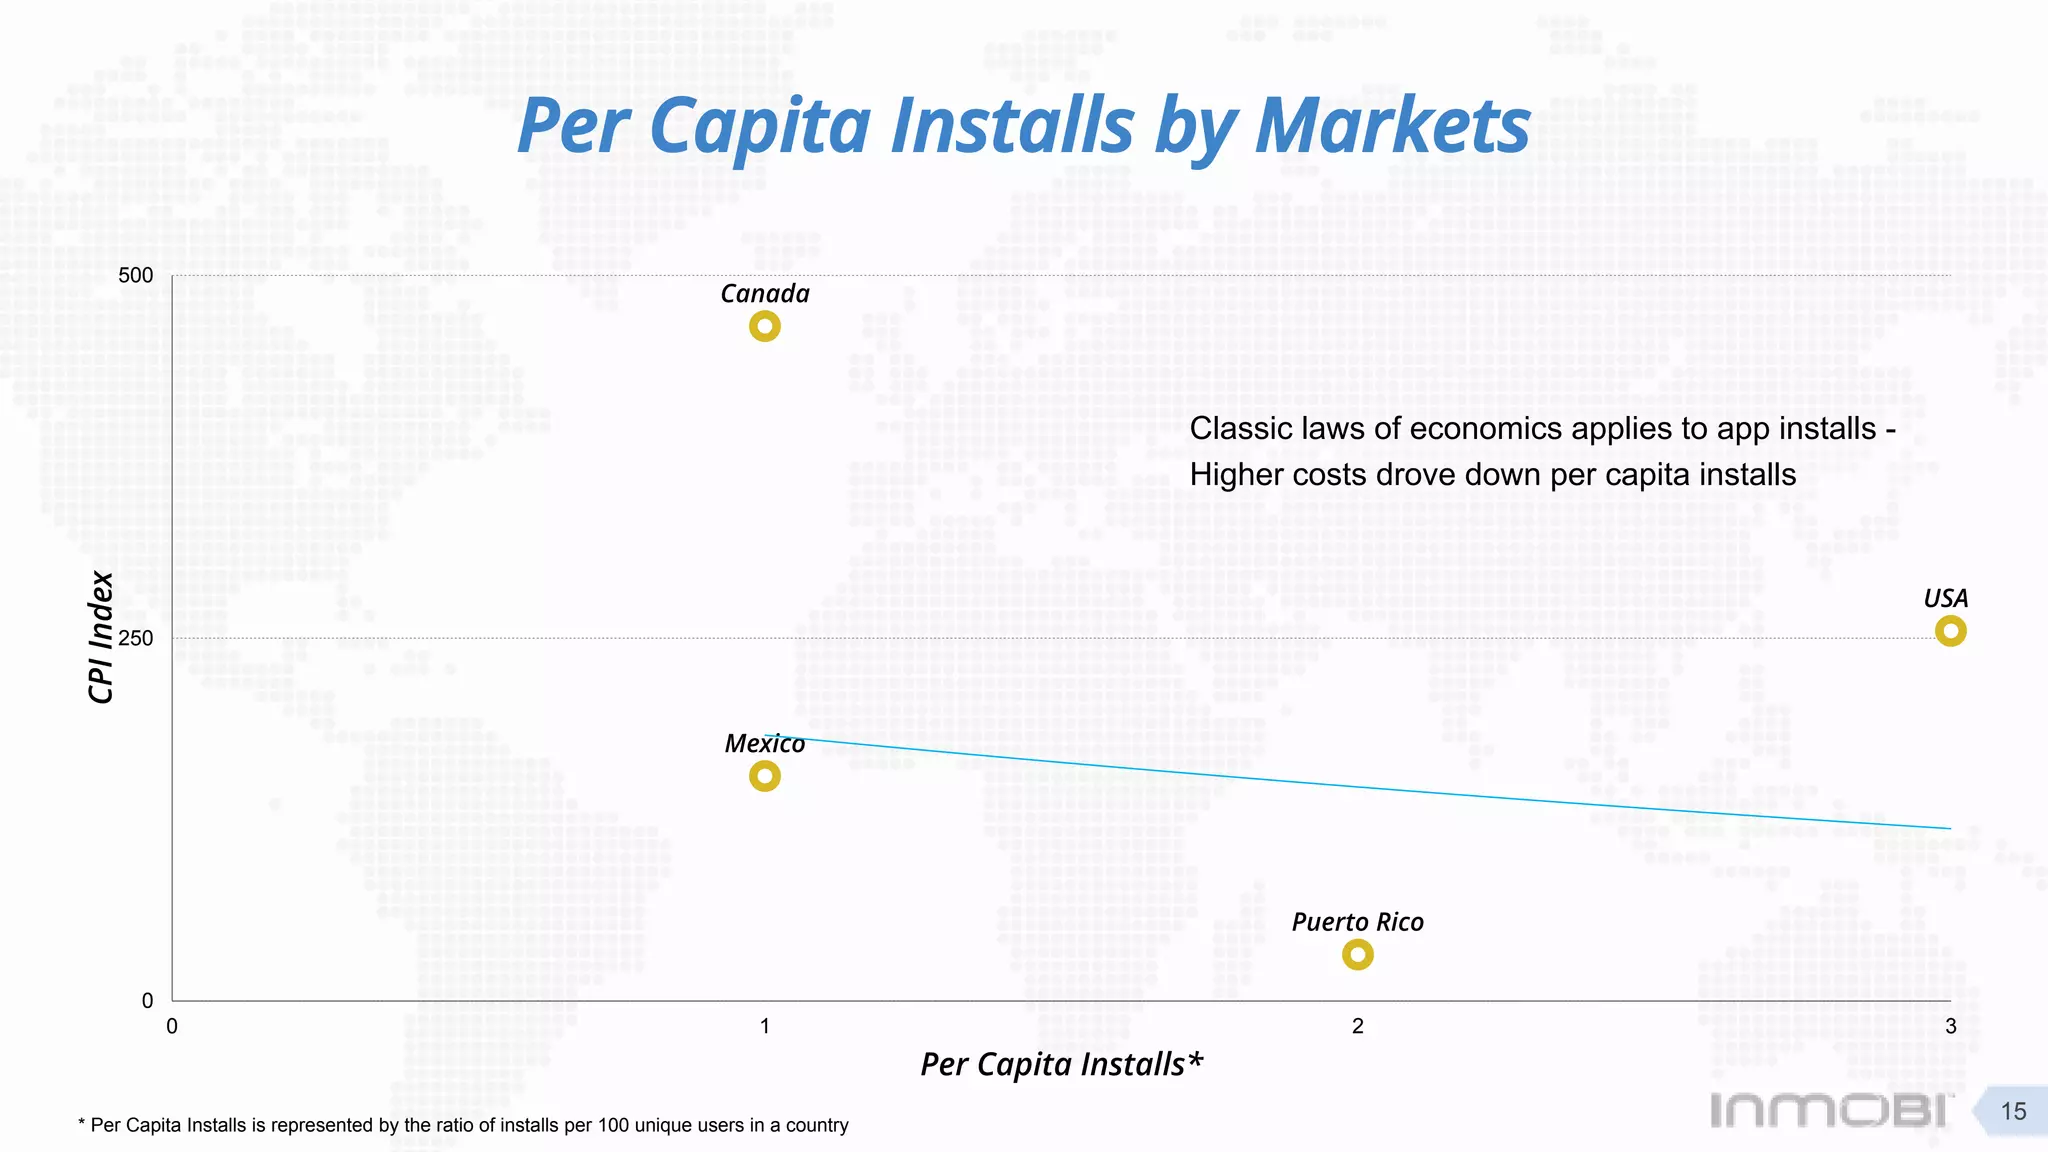
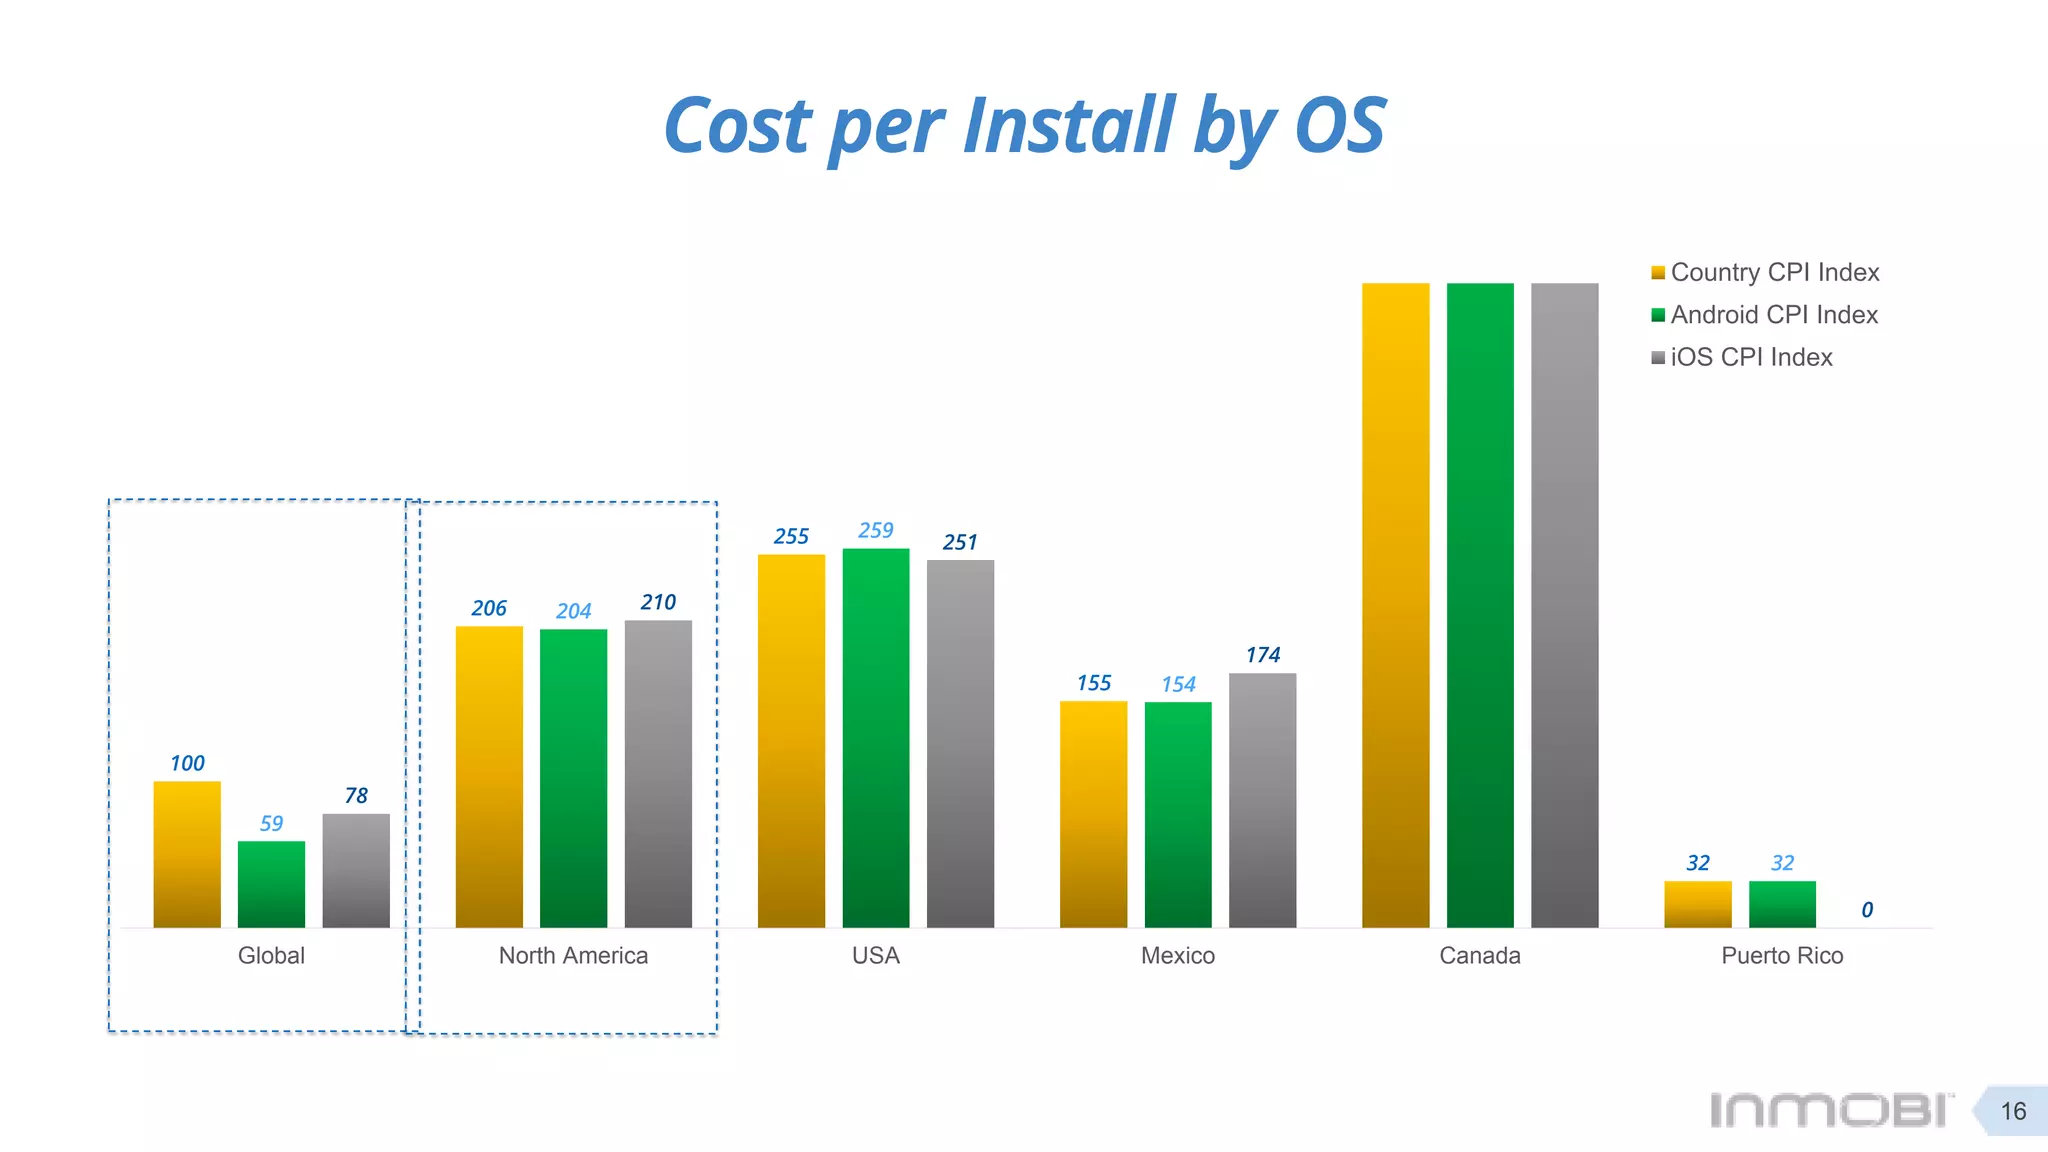
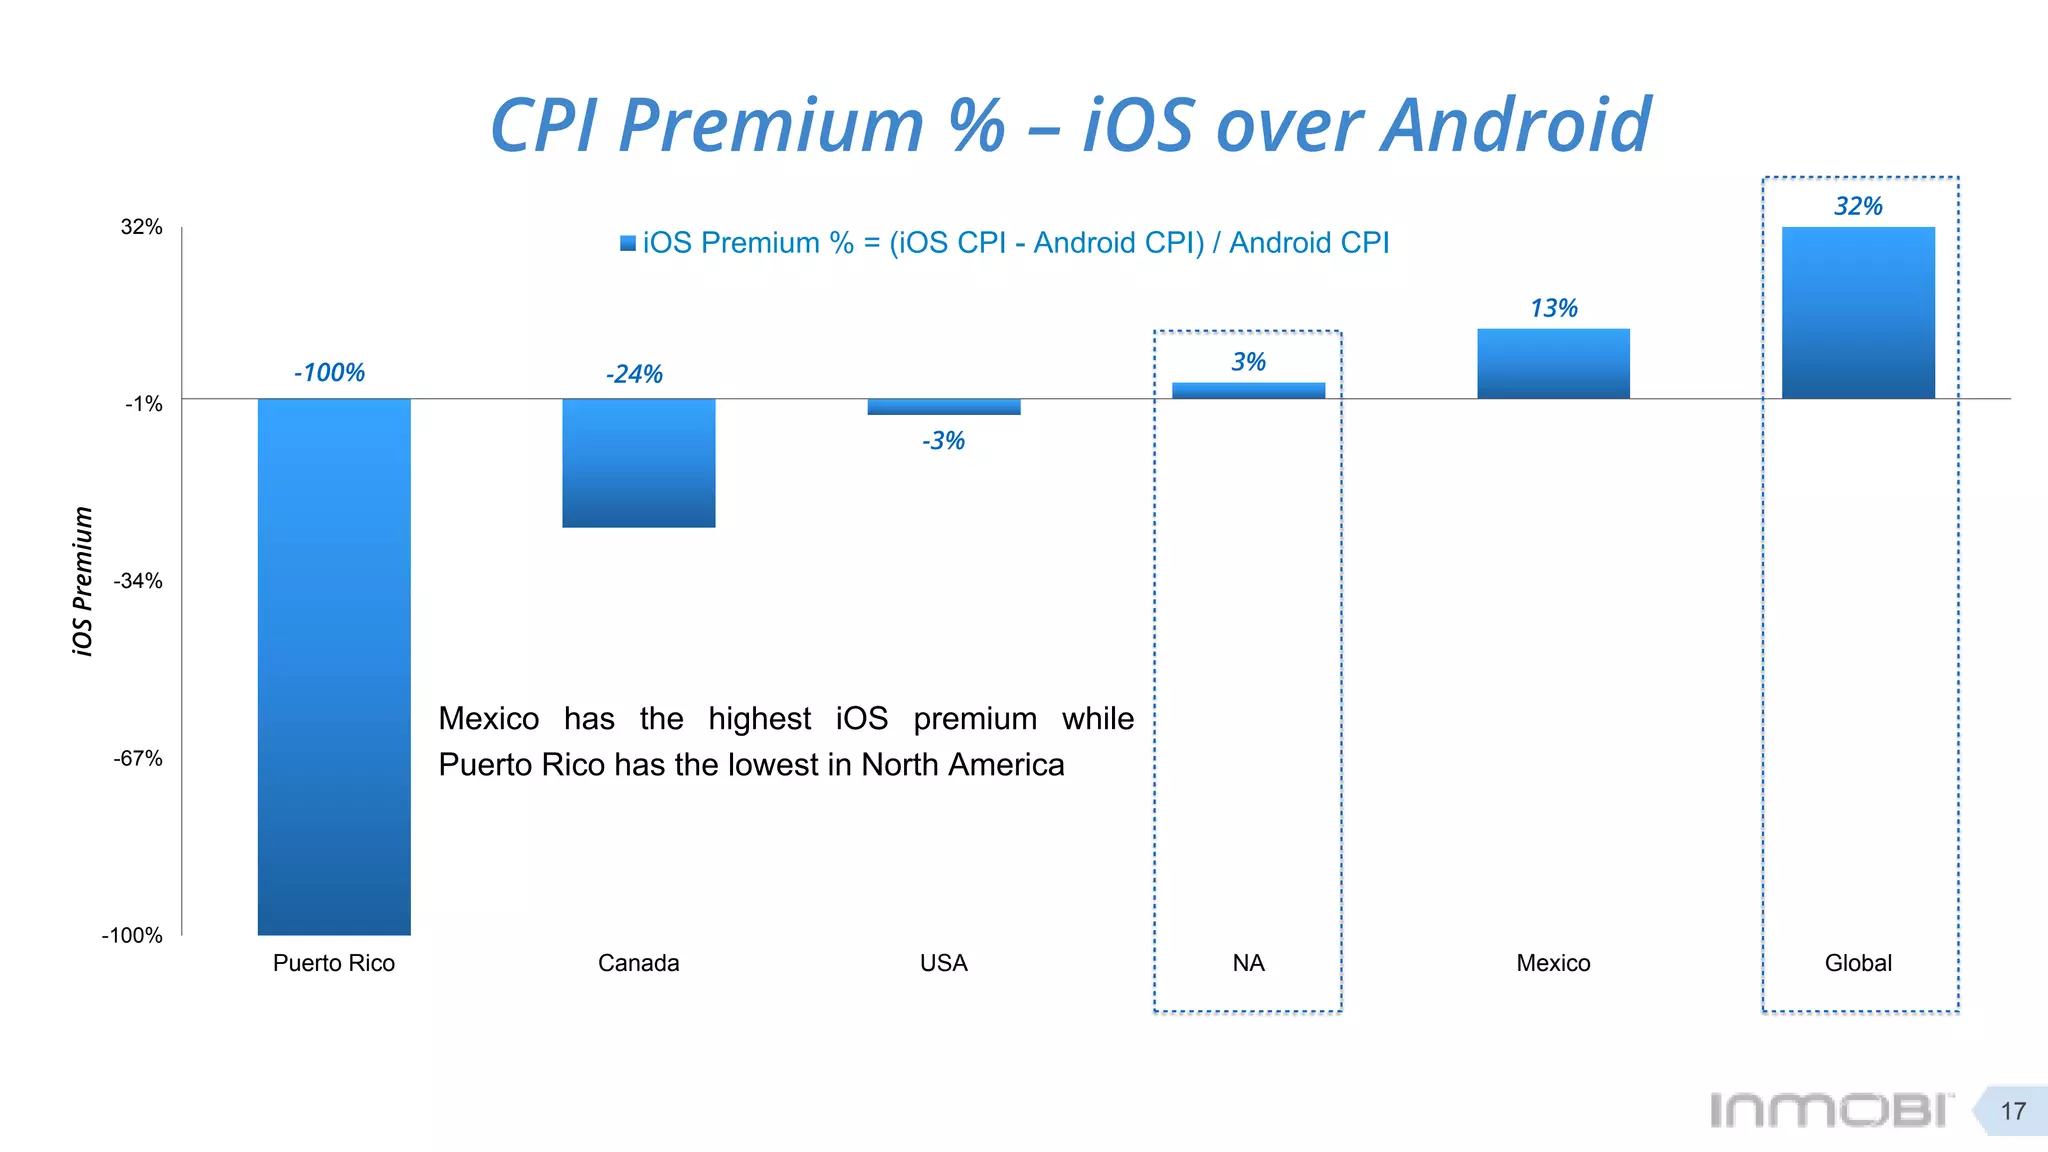
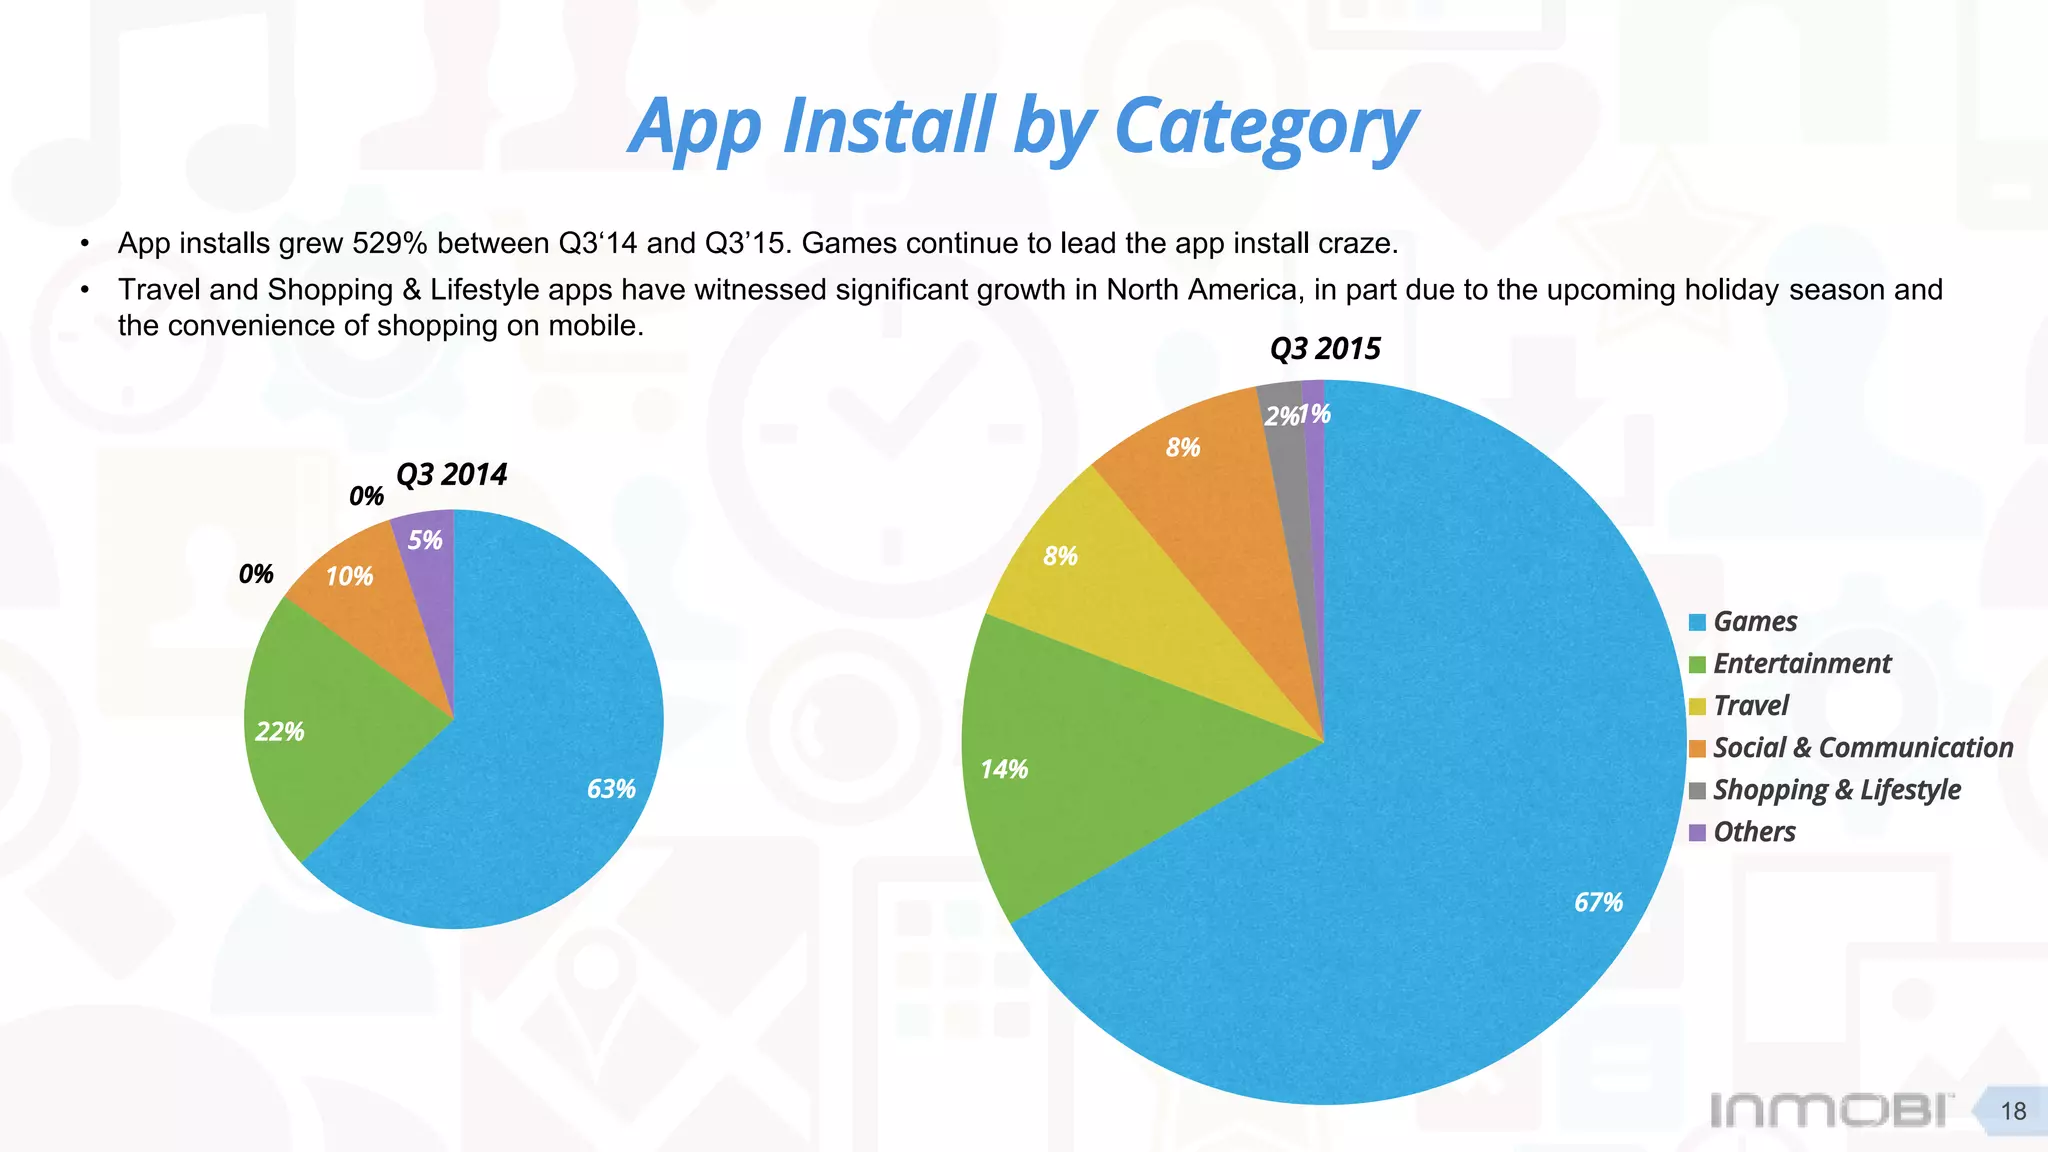
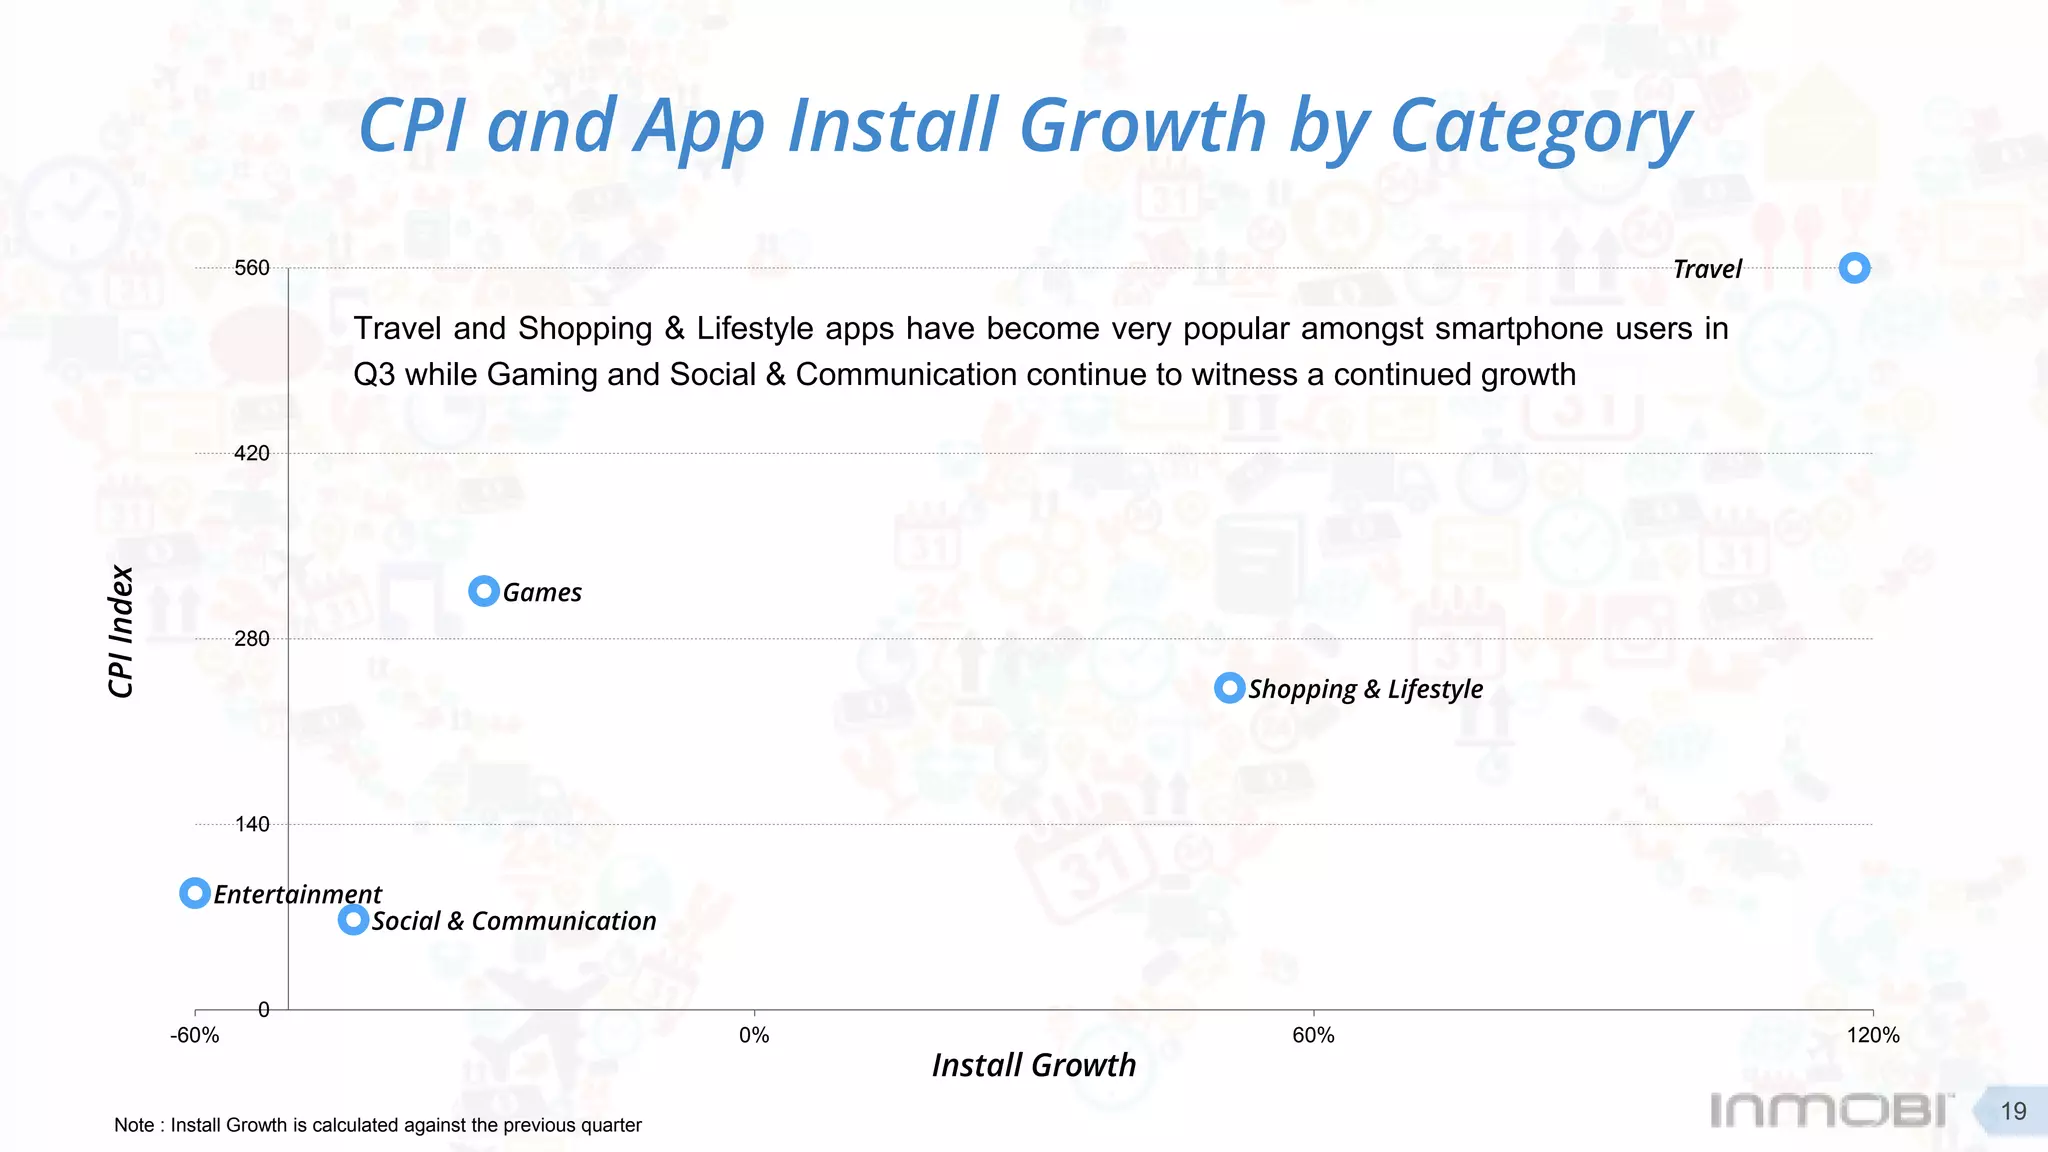
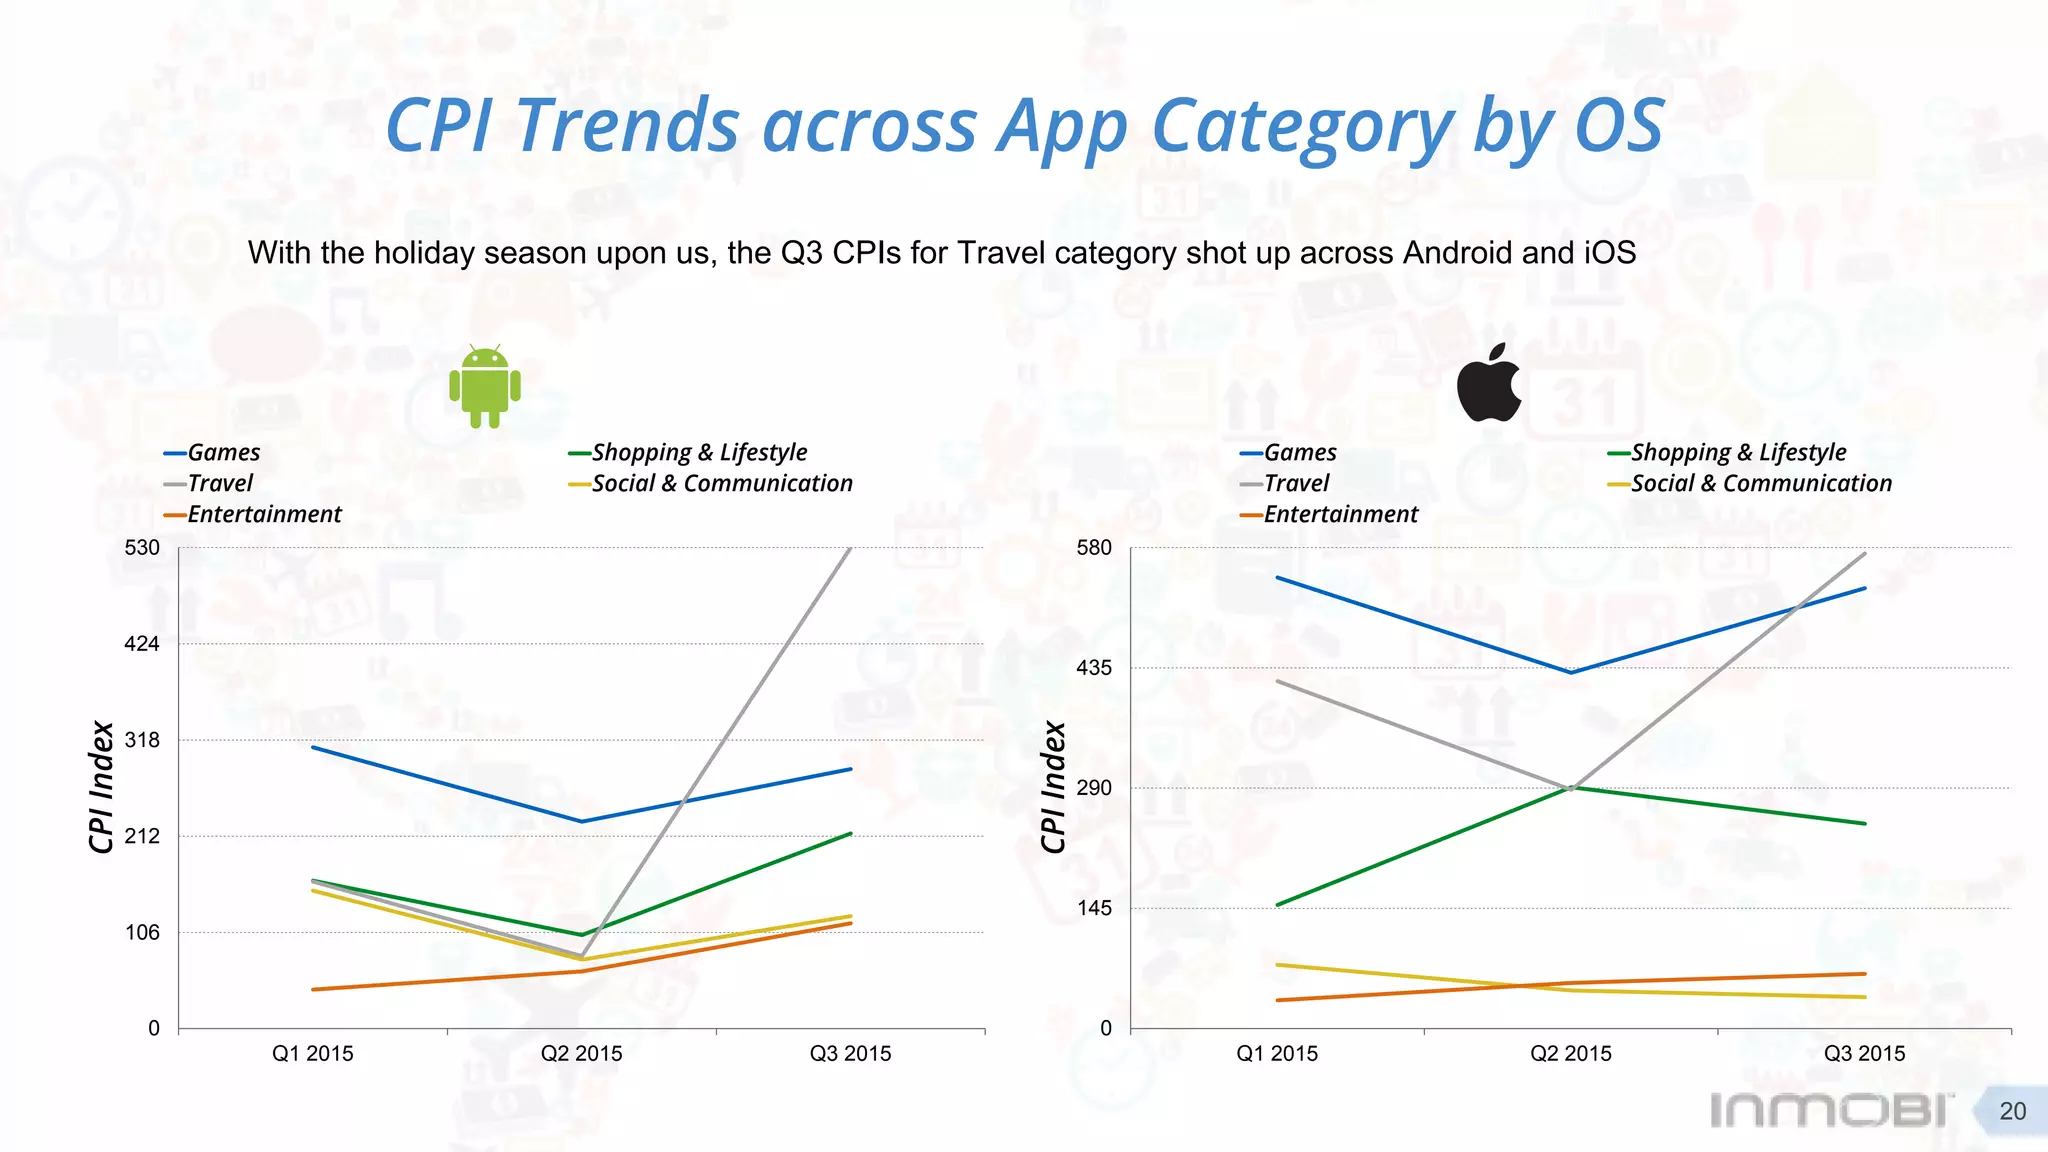


The report analyzes app downloads and monetization trends in North America for Q3 2015. Key findings indicate that China has surpassed the U.S. as the top app market, with significant growth in m-commerce and travel app installs. North America remains an expensive yet lucrative market for developers, particularly for iOS, with app install costs reflecting smartphone penetration levels.


![[Webinar] driving accountability in mobile advertising](https://cdn.slidesharecdn.com/ss_thumbnails/webinardrivingaccountabilityinmobileadvertising-170728022321-thumbnail.jpg?width=640&height=640&fit=bounds)


