Download as PDF, PPTX


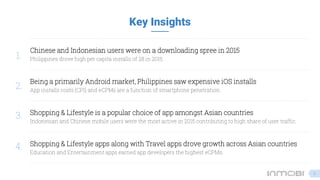
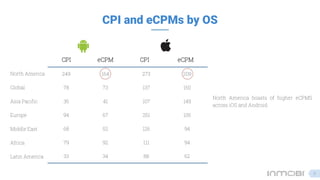
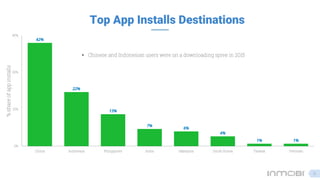
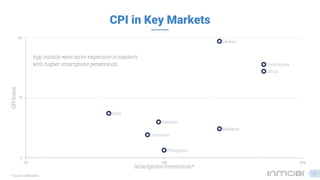
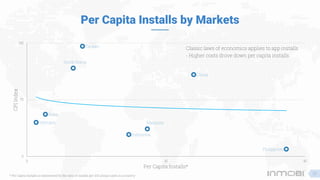
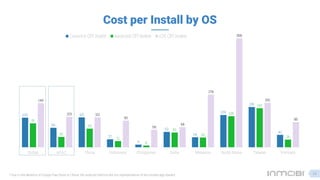
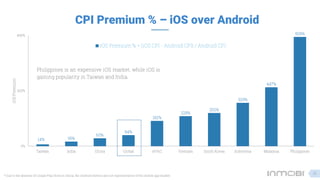
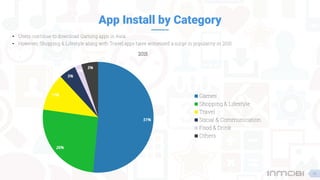
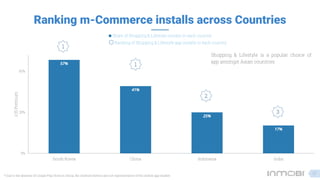
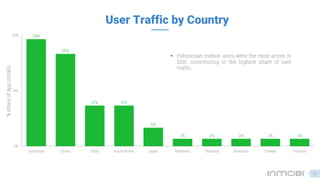
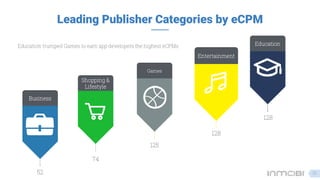
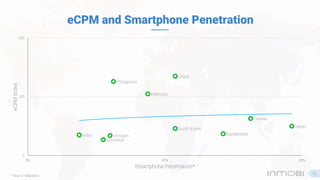
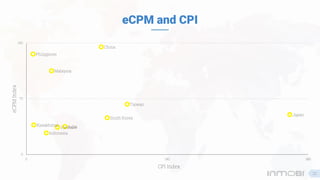


The document discusses key metrics and insights about app installs and monetization in Asia Pacific and other regions based on data from InMobi's platform. Some of the main findings are that Chinese and Indonesian users drove high app installs in 2015, with the Philippines seeing expensive iOS installs. Shopping and lifestyle apps were popular across Asia, while education and entertainment apps earned developers higher eCPMs. App install costs and earnings varied by region and operating system.