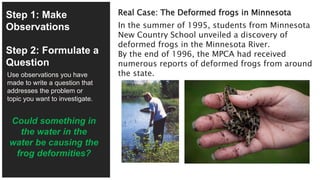
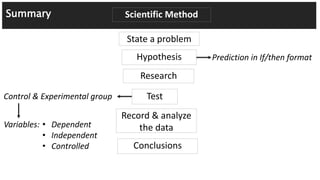
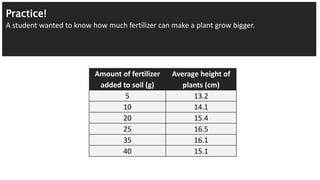
Here are the steps of the scientific method this experiment followed:
1. The student observed that adding more fertilizer seemed to make plants grow taller.
2. The student's question was how does the amount of fertilizer affect plant height?
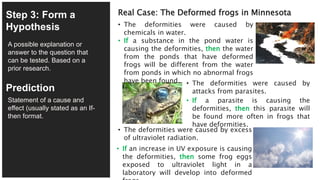
3. The student's hypothesis was that adding more fertilizer would cause plants to grow taller.
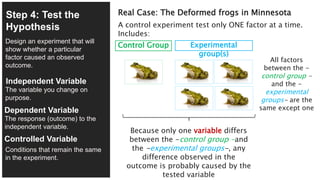
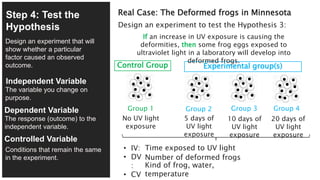
4. The independent variable was the amount of fertilizer added. The dependent variable was the average plant height. The controlled variables were the type of plant and growing conditions.
5. The student conducted an experiment adding different amounts of fertilizer and measuring the resulting plant heights.
6. The student analyzed the data by organizing it in a table and noticing the general trend of heights increasing up to