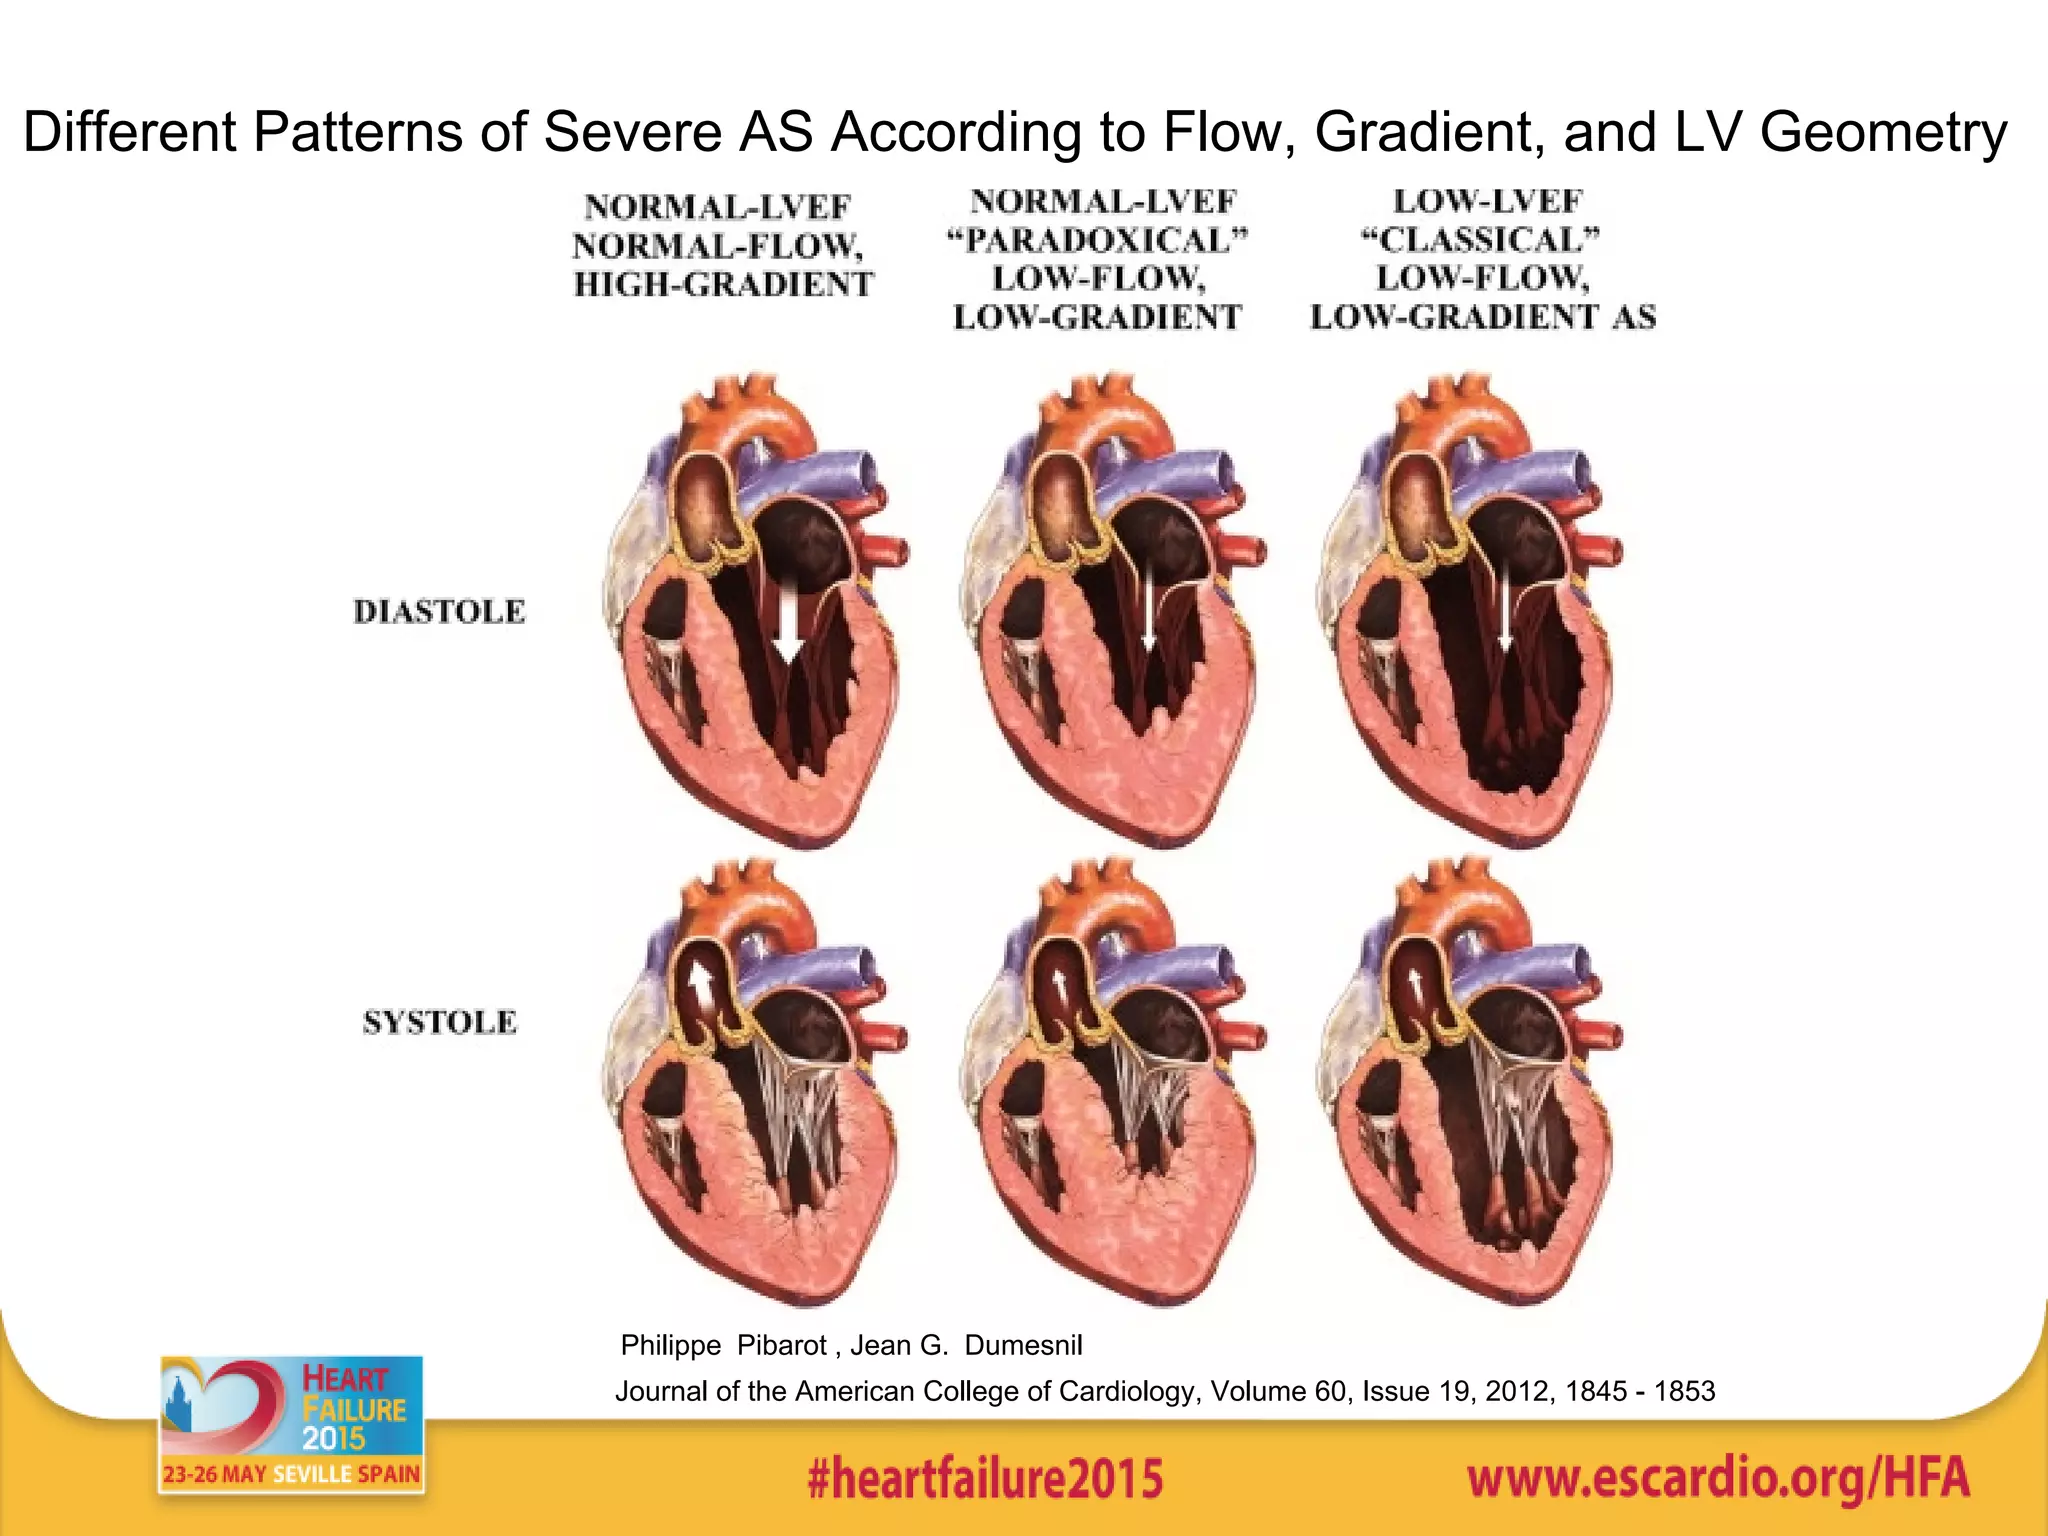
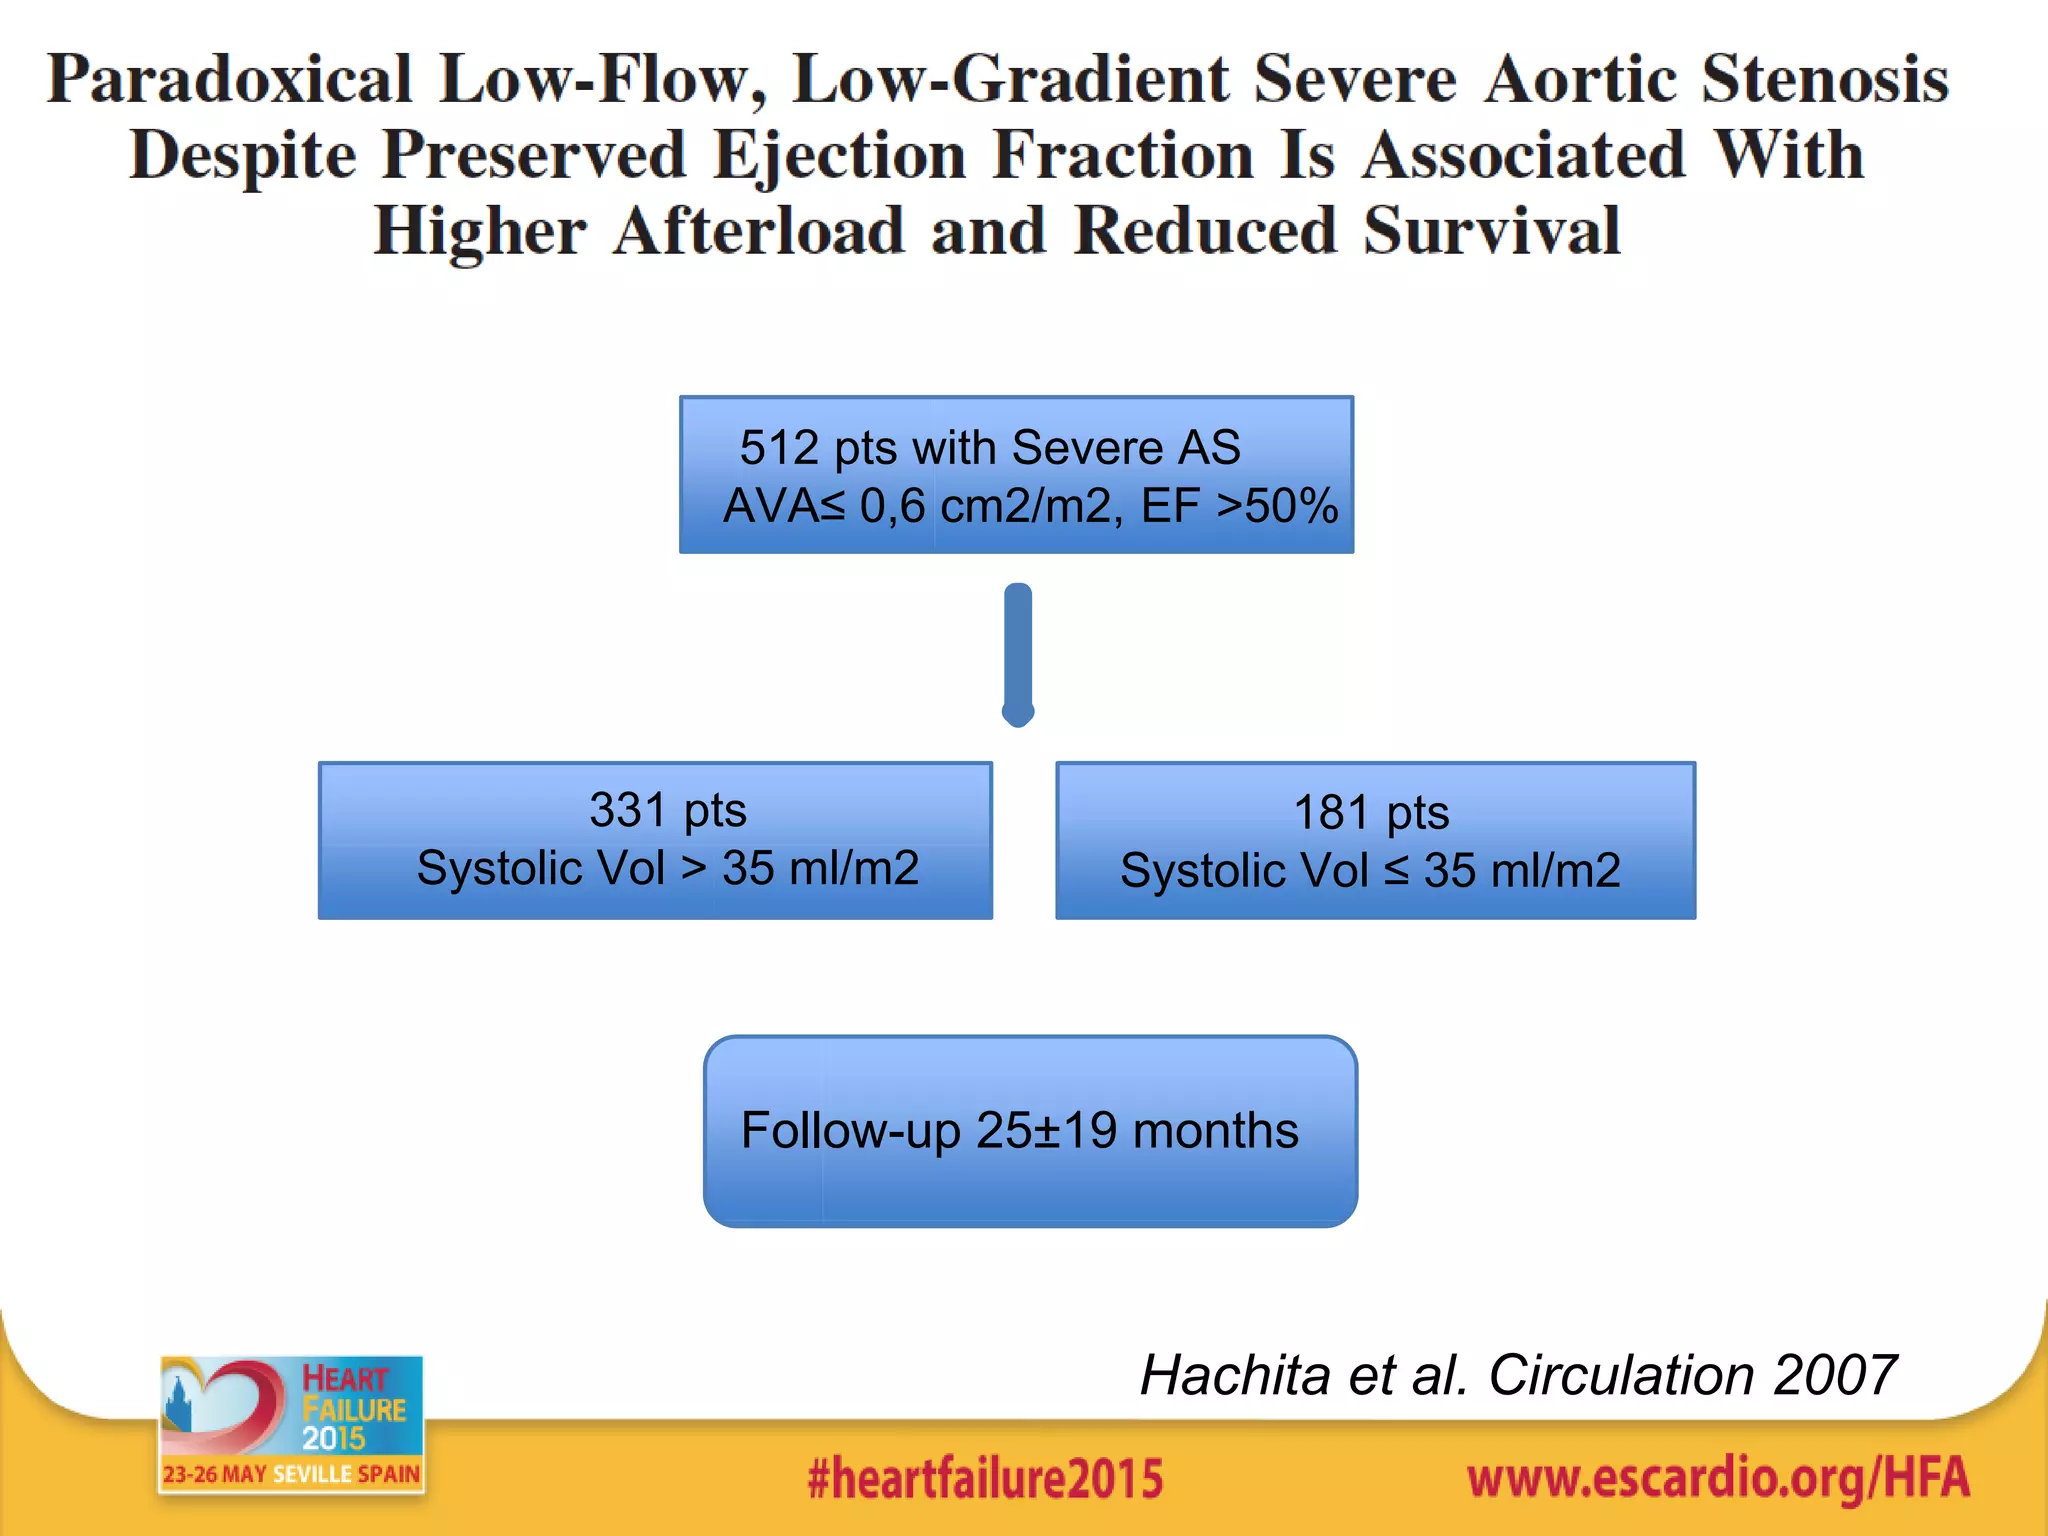
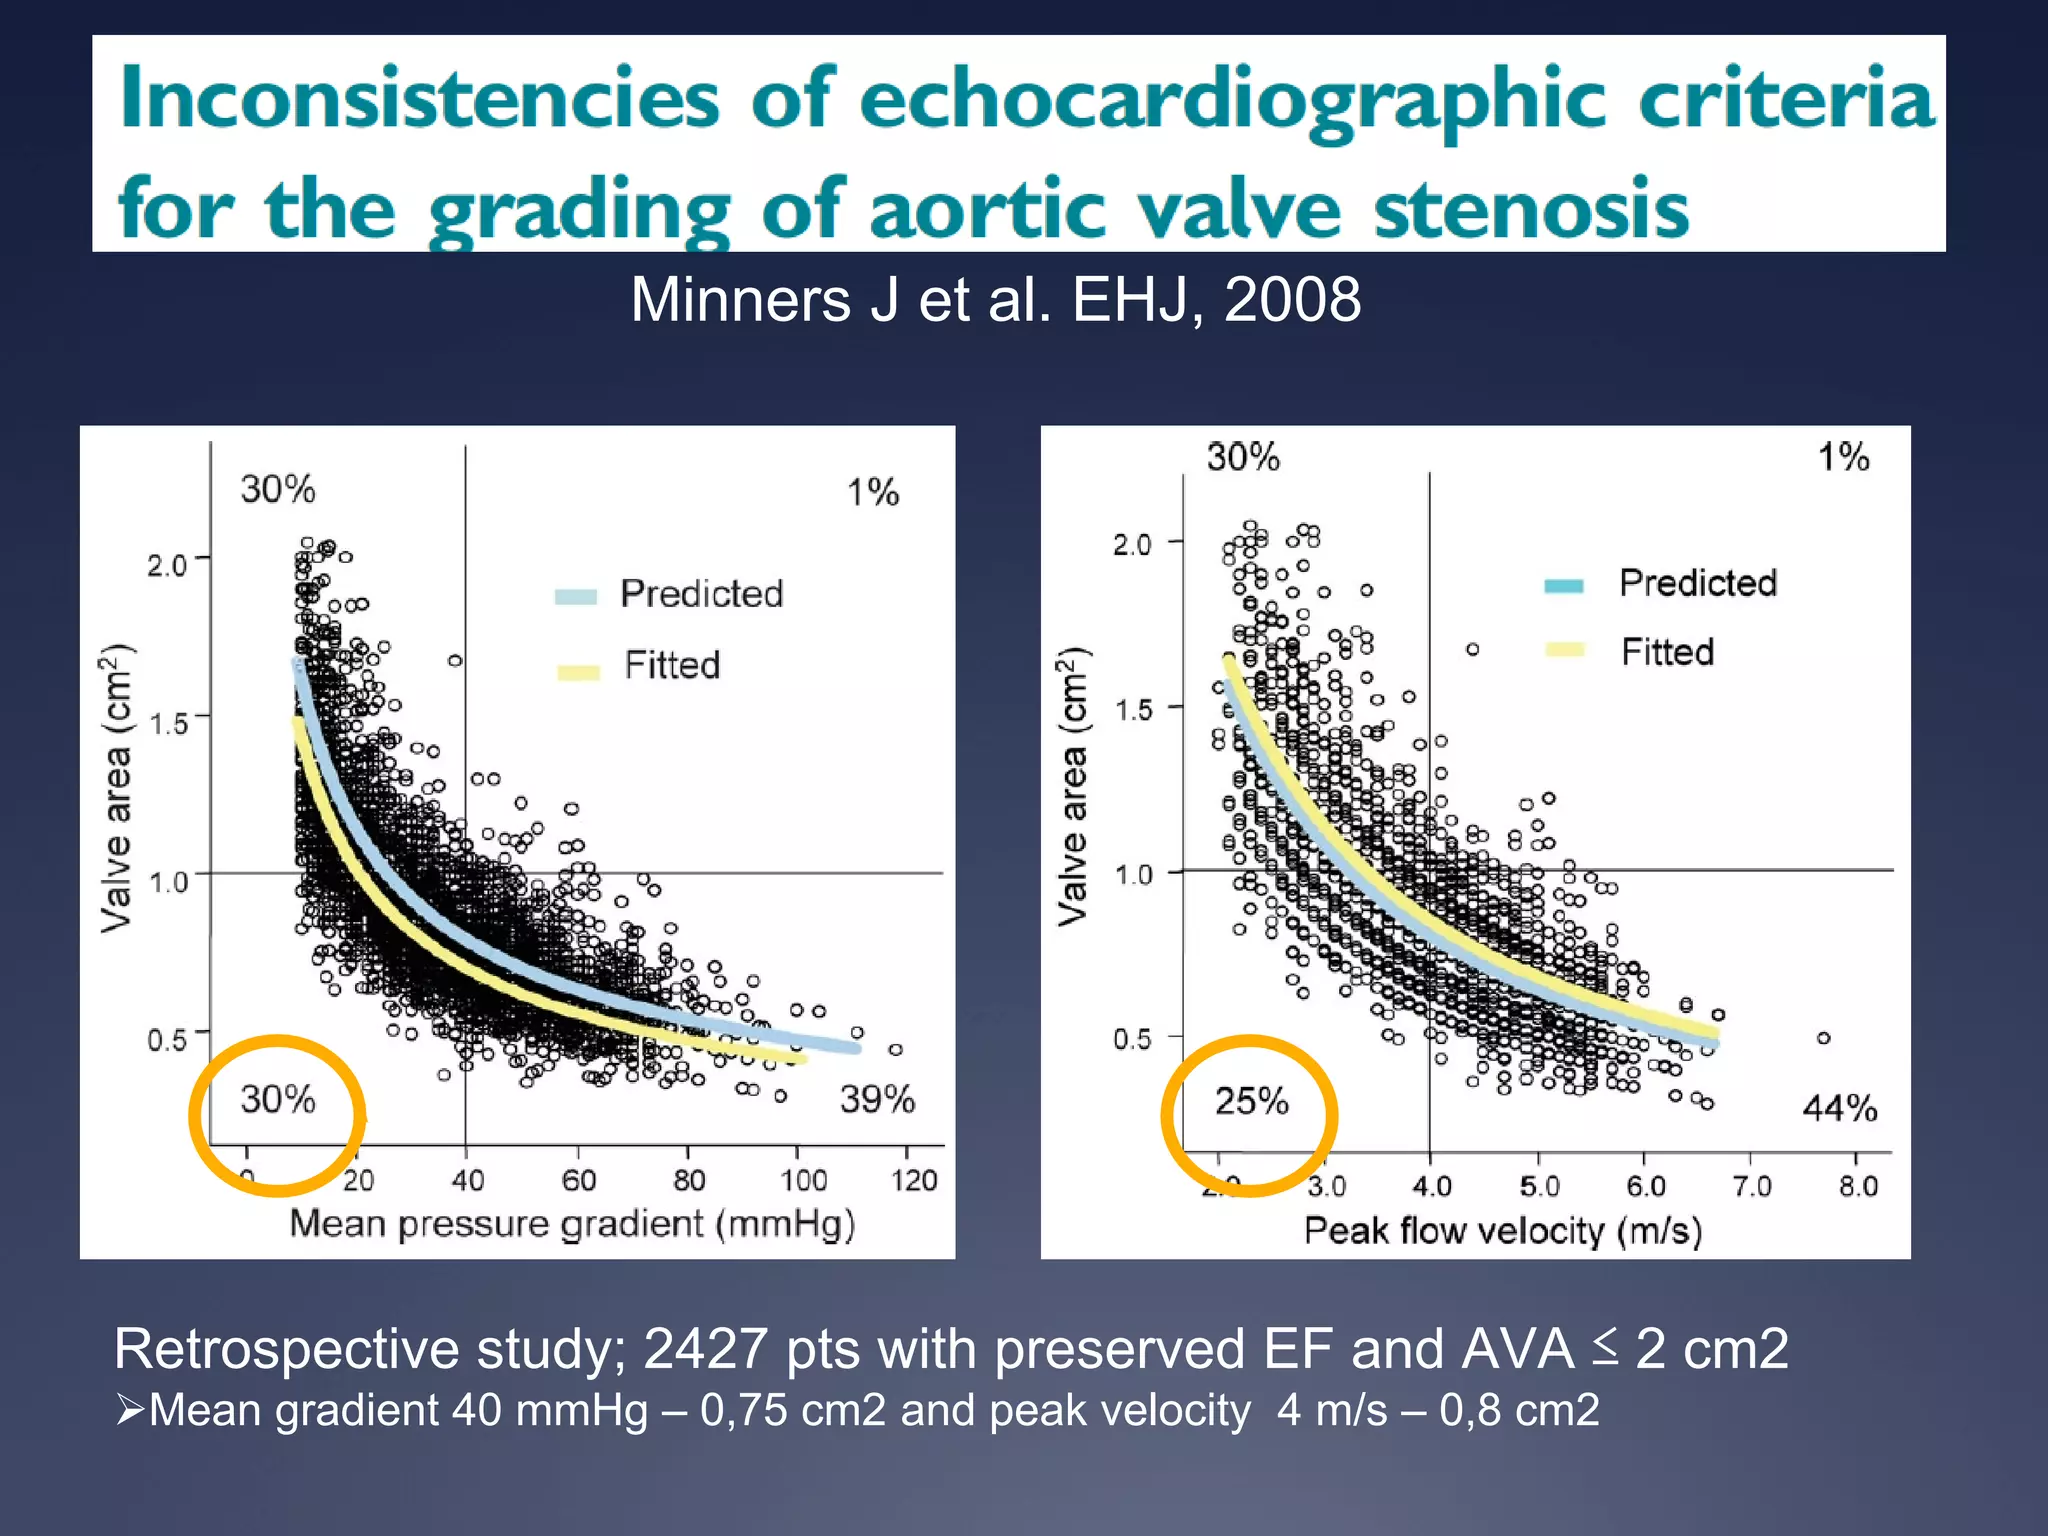
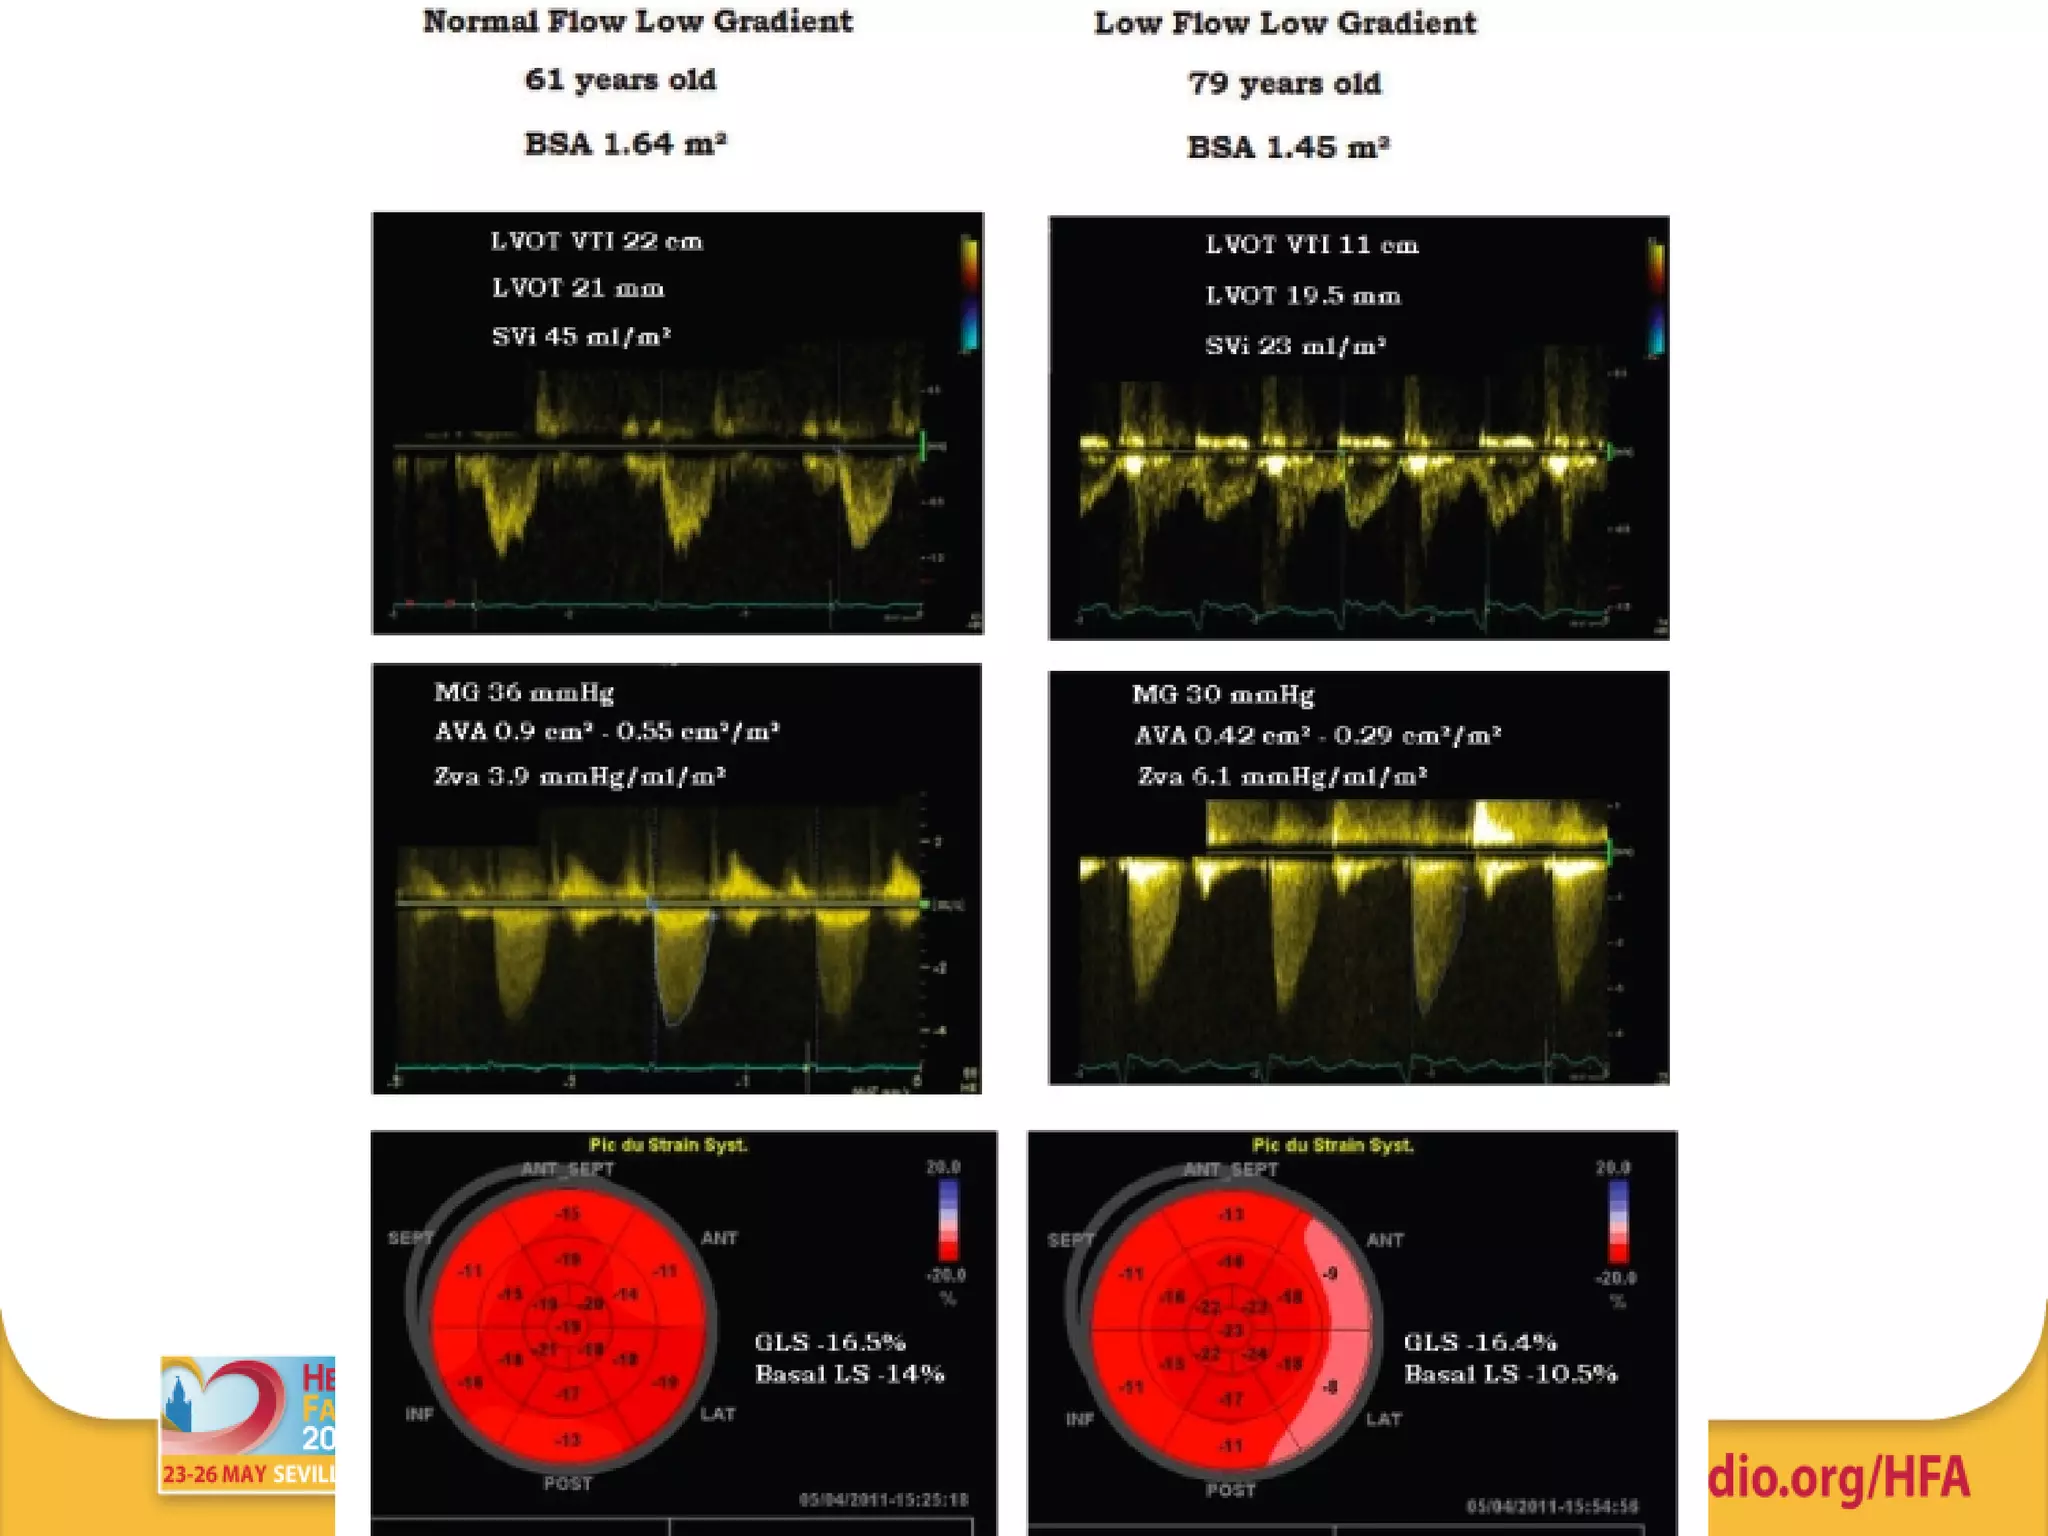
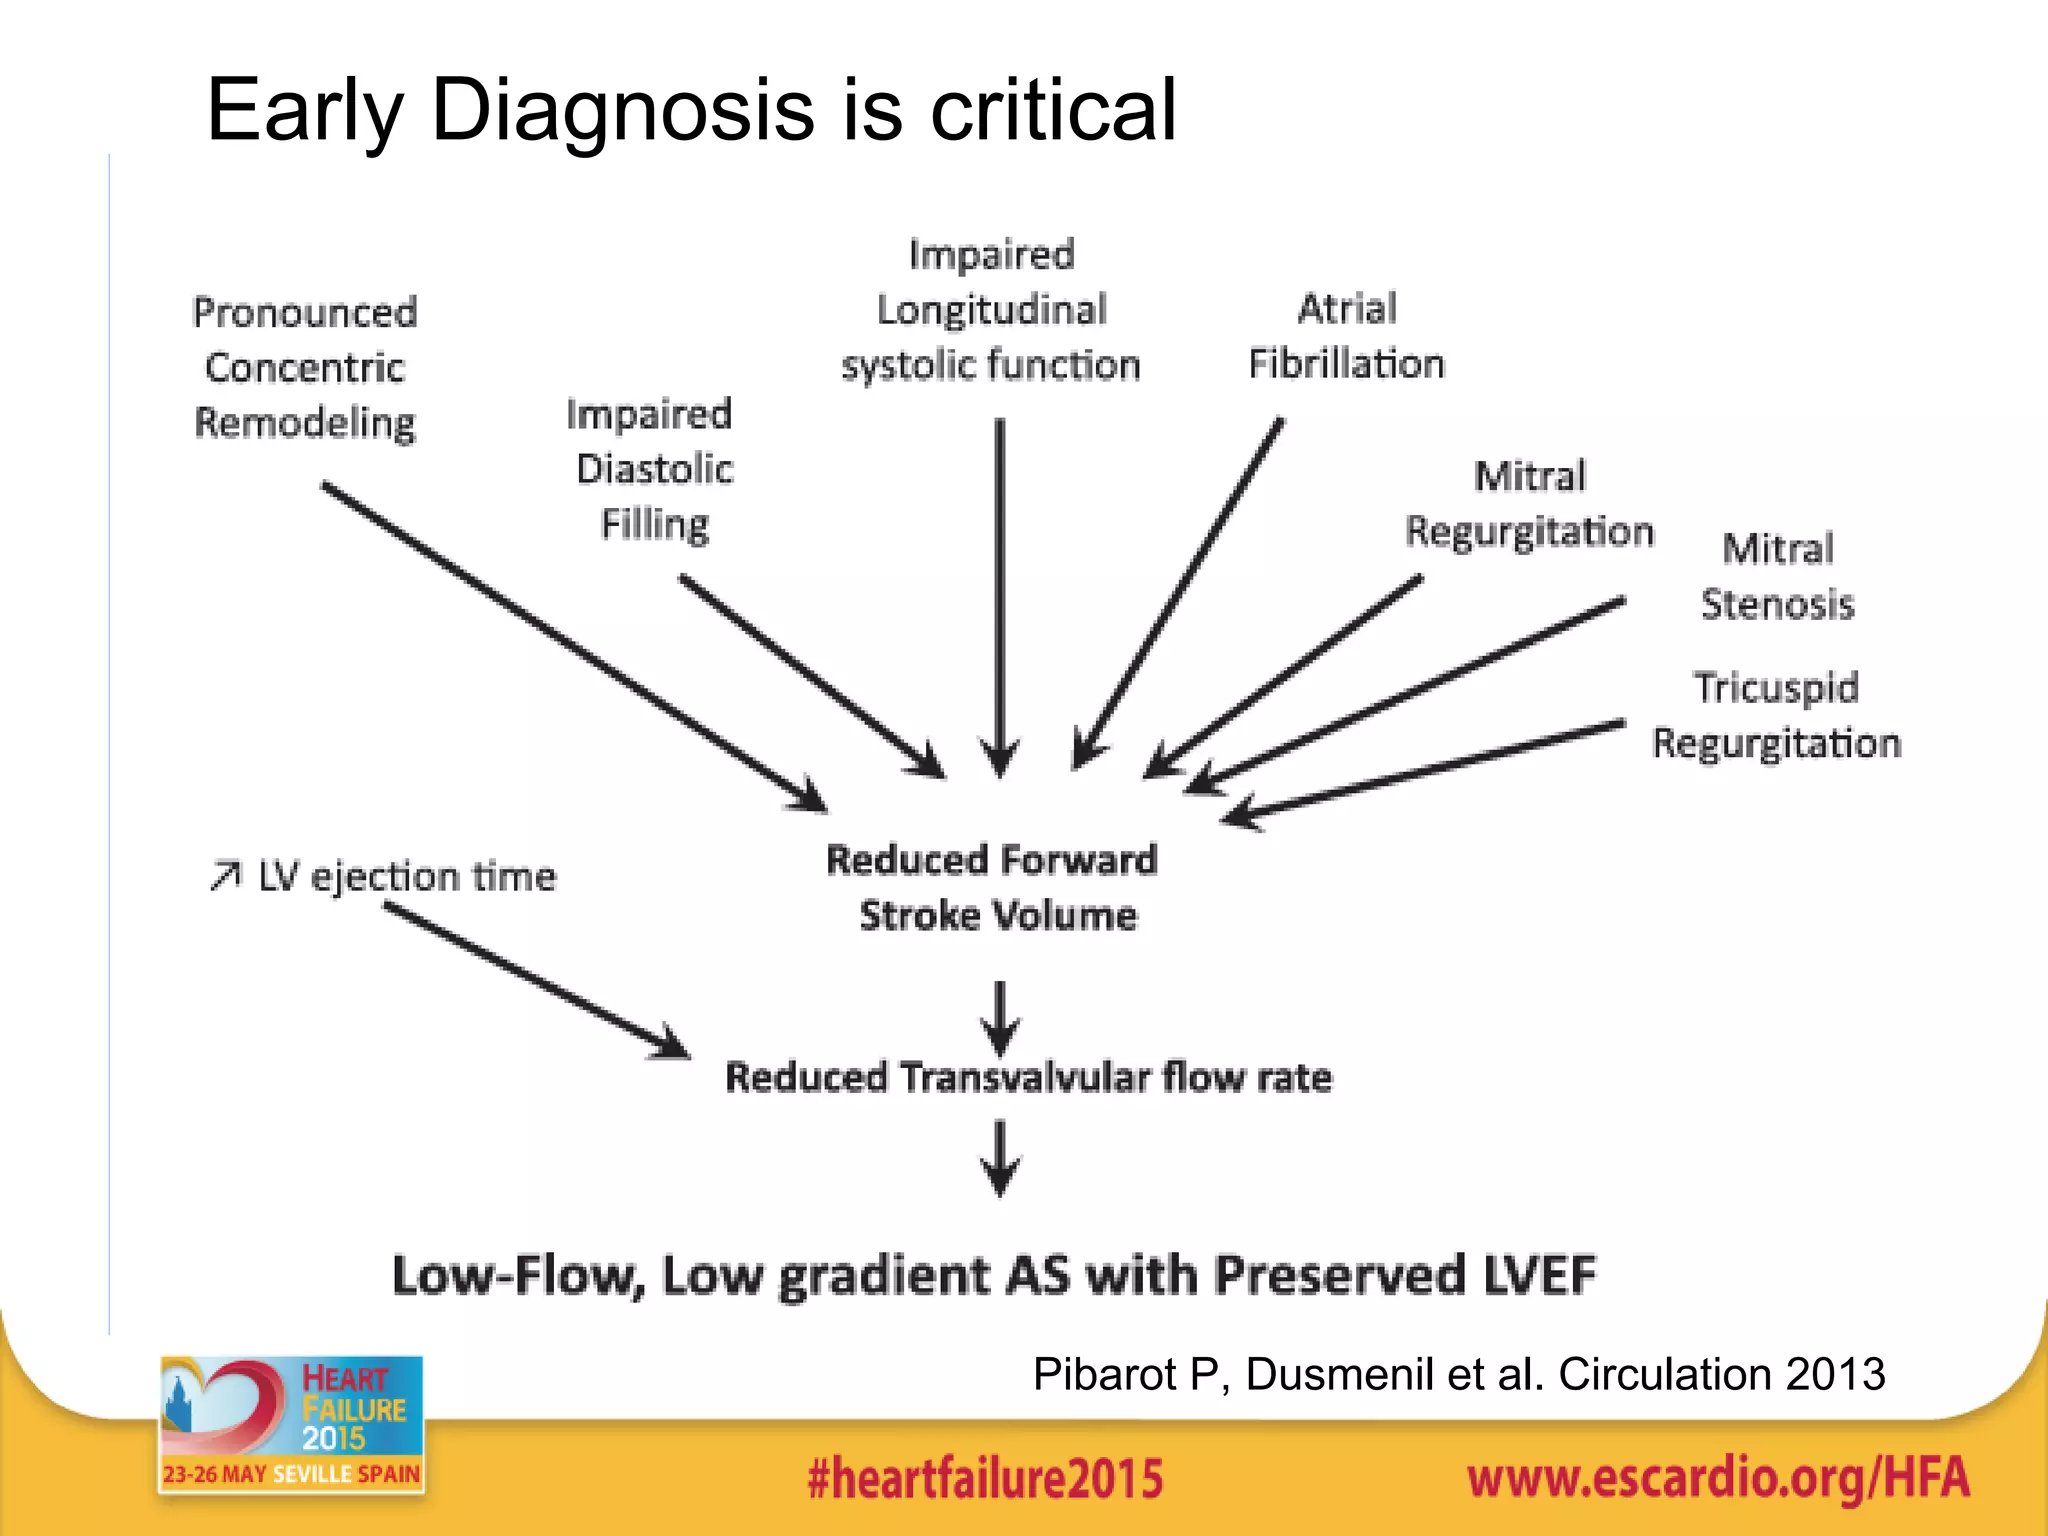
1) A significant proportion of patients with severe aortic stenosis can present with low flow and low gradient despite preserved ejection fraction, representing a more advanced stage of disease.
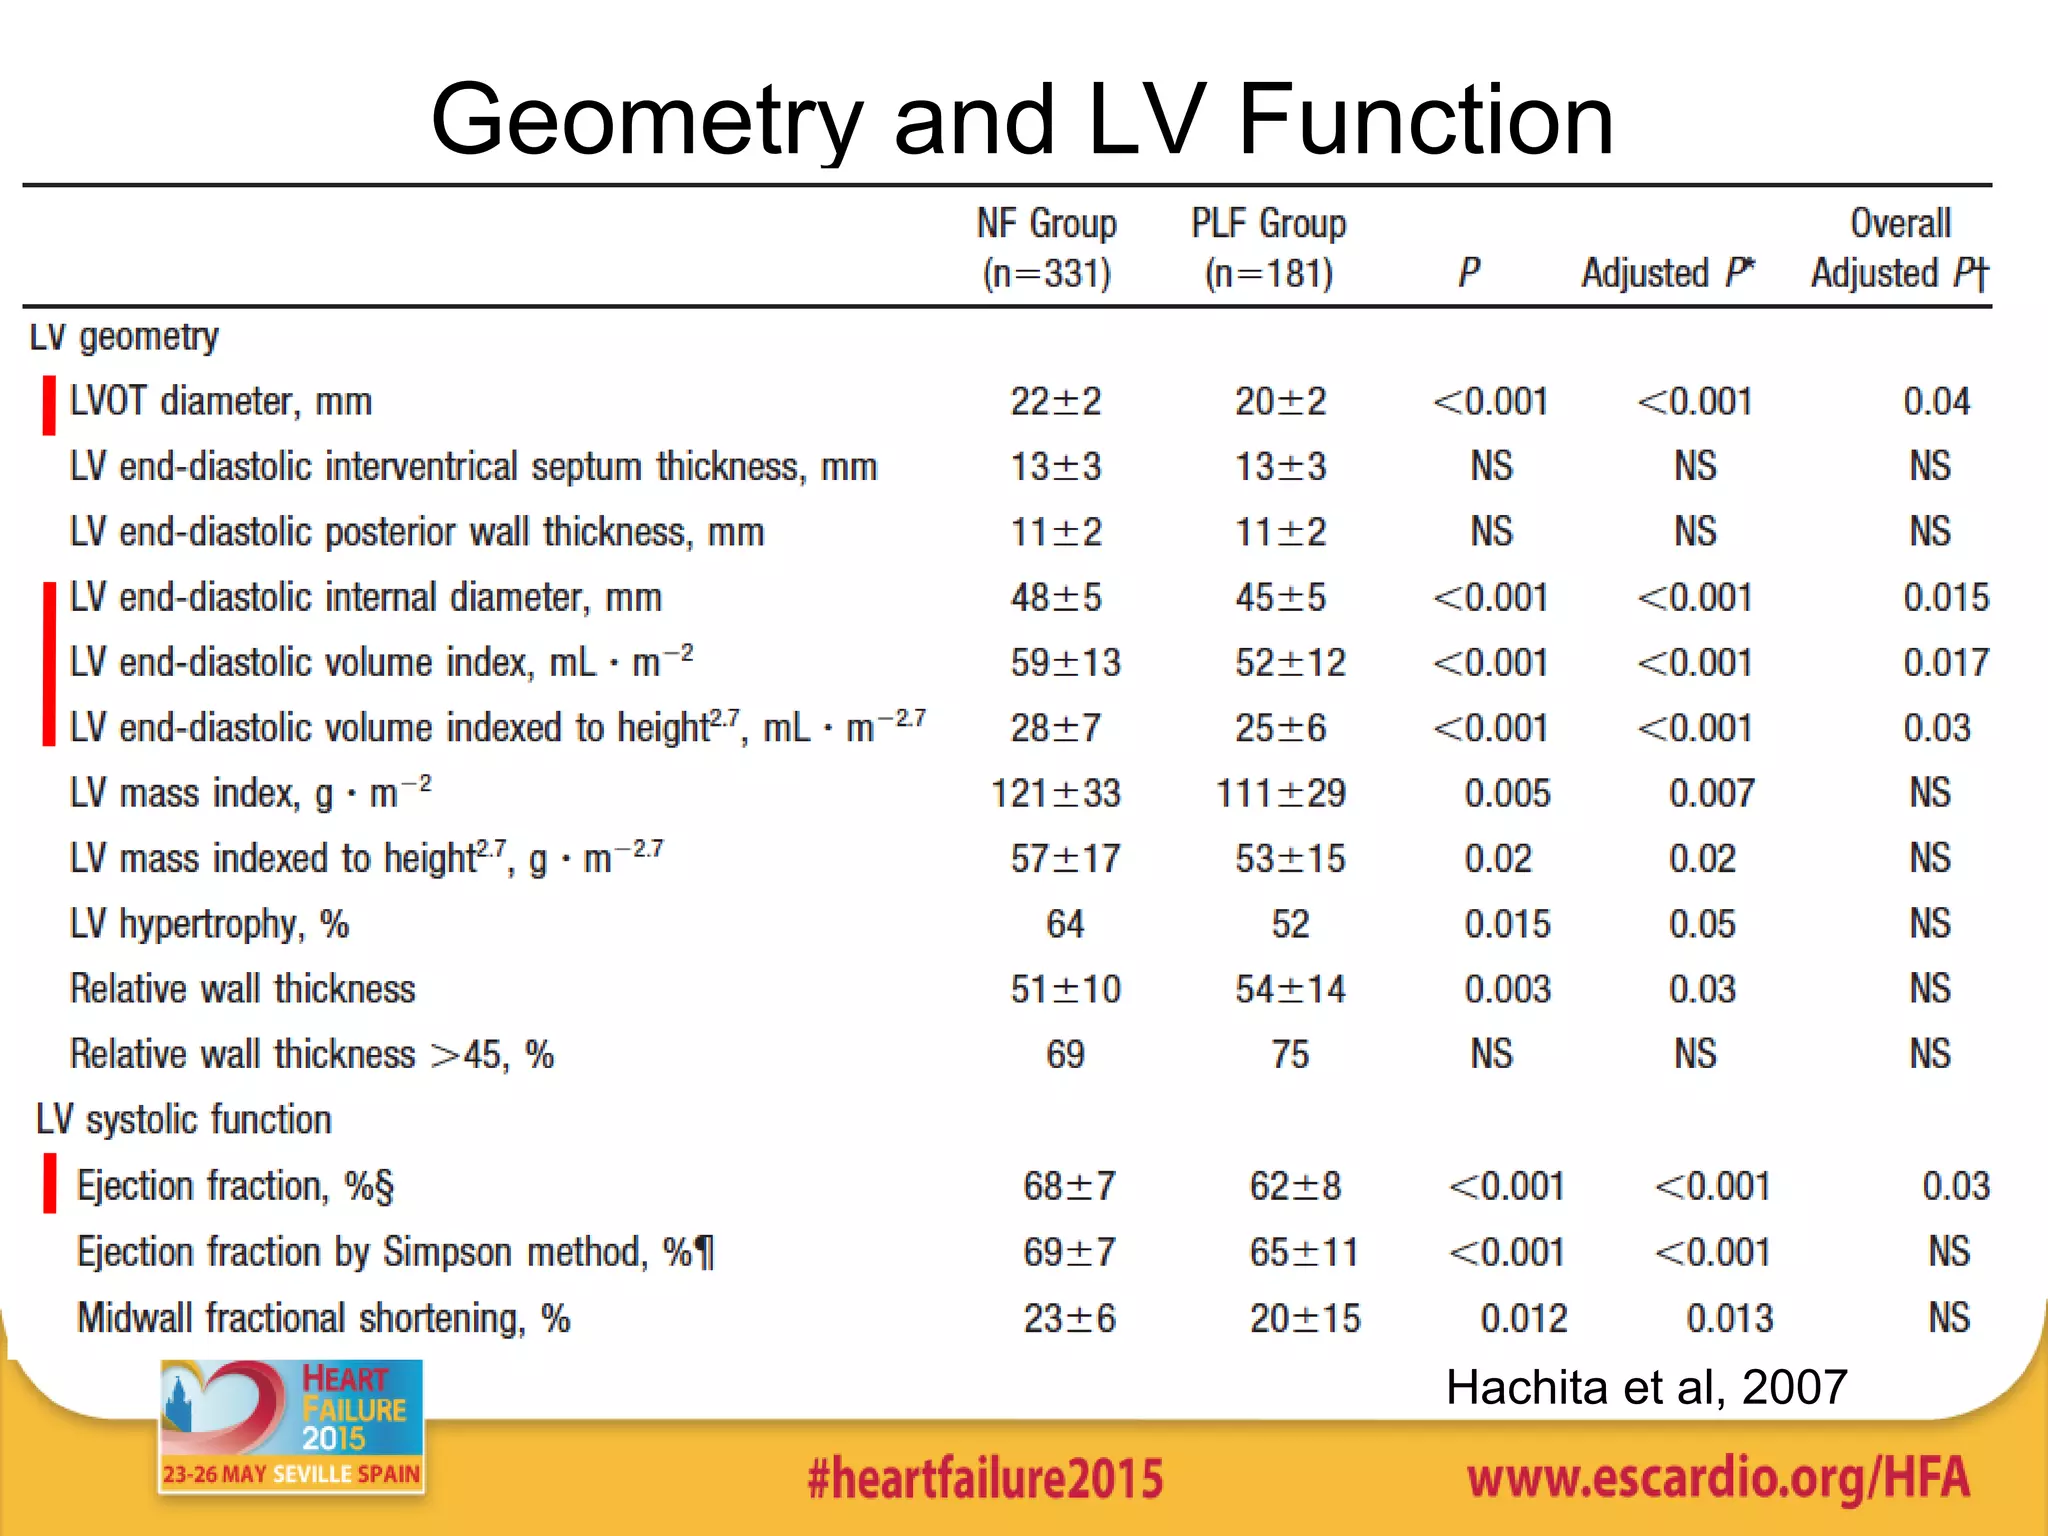
2) Multiple factors can contribute to this pattern, including increased afterload, concentric left ventricular hypertrophy, and diastolic dysfunction.
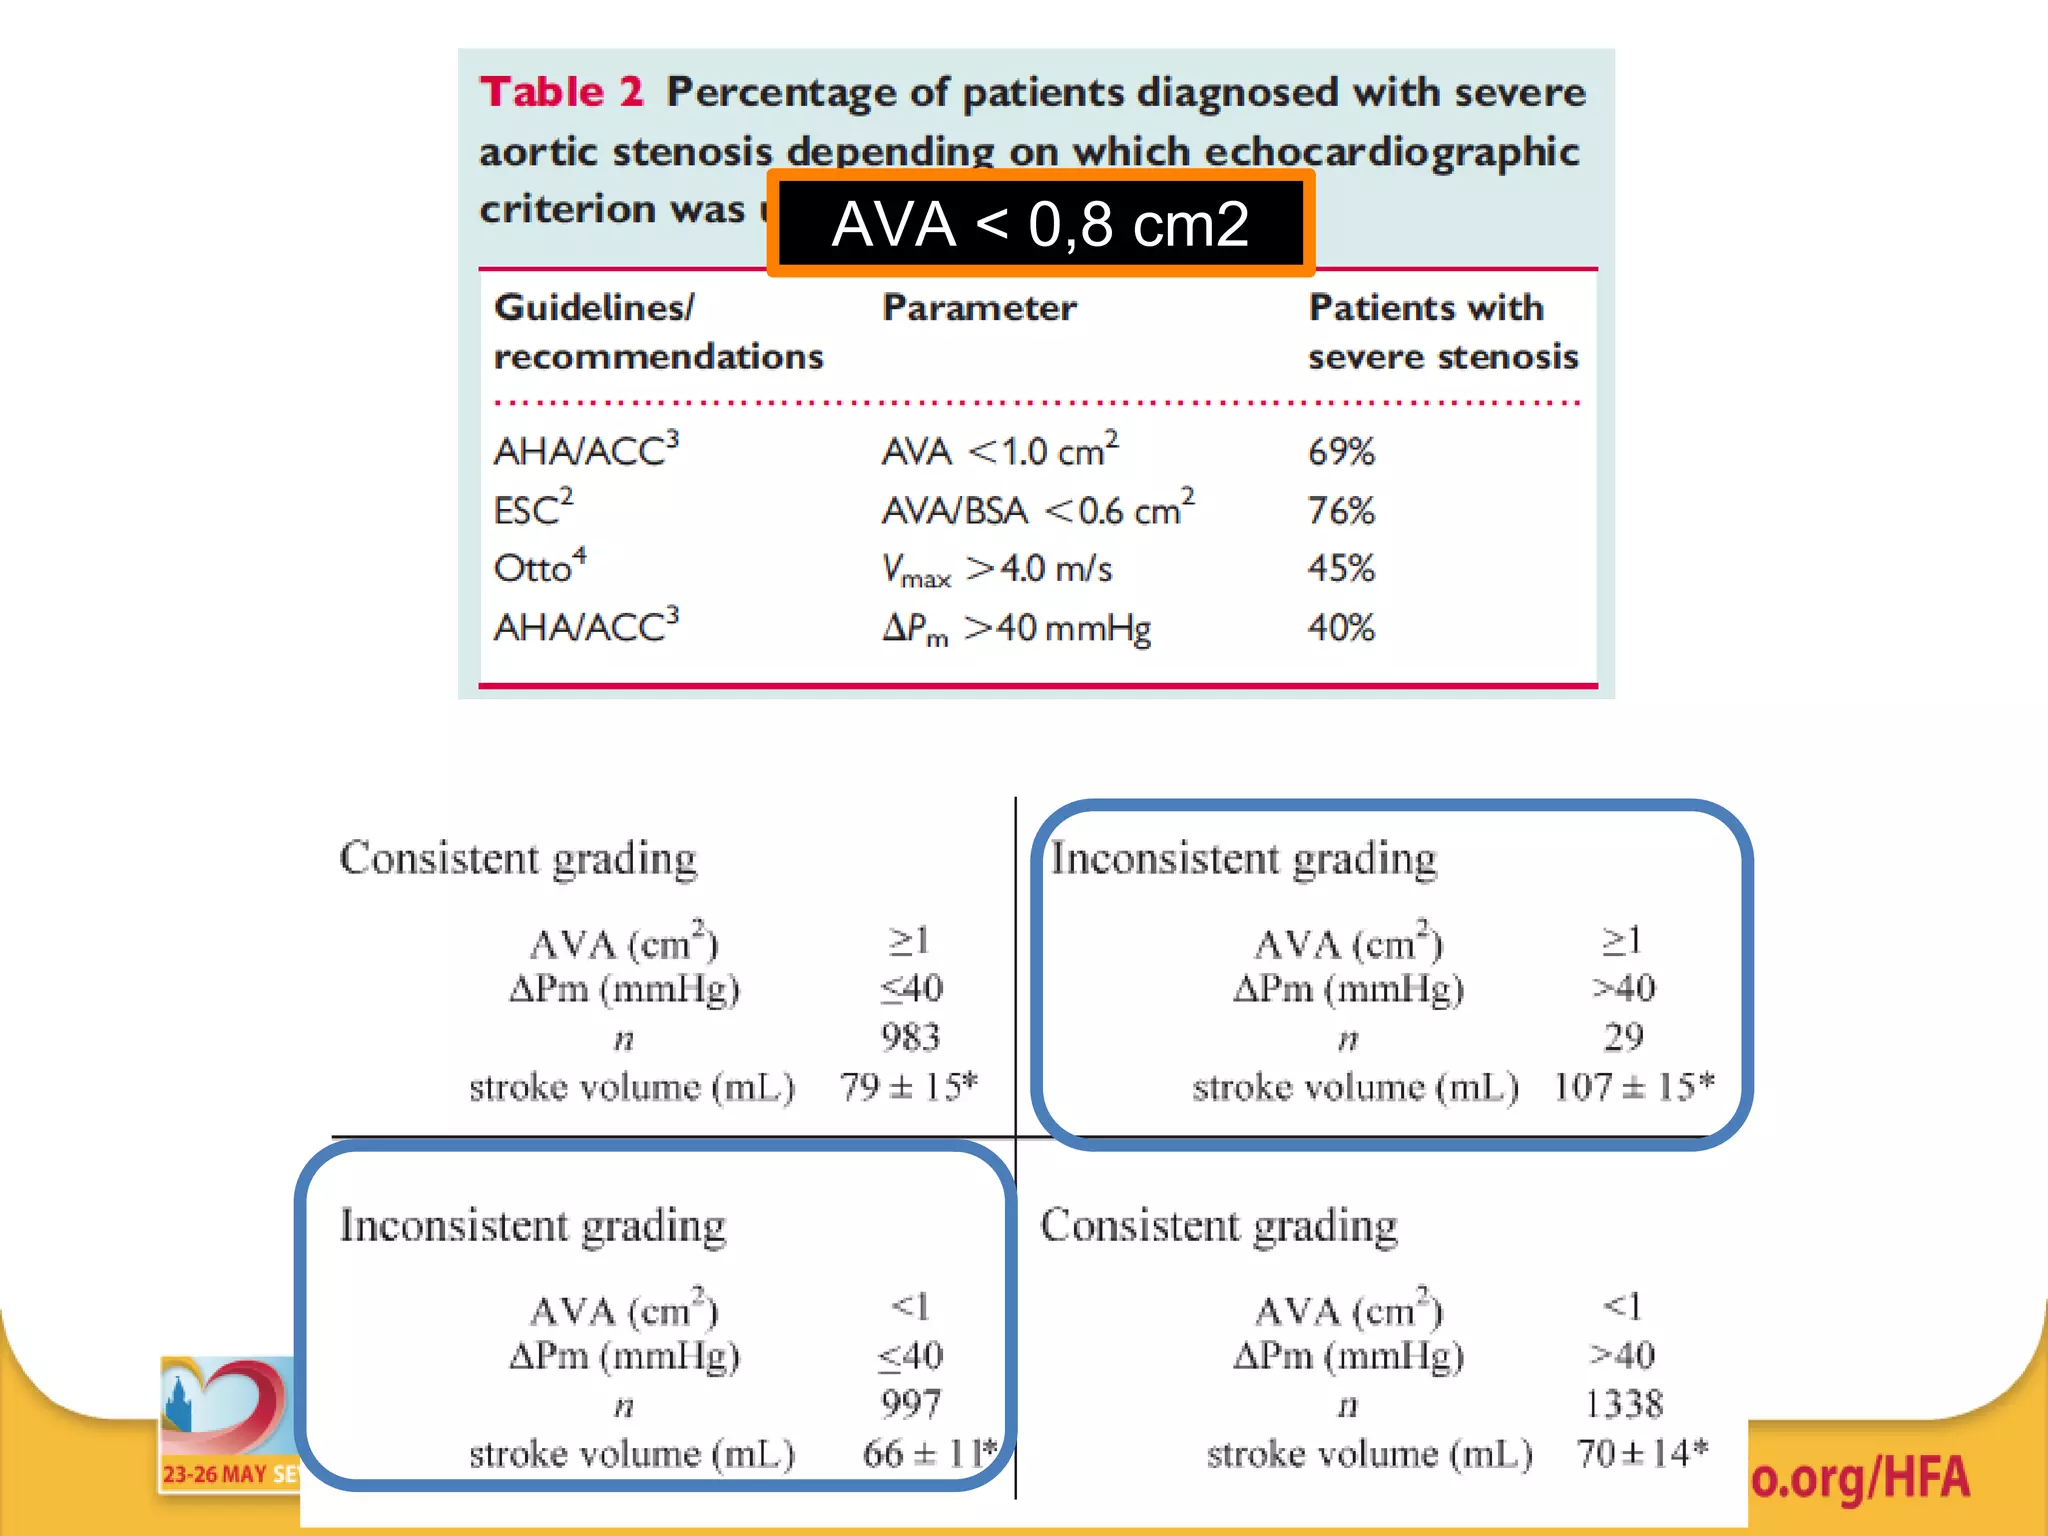
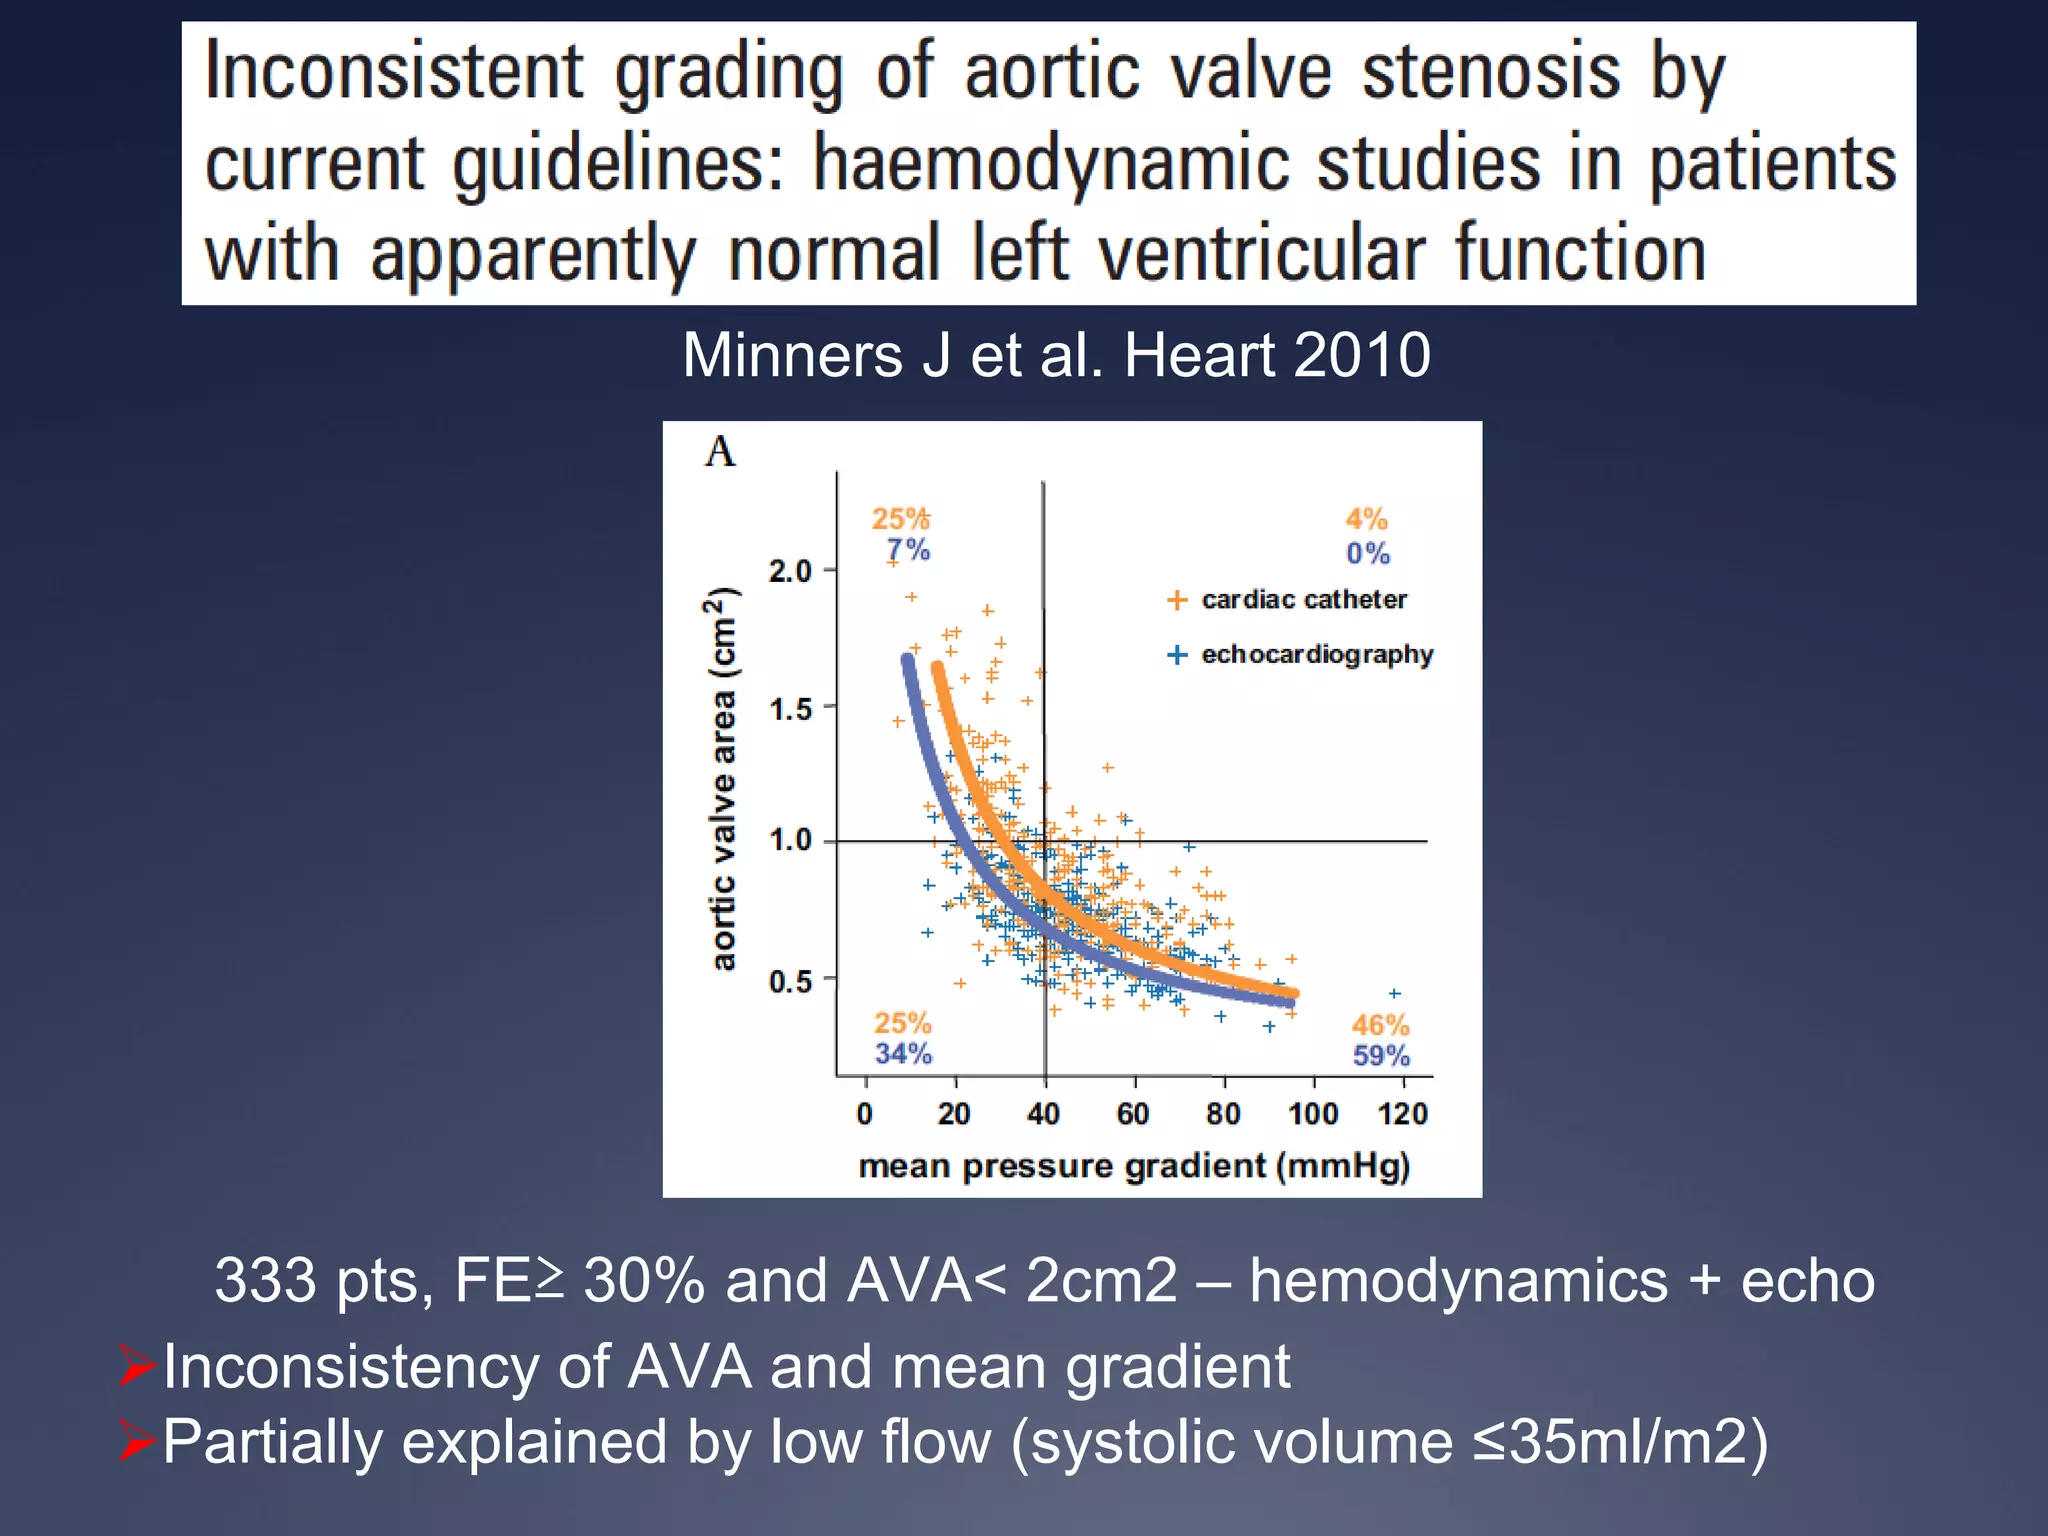
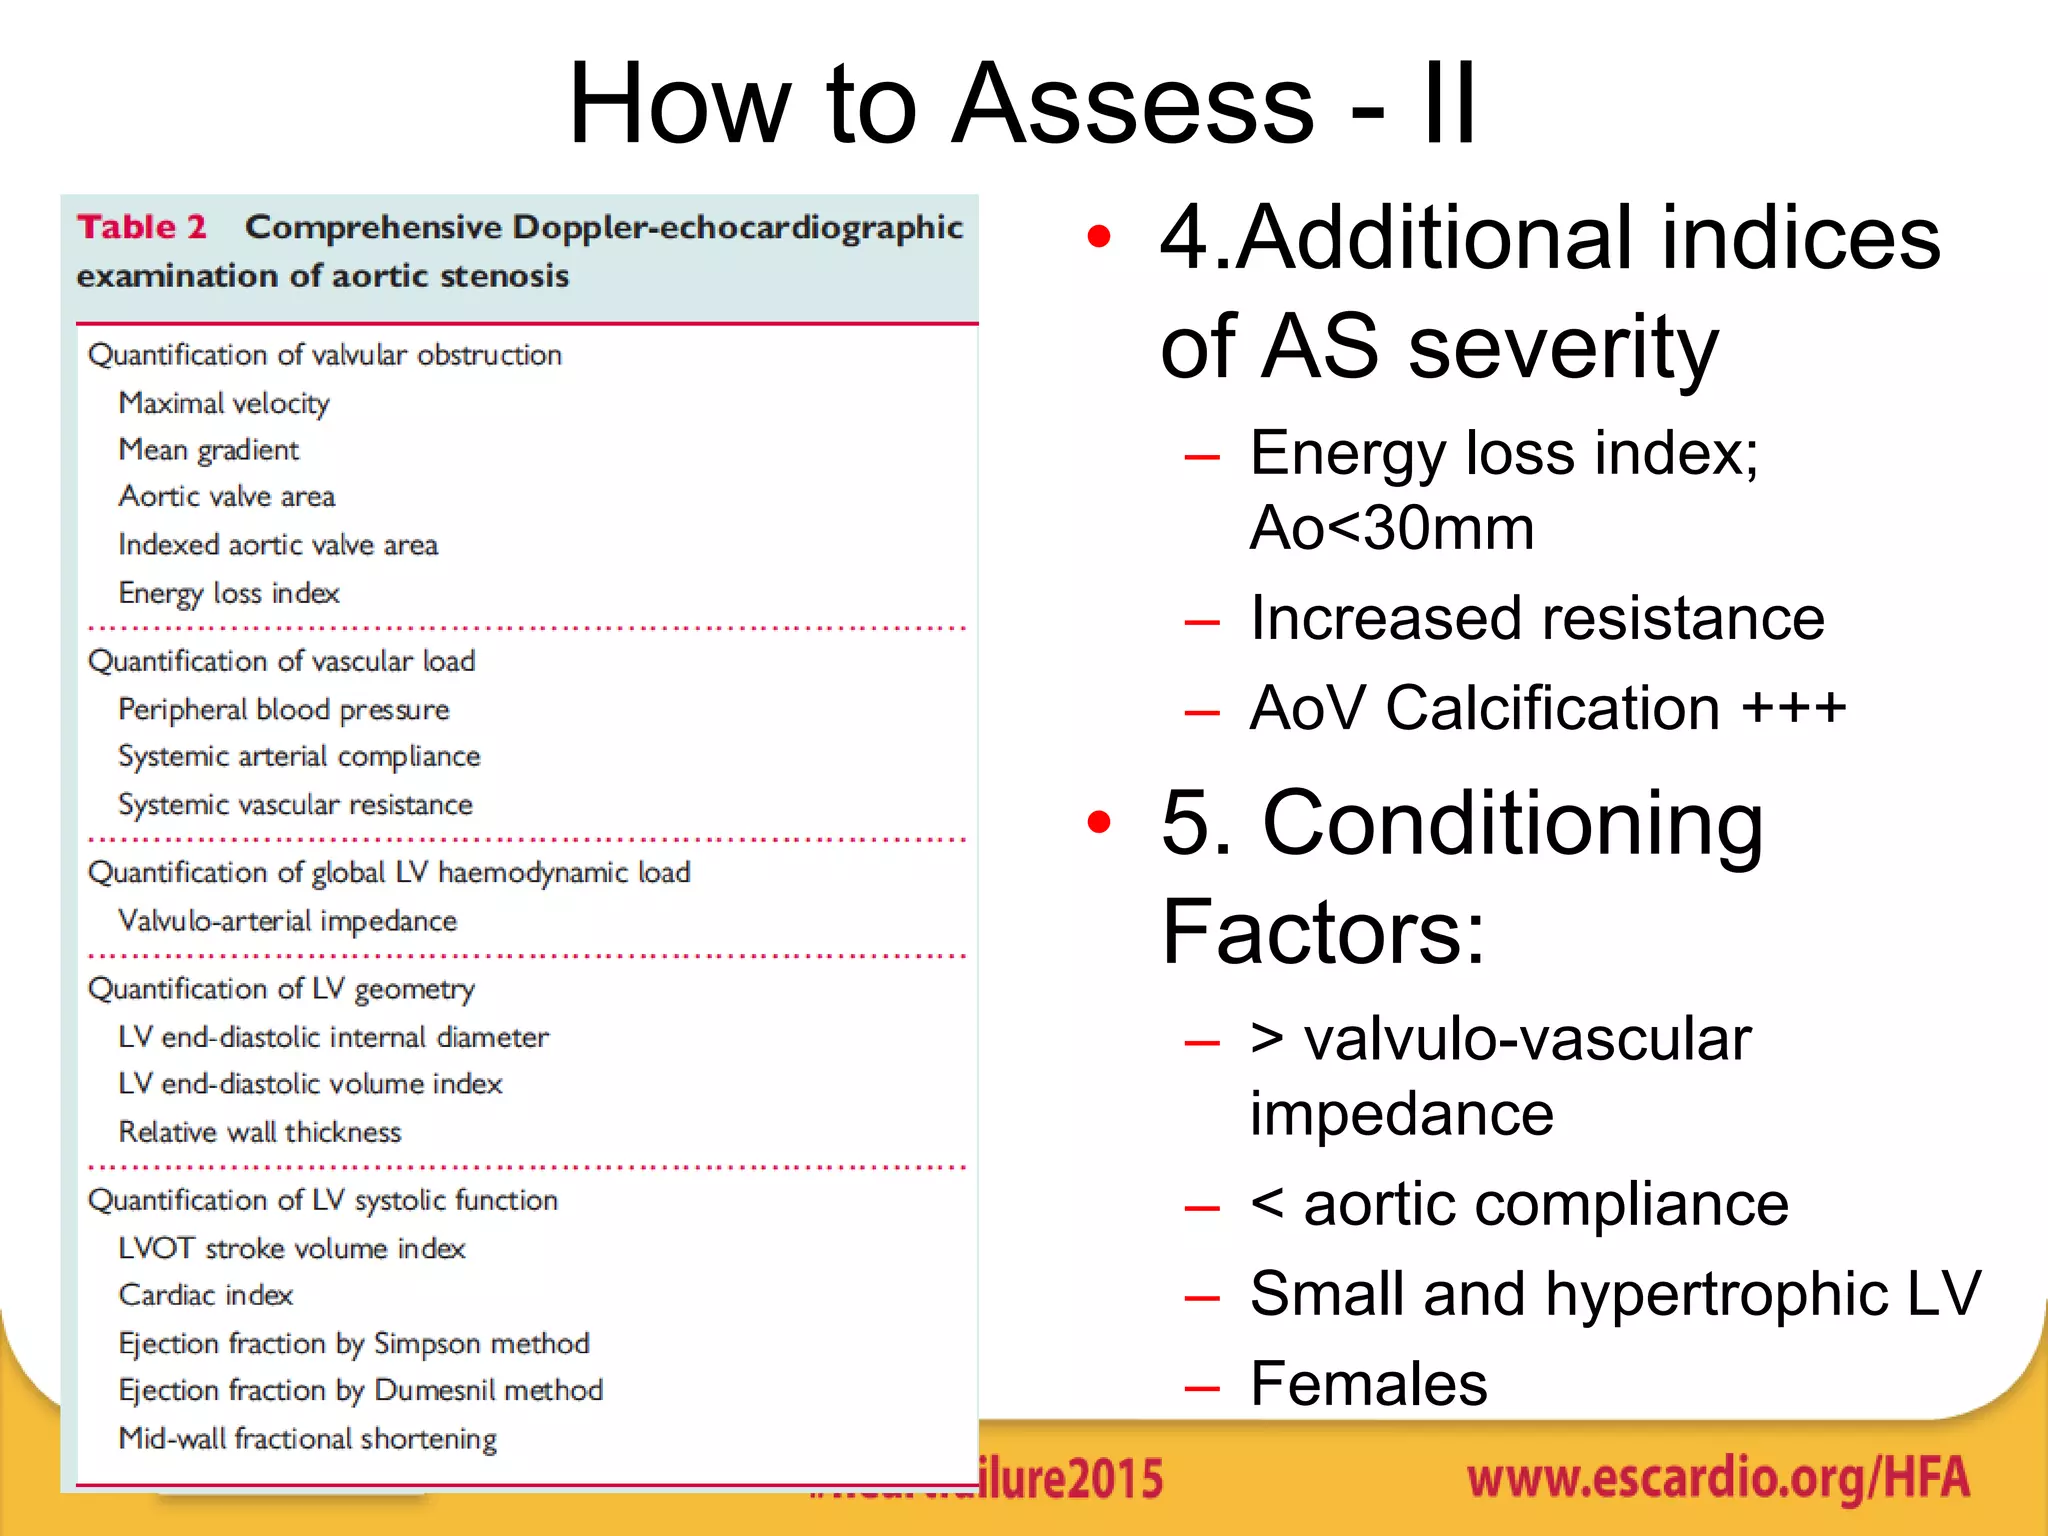
3) Identifying these "low-flow, low-gradient" patients is challenging but important, as standard echocardiography criteria may underestimate severity; imaging modalities like cardiac MRI and CT can provide more accurate assessment of left ventricular outflow tract dimensions and function.